assessment of the microtox bioassay as a preditor for anaerobic bacterial toxicity ·...
TRANSCRIPT
ASSESSMENT OF THE MICROTOX BIOASSAY AS A PREDICTOR
FOR ANAEROBIC BACTERIAL TOXICITY
A Thesis Presented
by
DORIS SHEPHERD ATKINSON
Submitted to the Graduate School of the
University of Massachusetts in partial fulfillment
of the requirements for the degree of
MASTER OF SCIENCE
September 1987 ^
Department of Civil Engineering
ASSESSMENT OF THE MICROTOX BIOASSAY AS A PREDICTOR
FOR ANAEROBIC BACTERIAL TOXICITY
A Thesis Presented
by
DORIS SHEPHERD ATKINSON
Submitted to the Graduate School of the
University of Massachusetts in partial fulfillment
of the requirements for the degree of
MASTER OF SCIENCE
September 1987
Department of Civil Engineering

ASSESSMENT OF THE MICROTOX BIOASSAY AS A PREDICTOR
FOR ANAEROBIC BACTERIAL TOXICITY
A Thesis by:
Doris Shepherd Atkinson
Department of Civil Engineering
University of Massachusetts
Amherst, Massachusetts
September 1987
Approved as to style and content
Professor Michael S. SwitzenbaumThesis Committee Chairman
Professor James K. EdzwaldThesis Committee Member
Assistant Professor David A. ReckhowThesis Committee Member
William H. HighterDepartment Head, Civil Engineering
11

ACKNOWLEDGEMENTS
This research has been funded by the Massachusetts Division of
Water Pollution Control (contracts no. 83-31 and 87-01). The author
would also like to thank R. Hickey, J. Robins and D. Wagner for their
technical assistance, and Dr. Michael S. Switzenbaum for his suport and
guidance.
111
ABSTRACT
This thesis addresses the following two questions: 1) can
Microtox, a rapid biological toxicity assay, be used to predict
toxicity to anaerobic methane producing bacteria, and 2) can Microtox
be used to evaluate toxicity removal by anaerobic degredation. To
answer these questions, literature and laboratory data from Microtox
testing and anaerobic toxicity testing were compiled. Microtox tests
were performed according to the manufacturer's directions, and toxicity
to methanogens was evaluated using the anaerobic toxicity assay (ATA)
developed by Owen et_ al. (1979). Additionally, data on hydrogen and
carbon monoxide accumulation in toxified anaerobic reactors were used
as indicators of anaerobic toxicity. The results showed no overall
correlation between Microtox data and ATA data. There was also no
correlation between Microtox and hydrogen and carbon monoxide
accumulations. Laboratory studies on the use of Microtox to evaluate
toxicity removal were discontinued due to high background toxicities.
Microtox therefore does not appear to be useful as a predictor of
anaerobic toxicity nor would it be useful as a tool to evaluate
toxicity removal by anaerobic treatment.
IV

TABLE OF CONTENTS
Page
ACKNOWLEDGEMENTS iii
ABSTRACT iv
TABLE OF CONTENTS v
LIST OF TABLES vii
LIST OF FIGURES viii
CHAPTER
1 INTRODUCTION 1
2 BACKGROUND 6
2.1 Anaerobic Toxicity Testing 6
2.2 Hydrogen and Carbon Monoxide Monitoring 8
2.3 Microtox Testing 9
2.4 Complex Effluents 11
2.5 Toxicity Removal 11
3 EXPERIMENTAL METHODS 13
3.1 Overview 13
3.2 Literature Review 13
3.3 Pure Chemical Toxicity 14
3.3.1 Anaerobic Toxicity Assays 14
3.3.2 Microtox Bioassays 22
3.4 Complex Effluent Toxicity 23
3.5 Hydrogen and Carbon Monoxide Data 25
3.6 Toxicity Reduction 26
4 RESULTS • 27
4.1 Literature Review 27
4.2 Pure Chemical Laboratory Results 31
4.2.1 Anaerobic Toxicity Assays 31
4.2.2 Microtox Bioassays 41
4.2.3 Combined Results 45
4.3 Complex Effluents 45
4.4 Hydrogen and Carbon Monoxide Data 52
4.5 Toxicity Reduction 55
4.6 Summary of Results 55
5 ' DISCUSSION 59
5.1 Evaluation of Microtox as a Surrogate for ATA's 59
5.2 Complex Waste 67
5.3 Hydrogen and Carbon Monoxide Data 67
5.4 Toxicity Reduction 68
6 CONCLUSIONS 69
BIBLIOGRAPHY 70
VI

LIST OF TABLES
Page
3-1 Stock Solutions for ATA Medium 17
3-2 ATA Medium Preparation 18
4-1 Relative Toxicity - Literature Survey 28
4-2 Literature Toxicity Values 30
4-3 Reproducibility of ATA Results 37
4-4 Comparison of 20 and 8 Day HRT Medium-Fed Seed 39
4-5 Summary of ATA Results 40
4-6 Reproducibility of Microtox Results 43
4-7 Summary of Microtox Results 44
4-8 Combined Data 46
4-9 Comparison of 5 Minute and 30 Minute Microtox Values 48
4-10 Summary of Complex Effluent Results 53
4-11 Comparison of Medium-Fed and Sludge-Fed Seed 54
4-12 Comparison of Microtox with Hydrogen and Carbon
Monoxide Data 56
4-13 Background Microtox Toxicity 57
5-1 Statistical Summary 65
LIST OF FIGURES
Page
3-1 Anaerobic Transfer Set-Up A 19
3-2 Anaerobic Transfer Set-Up B 20
4-1 Microtox 5EC50 vs. Methane Inhibition - Literature Data 29
4-2 Cumulative Methane Production for Non-Toxified Controls
(Media-Fed Seed) 32
4-3 Comparison of Methane and Total Gas Production
(Non-Toxified Controls) 33
4-4 Chloroform ATA - Methane Production 34
4-5 Chloroform ATA - Total Gas Production 35
4-6 Replicate Controls - Methane Production 38
4-7 Microtox Bioassay - Phenol 42
4-8 Microtox 5EC50 vs. Methane Inhibition - Combined Data 47
4-9 Stirred and Non-Stirred Controls (Sludge-Fed Controls) 50
4-10 Mercuric Chloride ATA - Sludge-Fed Seed 51
5-1 Microtox 5EC50 vs. Methane Inhibition - Organics 61
5-2 Microtox 5EC50 vs. Methane Inhibition - Inorganics 62
5-3 Microtox 5EC50 vs. Methane Inhibition - Priority Pollutants 63
5-4 Microtox 5EC50 vs. Methane Inhibition - Priority Organics 64
Vlll
CHAPTER 1 - INTRODUCTION
Recently anaerobic treatment processes have been receiving
increased attention owing to their advantages over aerobic biological
treatment processes. These advantages include the production of
smaller amounts of waste sludge and the production of methane gas as a
useful by-product.
Anaerobic treatment processes convert complex organic material to
carbon dioxide and methane in the absence of molecular oxygen. This
process occurs through a series of biologically mediated steps, each
involving different groups of microorganisms. The fundemental
microbiological relationships have been investigated and reviewed by a
number of authors (McCarty, 1964; Balch, 1979; Taylor, 1982). In the
first step, polysaccarides are broken down to short chain fatty acids,
acetate, carbon dioxide and hydrogen by fermentative bacteria. Another
group of organisms, the acetogenic bacteria, break down fatty acids to
acetate, carbon dioxide and hydrogen. The methanogenic bacteria then
convert hydrogen and carbon dioxide to methane and also convert acetate
to methane and carbon dioxide. The methanogens are generally slow
growing organisms and represent the rate limiting step in anaerobic
digestion.
There are a number of different process configurations used in
anaerobic treatment, and these have been reviewed in the literature
(Speece, 1983; Switzenbum, 1983). Some of the types include:
completely mixed systems, packed bed reactors, anaerobic filters,
upflow anaerobic sludge blankets, and expanded or fluidized bed
reactors. Recent developments in process technology have focused on
techniques which minimize hydraulic retention times while maximizing
solids retention times. This serves to provide the residence time
necessary for the slow growing methanogens while reducing reactor
volume.
One concern about the use of anaerobic treatment methods is the
reliability of processes for wastes which may contain substances toxic
to the methanogenic microorganisms. Another concern is the possible
adverse or synergistic effects toxicants may have in combination with
other toxicants. Anaerobic reactors which receive wastes containing
more than one toxicant may experience upset conditions when each
toxicant by itself may not cause significant toxicity.
Another interest in anaerobic treatment is as a biological
treatment alternative for the purpose of toxicity removal. While
anaerobic treatment processes are often thought of as a means to reduce
levels of organic material, they also offer the opprtunity for
biodegradation of toxic compounds, and there is a growing body of
literature on toxicity reduction through anaerobic treatment (Healy and
Young, 1979; Bouwer and McCarty, 1983; Boyd .et al.,1983; Speece, 1983).
In response to the concern over the toxic effects of wastes on
anaerobic treatment processes, bioassay methods for measuring toxicity

have been developed. The anaerobic toxicty assay (ATA) was initially
developed by Owen _et_ al_. (1979) and is based on techniques developed by
Hungate (1969) which were modified by Miller and Wolin (1974). It is
currently one of the more widely used methods of determining anaerobic
toxicity. The ATA is a batch method which measures the adverse effect
of a substance or mixture on the rate of methane production from an
easily degraded methanogenic substrate. While this method is simple and
relatively inexpensive, it is time consuming, requiring up to two weeks
before results are available.
Another important development in the monitoring of toxic
conditions in anaerobic treatment processes has been the measurement
of key intermediate gases. Hydrogen and carbon monoxide may accumulate
in toxified reactors, and monitoring of these gases has been proposed
as a basis for an early warning system for anaerobic digester upsets
(Hickey, 1987), While hydrogen and carbon monoxide measurement may
prove useful as a process control technique, it would be useful to have
a quick, inexpensive, screening test for wastes entering a treatment
unit to determine likely toxicity before upset occurs.
The Microtox toxicity analyzer, developed by Beckman Instruments
and currently marketed by Microbics Corporation of Carlsbad, CA.,
provides a means for rapid, inexpensive assessment of toxicity of
aqueous samples. The Microtox system is a relatively inexpensive test
which employs aerobic bioluminescent marine bacteria (Photobacterium
phosphoreum) and can yield reproducible results within one hour. Good
correlations between Microtox and rat, fish, daphnid, shrimp, algal,
and other-aerobic bacterial bioassays have been reported in the
literature (e.g. Dutka and Kwan, 1981; Curtis et a . ,1982; Ribo .and
Kaiser, 1983).
The primary objectives of this research were:
1) to determine whether the Microtox system could be used
as a suitable surrogate for the longer ATA test,
2) to evaluate the interactive toxic effects of several
known toxicants with a complex waste,
3) to compare Microtox response to toxicants to hydrogen
and carbon monoxide accumulations in toxified reactors,
and 4) to determine if Microtox could be used to measure
toxicity reduction by anaerobic biological treatment.
The study was conducted in five phases. In the first phase the
available literature on both anaerobic toxicity and Microtox testing
was reviewed and the reported toxcity levels for chemicals tested by
both sytems compared. In the second phase further laboratory tests
using both toxicty methods were performed. A study of the interactive
effects of toxicants and a complex waste was done in the third phase of
the project. In the fourth phase, Microtox data were compared to
hydrogen and carbon monoxide data, and in the last phase, the

feasibility of using Microtox to evaluate toxicity removal by anaerobic
treatment was investigated.
CHAPTER 2 - BACKGROUND
2.1 ANAEROBIC TOXICITY TESTING
Wastes entering an anaerobic treatment unit may contain materials
which are potentially toxic to the organisms responsible for anaerobic
degradation. There are several different classes of materials or
conditions which may cause digester upset. These include: pH, oxygen
contamination, inorganic toxicants, organic toxicants, and specific
biological inhibitors (Speece and Parkin, 1983). Some examples of
inorganic chemicals which are toxic to methane producing bacteria are:
ammonia, cyanide, sulfide, and heavy metals (Mosey and Hughes, 1975;
Yang et_ al., 1980; Parkin e_t_ aJ .,1983). Potentially toxic organics
include: chloroform, formaldehyde, various phenolics and petrochemicals
(Chou e_t_ al.. ,1978; Yang _et_ al. ,1980; Parkin et_ al.,,1983; Benjamin et
al.,1984). Specific biological inhibitors such as methane analogues
and agricultural antibiotics may also cause toxic effects in anaerobic
reactors (Thiel, 1969; Sykes and Kirsh, 1972; Varrel and Hashimoto,
1982; Jarrel and Hamilton, 1985). While there have been some attempts
to produce predictive models for anaerobic toxicity (Parkin and Speece,
1982), direct laboratory testing is still required to determine the
toxic effects of any given waste.
Over the last twenty or so years a number of different approaches
to anaerobic toxicity testing have been used. Tests may be conducted
under batch or continuous flow conditions. The organisms may be in
suspended culture or attached. The culture used may be a mixed cuture
from a reactor, may be a washed cell suspension prepared from reactor
contents, or may be a pure culture isolated in the laboratory. Tests
may be conducted with non-acclimated organisms or organisms which have
had some previous exposure to the toxicant being evaluated and a
variety of different substrates may be used as the food source. These
test parameters as well as other important factors such as solids
retention time, temperature, pH, osmolarity, the presence or absence of
antagonistic or synergistic substances will all bear on the test
results.
The anaerobic toxicity assay (ATA) is a batch test, which uses
suspended, mixed methanogenic cultures obtained from reseach reactors
(Owen et_ al_., 1979). The organisms are fed acetate and propionate as an
easily degraded methanogenic substrate. The toxic substance to be
tested may be either a pure substance or a complex mixture. While the
test was designed to be used with non-acclimated organisms, it can be
adapted to acclimation studies. The test is usually run under
quiescent conditions, but continuous stirring may be used by adding
magnetic stirrer bars to individual serum bottles. The pH of the test
environment is held at or near 7.2 by means of a bicarbonate buffer.
The incubation temperature is 35 C. The parameter measured in the
ATA test is either the rate of total gas production or the rate of
methane production. The volume of gas produced is measured using a
lubricated glass syringe. The suggested means of reporting data is to
present the maximum rate ratio (MRR) which is the maximum rate of gas
production of the toxified sample normalized to that of a non-toxified
control.
The ATA is a simple, inexpensive test, which has advantages over
more complicated continuous toxicity tests. The ATA test is a
practical test which has been used sucessfully by a number of
investigators to test a variety of substances such as pulp mill wastes
(Benjamin et al., 1984), various priority organic pollutants (Johnson
and Young, 1983), and industrial toxicants (Parkin et al.,1983).
However, it is a time consuming test (requiring up to two weeks before
test results are available) and is therefore not as practical for
applications such as influent monitoring.
2.2 HYDROGEN AND CARBON MONOXIDE MONITORING
There are three key steps in the degradation of complex organic
wastes to methane and carbon dioxide. In the first step, fermentative
bacteria break down polysaccarides to short chain fatty acids, carbon
dioxide and hydrogen. In the second step the fatty acids are further
broken down to acetate, carbon dioxide and hydrogen. Methanogenic
bacteria carry out the third step, which is to covert both acetate and
carbon dioxide and hydrogen to methane (McCarty, 1964 ; Balch et
al.,1979). In a well operating system, hydrogen should not accumulate,
but should be used to produce methane as rapidly as it is formed. Its
accumulation in a reactor is an indication of upset conditions (Hickey,
1987). Carbon monoxide has also been found to accumulate under certain
types of upset conditions, especially those caused by the presence of
toxicants (Hickey, 1987). Measurement of these gases can be used as an
early warning of reactor upset conditons.
2.3 MICROTOX TESTING
The Microtox test was originally developed by Beckman Instruments,
but is now marketed by Microbics Corporation of Carlsbad, California.
The Microtox test is a quick, relatively inexpensive bioassay which
uses the aerobic, bioluminescent marine bacterium Photobacterium
phosphoreum. The light emitting biochemical pathway used by the
Microtox organism is known to be an electron transport pathway,
providing the organism with an alternative to cytochrome electron
transport. This pathway is thought to provide the organism with an
adaptive advantage under microaerophilic conditions (Hastings and
Nealson,1977; Hastings _et a ., 1985).
The principle of the Microtox test is that the intensity of
bioluminescence is diminished in response to exposure to toxicants.
This response is generally linear over some range of toxicant
concentration. The light output at specified temperature, pH, and
salinity is easily measured with the Microtox analyzer, which contains
incubation wells, temperature controls and a photomultiplier tube
connected to a digital output display. The analyzer can also be
10
connected to a strip chart recorder for a permanent record of the test
data. Once the bacteria have been prepared for the test procedure, the
initial light level is measured, a toxic challenge added, and the light
level measured again after a specified period of exposure. Generally
the concentration of toxicant causing a 50% decrease in light output
relative to a reagent blank is the reported result (Beckman, 1982).
The Microtox test is a versatile test, which may be used to
evaluate almost any aqueous sample. The test is short (one to two
hours) and requires no laboratory culturing of test organisms. (The
manufacturer supplies standard cultures of lyophilized bacteria in easy
to handle single test reagent vials). It also has good
reproducibility, with a coefficient of variation of 15 to 20% (Bulich
£t £LL., 1981). The Microtox system previously has been used for
effluent monitoring ( Bulich e± al., 1981; Peltier and Weber, 1980;
Samak and Noiseux, 1980; Vasseur £t _al.,1984) as well as wastewater
treatability monitoring (Slattery,1985), studies of toxicity removal in
activated sludge treatment plants (Neiheisel _e_t al. ,1982), evaluation
of fossil fuel process waters (Lebsack et_ al.., 1981), landfill leachate
studies (Sheehan et^ al_. ,1984) and sediment toxicity studies (Atkinson
et al.,1985).
Good correlations between Microtox tests and a number of other
bioassays using organisms from a wide variety of phylogenetic groups
have been found. Chang eit_ al . (1981) found correlation coefficients
(r) of 0.9 and 1.0 between Microtox results and rat and fish LD50's
11
respectivily for typical organic toxicants. Curtis et_ al.. (1982) and
Indorato et_ al. (1983) found correlation coeficients between Microtox
and different species of fish between 0.80 and 0.95. Looking at 20
chlorophenols, 12 chlorobenzenes and 13 para-substituted phenols, Ribo
and Kaiser (1983) compared results of 7 different bioassays with
Microtox results. Two bacterial assays, three fish assays, and Daphnia
and shrimp assays were included. Correlation coefficients for these
studies all fell between 0.82 and 0.96. No examples of Microtox
comparisons to anaerobic systems were found in the literature.
2.4 COMPLEX EFFLUENTS
When a biological system encounters more than one toxicant at a
time, the response to those toxicants may be greater than or less than
the sum of the observed effects of the toxicants acting individually.
When the effects are greater than additive effects, the toxicants are
said to act synergistically, and when the effects are less than
additive effects, they act antagonistically. Complex effluents, such
as pulp mill wastes may contain a wide variety of toxicants. Wastes
with multiple toxicants pose a treatment problem in predicting the
response to those toxicants even when the response to individual
components may be known.
2.5 TOXICITY REMOVAL
Anaerobic treatment as a means to degrade toxic compounds has
12
recently been receiving greater attention. Several papers have been
published presenting methods for determining anaerobic biodegradation
potential (Shelton and Tiedje, 1984 ; Healy and Young, 1979; Owen et
al., 1979). In general, these tests rely on measurement of gas
production from the mineralization of organic pollutants. It should
not be assumed, however, that these tests necessarily measure removal
of toxicity. Intermediates formed during biological degradation may be
as toxic, or in some cases more toxic than the compound from which they
are derived (Bower and McCarty, 1983; Vogel and McCarty, 1985). Thus,
some form of biological evaluation of anaerobic toxicity removal is
warranted.
CHAPTER 3 - EXPERIMENTAL METHODS
3.1 OVERVIEW
The study was divided into 5 phases. In the first phase the
available literature was searched for information on the toxicity of
pure compounds to anaerobic methane-producing bacteria and to the
Microtox organism. During the second stage further data on the
toxicity of pure compounds were obtained in the laboratory using the
Microtox bioassay and the anaerobic toxicty assay (ATA) with media-fed
seed. The third phase was to study the toxic effects of a complex
effluent using ATA's with sludge-fed seed and to compare the response
to toxic chemicals of this seed to that of the media-fed seed. In the
fourth stage Microtox data were compared to data on hydrogen and
carbon monoxide accumulations in toxified anaerobic reactors. During
the fifth stage of the study the feasibility of using the Microtox
bioassay as an indicator of toxicity reduction by anaerobic treatment
was briefly investigated.
3.2 LITERATURE REVIEW
Available literature was searched for information on the toxicity
of pure chemicals to both Microtox and to anaerobic methane-producing
bacteria. Side by side alphabetical lists by chemical of Microtox data
and methanogen data were compiled. An initial assessment of the data
was made by determining which chemicals were more toxic 'to Microtox,
13
14
which were more toxic to methanogens and which were essentially equally
toxic to both. For chemicals for which appropriate data were found,
the concentration causing 50% inhibition of methane production was
plotted against the concentration causing 50% inhibition in the
Microtox bioassay, and statistical relationships determined.
3.3 PURE CHEMICAL TOXICITY
In this phase of the study, additional information for the
comparison of toxicity of chemicals to the Microtox bioassay and
methanogens was obtained in the laboratory. Anaerobic toxicity assays
(ATA's) as developed by Owen et al. (1979), as well as Microtox
bioassays as developed by Beckman Instruments, were performed. In
order to maximize data for comparison, tests were done with chemicals
for which literature information on one or the other bioassay was
available. As more literature data were available for Microtox tests,
this study focused more heavily on anaerobic, toxicity assays. Testing
was also done for selected chemicals to assure that toxicity values
generated in this laboratory were comparable to those found in the
literature.
3.3.1 Anaerobic Toxicity Assays
Anaerobic toxicity assays (ATA's) as developed .and described by
Owen et_ al_. (1979) were performed to determine the toxicity of various
chemicals to methane-producing bacteria. This toxicity assay is a

15
batch test in which the inhibition of methane production from a readily
digested substrate due to a toxicant is measured. An inoculum, or
seed, of bacteria from a methane-producing reactor is added to
anaerobically sealed serum bottles containing medium, substrate and
toxicant. The bottles are incubated, and the gas production monitored
over a period of two weeks.
The anaerobic seed for this phase of the study was obtained from a
15 L mixed culture anaerobic research reactor operated at 20 days solid
retention time (SRT). The reactor was fed a sucrose based medium,
containing bicarbonate buffer, nutrient salts and yeast extract. One
test was also made to compare the seed from the 20 day SRT reactor to
seed from an 8 day SRT reactor maintained on the same feed. The
initial inoculum for starting both the 20 day and 8 day SRT reactors
came from a mixture of several sources, including a dairy manure
digester, a sewage digester and research reactors. Both reactors had
been operating for approximately 15 months prior to this study. Gas
production from each reactor was approximately 50% methane and 50%
carbon dioxide, and both were maintaned at or near pH 7.0. A
preliminary test was made to determine that 30% seed was an appropriate
seed concentration to use for the anaerobic toxicity assays.
The defined medium used for the ATA's contains vitamins, nutrient
salts, bicarbonate, sodium sulfide as a reducing agent, and resazurin
to detect oxygen contamination. The medium and the method of
preparation were the same as those described by Owen _et_ _al^. (1979) with
16
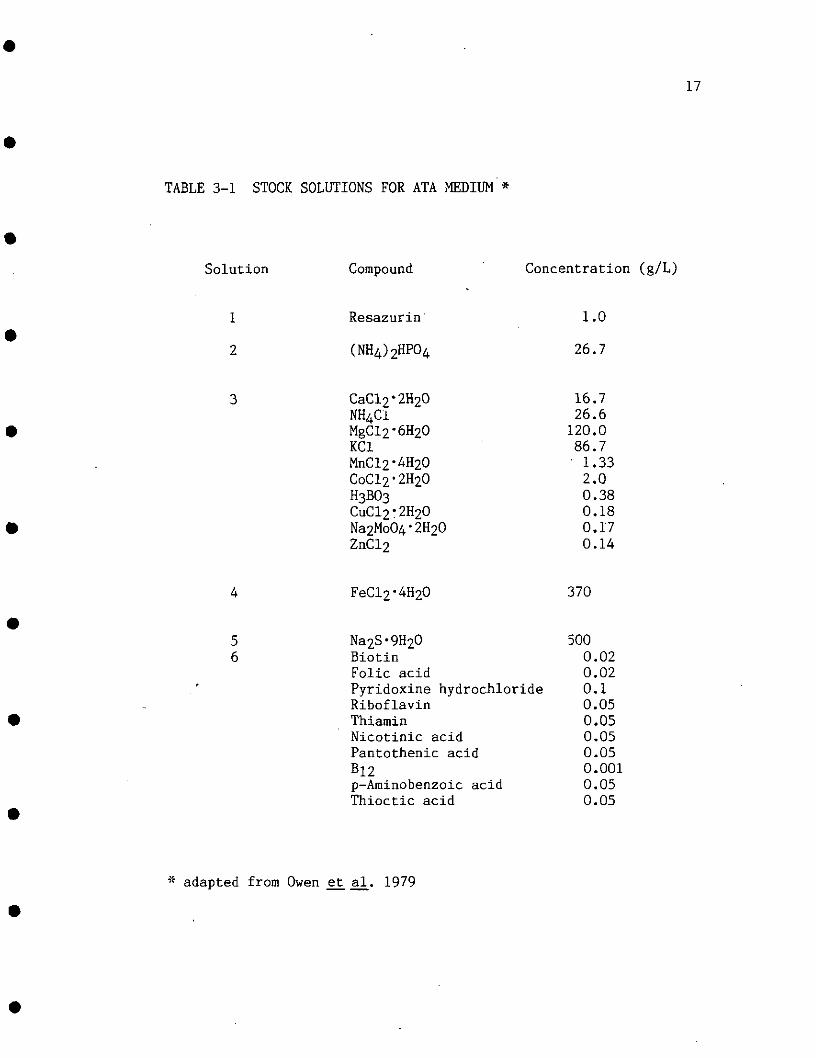
minor modifications. Table 3-1 lists the stock solutions used and
Table 3-2 lists the method of medium preparation. The medium was
prepared fresh at the beginning of each ATA run from stored stock
solutions.
125 mL glass serum bottles (actual volume approximately 164 mL)
were used as the test vessels. All glassware was detergent washed,
rinsed 5 times in tap water, soaked 5-10 minutes in 10% HC1, rinsed 5
times in distilled water and oven dried. Serum bottles were pre-purged
with nitrogen gas then purged with a mixture of 70% nitrogen and 30%
carbon dioxide gas.
ATA medium and seed were transferred to the serum bottles
anaerobically. Volumes of 35 mL medium and 15 mL (30%) seed were used.
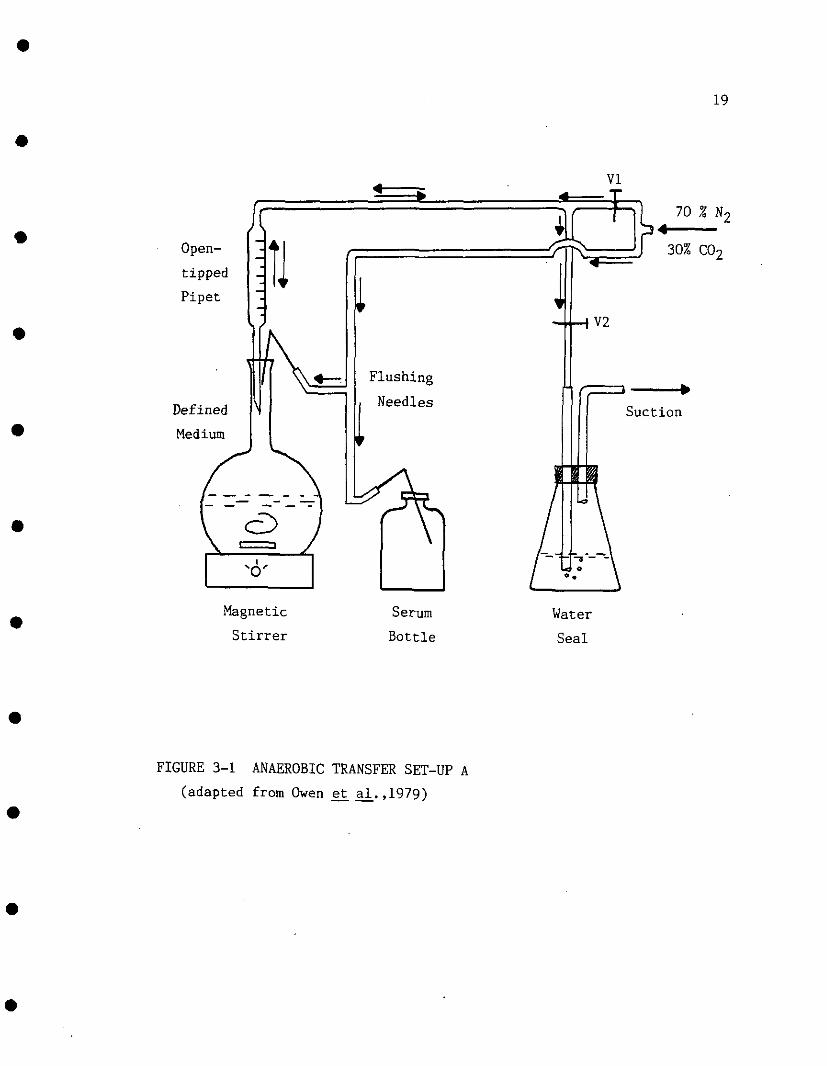
The anaerobic transfers were accomplished using one of two different
set-ups. The first set-up is descibed by Owen et_ _al/ (1979), and is
depicted in Figure 3-1. After initial gassing, medium is pipetted by
opening and closing pinch valves VI and V2, while flushing with gas.
After filling, serum caps are inserted while similtaneously removing
the gas flushing needle. This first set-up proved to be somewhat
awkward, and a second set-up was devised which proved to be equally
reliable. This set-up is depicted in figure 3-2. The draw tube of a
manual repipettor is inserted into the medium or seed bottle. Purge
lines are inserted into the bottle and onto the suction vent of the
repipettor. The repipettor is set to the desired volume, and medium or
seed is pipetted into the serum bottles while flushing with the gassing
17
TABLE 3-1 STOCK SOLUTIONS FOR ATA MEDIUM *
Solution Compound Concentration (g/L)
1 Resazurin 1.0
2 (NH4)2HP04 26.7
CaCl2-2H20 16.7NH4C1 26.6MgCl2'6H20 120.0KC1 86.7MnCl2'4H20 1.33CoCl2'2H20 2.0H3B03 0.38
0.180.17
ZnCl2 0.14
370
5 Na2S'9H20 5006 Biotin 0.02
Folic acid 0.02Pyridoxine hydrochloride 0.1Riboflavin 0.05Thiamin 0.05Nicotinic acid 0.05Pantothenic acid 0.05612 0.001p-Arainobenzoic acid 0.05Thioctic acid 0.05
adapted from Owen et al. 1979

18
TABLE 3-2 ATA MEDIUM PREPARATION *
Step Instruction
Add 1 liter distilled water to 2 litervolumetric flask
Add the following:1.8 mL solution 15.4 mL solution 227 mL solution 3
Add distilled water to 1,800 mL mark
Boil for 20 min while flushing withN2 gas
Cool to room temperature(continue flushing with
Add the following:1.8 mL solution 61.8 mL solution 41.8 mL solution 5
Change gas to 30% C02 :70% N2
Add 8.4 g NaHC03 as powder
Continue flushing with 30% C02: 70% N2until dipensed into serum bottles.
adapted from Owen et al. 1979
19
Open-
tipped
Pipet
Defined
Medium
Magnetic
Stirrer
Flushing
Needles
70 % N2
Serum
Bottle
Water
Seal
FIGURE 3-1 ANAEROBIC TRANSFER SET-UP A
(adapted from Owen et al.,1979)

20
70%
Manual
Repipettor
Magnetic
Stirrer
FIGURE 3-2 ANAEROBIC TRANSFER SET-UP B

21
needle. The serum bottles are then stoppered.
After filling with medium and seed, crimped aluminum seals were
placed on the stoppered serum bottles, and the bottles allowed to
equilibrate to 35° C in an incubator. After equilibration, a substrate
spike and varying amounts of toxicant were added to the serum bottles
via syringe. The substrate spike contained 75 rag sodium acetate and
26.5 mg propionic acid sodium salt in a 2 mL volume of distilled water.
Toxicants were dissolved in distilled water, and varying volumes, up to
2 mL, were added to achieve the desired final toxicant concentrations.
In general, controls containing substrate but no toxicant were run in
triplicate, and duplicates of each toxicant concentration were made.
Also, for each run, at least one control without substrate spike was
prepared to assure that excessive methanogenic substrate was not
carried over into the experiment from the anaerobic reactors. .
Once the substrate spike and toxicant had been added, the head
space pressure of each serum bottle was equilibrated to atmosphereic
pressure through a well lubricated glass syringe. Gas inside the
bottle is allowed to expand and push the plunger of the syringe outward
until equilibrium is reached with atraosphereic pressure on the outside
of the syringe. The syringe is then withdrawn and the gas within
discarded. After zeroing, the serum bottles were incubated at 35° C
+/- 1.5° C in a Thelco Precision incubator.
For each ATA run, total gas production as well as methane
production was monitored on a periodic basis for up to two weeks.

22
Total gas production was measured using the glass syringe method. The
percentage of methane in the head space gas at each sampling time was
determined by gas chromatography. 1 mL samples of the head space gases
were injected into a Gow Mac thermal conductivity gas chromatograph,
using helium as the carrier gas and operating at a detector temperature
of approximately 70° C. A calibrated Hewlett-Packard integrator,
connected to the gas chromatograph, provided the output data of methane
as a percentage of the injected sample. The incremental methane
production was calculated as the measured percentage of methane times
the volume of total gas produced plus the change in the stored volume
of methane in the head space of the serum bottles. Cumulative total
gas production and cumulative methane production for controls and each
toxicant concentration were plotted, and the maximum rates of gas
production at each concentration calculated. The ratio of the maximum
rate of gas production to the maximum rate of gas production of the
controls was calculated for each toxicant concentration. The maximum
rate ratios (MRRf s) were used to determine the concentration of
toxicant causing 50% inhibition of the maximum rate of gas production
relative to the controls (MRR = 0.5). These values were then compared
to the concentrations of toxicant causing 50% inhibition in the
Microtox bioassay.
3.3.2 Microtox Bioassays
Microtox toxicity assays were performed following the procedures
23
described by the manufacturer (Beckman, 1982). The Microtox system
employs lyophilized aerobic marine bacteria which, upon reconstitution,
emit light. The initial light level is measured; a toxic challenge is
added and the percent light loss due to the toxicant is determined. Up
to four concentrations may be tested at once.
Microtox reagent (lyophilized bacteria) supplied by the
manufacturer, was reconstituted with a buffered saline reconstitution
solution (also supplied by the manufacturer). The reconstituted
bacteria were allowed to equilibrate for at least 15 minutes at the
test temperature (15° C), after which 10 microliter aliquots were
pipetted into 10 vials, each containing 0.5 mL of 2.2% saline dilution
fluid. After 15-20 minutes the initial light level of each vial was
measured and recorded. Then either 0.5 mL dilution fluid (blanks) or
0.5 mL of one of four serial dilutions of toxicant in dilution fluid
was added to each of 2 of the 10 test vials. After 5 minutes and after
30 minutes exposure time the light level of each vial was again
measured, and the percent light loss relative to the average of the
reagent blanks was calculated. The percent light loss was plotted
against toxicant concentration, and the concentration resulting in 50%
light loss determined by interpolation. This value is referred to as
the 5 minute or 30 minute 50% effective concentration (5EC50 or
30EC50).
3.4 COMPLEX EFFLUENT TOXICITY
24
The toxic effects of a complex effluent and its interactive
effects with various toxicants were studied using anarobic toxicity
assays as previously described. ATA's of a pulp mill waste (PMW)
alone, PMW combined with various toxicants, and toxicants in distilled
water were performed. A different seed inoculum was used in this phase
of the study (sludge-fed seed), and comparisons of the toxicity of pure
chemicals to this seed and to the medium-fed seed used earlier were
made.
The seed used for this phase of the study came from a laboratory
anaerobic sludge digester. This reactor was fed a mixture of waste
activated sludge (WAS) brought to 1.5% total solids with dissolved air
floats (DAF). The initial inoculum for this reactor came from a
municipal anaerobic sludge digester. The laboratory reactor was
operated at 20 days SRT, produced approximately 67% methane and 26%
carbon dioxide, and had been in operation for approximately 18 months
prior to this study. An initial study indicated that a 38% seed
concentration would be appropriate for toxicity testing with the ATA.
The complex effluent used was obtained from the waste stream of an
integrated pulp mill plant. The waste stream contained combined wastes
from the main pulping and milling operations as well as waste from
bleaching operations. Portions of the same effluent sample were used
for each ATA run. A preliminary test of the PMW was made to determine
an appropriate concentration to use for the combined chemical plus PMW
toxicity tests. A final concentration of 3.8% PMW by volume was used
25
for each of the combined tests.
The inhibition caused by toxicant plus PMW was compared to that
caused by toxicant alone and PMW alone. The interactive effects were
determined by assessing whether toxicity due to the mixture was greater
than or less than the toxicity predicted by simple additive effects of
the PMW and the toxicant. Finally, toxicity of pure compounds to the
sludge-fed seed was compared to toxicity to the medium-fed seed which
had been determined earlier.
3.5 HYDROGEN AND CARBON MONOXIDE DATA
Certain toxic upset conditions in anarobic digesters are
characterized by accumulations of hydrogen and carbon monoxide gas. In
this phase of the study, Microtox data were compared to hydrogen and
carbon monoxide accumulations in toxified reactors to determine if
Microtox could be used as a predictor of these upset conditions.
, Microtox data were taken from the literature and previously
gathered laboratory results. Hydrogen and carbon monoxide data were
taken from a study conducted at the University of Massachusetts,
Amherst, in which toxicity assays similar to the ATA's described in
this report were performd (Rickey, 1987). In these studies, waste
activated sludge, seed from sludge-fed digesters and toxicant were
combined in closed serum bottles, and hydrogen and carbon monoxide as
well as methane and carbon dioxide measured over one day. Gas
measurements were made with a trace analytical mecury reduction
26
detector gas chromatograph,
3.6 TOXICITY REDUCTION
The feasibility of using the Microtox bioassay as a measure of
toxicity removal by anaerobic treatment was investigated. It was
proposed to measure the toxicity of compounds to the Microtox organism
both before and after treatment by anaerobic biodegradation in batch
mode. Microtox bioassays were performed on the ATA defined medium and
supernatant from both medium-fed and sludge-fed seed. Supernatant from
the anaerobic seed souces was obtained by centrifugation in a table-top
centrifuge for approximately 10 minutes. Dissolved oxygen measurements
were made using an electronic dissolved oxygen probe in order to assure
that the Microtox tests were not oxygen limited. Additionally,
Microtox tests of air-purged supernatant from the sludge-fed seed and
supernatant of the sludge used to feed this reactor were made. After
reviewing the results of these initial tests, it was decided to
discontinue work on this phase of the study.

CHAPTER 4 - RESULTS
4.1 LITERATURE REVIEW
Table 4-1 presents the results of the initial literature review.
Literature data for both Microtox and anaerobe toxicity were found for
a total of 39 chemicals. Of these, 24 (62%) were found to be more
toxic to Microtox. Eleven (28%) were of the same order of magnitude
toxicity to both Microtox and methanogens, and the remaining 4 (10%)
were more toxic to methanogens. Considerably more data are available
for Microtox testing than for anaerobe testing, and are reported in a
more consistant manner. Many different types of anaerobic toxicity
data were included in the initial review. Some of the data are based
on mixed culture studies while others are based on enriched or pure
cultures of methanogens. Many procedural differences were found in the
anaerobic literature. For some chemicals, reports were found simply
stating that a certain chemical was not toxic at a given concentration.
When this value was appreciably above the reported Microtox 5EC50, the
chemical was listed as more toxic to Microtox.
For chemicals for which there were more detailed literature data,
the concentration of toxicant causing 50% anaerobic inhibition was
determined. The reported values, or in some cases estimates, were
plotted against the Microtox 5EC50 values on logarithmic axes. This
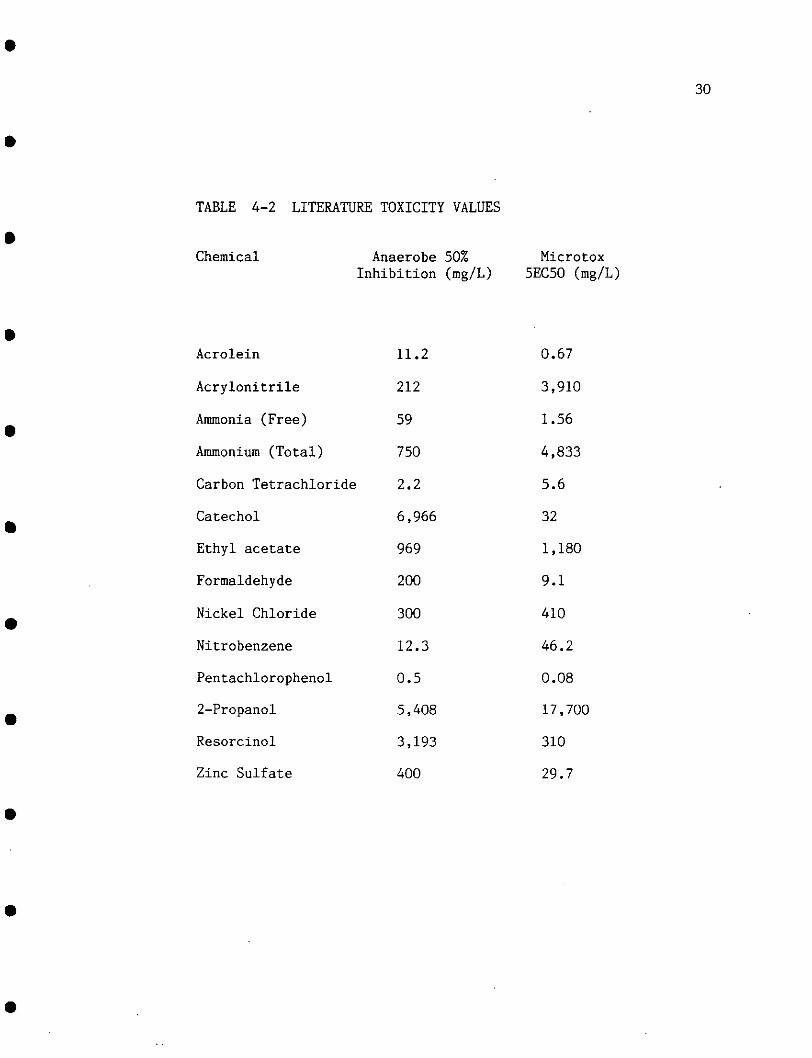
information is presented graphically in Figure 4-1 and in tabular form
in Table 4-2. In cases where more than one Microtox value was
27

28
TABLE 4-1 RELATIVE TOXICITY - LITERATURE SURVEY
More Toxic to Microtox Equally Toxic(Same Order ofMagnitude)
More Toxic toMethanogens
AcroleinAmmonia (Free)Arochor 1242Benzyl AlcoholCatechol4-Chloro-3-methylphenol2-Chlorophenolp-CresolCyanide2,4-Dicholorophenol2,4-DimethylphenolDimethylphthalate2,4-DinitrophenolFormaldehydeMercuric Chloridem-MethoxyphenolNaphthalene1-OctanolPentachlorophenolPhenolResorcinol1,1,2,2-Tetrachloroethane2,4,6-TrichlorophenolZinc Sulfate
Ammonium (Total)CadmiumCarbon tetrachlorideCopperm-CresolEthylacetateNickel ChlorideNitriteNitrobenzene4-Nitrophenol2-Propanol
AcrylonitrileChloroform1,2-DichloroethaneMethanol

29
oo 4 -
aoh- 1 i&-. 3 -i— *CQhHX
, 1 H * l
w2
rc£d 1 -E:
o^ _o 0
3
D
a
a /'aa
^^>1*1 f—*
° n'a . /Q a*a
*
/ a/,--'"°
- 1 0 1 2 3
LOG MICROTOX 5EC50 (mg/L)
FIGURE 4-1 MICROTOX 5EC50 vs. METHANE INHIBITION
LITERATURE DATA
30
TABLE 4-2 LITERATURE TOXICITY VALUES
Chemical Anaerobe 50% MicrotoxInhibition (mg/L) 5EC50 (mg/L)
Acrolein
Acrylonitrile
Ammonia (Free)
Ammonium (Total)
Carbon Tetrachloride
Catechol
Ethyl acetate
Formaldehyde
Nickel Chloride
Nitrobenzene
Pentachlorophenol
2-Propanol
Resorcinol
Zinc Sulfate
11.2
212
59
750
2.2
6,966
969
200
300
12.3
0.5
5,408
3,193
400
0.67
3,910
1.56
4,833
5.6
32
1,180
9.1
410
46.2
0.08
17,700
310
29.7

31
available, the average value was plotted. Statistical analysis of the
data yielded a correlation coefficient of 0.74. The solid line shown
on Figure 4-1 is the line of equal value. Ten out of 14 data points
(71%) lie on or above this line. These represent chemicals which are
either more toxic or equally toxic to Microtox.
4.2 PURE CHEMICAL LABORATORY RESULTS
4.2.1 Anaerobic Toxicity Assays
An initial test was made to determine an appropriate concentration
of medium-fed seed to use in the ATA's. Four seed concentrations were
tested. Figure 4-2 shows the cumulative methane production for
non-toxified controls of each seed concentration. Based on this test
it was decided to use 30% seed for the various ATA's using medium-fed
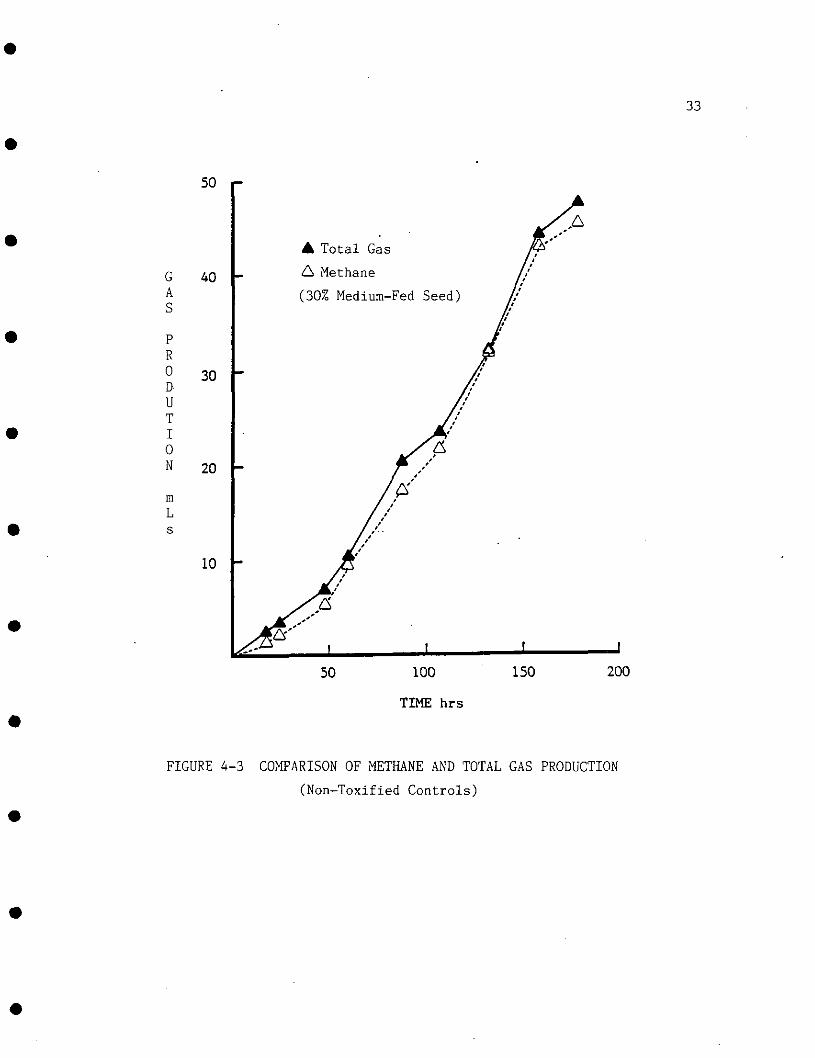
seed. The production of methane was compared to the production of
total gas. Figure 4-3 shows that for the controls, methane and total
gas production were very similar, but that at later points total gas
production did not level off as flatly as did methane production.
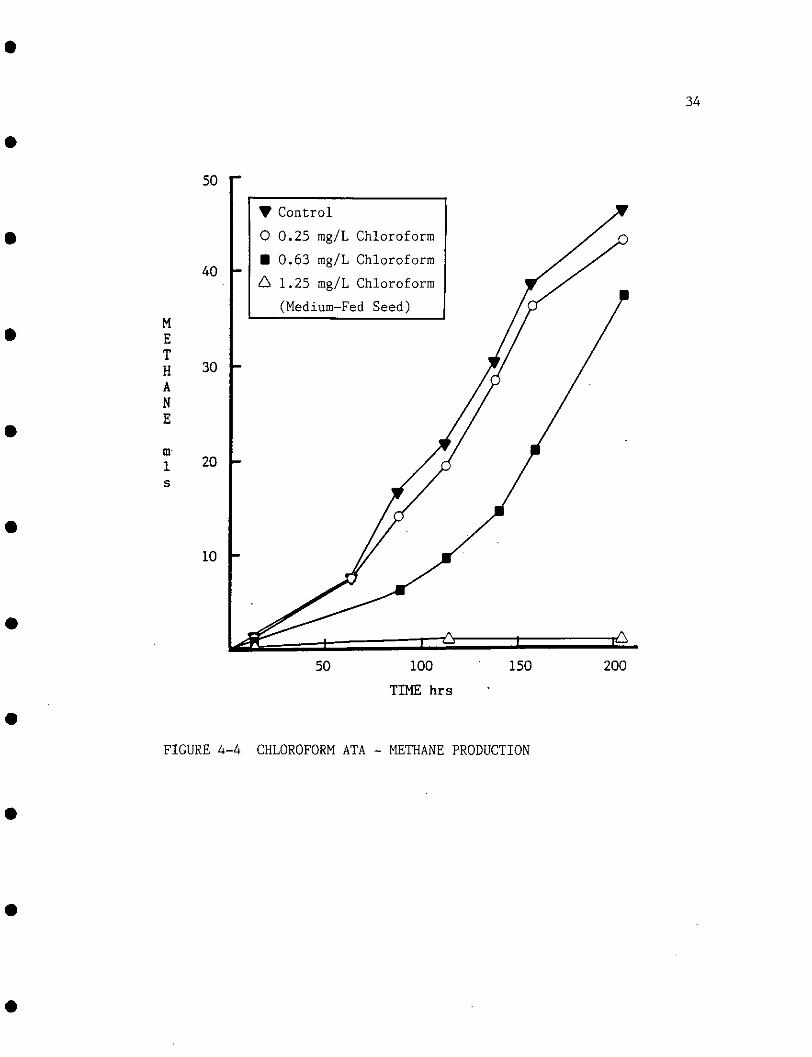
The results of a typical ATA run are shown graphically in Figures
4-4 and 4-5. Figure 4-4 shows the cumulative methane production for
controls and three concentrations of chloroform. This is very similar
to the pattern of total gas production shown in Figure 4-5. The higher
initial gas reading for total gas is most likely due to improper
temperature equilibration prior to zeroing the serum bottles. These

32
so r
40 -
30 -
20 -
10 -
200
FIGURE 4-2 CUMULATIVE METHANE PRODUCTION FOR NON-TOXIFIED
CONTROLS (Medium-Fed Seed)
33
50
40
30
20
10
A Total Gas
A Methane
(30% Medium-Fed Seed)
200
FIGURE 4-3 COMPARISON OF METHANE AND TOTAL GAS PRODUCTION
(Non-Toxified Controls)
50
40
30
20
10
V Control
O 0.25 mg/L Chloroform
• 0.63 mg/L Chloroform
A 1.25 mg/L Chloroform
(Medium-Fed Seed)
50 100
TIME hrs
150 200
FIGURE 4-4 CHLOROFORM ATA - METHANE PRODUCTION

35
T0TAL
GAS
m1s
50
40
30
20
10
V Control
O 0.25 mg/L Chloroform
• 0.63 mg/L Chloroform
A 1.25 mg/L Chloroform
(Medium-Fed Seed)
50 100 150
TIME hrs
200
FIGURE 4-5 CHLOROFORM ATA - TOTAL GAS PRODUCTION

36
results are used to calculate the concentration of toxicant which will
result in a 50% inhibition of the maximum rate of methane or total gas
production.
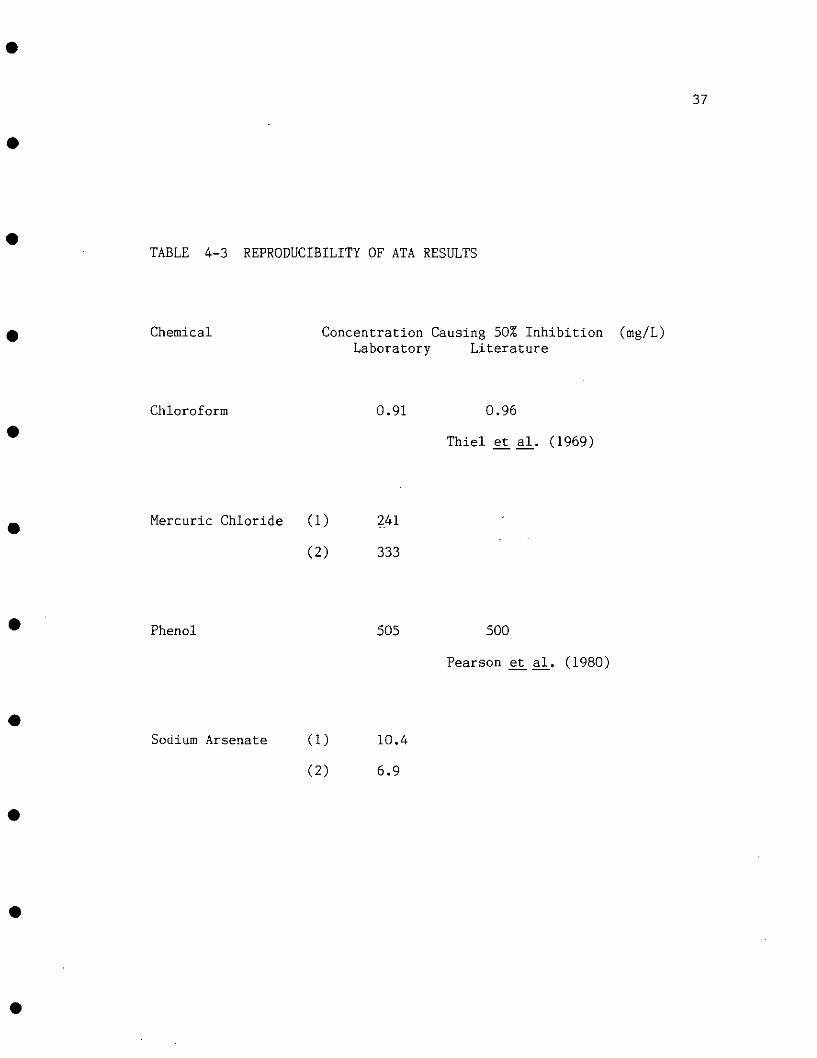
In order to assure that our laboratory results could be compared
reasonably to results reported in the literature, ATA assays were
performed using chemicals for which there were previously reported
literature data. Also, duplicate ATA's of two chemicals were run.
Table 4-3 presents these results. The reproducibility between
laboratories appears to be exceptionally good (1 and 5.5% differences
in values). Intra-laboratory reproducibility, however, showed much
higher differences in values (28 and 34% differences). Replicates of
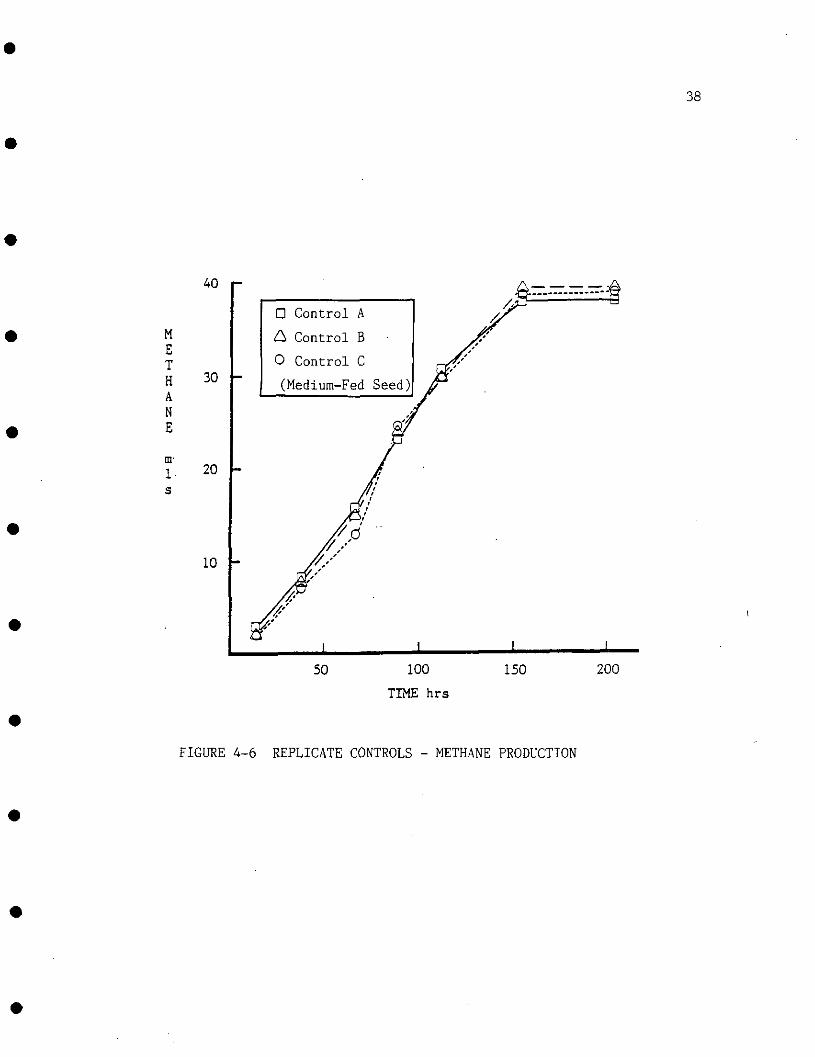
controls and toxified samples were generally well matched. Figure 4-6
shows the cumulative methane production for three replicate controls.
The coefficient of variation between the three replicates (standard
deviation / mean) averages around 3.1% for measurements at different
time points.
A brief study was made to investigate potential differences in
toxicity of chemicals to two anaerobic seeds from reactors which
differed only in their solids retention times. Table 4-4 presents the
comparison of toxicity to 20 day and 8 day SRT medium-fed seed. The 8
day seed appeared to be slightly more resistant to the toxic effects of
mercuric chloride and sodium arsenate. For the rest of the study only
the 20 day SRT seed was used.
A summary of ATA results is presented in Table 4-5. The
37
TABLE 4-3 REPRODUCIBILITY OF ATA RESULTS
Chemical Concentration Causing 50% Inhibition (mg/L)Laboratory Literature
Chloroform 0.91 0.96
Thiel et al. (1969)
Mercuric Chloride (1) 241
(2) 333
Phenol 505 500
Pearson _et a . (1980)
Sodium Arsenate (1)
(2)
10.4
6.9
38
40
30
20
10
D Control A
A Control B •
O Control C
(Medium-Fed Seed)
1
50
I
100
TIME hrs
I
150
I
200
FIGURE 4-6 REPLICATE CONTROLS - METHANE PRODUCTION

39
TABLE 4-4 COMPARISON OF 20 AND 8 DAY SRT MEDIUM-FED SEED
Chemical Concentration Causing 50% Inhibition (mg/L)20 Day Seed 8 Day Seed
Mercuric Chloride (1) 241 466
(2) 333
Sodium Arsenate (1) 10.4 11.2
(2) 6.9

40
TABLE 4-5 SUMMARY OF ATA RESULTS
Chemical Concentration Causing 50% Inhibition (mg/L)Methane Production Total Gas Production
Acetone 31,200 35,700
Beryllium Sulfate 3,340 6,440
n-Butyl Alcohol 6,690 6,730
Chloroform 0.91 1.00
Isopropyl Alcohol 31,200 26,100
Mercuric Chloride 287 -287
Methyl Isobutyl Ketone 12,900 36,400
Phenol 505 500
Potassium Chrornate 337 251
Sodium Arsenate 8.65 6.71

41
concentrations of various toxicants causing 50% inhibition of the
maximum rate of methane and total gas production are reported. Where
more than one ATA was performed, the average of computed values is
reported. In general, the concentration causing 50% inhbition of total
gas was close to the concentration causing 50% inhibition of the
maximum rate of methane production. The average percent difference
between the two values is 20%. The number of chemicals which showed
apparently greater toxicity based on total gas measurements is
approximately the same as those which showed greater toxicity based on
methane data.
4.2.2 Microtox Bioassays
Microtox bioassays were performed following the procedures
described by the manufacturer. The results of individual tests were
plotted to determine the concentration of toxicant causing 50%
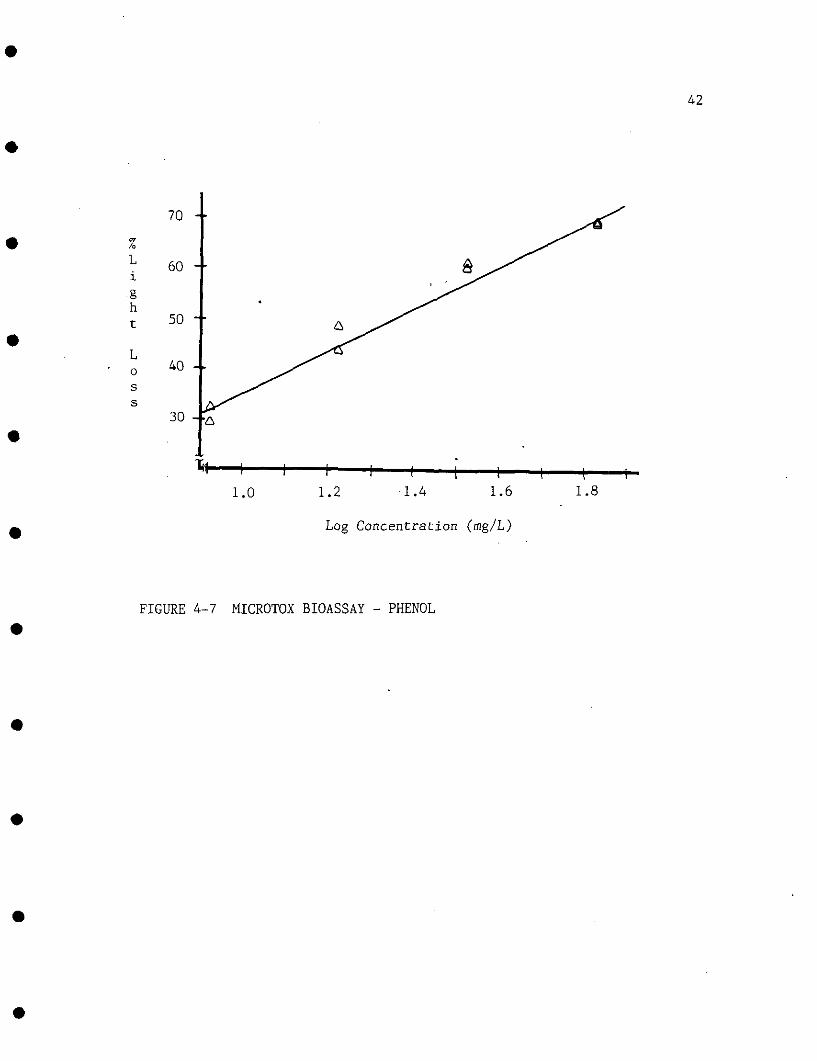
inhibition of light output after 5 and 30 minutes exposure. Figure 4-7
shows typical results for a 5 minute Microtox bioassay of phenol. The
Microtox test usually provides data which show strong linearity when
plotted on semi-log graphs. The correlation coefficient for nearly all
tests was well above 0.97.
Microtox tests also show good reproducibility both between tests
and between laboratories. Table 4-6 shows the range of Microtox
5EC50fs for mercuric chloride and phenol determined in this study and
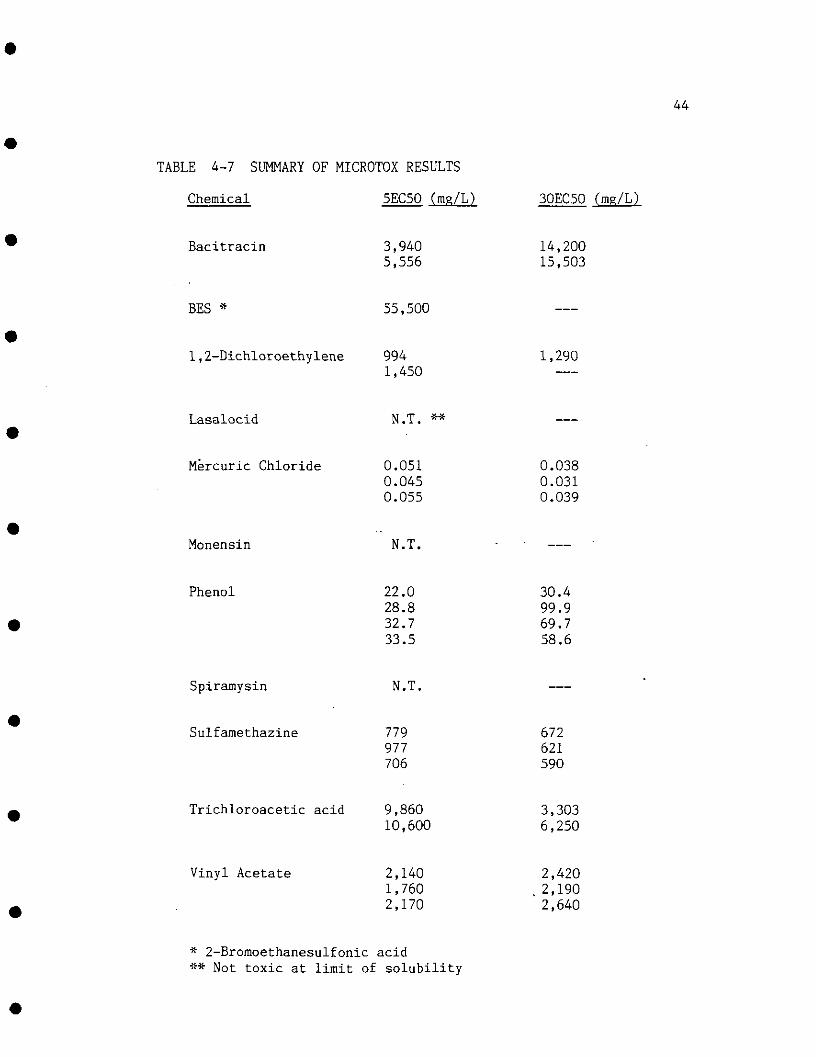
reported in the literature. Table 4-7 provides a summary of the
42
Light
Loss
70 4
60 4
50
40 4
30 -I
1.0 1.2 -1.4 1.6
Log Concentration (mg/L)
FIGURE 4-7 MICROTOX BIOASSAY - PHENOL

TABLE 4-6 REPRODUCIBILITY OF MICROTOX RESULTS
43
Mercuric Chloride
Laboratory Data
5EC50's (mg/L)
0.051
0.045
0.055
(n=3 ave=0.055 s.d.=.0041)
Literature Data 5EC50's (mg/L)
0.064 Dutka & Kwan (1981)
0.065 Bulich & Isenberg (1981)
0.08 Qureshietal. (1982)
0.07 Beckman (1983)
(n=4 ave=0.069 s.d=.0006)
Phenol
Laboratory Data
5EC50's (mg/L)
22.0
28.8
32.7
33.5
(n=4 ave=29.3 s.d.=4.55)
Literature Data 5EC50's (mg/L)
25 Lebsack (1980)
42 Samak & Noiseux (1980)
25 Bulich & Isenberg (1981)
26 Chang (1981)
28 Dutka & Kwan (1981)
40.2 Curtis (1982)
22.0 Qureshie^at. (1982)
40.7 Beckman (1983)
25 Indorato (1983)
(n=9 ave=31.1 s.d=7.80)
44
TABLE 4-7 SUMMARY OF MICROTOX RESULTS
Chemical 5EC50 (mg/L) 3QEC50 (mg/L)
Bacitracin 3,940 14,2005,556 15,503
BES * 55,500
1,2-Dichloroethylene 994 1,2901,450
Lasalocid N.T. **
Mercuric Chloride 0.051 0.0380.045 0.0310.055 0.039
Monensin N.T.
Phenol 22.028.832.733.5
30.499.969.758.6
Spiramysin N.T,
Sulfamethazine 779 672977 621706 590
Trichloroacetic acid 9,860 3,30310,600 6,250
Vinyl Acetate 2,140 2,4201,760 2,1902,170 2,640
2-Bromoethanesulfonic acidNot toxic at limit of solubility
45
Microtox results for this study.
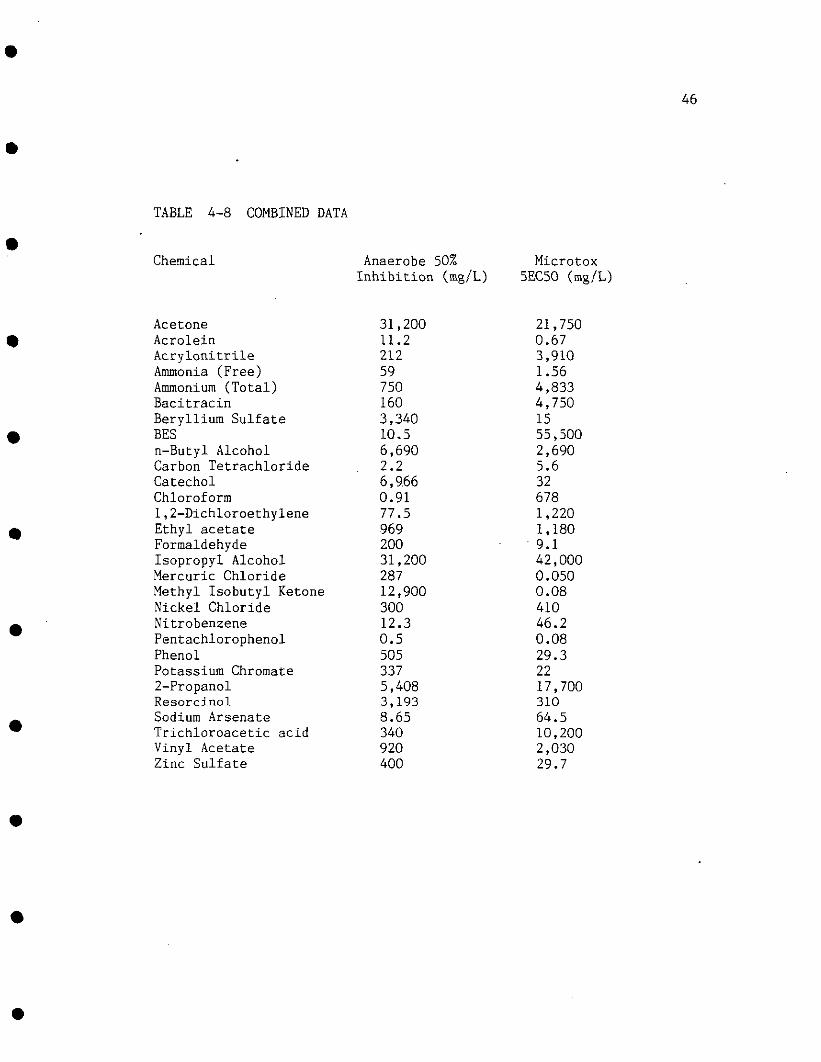
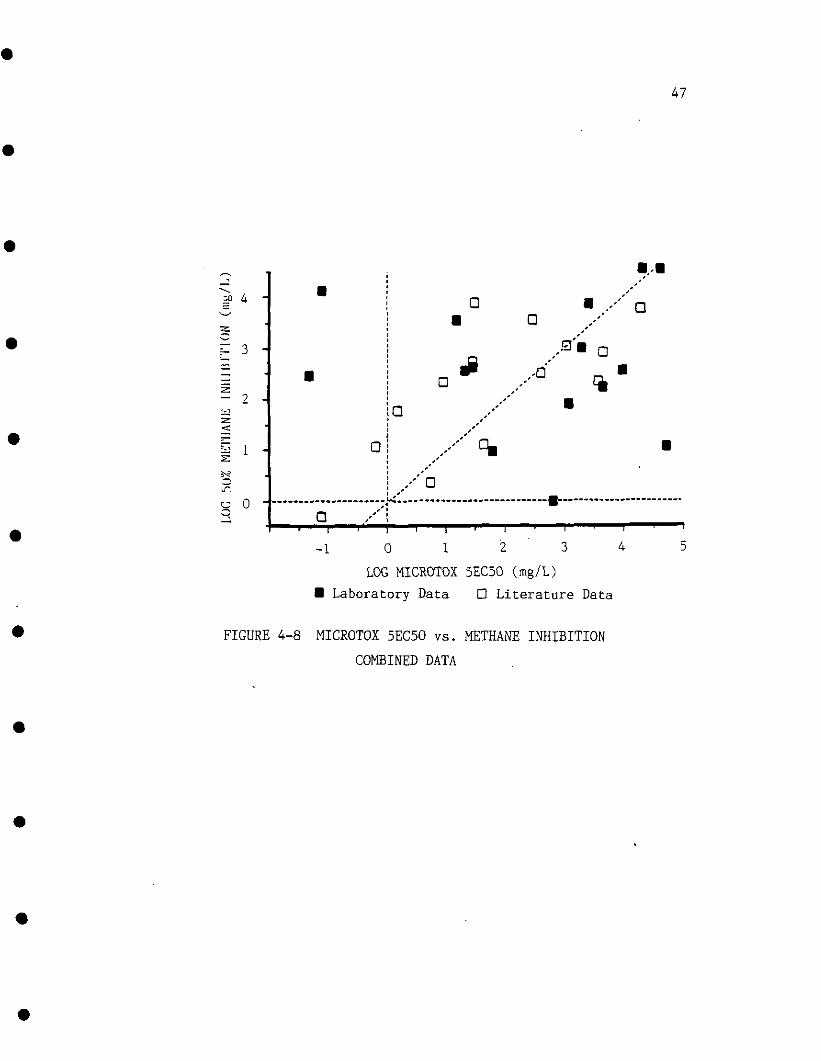
4.2.3 Combined Results
Literature and laboratory results were combined, and are presented
in Table 4-8. The concentrations causing 50% inhibition in the 5
minute Microtox test and 50% inhibition of methane production were
compared. Figure 4-8 shows very slight correlation between these
values (r = 0.32). Approximately 45% of the chemicals were more toxic
to Microtox; 38% were more toxic to methanogens, and 17% were equally
toxic to Microtox and methanogens.
The difference between using the 5 minute and the 30 minute
Microtox results for comparison to anaerobe data was examined. Table
4-9 presents Microtox 5EC50's, 30EC50's as well as anaerobe data for
ten chemicals. The correlation coefficent for anaerobe vs. 5EC50 was
essentially the same as for anaerobe vs. 30EC50 (r= 0.41 and 0.42
respectively). These values are statistically insignificant in each
case.
4.3 COMPLEX EFFLUENTS
An initial test was made to determine the appropriate amount of
sludge-fed seed to use for ATA's. Based on the results, a 38% seed
concentration was chosen for ATA's with sludge-fed seed.
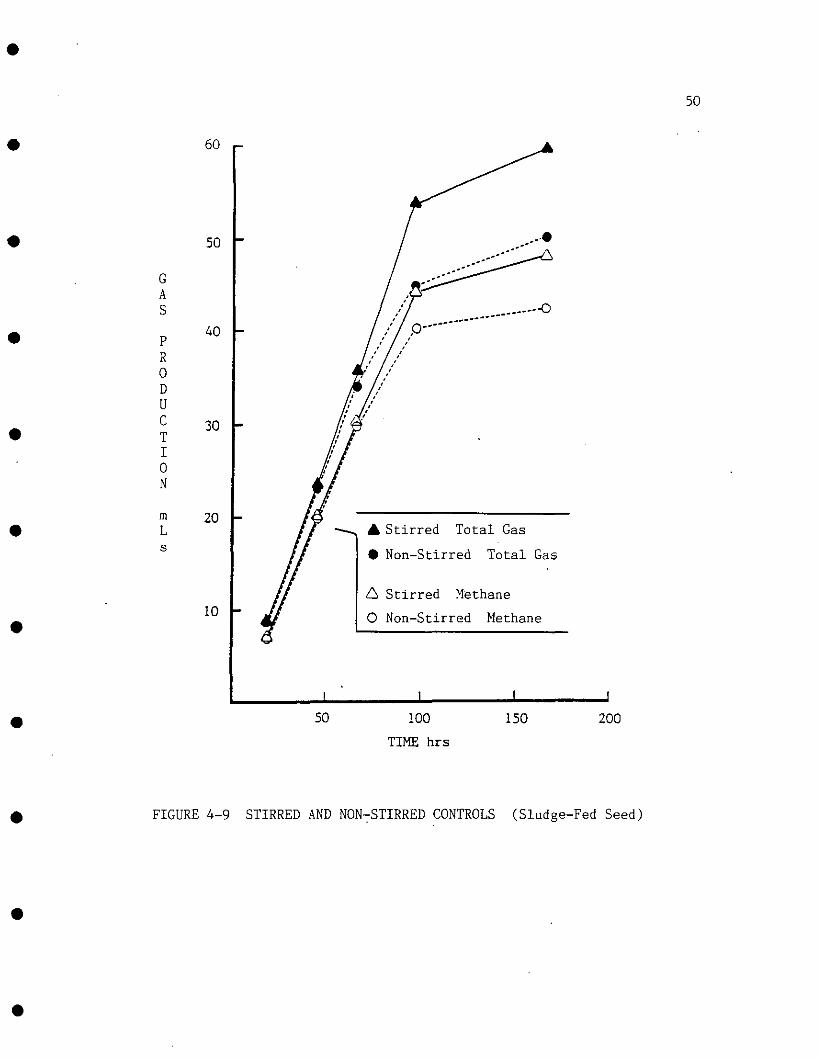
The effect of stirring on gas production was studied by comparing
stirred and non-stirred controls. Three controls with stirring bars on
46
TABLE 4-8 COMBINED DATA
Chemical Anaerobe 50% MicrotoxInhibition (mg/L) 5EC50 (mg/L)
Acetone 31,200 21,750Acrolein 11.2 0.67Acrylonitrile 212 3,910Ammonia (Free) 59 1.56Ammonium (Total) 750 4,833Bacitracin 160 4,750Beryllium Sulfate 3,340 15BES 10.5 55,500n-Butyl Alcohol 6,690 2,690Carbon Tetrachloride . 2.2 5.6Catechol 6,966 32Chloroform 0.91 6781,2-Dichloroethylene 77.5 1,220Ethyl acetate 969 1,180Formaldehyde 200 9.1Isopropyl Alcohol 31,200 42,000Mercuric Chloride 287 0.050Methyl Isobutyl Ketone 12,900 0.08Nickel Chloride 300 410Nitrobenzene 12.3 46.2Pentachlorophenol 0.5 0.08Phenol 505 29.3Potassium Chromate 337 222-Propanol 5,408 17,700Resorcinol 3,193 310Sodium Arsenate 8.65 64.5Trichloroacetic acid 340 10,200Vinyl Acetate 920 2,030Zinc Sulfate 400 29.7
47
3 -
— 9 -
1 -
U 0o
Q
a
a a
a
- 1 0 1 2 3
LOG MICROTOX 5EC50 (mg/L)
• Laboratory Data D Literature Data
FIGURE 4-8 MICROTOX 5EC50 vs. METHANE INHIBITION
COMBINED DATA

48
TABLE 4-9 COMPARISON OF 5 MINUTE AND 30 MINUTE MICROTOX VALUES
Chemical Anaerobe 50% Microtox Microtox
Inhibition (mg/L) 5EC50 (mg/L) 30EC50 (mg/L)
Amonia (free)
Bacitracin
1,2-Dichloroethylene
Formaldehyde
Mercuric Chloride
Nickle Chloride
Phenol
2-Propanol
Trichloroacetic Acid
Vinyl Acetate
59
160
77.5
200
287
300
505
5,408
340
920
1.56
4,750
1,220
9.1
0.050
410
29.3
17,700
10,200
2,030
2.0
14,800
1,290
3.0
0.036
13.9
64.7
35,000
4,780
2,410

49
continuously operating stirring plates were compared to regular
controls which were stirred only by shaking each time the bottles were
read. Figure 4-9 shows cumulative total gas and methane production for
the stirred and non-stirred controls. This figure shows that stirred
and non-stirred controls have similar gas production for the first few
days, after which stirred controls show both higher methane and total
gas production. The maximum rate of total gas production was 10%
higher for stirred controls. However, the maximum rate of methane
production was only 4% higher than the non-stirred controls.
The three replicates of both stirred and non-stirred controls
showed good reproducibility. Coefficients of variation were larger for
the later time points for the stirred controls, but in general ranged
between 1 and 3% for both stirred and non-stirred controls. Duplicate
ATA's of phenol and chloroform were performed. The results are in
fairly close agreement (16 and 45% differences respectivly). This is
similar to the degree of reproducibility observed for ATA's with
medium-fed sludge.
Five concentrations (2.0, 3.8, 5.7, 7.4, and 9.1%) of pulp mill
waste were tested for toxicity to methane producing bacteria using the
ATA with sludge-fed seed. Based on the results of this preliminary
test, a concentration of 3.8% PMW was chosen for evaluating combined
effects of toxicants and the pulp mill waste.
Figure 4-10 shows the results of a typical ATA run for mercuric
chloride with and without PMW. A summary of the results for complex
50
60
50
40
30
20
10
-O
A Stirred Total Gas
• Non-Stirred Total Gas
A Stirred Methane
O Non-Stirred Methane
50 100
TIME hrs
150 200
FIGURE 4-9 STIRRED AND NON-STIRRED CONTROLS (Sludge-Fed Seed)

51
40 i-
30 I-
20 H
10 h
200
A H20 Control
A PMW Control
• 130 mg/L HgCl2
O- 130 mg/L HgCl2 + .PMW
• 250 mg/L HgCl2
-Q 250 mg/L HgCl2 +
V 400 mg/L HgCl2
V 400 mg/L HgCl2 +
FIGURE 4-10 MERCURIC CHLORIDE ATA - SLUDGE-FED SEED

52
effluent studies is presented in Table 4-10. This table lists the
concentration of toxicant which results in 50% inhibition of total gas
and methane production for toxicants with and without PMW. The
concentration of toxicant predicted to cause 50% inhibition when
combined with PMW is also presented. This value is based on purely
additive effects of PMW and toxicant, and is used to determine whether
the observed combined effects are antagonistic, synergistic, or
additive. The results show that for all but one of the six tests, the
combined effect of PMW and toxicant was antagonistic based on methane
production. . For total gas production, 3 tests showed additive
interaction (observed = predicted +/- 10%); 2 showed antagonistic
interactions and one was synergistic.
The data from ATA's on chemicals without PMW using the sludge-fed
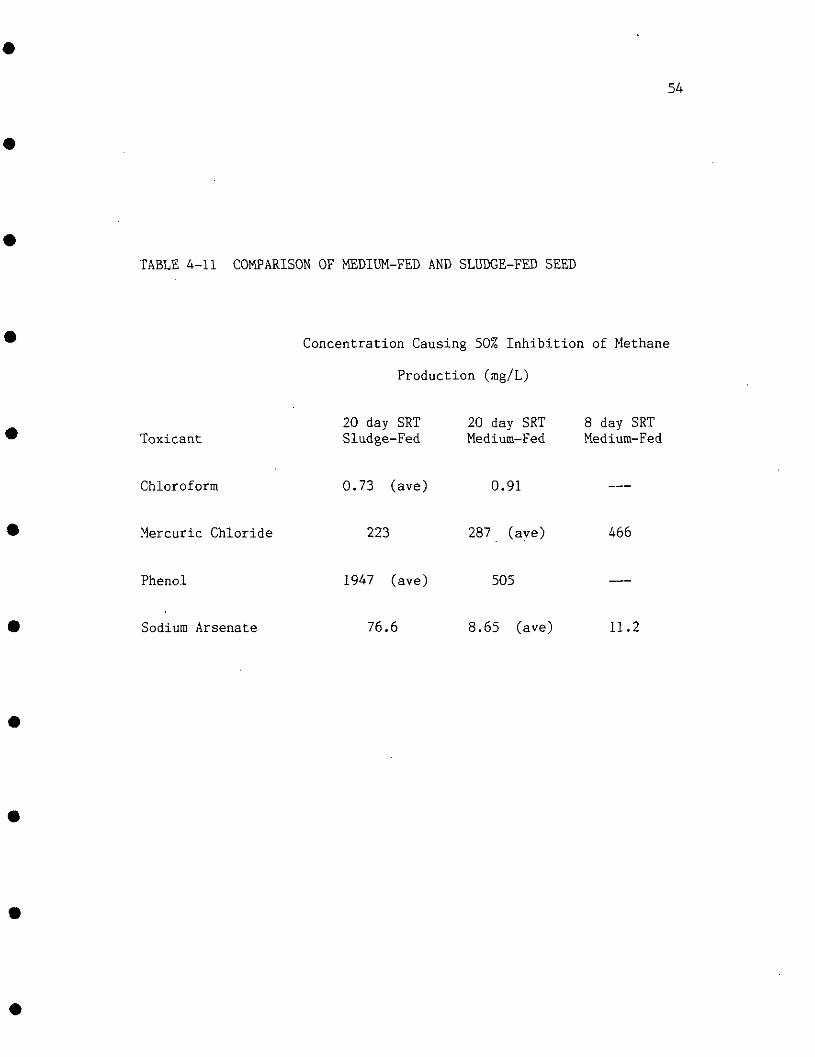
seed were compared to data using the medium-fed seed. Table 4-11
presents this information. Chloroform and mercuric chloride showed
toxicity in the same concentration range for both medium and sludge-fed
seed. Phenol and sodium arsenate were less toxic to" the sludge-fed
seed.
4.4 HYDROGEN AND CARBON MONOXIDE DATA
Data on hydrogen and carbon monoxide accumulations in toxified
anaerobic reactors were compared to Microtox data. The response
pattern of hydrogen production versus Concentration depends on the
particular toxicant. For some toxicants, hydrogen increases with
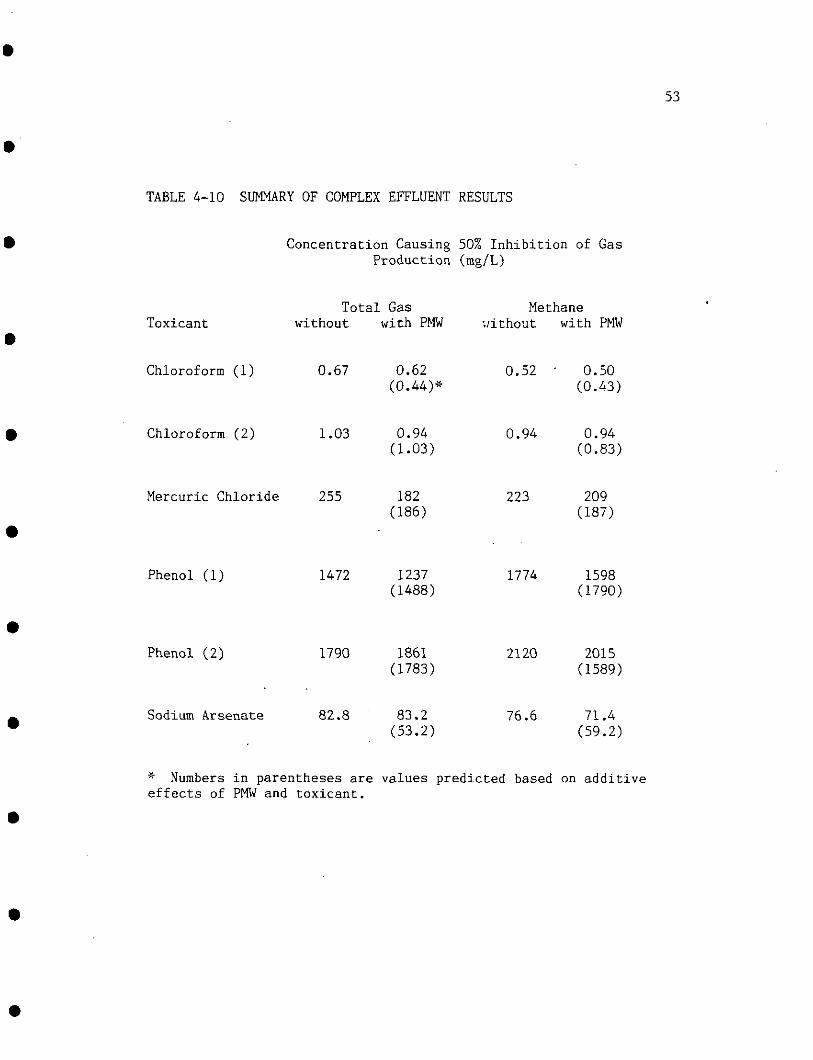
TABLE 4-10 SUMMARY OF COMPLEX EFFLUENT RESULTS
Concentration Causing 50% Inhibition of GasProduction (mg/L)
53
ToxicantTotal Gas
without with PMWMethane
without with PMW
Chloroform (1)
Chloroform (2)
Mercuric Chloride
Phenol (1)
Phenol (2)
Sodium Arsenate
0.67
1.03
255
1472
1790
82.8
0.62(0.44)*
0.94(1.03)
182(186)
1237(1488)
1861(1783)
83.2(53.2)
0.52 ' 0.50(0.43)
0.94 0.94(0.83)
223 209(187)
1774 1598(1790)
2120 2015(1589)
76.6 71.4(59.2)
* Numbers in parentheses are values predicted based on additiveeffects of PMW and toxicant.
54
TABLE 4-11 COMPARISON OF MEDIUM-FED AND SLUDGE-FED SEED
Toxicant
Chloroform
Mercuric Chloride
Phenol
Sodium Arsenate
Concentration Causing 50% Inhibition of Methane
Production (mg/L)
20 day SRTSludge-Fed
0.73 (ave)
223
1947 (ave)
76.6
20 day SRTMedium-Fed
0.91
287 (ave)
505
8.65 (ave)
8 day SRTMedium-Fed
466
11.2
55
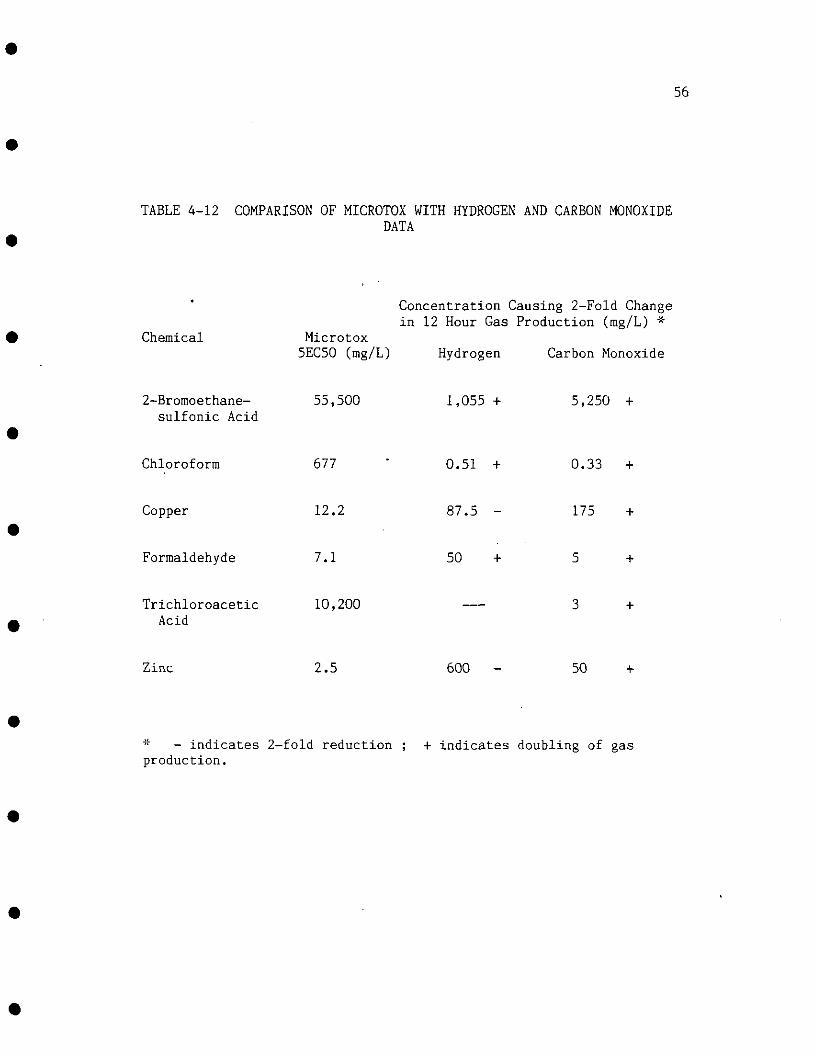
increasing toxicant concentration, and for others it decreases. The
carbon monoxide response pattern generally is increasing carbon
monoxide production with increasing toxicant concentration
(Hickey,1987). Table 4-12 summarizes the findings of this phase of the
study. Statistical analysis of the data shows no correlation between
Microtox toxicity and hydrogen or carbon monoxide accumulations in
toxified reactors.
4.5 TOXICITY REDUCTION
Prior to running tests to determine if Microtox could be used to
measure toxicity reduction by anaerobic treatment, preliminary tests
were made to determine background toxicity. Microtox tests were
performed on supernatant from anaerobic seed, air-purged supernatant,
ATA medium, and the sludge used for feed. The results of these tests
are presented in Table 4-13. These results indicate that the
background toxicity measured by Microtox is high. Air purging of the
sludge-fed seed supernatant indicated that a considerable portion of
the toxicity due to the supernatant is volatile. The sludge used for
feed showed no toxicity, suggesting that the toxicity is due to changes
that occur in the anaerobic reactor. Based on the high background
toxicities the decision was made to discontinue this phase of the
study.
4.6 SUMMARY OF RESULTS
56
TABLE 4-12 COMPARISON OF MICROTOX WITH HYDROGEN AND CARBON MONOXIDEDATA
Chemical Microtox5EC50 (mg/L)
Concentration Causing 2-Fold Changein 12 Hour Gas Production (mg/L) *
Hydrogen Carbon Monoxide
2-Bromoethane-sulfonic Acid
55,500 1,055 + 5,250 +
Chloroform
Copper
Formaldehyde
677
12.2
7.1
0.51
87.5
50
0.33 +
175
TrichloroaceticAcid
10,200
Zinc 2.5 600 50 +
* - indicates 2-fold reduction ; + indicates doubling of gasproduction.
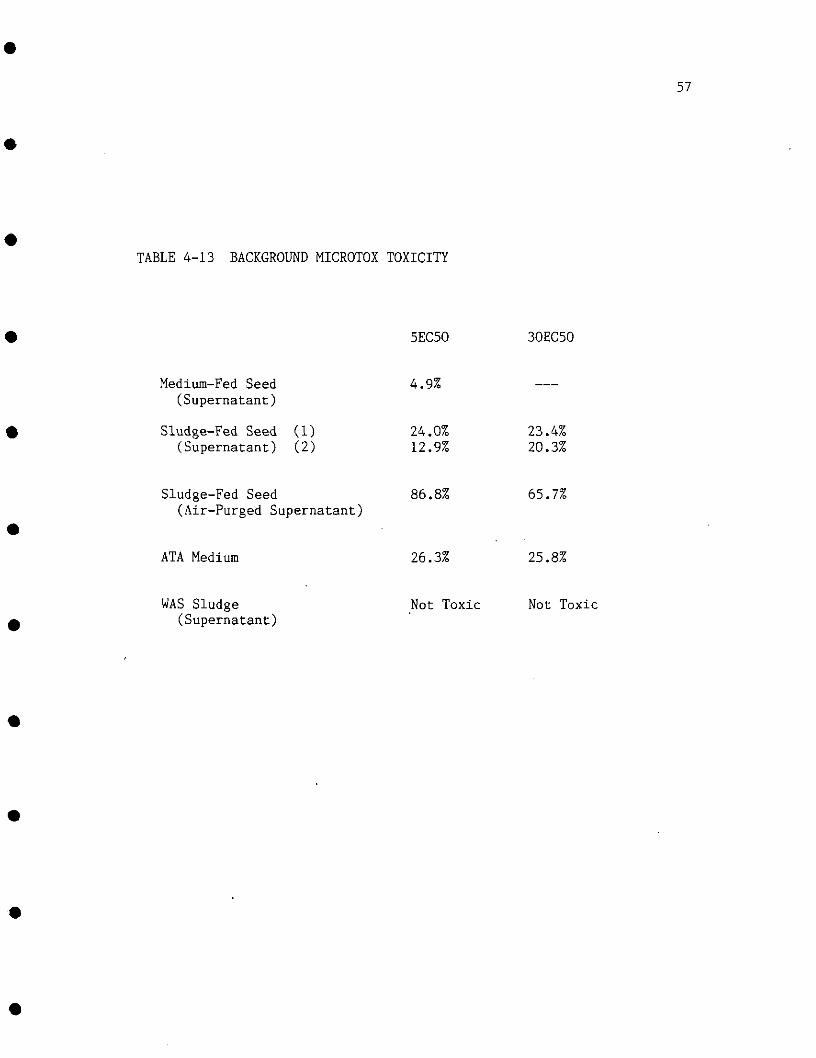
TABLE 4-13 BACKGROUND MICROTOX TOXICITY
57
Medium-Fed Seed(Supernatant)
Sludge-Fed Seed (1)(Supernatant) (2)
5EC50
4.9%
24.0%12.9%
30EC50
23.4%20.3%
Sludge-Fed Seed(Air-Purged Supernatant)
86.8% 65.7%
ATA Medium 26.3% 25.8%
WAS Sludge(Supernatant)
Not Toxic Not Toxic

58
The initial literature review indicated that there was a fairly
good correlation between Microtox 5EC50's and concentration of toxicant
causing 50% inhibition of methane production (r = 0.74 ; n = 14).
Laboratory tests using Microtox and ATA's showed good reproducibility.
The combined laboratory and literature data showed only a slightly
significant correlation between Microtox and methane inhibition (r =
0.32 ; n = 29). The results were not changed when 30 minute Microtox
data were used instead of 5 minute data.
Comparision of ATA data using different seed for inocula showed
that sludge-fed seed was less susceptible to toxicity from certain
chemicals. For other chemicals toxicity to sludge-fed and medium-fed
seed was approximately equal. Medium-fed seed grown at 8 days SRT
instead of 20 days SRT also appeared to be somewhat more resistant to
toxicity.
Studies with a complex effluent showed predominantly antagonistic
interactions with four different chemicals. There was no statistical
relationship between Microtox data and hydrogen and carbon monoxide
accumulations in toxified anaerobic reactors. Toxicity reduction
studies were not feasible due to high background toxicity.

CHAPTER 5 -DISCUSSION
5.1 EVALUATION OF MICROTOX AS A SURROGATE FOR ATA's
A toxicity test may be useful as a surrogate for another test if
it can be shown to satisfy at least one of two criteria. The first
criterion is that a good surrogate test should have some predictable,
quantifiable relationship to the test it is to replace. The second
criterion is that the test should be as sensitive or more sensitive to
toxicants and act as a conservative estimator of toxicity. The first
criterion is best judged by statistical relationships while the second
may be judged by the percentage of toxic cases the test sucessfully
identifies, or screens out.
The initial literature survey looked promising in meeting the
second criterion. Based on the initial survey, it would seem that the
Microtox test should be able to identify methanogenic toxicants with
approximately 90% reliability. (Only 10% of the chemicals were more
toxic to methanogens.) Further study of literature values through
regression' analysis also looked promising, yielding a correlation
coefficient of 0.74. This value is close to some of the values
reported in studies comparing Microtox to other bioassays.
The laboratory data, however, did not yield such positive support
for the use of Microtox as a surrogate for the ATA test. The
correlation coeffient for this set of data was too low to reject the
null hypothesis at any level of significance (Sharp, 1979). The
59

60
laboratory data also did not indicate that Microtox would be a good
screening tool (43 % of chemicals were more toxic to methanogens). One
reason for such a discrepancy between literature and laboratory results
may be the method of choosing chemicals to test. In the literature
study, data were gathered for each test without presupposition of the
toxicity of chemicals to the other test. In the laboratory study, an
attempt was made to look at some chemicals known to be specifically
toxic to each system, some chemicals with very little toxicity to one
of the tests, and at some which were thought likely to fall in some
middle range. This deliberate testing of extremes may account for the
lack of correlation of the data. The combined data show a slight
correlation, and taken as a whole, 59 % of the chemicals studies were
of equal or greater toxicity to Microtox.
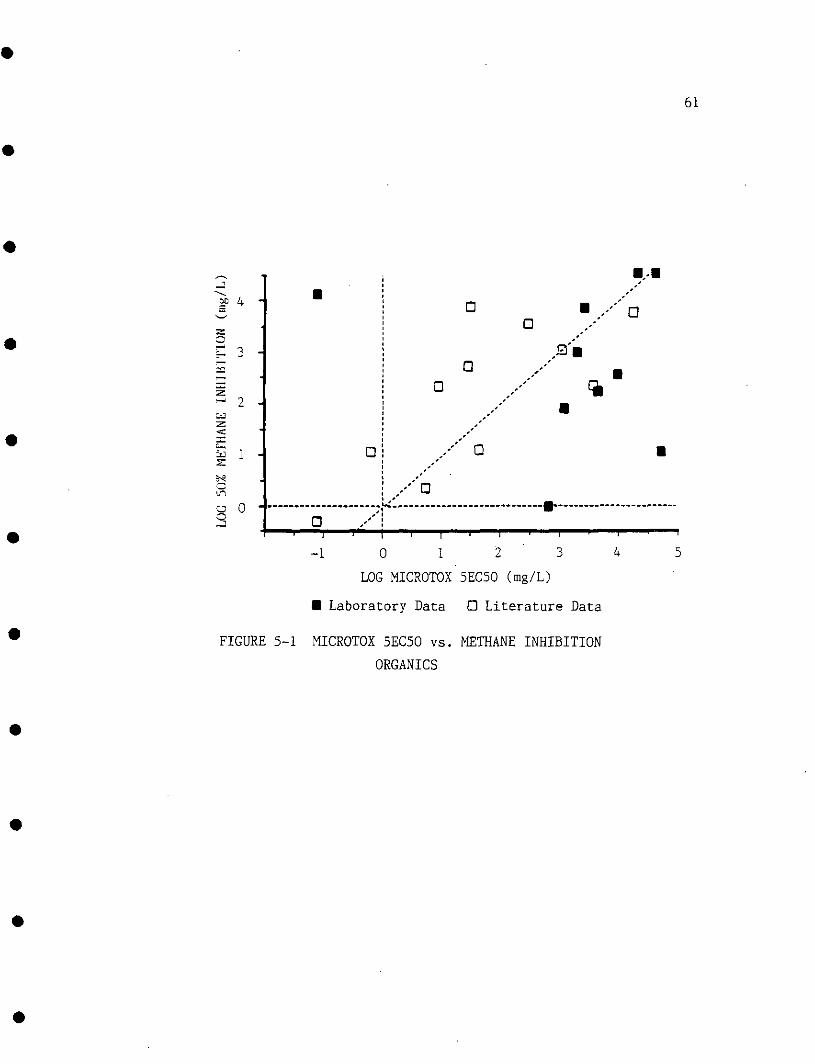
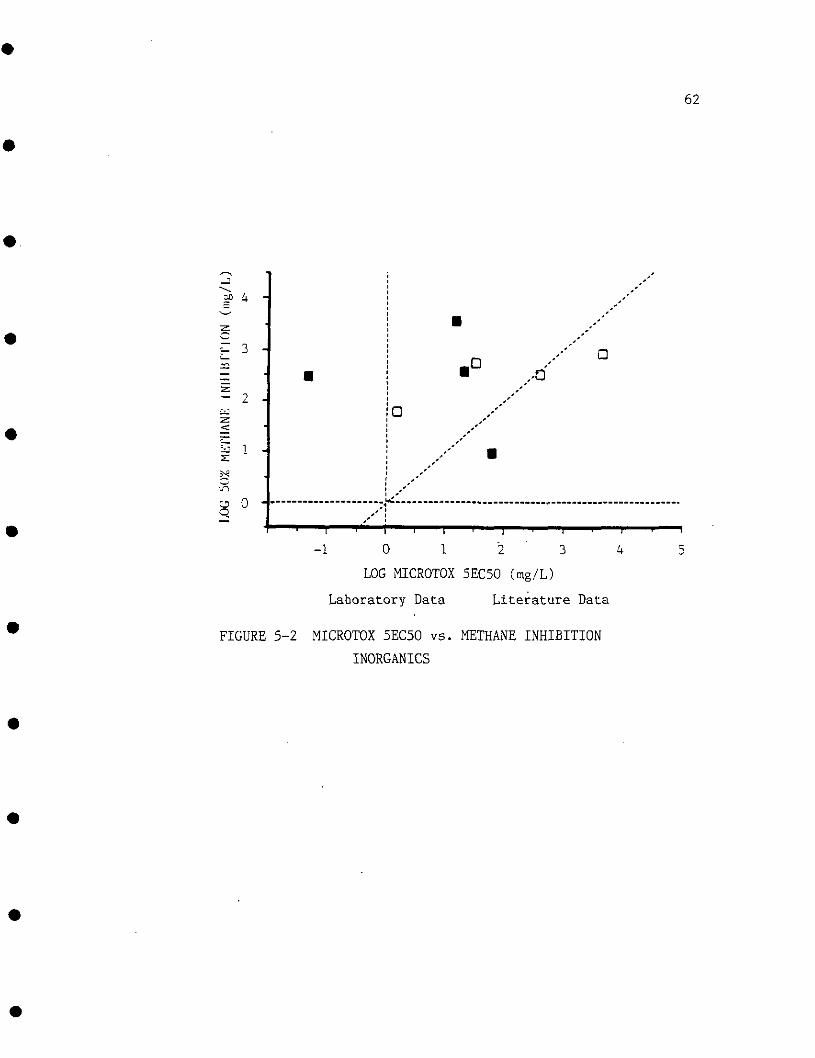
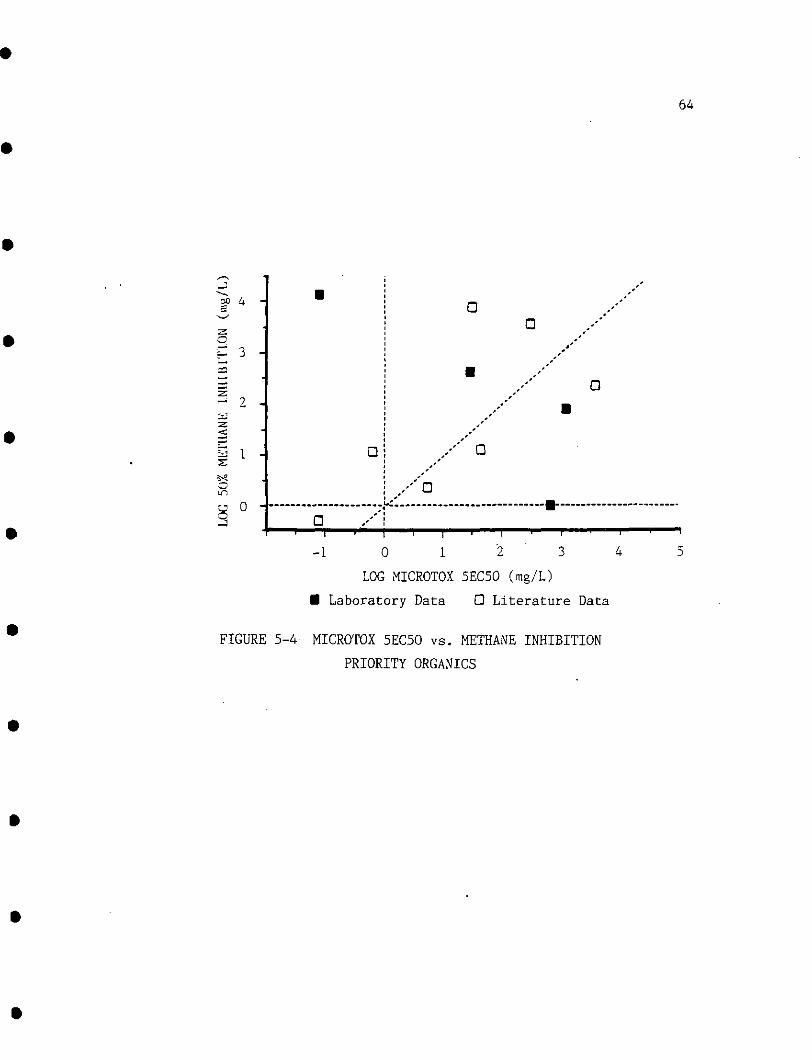
Four subsets of the combined data were evaluated: organics,
inorganics, priority pollutants and organic priority pollutants. Plots
of each data subset are presented in Figures 5-1 to 5-4. Each subset
showed insignificant correlation. Microtox seemed to be more suitable
as a screening tool for inorganic toxicants than for other the other
three groups. Only 1 of 8 inorganics (13%) was more toxic to
methanogens, compared to 29% for organics, 35% for priority pollutants
and 45% for organic priority pollutants (see Table 5-1). When
considering the types of toxicants most likely to enter an anaerobic
treatment unit, this observation is of interest. The 1980 EPA study of
priority pollutants in publicly owned treatment works (U.S. EPA, 1980)'
61
2p 4
2 -
in
3°
D
a
a
sn
a
- 1 0 1 2 3
LOG MICROTOX 5EC50 (mg/L)
• Laboratory Data Q Literature Data
FIGURE 5-1 MICROTOX 5EC50 vs. METHANE INHIBITION
ORGANICS
=P 4
62
-- 3.D
a
y 1 .
8
- 1 0 1 2 3
LOG MICROTOX 5EC50 (rag/L)
Laboratory Data Literature Data
FIGURE 5-2 MICROTOX 5EC50 vs. METHANE INHIBITION
INORGANICS

63
rP 4
0 H
D
a
- 1 0 1 2 3
LOG MICROTOX 5EC50 (mg/L)
• Laboratory Data Q Literature Data
FIGURE 5-3 MICROTOX 5EC50 vs. METHANE INHIBITION
PRIORITY POLLUTANTS
64
,*•"»
sp 4
2:O
E 3 ~is5. -i n
1 : "
in/-\
U U •
3
•
a
a
aa
f»ff
a,.-''' •
^/ a
- 1 0 1 2 3
LOG MICROTOX 5EC50 (mg/L)
• Laboratory Data Q Literature Data
FIGURE 5-4 MICROTOX 5EC50 vs. METHANE INHIBITION
PRIORITY ORGANICS

TABLE 5-1 STATISTICAL SUMMARY
65
Data Set
Literature Review
Literature Data
Laboratory Data
Combined Data
Organics
Inorganics
Priority Pollutants
Priority Organics
39
14
15
29
21
8
17
11
.74
insig
.32
insig
insig
insig
insig
% Data Points More Toxic toAnaerobes
10
29
43
29
13
35
45

66
lists the occurence of priority pollutants in raw sludge samples as a
percentage of times detected. Of the inorganic toxicants reported on
in both this study and the EPA study, the range of percent times
detected was from 32 to 98% with an average detection rate of 82%.
Organic toxicants, on the other hand, had a range of 2-62% with an
average detection rate of 24%.
Because the Microtox test is so short compared to the ATA, the
question arose whether a longer Microtox test might have greater
correlation to the ATA test. Ten chemicals were studied to see if 30
minute Microtox data compared more favorably than 5 minute data.
Statistical analysis showed that the two sets of data did not have any
meaningful differences.
Differences in how anaerobe toxicity was computed were also
studied. The difference in results between using methane data and
total gas data was small (20%). Based on the small difference in
results, and the increased amount of time nessecary to gather daily
methane data, using total gas as a surrogate for methane production
seems to be a reasonable alternative.
The results for this phase of the study showed unusually high
reproducibility between labs for ATA's (very much higher than within
labs). Only 2 data points were available to evaluate inter-lab
reproducibility, and due to the large number of confounding variables
expected between labs, it seems most likely that the closeness of
results is more a matter of luck than anything else.
67
5.2 COMPLEX WASTE
For the most part, the pulp mill waste showed antagonistic
interactions with the various chemicals tested. It is very difficult
to generalize from such limited data, especially when working with
poorly defined toxicants such as PMW. What can be said is that for an
anaerobic treatment unit already under stress from wastes similar to
the PMW used in this study, the additional toxic burden on the
chemicals tested would not be as great as one would otherwise suspect.
This kind of testing may have more application in a situation in which
wastes are to be combined prior to anaerobic treatment. In a case such
as this, testing for synergistic effects could help predict reactor
performance while treating mixed wastes.
5.3 HYDROGEN AND CARBON MONOXIDE DATA
No correlation could be found between Microtox 5EC50 values and
hydrogen and carbon monoxide accumulations in toxified anaerobic
reactors. The use of hydrogen and carbon monoxide monitoring is still
in the early stages of development, and the significance of these gases
as indicators of anaerobic toxicity is still being studied. The
comparison of data was furthur complicated by the variability in
response pattern seen for hydrogen accumulation for different
toxicants. While it is not the intent of this study to explore the
reasons behind this variable response, it does serve to point out the
68
complex nature of toxicity in a mixed culture such as is found in an
anaerobic reactor.
5.4 TOXICITY REDUCTION
Although the toxicity reduction studies did not precede as far as
was hoped, the results do help point out an important consideration for
any treatment process. The sludge used to feed the reactor was not
toxic to Microtox. However, the effluent from the reactor (anaerobic
seed for ATA's) was toxic to Microtox, indicating that changes which
occured due to treatment resulted in toxicty. It is very likely that
the observed effect was a result of sulfate conversion to sulfide, as
evidenced in part by the volatile nature of at least some of the
toxicity. This helps to point out the sometimes conflicting goals of
waste stabilization and toxicity removal.
CHAPTER 6 - CONCLUSIONS
Overall, the results of this study do not indicate that Microtox
would be expected to serve as a particularly good surrogate for the ATA
in monitoring potentially toxic wastes entering an anaerobic treatment
unit. The initial literature review looked promising, but furthur
laboratory work reversed initial impressions. The Microtox may have an
application for monitoring waste streams which may be subject to
inorganic toxicants but are unlikely to be contaminated with organic
toxicants.
The interactive effects of a pulp mill waste and several toxicants
were evaluated. For the most part, the interactions were antagonistic.
However, generalizations to other wastes and their possible interactive
effects can not be made from the limited data available.
No correlation was observed between Microtox data and hydrogen and
carbon monoxide accumulations in toxified anaerobic reactors.
The background toxicity of the anaerobic seed used in this study
was too high to warrant continuing toxicity removal studies. It was
observed that the anaerobic treatment process itself was responsible
for some toxicity.
69
BIBLIOGRAPHY
Atkinson, D.S., Ram, N.M., and Switzenbaum, M.S., "Evaluation of the
Microtox Analyzer for Assessment of Sediment Toxicity," Technical
Report to the Massachusetts Dept. of Environmental Quality
Engineering, University of Massachusetts Environmental Engineering
Report No. 86-85-3, 1985, pp. 1-63.
Balch, W.E., Fox, G.E., Magrum, L.J., Woese, G.R., and Wolfe, R.S., "
Methanogens: Reevaluation of a Unique Biological Group,"
Microbiological Reviews, Vol. 43, 1979, pp. 260-296.
Balderston, W.L., and Payne, W.J., " Inhibition of Methanogenesis in
Salt Marsh Sediments and Whole-Cell Suspensions of Methanogenic
Bacteria by Nitrogen Oxides," Appl. Environ. Microbiol., Vol. 32,
1976, pp. 264-269.
Beckman Inc., "Microtox Application Notes: Microtox EC-50 Values,"
Beckman Instruments Inc., 1983, pp.1-6.
Beckman Inc., " Microtox System Opperating Manual," Beckman
Instruments, Inc., 1982, pp. 1-59.
Benjamin, M.M., Woods, S.L., and Ferguson, J.F., " Anaerobic Toxicity
and Biodegradability of Pulp Mill Waste Constituents," Water Res.,
Vol. 18, 1984, pp.601-607.
Bouwer, E.J., and McCarty, P.L., " Transformations of 1- and 2-Carbon
Halogenated Aliphatic Organic Compounds Under Methanogenic
Conditions," Appl. Environ. Microbiol.. Vol. 45, 1983, pp.
70
71
1286-1294.
Boyd, S.A., Shelton, D.R., Berry, D., and Tiedje, J.M., " Anaerobic
Biodegradation of Phenolic Compounds in Digested Sludge ," Appl.
Environ. Microbiol., Vol. 46, 1983, pp. 50-54.
Bulich, A.A., Greene, M.W., and Isenberg,. D.L., " Reliability of the
Bacterial Bioluminescence Bioassay for the Determination of the
Toxicity of Pure and Complex Effluents," In Aquatic Toxicology and
Hazard Assessment: Fourth Conference, D.R. Branson and K.L. Dickson
(eds.), Amer. Soc. Testing and Materials, Spec. Techn. Publ. 737,
1981, pp. 338-347.
Bulich, A.A., and Isenberg, D.L., " Use of Luminescent Bacterial System
for the Rapid Assessment of Aquatic Toxicity," Instrument soc^ Am.
Trans., Vol. 20, 1981, pp. 29-33.
Capone, D.G., Reese, D.D., and Kiene, R.P.,. " Effects of Metals on
Methanogenesis, Sulfate Reduction, Carbon Dioxide Evolution, and
Microbial Biomass in Anoxic Salt Marsh Sediments," Appl. Environ.
Microbiol.,Vol. 45, 1983, pp. 1586-1591.
Chang, J.C., Taylor, P.B., and Leach, F.R., " Use of the Microtox Assay
System for Environmental Samples," Bull. Environm. Contain. Toxicol.,
Vol. 26, 1981, pp. 150-156.
Chou, W.L., Speece, R.E., Siddiqi, R.H., and McKeon, K., " The Effect
of Petrochemical Structure on Methane Fermentation Toxicity," Prog.
Wat. Tech., Vol. 10, 1978, pp. 545-558.
Curtis, C., Lima, A., Lozano, S.J., and Veith, G.D., " Evaluation of a
72
Bacterial Bioluminescence Bioassay as a Method for Predicting Acute
Toxicity of Organic Chemicals to Fish," In Aquatic Toxicology and
Hazard Assessment: Fifth Conference, J.G. Pearson, R.B. Foster and
W.E. Bishop (eds.)i Amer. Soc. Testing and Materials, Spec. Techn.
Publ. 737, 1982, pp. 170-178.
Dutka, B.J., and Kwan, K.K., " Comparison of Three Microbial Toxicity
Screening Tests with the Microtox Test," Bull. Environ. Contam.
Toxicol. Vol. 27, 1981, pp. 753-757.
Eis, B.J., Ferguson, J.F., and Benjamin, M.M., " The Fate and Effect of
Bisulfate in Anaerobic Treatment," Journal WPCF, Vol. 55, 1983,
pp.1355-1365.
Guthrie, M.A., Kirsch, E.J., Wukasch,R.F., and Grady, C.P.L., " Fate of
Pentachlorophenol in Anaerobic Digestion," "in 1981 National
Conference on Environmental Engineering, F.M. Saunders, (Ed.),
Proceedings of the ASCE Environmental Engineering Division Specialty
Conference Atlanta, Georgia, July 8-10, 1981, published by ASCE, New
York.
Hastings, J.W., and Nealson, K.H., " Bacterial Bioluminescence," Annu.
Rev. Microbiol., Vol. 31, 1977, pp. 549-595.
Hastings, J.W., Potrikus, C.J., Gupta, S.C., Kurfurst, M., and
Makemson, J.C., " Biochemistry and Physiology of Bioluminescent
Bacteria," Adv. Microbial Physiol., Vol. 26, 1985, pp. 235-291.
Healy, J.B., and Young, L.Y., " Anaerobic Biodegradation of Eleven
Aromatic Compounds to Methane," Appl. Environ. Microbiol., Vol.38,

73
1979, pp. 84-89.
Rickey, R.F., The Role of Intermediate and Product Gases as Regulators
and Indicators of Anaerobic Digestion PhD. Dissertation, Dept.
Civil Engineering, Univ. Mass., Amherst, 1987.
Hilpert, R.t Winter, J., and Kandler, 0., " Agricultural Feed Additives
and Disinfectants as Inhibitory Factors in Anaerobic Digestion,"\
Agricultural Wastes, Vol. 10, 1984, pp. 103-116.
Hungate, R.E., " A Role Tube Method for Cultivation of Strict
Anaerobes." Meth. Microbiol., Vol. 3B, 1969, pp. 117-132.
Indorato, A.M., Snyder, K.B., and Usinowicz, P.J., " Toxicity Screening
Using Microtox," First International Symposium on Toxicity Testing
Using Bacteria, at The National Water Research Institute,
Burlington, Ontario, Canada May 1983.
Jackson, S., and Brown, V.M., " Effect of Toxic Wastes on Treatment
Processes and Watercourses," Water Poll. _Cont_., Vol. 69, 1970, p.
292.
Jarrell, K.F., and Hamilton, E.A., " Effect of Gramicidin on
Methanogenesis by Various Methanogenic Bacteria," Appl.
Environmental Microbiology, Vol. 50, 1985, pp. 179-182.
Johnson, L.D. and Young, J.C., " Inhibition of Anaerobic Digestion by
Organic Priority Pollutants ," Journal WPCF.,Vol. 55, 1983,
pp.1441-1449.
Keith, L.H., and Telliard, W.A., " Priority Pollutants I - a
Perspective View," Environmental Science and Technology, Vol. 13,

74
1979, pp. 416-423.
Lebsack, M.E., Anderson, A.D., DeGraeve, G.M., and Bergman, H,L.,
"Comparison of Bacterial Luminescence and Fish Bioassay Results for
Fossil-Fuel Process Waters and Phenolic Constituents," in Aquatic
Toxicology and Hazzard Assessment: Fourth Conference, D.R. Branson
and K.L. Dickson (eds.)i Amer. Soc. for Testing and Materials, Spec.
Techn. Publ. 737, 1981, pp. 348-356.
Lingle, J.W., and Hermann, E.R., " Mercury in Anaerobic Sludge
Digestion ," Journal WPCF..Vol. 47, 1975, pp. 466-471.
McCarty, P.L., " Anaerobic Waste Treatment Fundamentals Part Three:
Toxic Materials and their Control," Public Works, Vol. 95, 1964, pp.
91-94 .
McDermott, G.N., Moore, W.A., Post, M.A., and "Ettinger, M.B., " Copper
and Anaerobic Sludge Digestion ," Journal WPCF.. Vol. 35, 1963, pp.
655-662.
Miller,T.L., and Wolin, M.J., " A Serum Bottle Modification of the
Hungate Technique for Cultivating Obligate Anaerobes," Appl.
Microbiol., Vol. 27, 1974, pp. 985-987.
Mosey, F.E., and Hughes, D.A., " The Toxicity of Heavy Metal Ions to
Anaerobic Digestion," Wat. Pollut. Control, Vol. 74, 1975, pp.
18-33.
Nealson, K.H., and Hastings, J.W., " Bacterial Bioluminescence: Its
Control and Ecological Significance," Microbiol. Rev., Vol. 43,
1979, 496-518.
75
Neiheisel, T.W., Horning, W.B., Petrasek, A.C.,'Asberry, V.R., Jones,
D.A., Marcum, R.L., and Hall, C.T., " Effects on Toxicity of
Volatile Priority Pollutants Added to a Conventional Wastewater
Treatment System, " NTIS 1982.
Owen, W.F., Stuckey, D.C., Healy, J.B.Jr., Young, L.Y., and McCarty,
P.L., "Bioassay for Monitoring Biochemical Methane Potential and
Anaerobic Toxicity," Water Research. Vol. 13, 1979, pp.485-492.
Parkin, G.F., and Speece, R.E., "Modeling Toxicity in Methane
Fermentation Systems," J. Env. Eng. Division. ASCE , Vol 108, 1982,
pp. 515-531.
Parkin, G.F., and Speece, R.E., " Attached Verses Susppended Growth
Anarobic Reactors: Response to Toxic Substances ," Wat, jici Tech.,
Vol.15 ,1983, pp. 261-289.
Parkin, G.F., Speece, R.E., Yang, C.H.J., and Kocher, W.M., " Response
of Methane Fermentation Systems to Industrial Toxicants ," Journal
WPCF., Vol. 55, 1983, pp.44-53.
Pearson, F., Shiun-Chang, C., and Gautier, M., " Toxic Inhibition of
Anaerobic Biodegradation," Journal WFCF., Vol. 52, 1980, pp. 472-482
Peltier, W., and Weber, C.I., " Comparison of the Toxicity of Effluents
to Fish, Invertebrates and Microtox," Aquatic Biology Section
Biological Methods Branch Environmental Monitoring and Support
Laboratory U.S. Environmental Protection Agency Cincinnati, Ohio
July, 1980.

76
Qureshi, A.A., Flood, K.W., Thomson, S.R., Janhurst, S.M., Inniss,
C.S.t and Rokosh, D.A., " Comparison of a Luminescent Bacterial Test
with Other Bioassays for Determining Toxicity of Pure Compounds and
Complex Effluents," In Aquatic Toxicology and Hazard Assessment:
Fifth Conference, J.G. Pearson, R.B. Foster and W.E. Bishop (eds.)»
Amer. Soc. Testing and Materials, Spec. Techn. Publ. 737, 1982, pp.
179-195 .
Ribo, J.M., and Kaiser, K.L.E., " Effects of Selected Chemicals to
Photoluminescent Bacteria and their Correlations with Acute and
Subleathal Effects on Other Organisms," Chemosphere. Vol. 12, 1983,
pp. 1421-1442.
Russell, L.L., Cain, C.B., and Jenkins, D.I., " Impact of Priority
Pollutants on Publicly Owned Treated Works "Processes: A Literature
Review ," Proceedings of the 37th Industrial Waste Conference,
Purdue University, 1982, pp. 871-883.
Samak, Q.M., and Noiseux, R., " Acute Toxicity Measurement by the
Beckman Microtox," Presented at the Seventh Annual Aquatic Toxicity
Workshop in Montreal, Canada, November, 1980.
Sellers, K.E., Studies on the Actions and Interactions of Heavy Metals
on Bioluminescent Bacteria. Thesis, Dept. Civil Engineering, Univ.
Mass., Amherst, 1985.
Sharp, V.F., Statistics for the Social Sciences, Little, Brown and Co.,
Boston, 1979, pp. 381.
Sheehan, K.C., Sellers, K.E., and Ram, N.M., " Establishment of a
77
Microtox Laboratory and Presentation of Several Case Studies Using
Microtox Data," Technical Report to the Massachusetts Dept. of
Environmental Quality Engineering, University of Massachusetts,
Engineering Reopt No. 77-83-8, 1984, pp. 1-76.
Shelton, D.R., and Tiedje, J.M.,"" General Method for Determining
Anaerobic Biodegradation Potential," Appl. Environ. Microbiol., Vol.
48, 1984, pp. 840-848.
Slattery, G.H., " Biomonitoring and Toxicity Testing : Toxicant
Treatability Definition and Measurement," Presented at the WPCF
Analytical Techniques in Water Pollution Control Conference,
Cininnati, Ohio, May 2-3, 1985.
Smith, M.R., and Mah, R.A., " Growth and Methanogenesis by
Methanosarcina Strain 227 on Acetate and Methanol ," Appl. Environ.
Microbiol..Vol. 36, 1978, pp. 870-879 .
Speece, R.E., "Anaerobic Biotechnology for Industrial Wastwater
Treatment," Environ. Sci. Technology, Vol. 17, 1983, pp. 416A-427A.
Speece, R.E., and Parkin, G,F., "The Response of Methane Bacteria to
Toxicity," Proceedings Third International Symposium on. Anaerobic
Digestion, Boston Massachusetts, 14-19 August, 1983.
Stuckey, D.C., Owen, W.F., McCarty, P.L., and Parkin, G.F., " Anaerobic
Toxicity Evaluation by Batch and Semi-Continuous Assays," Journal
WPCF, Vol. 52, 1980, pp.720-729.
Sullivan, D.E., and Lambert, W.P., " Development of a Short Term
Anaerobic Digestion Effects Test," Presented at the WPCF 56th

78
Conference, Industrial Waste Symposia, Atlanta, Georgia, Oct. 3-7,
1983.
Switzenbaum, M.S., "Anaerobic Treatment of Wastewater: Recent
Developments." ASM News, Vol. 49, 1983, pp. 532-536.
Sykes, R.M., and Kirsch, E.J., " Accumulation of Methanogenic
Substrates in CC14 Inhibited Anaerobic Sewage Sludge Digester
Cultures ," Water Res., Vol. 6, 1972, pp. 41-55 .
Taylor, G.T., "The Methanogenic Bacteria," Progress in Industrial
Microbiology, (Bull, M., Editor), Vol. 16, 1982, pp. 231-329.
Thiel, P.G., " The Effect of Methane Analogues on Methanogenesis in
Anaerobic Digestion ," Water Res,, Vol. 3, 1969, pp. 215-223 .
United States Environmental Protection Agency, "Fate of Priority
Pollutants in Publicly Owned Treatment Works : Interim Report, " EPA
- 440/1-80-301, 1980, pp. 1-180.
Varel, V.H., and Hashimoto, A.G., " Methane Production by Fermentor
Cultures Acclimated to Waste from Cattle Fed Monensin, Lasalocid,
Salinomycin, or Avoparcin ," Appl_._ Environ. Microbiol., Vol. 44,
1982, pp. 1415-1420.
Vasseur, P., Ferard, J.F., Vail, J., and Larbaight, G., "Comparison of
Bacterial Luminescence and Daphnia Bioassay Results for Industrial
Wastewaters Toxicity Assessment, " Environmental Pollution, Vol. 34,
1984, pp. 225-235
Vogel, T.M., and McCarty, P.L., "Biotransformation of
Tetrachloroethylene to Trichloroethylene, Dichloroethylene, Vinyl

79
Chloride, and Carbon Dioxide under Methanogenic Conditions," Appl.
Environ. Microfaiol., Vol. 49, 1985, pp. 1080-1083.
Wang, Y.T., Suidan, M.T., and Pfeffer, J.T., "Anaerobic Biodegradation
of Indole to Methane," Appl. Environ. Microbiol., Vol. 48, 1984, pp.
1058-1060.
Yang, J., Speece, R.E., Parkin, G.F., Gossett, J., and Kocher, W., "
The Response of Methane Fermentation to Cyanide and Chloroform,"
Prog. Wat. Technol., Vol. 12, 1980, pp. 977-989.
Zinder, S.H., Anguish, T., and Cardwell, S.C., "Selective Inhibition by
2-Bromoethanesulfonate of Methanogenesis for Acetate in a
Thermophilic Anaerobic Digester," Appl, Environ._ Microbiol., Vol 47,
1984, pp. 1343-1345.