assessment of the impact of applying attenuation...
TRANSCRIPT
Assessment of the impact of applying attenuation correction on the accuracy of activity recovery in Tc99m-ECD brain SPECT of healthy
subject using Statistical Parametric Mapping (SPM)
Faezeh Vedaei1, 2, Alireza Kamali asl1, Faraz Kalantari3,4, Mojtaba Ansari5, Mohammad Reza Ay2, 3, 6
1Department of Nuclear Engineering, Shahid Beheshti University, Tehran, Iran 2Research Center for Science and Technology in Medicine,
Tehran University of Medical Sciences, Tehran, Iran 3Research Institute for Nuclear medicine, Tehran University of Medical Sciences, Tehran, Iran
4Department of Medical Physics, Tarbiat Modares University, Tehran, Iran 5Department of Nuclear Medicine, Imam Hosein Hospital,
Shahid Beheshti Universuty of Medical Sciences, Tehran, Iran 6Departments of Medical Physics and Biomedical Engineering, , School of Medicine,
Tehran University of Medical Sciences, Tehran, Iran
(Received 1 November 2011, Revised 2 December 2011, Accepted 6 December 2011)
ABSTRACT
Introduction: Photon attenuation in tissues is the primary physical degrading factor limiting both visual qualitative interpretation and quantitative analysis capabilities of reconstructed Single Photon Emission Computed Tomography (SPECT) images. The aim of present study was to investigate the effect of attenuation correction on the detection of activation foci following statistical analysis with SPM. Methods: The study population consisted of twenty normal subjects (11 male, 9 female, and age 30-40 years). SPECT images were reconstructed using filter back projection and attenuation correction was done by the Chang method. The SPECT imagings was obtained 20 min after intravenous injection of 740-1110 MBq (20-30 mCi) of Tc99m-ECD and were acquired on 128×128 matrices with a 20% symmetric energy window at 140 keV. These data publicly distributed by the Society of Nuclear Medicine of Toronto Hospital. The data was standardized with respect to the Montreal Neurological Institute (MNI) atlas with a 12 parameter affine transformations. Images were then smoothed by a Gaussian filter of 10 mm FWHM. Significance differences between SPECT images were estimated at every voxel using statistical t-test and p-value as the significant criteria was set at 0.05. Results: The contrast comparing non attenuation corrected to attenuation corrected images suggest that regional brain perfusion activity increase in the cerebrum, frontal (T-value 12.06) , temporal (T-value 10.63) and occipital (T-value 9.31) lobe and decrease in the sub-lobar, extra-nuclear (T-value 17.46) and limbic lobe, posterior cingulate (T-value 17.46) before attenuation correction compare with attenuation correction. Conclusion: It can be concluded that applying attenuation correction in brain SPECT can effectively improve the accuracy of the detection of activation area (p<0.05). Keywords: SPM, SPECT, Attenuation correction, Activation foci
Iran J Nucl Med 2011;19(2):52-59
Corresponding author: Mohammad Reza Ay, PhD, Department of Medical Physics and Biomedical Engineering, School of Medicine, Tehran University of Medical Sciences, Tehran, Iran. E-mail: [email protected]
Orig
inal A
rticle

Attenuation correction in brain SPECT Vedaei et al.
Iran
J N
ucl M
ed 2
011,
Vol
19,
No
2 (S
eria
l No
36)
53
INTRODUCTION
Single Photon Emission Computed Tomography (SPECT) has become an important tool in neuroimaging and is today considered as a powerful method both in clinical and research application. Although visual inspection is often adequate to investigate regional cerebral blood flow (rCBF) in brain perfusion study, quantification might improve the diagnostic accuracy of SPECT studies. In principle quantification of brain SPECT studies could help to diagnose the disease in the early pre-clinical stages, also this permits a follow-up of the progression of disease and to investigate the effects of medical care strategies (1, 2). In the last few years quantitative analysis of brain perfusion SPECT has become active research topic popularity. SPECT submits the capability of quantitative measurement of tracer concentration in-vivo. Quantification is influenced by some of physical degrading factors such as attenuation and scattering photons that causes decline the accuracy of visual qualitative interpretation and quantitative analysis of reconstructed SPECT imaging. There are some visual reports describing the effects of attenuation on detection of activation in brain perfusion SPECT imaging. In principle these degradations can be corrected by some correction methods, which so enable more reliable quantification. Although other degrading factors may be corrected during the reconstruction steps, attenuation and scatter correction are done by special techniques that can be included in the reconstruction algorithm (3-5). In clinical practice Filtered back-projection (FBP) has been used and is still used regularly in quantitative dynamic studies. Because of attenuation in brain is approximately uniform, Chang’s method is used in most commercial systems, which simply calculates the average correction factor at
each pixel and correction is done by dividing this factor at each pixel (4).Quantitative investigations can describe more detail of these procedures. Statistical Parametric Mapping (SPM) is well known software, freely available and strongly supported by many brains imaging researcher. It offers quantitative voxel-by-voxel analysis in neuroimaging using a “general linear model” and is Matlab (The MathWorks Inc,Natick, MA, USA) base popular software for performing neuroimaging studies. This method used to locate significant effects of statistical parametric models in images. The SPM was developed by the Methodology Group at the Wellcome Department of Cognitive Nuerology UK, for statistical analysis of functional human brain images acquired from SPECT, Positron Emission Tomography (PET) and functional Magnetic Resonance Imaging (fMRI). Although some researcher has surveyed qualitatively the effects of attenuation and the necessity of apply attenuation correction on activation brain SPECT study, in this study we quantitatively assessed the influence of attenuation in brain study and also investigate the effect of attenuation correction on the detection of activation foci following statistical analysis with SPM (6, 7).
METHODS Subject population We studied 20 normal subjects (11 male, 12 female, mean ages 35 year) healthy volunteers with no neurologic or psychiatric disorders. We access these data from the society of Nuclear Medicine of Toronto Hospital and are available on http://brainscans.indd.org (December 2011). Imaging protocol An injection of 740-1110 MBq (20-30mCi) of 99mTc-ECD was given into an arm vein in

Attenuation correction in brain SPECT Vedaei et al.
Iran
J N
ucl M
ed 2
011,
Vol
19,
No
2 (S
eria
l No
36)
54
all subjects. 20 minutes after the injection of 99mTc-ECD, brain SPECT was performed using a triple detector camera equipped with low-energy high-resolution collimators. A total of 120projection were acquired in a 128×128 matrix. All SPECT data were reconstructed using filtered back projection and Butterworth filter of order 4.0 and cut-off 0.26 (cycle/pixel). Attenuation was corrected using Chang’s first-order method (attenuation coefficient, μ = 0.12 cm-1). The true value of μ for narrow beam is about 0.16 cm-1, however this value decreases due to the presence of scattered photon. Therefore we used effective attenuation coefficient which is about 0.12 cm-1. The Chang’s method involves multiplication by a correction factor at each point (x, y) of the image f(x, y) after reconstruction. It has been shown that this algorithm can be applied successfully in uniform and symmetric organs such as the brain. Chang’s AC method is presented mathematically by the equation 1.
Eq. 1 In this equation, fAC represent corrected image, M is the number of projection, is the linear attenuation coefficient and li is the depth of point (x, y) inside the brain from the jth projection. No additional scatter correction was applied to the reconstructed images, since scattering effect was considered in effective linear attenuation coefficient (6, 8). Image analysis Reconstructed images were converted into ANALYZE format by means (X)MedCon, and the Statistical Parametric Mapping SPM8 (Welcome Department of Cognitive Neurology institute of Neurology, London, UK) was used to determine activation foci and difference between two group of images
(9). All images were transformed into the normalizing anatomical space of the stereostaxic brain atlas, and then smoothed with SPM software using an isotropic Gaussian filter (full with at half maximum of 10mm). The filter was adjusted for individual differences in global blood flow (images scaled to an overall mean for CBF of 50ml/100g/min) using proportional scaling. Statistics across the entire brain were then displayed as T score and performed on a voxel-by-voxel basis for all voxels common to all subjects. The set of threshold was corrected to p<0.05 (for voxel height) (10). The identified regions provided by SPM analysis were created and transformed into a common standard space with 3D anatomical data and into the Talairach coordinate system. The anatomical terms of the identified regions can be found by referring to the Talairach coordinate system. The Talairach coordinates, which are describe with X, Y, Z values in each table, indicate approximate landmarks of location of the bin structures. In short, the Y coordinate axis is defined as a straight horizontal line between the anterior commissure (AC) and posterior commissure (PC). The anterior part from anterior commissure has positive Y value and the posterior part from anterior commissure has negative Y values. The X coordinate axis is defined as a horizontal straight line which passes the anterior commissure and makes a right angle with the Y axis. The Z coordinate axis is defined as a vertical straight line which passes the anterior commissure and makes a right angle with the Y axis. The right and left hemisphere from anterior commissure has positive and negative X value, respectively, and the superior and inferior part from AC has positive and negative Z values, respectively. The anterior commissure’s coordinate is describe as (X, Y, Z=0, 0, 0) and distances in Talairach coordinates are measured from the anterior commissure. The T score, which is also describe in the table is a

Attenuation correction in brain SPECT Vedaei et al.
Iran
J N
ucl M
ed 2
011,
Vol
19,
No
2 (S
eria
l No
36)
55
dimensionless quantity derived by subscribing the population mean from a individual row score and then dividing the difference by the population standard deviation, an observation is above or below the mean. The larger the absolute values of T score is the larger the gap from the mean value of distribution (11, 12). Figure 1. Reconstructed images of a typical brain before AC (above) and after AC (below) in three standard plane, transverse (top), coronal (middle) and sagittal (bottom).
RESULTS Figure 1 shows reconstructed images of a typical brain before AC and after AC in three standard planes transverse, coronal and sagittal. Figure 2 shows pixel values along a vertical line profile passing from the center of brain image in transverse plane before and after AC. As shown in these figures attenuation especially affects the central regions of brain, whereas the regions around the brain are less affected causing these regions to appear more active.
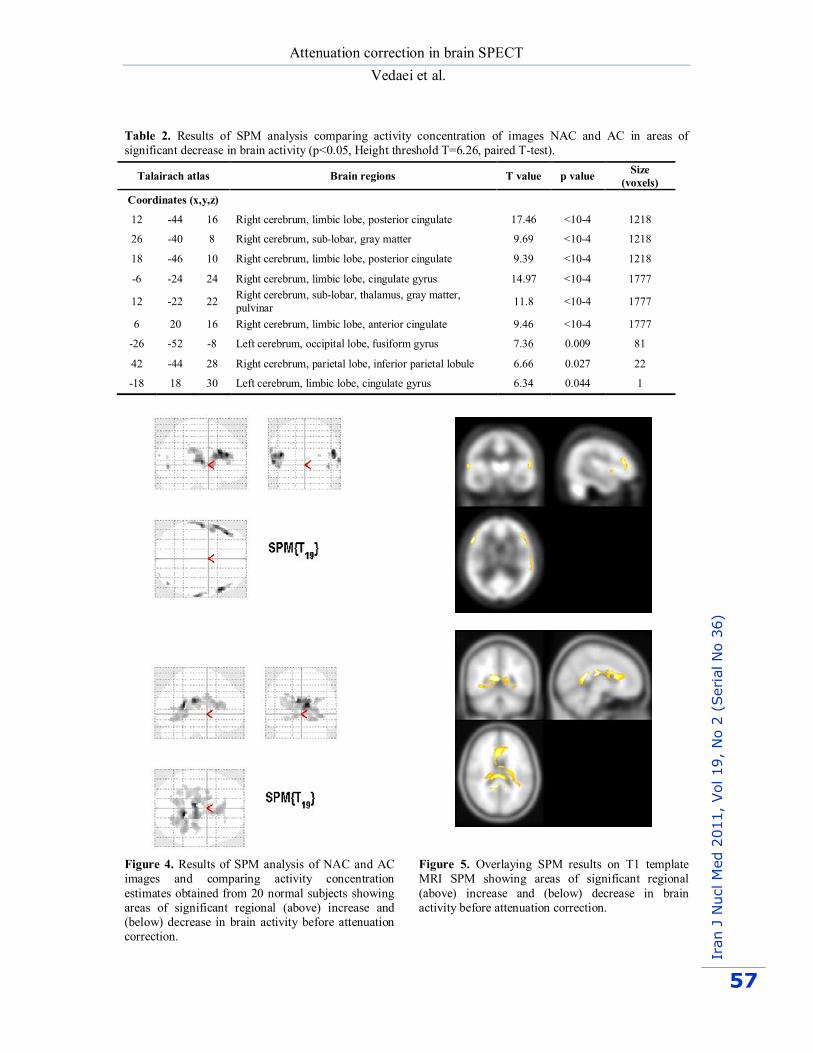
Figure 2. Pixel values along a vertical line profile passing from the center of brain image in transverse plane before and after AC. Figure 3 shows the difference images by subtraction of AC image from non AC image. More intense pixels in center of images show the effect of AC in that region. Figure 4 shows the result of quantitative SPM analysis comparing activity concentration between two groups of images with and without attenuation correction obtained from twenty normal subjects. This expresses that in the sub-lobar, extra nuclear; occipital lobe, fusiform gyrus; inferior parietal lobule; frontal lobe, sub-gyral; limbic lobe, posterior cingulate and limbic lobe, cigulate gyrus counts are more reduced and in the assessment of brain activation studies theses regions are less active, also in the more parietal structures

Attenuation correction in brain SPECT Vedaei et al.
Iran
J N
ucl M
ed 2
011,
Vol
19,
No
2 (S
eria
l No
36)
56
Figure 3. Difference images by subtraction of AC image from non AC image. More intense pixels in center of images show the effect of AC in these regions. Table 1. Results of SPM analysis comparing activity concentration of images NAC and AC in areas of significant increase in brain activity (p<0.05, Height threshold T=6.26, paired T-test).
Talairach atlas Brain regions T value p value Size (voxels)
Coordinates (x,y,z) 54 22 22 Right cerebrum, frontal lobe, inferior frontal gyrus 12.06 <10-4 182
-44 36 18 Left cerebrum, frontal lobe, middle frontal gyrus 11.69 <10-4 716
-58 -12 6 Left cerebrum, temporal lobe, superior temporal gyrus 10.63 <10-4 716
-56 16 16 Left cerebrum, frontal lobe, inferior frontal gyrus 9.68 <10-4 716
66 -20 8 Right cerebrum, temporal lobe, superior temporal gyrus 9.31 0.001 85
62 -6 -2 Right cerebrum, temporal lobe, superior temporal gyrus 6.98 0.016 19
46 -76 14 Right cerebrum, temporal lobe, middle temporal gyrus 6.72 0.024 7
-56 2 32 Left cerebrum, frontal lobe, precentral gyrus 6.71 0.025 5
52 -62 0 Right cerebrum, temporal lobe, middle temporal gyrus 6.61 0.029 1
64 -38 36 Right cerebrum, parietal lobe, inferior parietal lobule 6.38 0.042 2
-60 -42 2 Left cerebrum, temporal lobe, middle temporal gyrus 6.32 0.046 2
26 -94 16 Right cerebrum, occipital lobe, middle occipital gyrus 6.8 0.021 6
44 -76 -2 Right cerebrum, occipital lobe, inferior occipital gyrus 8.4 0.002 30
such as inferior and middle frontal gyrus; superior, middle and inferior temporal gyrus and inferior and middle occipital gyrus in the cerebellum more counts are detected and it seems these regions are more active. Quantitative results of this investigation are given in Table 1 and Table 2. The brain structures were determined from the stereotactic coordinates with respect to Talairach and Tournoux atlas which is
coordinate-based system regularly used in the human brain studies (p<0.05). The quantitative study showed that photon attenuation in the brain causes artifact in brain perfusion study. As shown in Figure 4 the central regions of the brain is more affected by attenuation causing wrong interpretation as hypoperfusion in these areas (p<0.05).
Attenuation correction in brain SPECT Vedaei et al.
Iran
J N
ucl M
ed 2
011,
Vol
19,
No
2 (S
eria
l No
36)
57
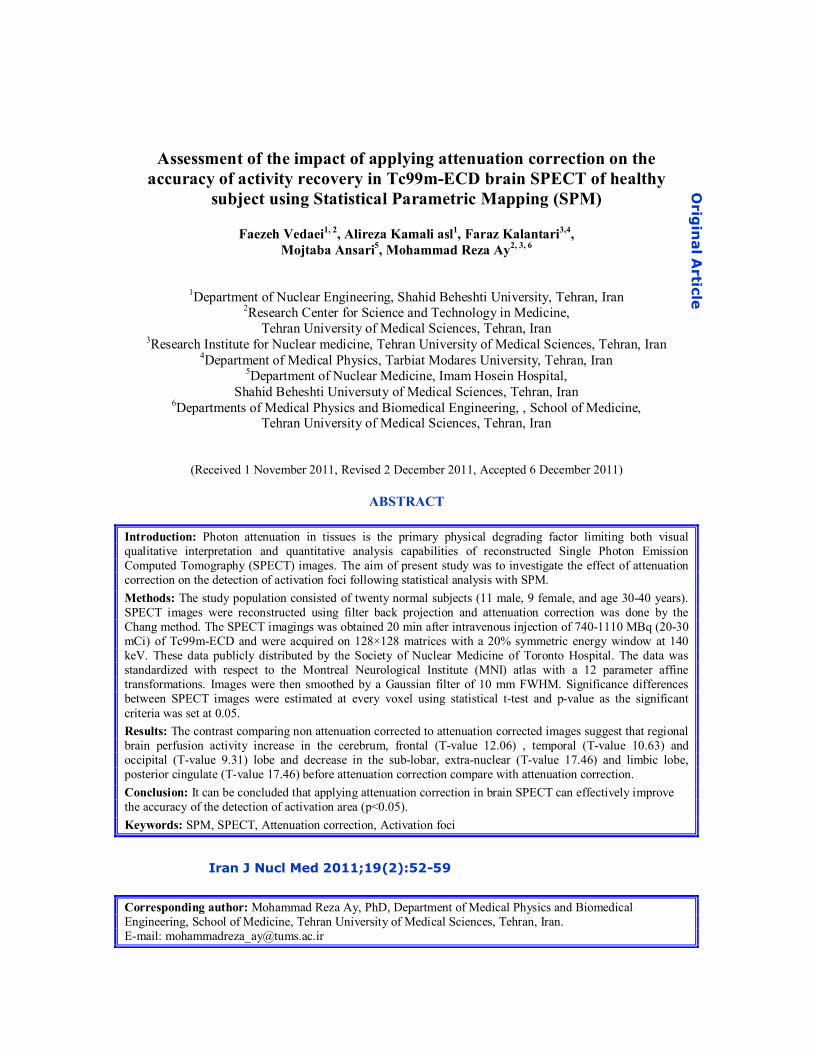
Table 2. Results of SPM analysis comparing activity concentration of images NAC and AC in areas of significant decrease in brain activity (p<0.05, Height threshold T=6.26, paired T-test).
Talairach atlas Brain regions T value p value Size (voxels)
Coordinates (x,y,z) 12 -44 16 Right cerebrum, limbic lobe, posterior cingulate 17.46 <10-4 1218
26 -40 8 Right cerebrum, sub-lobar, gray matter 9.69 <10-4 1218
18 -46 10 Right cerebrum, limbic lobe, posterior cingulate 9.39 <10-4 1218
-6 -24 24 Right cerebrum, limbic lobe, cingulate gyrus 14.97 <10-4 1777
12 -22 22 Right cerebrum, sub-lobar, thalamus, gray matter, pulvinar 11.8 <10-4 1777
6 20 16 Right cerebrum, limbic lobe, anterior cingulate 9.46 <10-4 1777
-26 -52 -8 Left cerebrum, occipital lobe, fusiform gyrus 7.36 0.009 81
42 -44 28 Right cerebrum, parietal lobe, inferior parietal lobule 6.66 0.027 22
-18 18 30 Left cerebrum, limbic lobe, cingulate gyrus 6.34 0.044 1
Figure 4. Results of SPM analysis of NAC and AC images and comparing activity concentration estimates obtained from 20 normal subjects showing areas of significant regional (above) increase and (below) decrease in brain activity before attenuation correction.
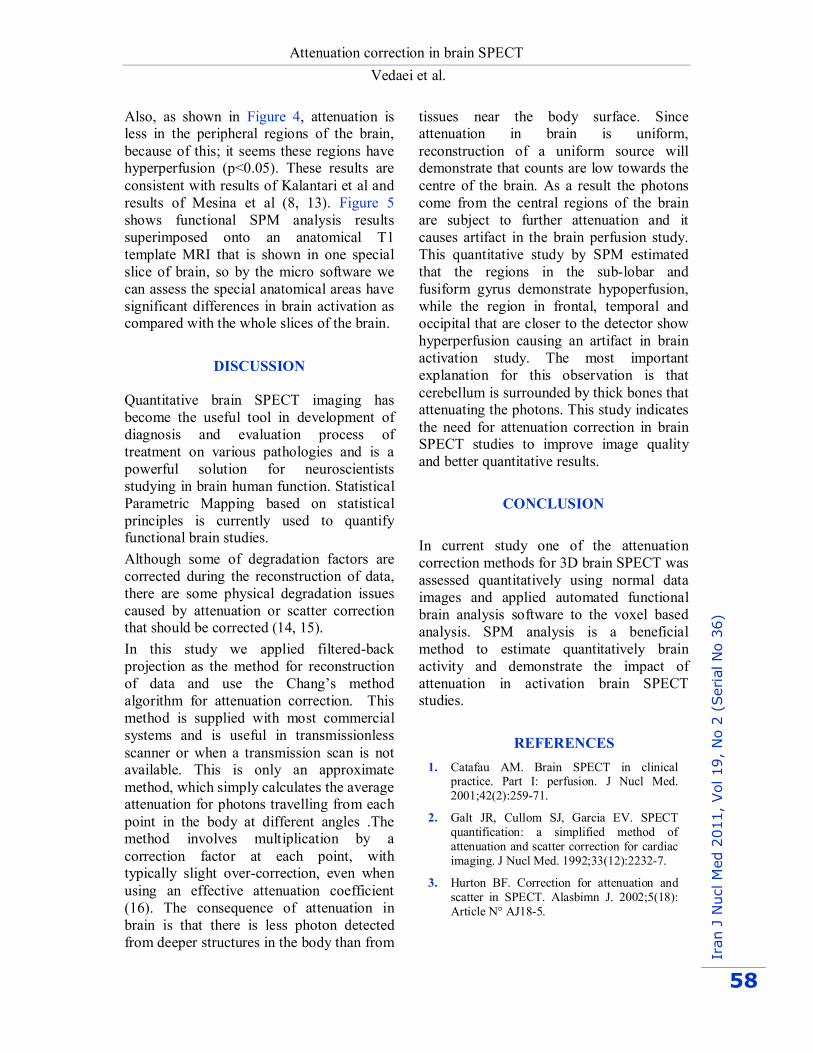
Figure 5. Overlaying SPM results on T1 template MRI SPM showing areas of significant regional (above) increase and (below) decrease in brain activity before attenuation correction.
Attenuation correction in brain SPECT Vedaei et al.
Iran
J N
ucl M
ed 2
011,
Vol
19,
No
2 (S
eria
l No
36)
58
Also, as shown in Figure 4, attenuation is less in the peripheral regions of the brain, because of this; it seems these regions have hyperperfusion (p<0.05). These results are consistent with results of Kalantari et al and results of Mesina et al (8, 13). Figure 5 shows functional SPM analysis results superimposed onto an anatomical T1 template MRI that is shown in one special slice of brain, so by the micro software we can assess the special anatomical areas have significant differences in brain activation as compared with the whole slices of the brain.
DISCUSSION Quantitative brain SPECT imaging has become the useful tool in development of diagnosis and evaluation process of treatment on various pathologies and is a powerful solution for neuroscientists studying in brain human function. Statistical Parametric Mapping based on statistical principles is currently used to quantify functional brain studies. Although some of degradation factors are corrected during the reconstruction of data, there are some physical degradation issues caused by attenuation or scatter correction that should be corrected (14, 15). In this study we applied filtered-back projection as the method for reconstruction of data and use the Chang’s method algorithm for attenuation correction. This method is supplied with most commercial systems and is useful in transmissionless scanner or when a transmission scan is not available. This is only an approximate method, which simply calculates the average attenuation for photons travelling from each point in the body at different angles .The method involves multiplication by a correction factor at each point, with typically slight over-correction, even when using an effective attenuation coefficient (16). The consequence of attenuation in brain is that there is less photon detected from deeper structures in the body than from
tissues near the body surface. Since attenuation in brain is uniform, reconstruction of a uniform source will demonstrate that counts are low towards the centre of the brain. As a result the photons come from the central regions of the brain are subject to further attenuation and it causes artifact in the brain perfusion study. This quantitative study by SPM estimated that the regions in the sub-lobar and fusiform gyrus demonstrate hypoperfusion, while the region in frontal, temporal and occipital that are closer to the detector show hyperperfusion causing an artifact in brain activation study. The most important explanation for this observation is that cerebellum is surrounded by thick bones that attenuating the photons. This study indicates the need for attenuation correction in brain SPECT studies to improve image quality and better quantitative results.
CONCLUSION
In current study one of the attenuation correction methods for 3D brain SPECT was assessed quantitatively using normal data images and applied automated functional brain analysis software to the voxel based analysis. SPM analysis is a beneficial method to estimate quantitatively brain activity and demonstrate the impact of attenuation in activation brain SPECT studies.
REFERENCES 1. Catafau AM. Brain SPECT in clinical
practice. Part I: perfusion. J Nucl Med. 2001;42(2):259-71.
2. Galt JR, Cullom SJ, Garcia EV. SPECT quantification: a simplified method of attenuation and scatter correction for cardiac imaging. J Nucl Med. 1992;33(12):2232-7.
3. Hurton BF. Correction for attenuation and scatter in SPECT. Alasbimn J. 2002;5(18): Article N° AJ18-5.

Attenuation correction in brain SPECT Vedaei et al.
Iran
J N
ucl M
ed 2
011,
Vol
19,
No
2 (S
eria
l No
36)
59
4. Chang LT. A method of attenuation correction in radionuclide computed tomography. IEEE T Nucl Sci. 1978;25:638-43.
5. Budinger TF. Physical attributes of single-photon tomography. J Nucl Med. 1980;21(6):579-92.
6. Bouwens L, Van de Walle R, Nuyts J, Koole M, D'Asseler Y, Vandenberghe S et al. Image-correction techniques in SPECT. Comput Med Imaging Graph. 2001;25(2):117-126.
7. Fristen KJ, Holmes AP, Worsley KJ, Poline JP, Frith CD, Frackowiak RSJ. Statistical parametric maps in functional imaging: A general linear approach. Hum Brain Mapp. 1995;2:189-210.
8. Kalantari F, Rajabi H, Saghari M. Quantification and reduction of attenuation related artifacts in SPET by applying attenuation model during iterative image reconstruction: a Monte Carlo study. Hell J Nucl Med. 2011;14(3):278-83.
9. Van Laere K, Versijpt J, Audenaert K, Koole M, Goethals I, Achten E et al. 99mTc-ECD brain perfusion SPET: variability, asymmetry and effects of age and gender in healthy adults. Eur J Nucl Med. 2001;28(7):873-87.
10. Mozley PD, Sadek AM, Alavi A, Gur RC, Muenz LR, Bunow BJ et al. Effects of aging on the cerebral distribution of technetium-99m hexamethylpropylene amine oxime in healthy humans. Eur J Nucl Med. 1997;24(7):754-61.
11. Lancaster JL, Woldorff MG, Parsons LM, Liotti M, Freitas CS, Rainey L et al. Automated Talairach atlas labels for functional brain mapping. Hum Brain Mapp. 2000;10(3):120-31.
12. Imon Y, Matsuda H, Ogawa M, Kogure D, Sunohara N. SPECT image analysis using statistical parametric mapping in patients with Parkinson's disease. J Nucl Med. 1999;40(10):1583-9.
13. Mesina CT, Boellaard R, van den Heuvel OA, Veltman DJ, Jongbloed G, van der Vaart AW et al. Effects of attenuation correction and reconstruction method on PET activation studies. Neuroimage. 2003;20(2):898-908.
14. Montandon ML, Zaidi H. Atlas-guided non-uniform attenuation correction in cerebral 3D PET imaging. Neuroimage. 2005;25(1):278-86.
15. Bai J, Hashimoto J, Ogawa K, Kubo A, Fukunaga A, Onozuka S et al. Influence of photon scattering and attenuation on ROI analysis in brain perfusion single-photon emission tomographic imaging of normal subjects. Ann Nucl Med. 2005;19(7):567-72.
16. Stodilka RZ, Kemp BJ, Prato FS, Kertesz A, Kuhl D, Nicholson RL. et al. Scatter and attenuation correction for brain SPECT using attenuation distributions inferred from a head atlas. J Nucl Med. 2000;41(9):1569-78.