assessment of the conduct, structure, and performance of
TRANSCRIPT

26 Comparative Market and Industry Analysis of Traditional Taxi Services and Transportation Network Vehicle Services in Metro Manila
LAPSED USAGE You mentioned earlier that you have tried using (TYPE) but have not done so in the past 4
weeks. Why have you not used (TYPE) lately? Why else? What about (TYPE) prevents you from using it lately? Do you remember your first time to use [TYPE]? Can you tell us about what led you to use it? What problems have you encountered when you rode (TYPE)? How did you overcome these
problems? And what positive experiences have you had when you rode (TYPE)? What about it made it
a good experience? What would it take for you to use (TYPE) again? Why? Anything else?
CURRENT USAGE You mentioned earlier that you continue to use (TYPE) and have done so in the past 4 weeks.
Why do you continue to use (TYPE)? Why else? Do you remember your first time to use [TYPE]? Can you tell us about what led you to use it? And what positive experiences have you had when you rode (TYPE)? What about it made it
a good experience? What problems have you encountered when you rode (TYPE)? How did you overcome these
problems? What things do you wish [TYPE] would do to make its service better?
COMPARATIVE EVALUATION (10 mins) If you were to compare TAXI, UBER and GRAB services, what are the similarities between
them? How else are they similar? What about their differences? How are TAXI, UBER and GRAB services different from each
other? How else are they different?o In what ways is a TAXI better than GRAB or UBER?o In what ways is UBER better than a TAXI or GRAB?o And in what ways is GRAB better than UBER or a TAXI?
If you are to rank these three types of services? Which will be your top choice? What makes(TYPE) your top choice? Why else?
And which will be your second choice? Why is this? Why is (TYPE) your bottom choice? Why else?
WRAP UP (10 mins) Anything else you would like to add on any of the topics we discussed today?
Thank respondent
Philippine Management Review 2018, Vol. 25, 27-52.
Assessment of the Conduct, Structure, and Performance of the Philippine Telecommunications Industry
Regina M. Lizares*University of the Philippines, Cesar E.A. Virata School of Business, Diliman, Quezon City 1101, Philippines
An application of the Structure-Conduct-Performance approach on the nationwide Philippine telecommunications industry, for the period 2011 to 2016, showed that the market structure is highly concentrated, with significant barriers to entry, such as capital, regulatory, and legal requirements. These entry barriers lower market contestability, or the threat of a new entrant challenging the incumbents. Nevertheless, the incumbents foil each other from exercising excessive market power of raising prices, or reducing service quantity/quality. Market structure strongly influences the incumbents’ conduct, with the two players mirroring each other’s strategic behaviors, particularly in terms of product and pricing, and service quality. Both market structure and incumbents’ conduct impact the market performance, with industry EBITDA margins, return on equity, and return on assets having been healthy.
Keywords: Market Structure, Conduct, Performance, Telecommunications Industry, Philippines
1 Introduction
The telecommunication (telecom) sector plays a critical role in contributing directly to the Philippine economy. An International Telecommunication Unit (ITU, 2012) study estimated telecom revenues account for 2.5% (or USD 5.3 billion) of the country’s Gross Domestic Product (GDP), contribute about USD 267 million annually to economic growth, generate 1.0% of total tax collections, and employ 525,000 skilled workers and professionals.
Indirectly, the societal importance of telecoms is well accepted and broadly understood, reflected in its near-ubiquitous penetration and use. One, it delivers a technological foundation for communications, which plays a central role in the fundamental operations of a society ─ from business to government to families. Two, it enables participation, and development of people in communities disadvantaged by geography. Three, it provides vital infrastructure for national security ─ from natural disaster recovery, to communication of vital intelligence (Lucky & Eisenberg, 2006).
For the period 2011 to 2016, several significant changes occurred in the Philippine telecom industry. Mobile density increased over the five year period from 99% to 124%, aided by: (1) sustained annual capital expenditure (capex) of the telecom companies (telcos) of over 20% of service revenue for the period 2014 to 2015; and (2) innovative buffet pricing and product bundles to attract and retain customers. Though telecom prices decreased and quality improved, compared to other countries, prices remain moderately high, serving as a barrier to usage, and quality was still relatively poorer. Regulators, who can influence these prices and quality, and overall industry competition, were passive and behaved administratively, and were not pro-active policy formulators and implementers (Patalinghug & de Llanto, 2005).
This paper aims to assess this condition existing in the Philippine telecom industry using the Structure-Conduct-Performance (SCP) framework. The SCP approach suggests that the industry’s performance, the success of an industry in producing benefits for consumers, depends on the conduct, behavior of sellers and buyers, which depends on the structure of the market. The structure, in turn, depends on basic conditions, such as technology and demand for a product. Typically, structure is summarized by the number of firms, or some other measure of the distribution of firms, such as the relative market shares of the largest firms. Developed by Edward Mason in the 1930s, the SCP approach revolutionized the study of industrial organization (IO) by introducing the use of inferences from microeconomic analysis (Perloff, Karp, & Golan, 2007).
*Correspondence: Tel: +63 2 928 4571; Fax: +63 2 929 7991. Email: [email protected]

28 Assessment of the Conduct, Structure, and Performance of the Philippine Telecommunications Industry
Despite its ground-breaking contribution, SCP received criticism for being descriptive rather than theoretical, as the nature of these connections is usually not explained in detail (Perloff et al ., 2007). Furthermore, it was criticized for being static, deterministic, and limited in its view: (1) static, given its cross-sectional perspective in explaining the industry performance that result from a given industry structure; (2) deterministic, as it took industry structure as exogenously given, and firms having no latitude to alter the state of affairs; and (3) limited, with only a relatively few, critical aspects of structure explored, such as firm concentration and entry barriers (Porter, 1981).
These criticisms on the SCP approach spurred the expansion of the IO field. Criticism on SCP being empirically focused encouraged the growth in IO theoretical research, with economists developing price-theory models, analyzing industry with emphasis on monopolistic competition, game theory, or transaction costs (Perloff et al., 2007). Also, the criticisms on SCP being static, deterministic, and limited stimulated the development of: dynamic models of industry evolution; feedback effects of firm conduct (strategy) on market structure; and a richer set of elements (e.g., exit barriers, vertical bargaining relationship with suppliers and buyers) of industry structure important to competitive interaction being investigated (Porter, 1981). In the end, the conventional SCP approach uncovered many stable, robust, and empirical regularities; it also taught much about how markets look (Schmalensee, 1989).
This paper’s use of the SCP approach follows from Bain’s pioneering empirical tradition of relating aspects of industry structure to conduct and performance (usually profitability), and the other hundreds of studies that his approach encouraged, that forms the backbone of IO literature (Porter, 1981). SCP is ideal given the limited time frame of this paper’s data set, 2011 to 2016.
The definition of the market of interest1 is key in the SCP approach. The markets of interest for the telecom industry are the mobile-cellular and fixed line operators, providing voice and data (broadband) services2. Galla (2016) asserted that the Philippines telecom industry is currently heavily dominated by mobile communication, with the players shifting their emphasis from legacy telecoms of voice and short messaging, to data services, and internet connectivity. To the extent data is available, discussion is further subdivided to cover the prepaid and the postpaid markets. Due to the level of data disclosed by the telcos, the market cannot be subdivided into retail and wholesale. Lastly, the geographic scope of the market is national.
This paper divides into 5 sections: Section 2 covers Structure, Section 3 Conduct, and Section 4 Performance. Lastly, Section 5 concludes this paper.
1.1 Evolution of the Philippine Telecom Industry The Philippines’ telecom industry expanded rapidly since its liberalization in the 1980s, when
consumers waited up to 10 years for a landline connection and service quality was generally poor. A series of telecom reform from 1989 to 19953 opened up the industry, and saw an expansion in the number of players. This eroded the dominant operator, Philippine Long Distance and Telephone Company’s (PLDT) market share, particularly during the past decade, as consumer preferences shifted increasingly towards mobile broadband and digital services, disrupting traditional voice and SMS streams (Oxford Business Group, 2017). However, the fragmentation and lack of economies of
1 Telecom industry encompasses multiple service providers, including telephone companies, cable system operators, internet service providers, wireless carriers, and satellite operators. It also now includes software-based applications with a communications emphasis, and intermediate layers of software incorporated into end-to-end communication services. It also includes suppliers of telecoms equipment, and software products sold directly to consumers, and also to service providers, as well as the telecoms service providers (Lucky & Eisenberg, 2006). 2 They also provide interconnection services, but this service is not discussed in this paper. 3 In 1989, the NTC awarded two international gateway facility license to two non-PLDT players. In 1992, Congress granted franchises to the following mobile carriers: Piltel, Smart, Globe, Islacom, and Extelcom. In 1993, then President Ramos signed two EOs: 1) EO 59 mandated the compulsory interconnection of authorized public telecoms carriers in order to create a universally accessible, and fully integrated nationwide telecoms network; and 2) EO 109 required all mobile-cellular operators to install at least 400,000 telephone lines within three years, and International Gateway Facility (IGF) operators to put up 300,000 lines within five years. In 1995, RA 7923 The Public Telecommunications Act was passed; it sought to promote and govern the development of the telecoms industry, and to improve the delivery of telecoms services.
Regina M. Lizares 29
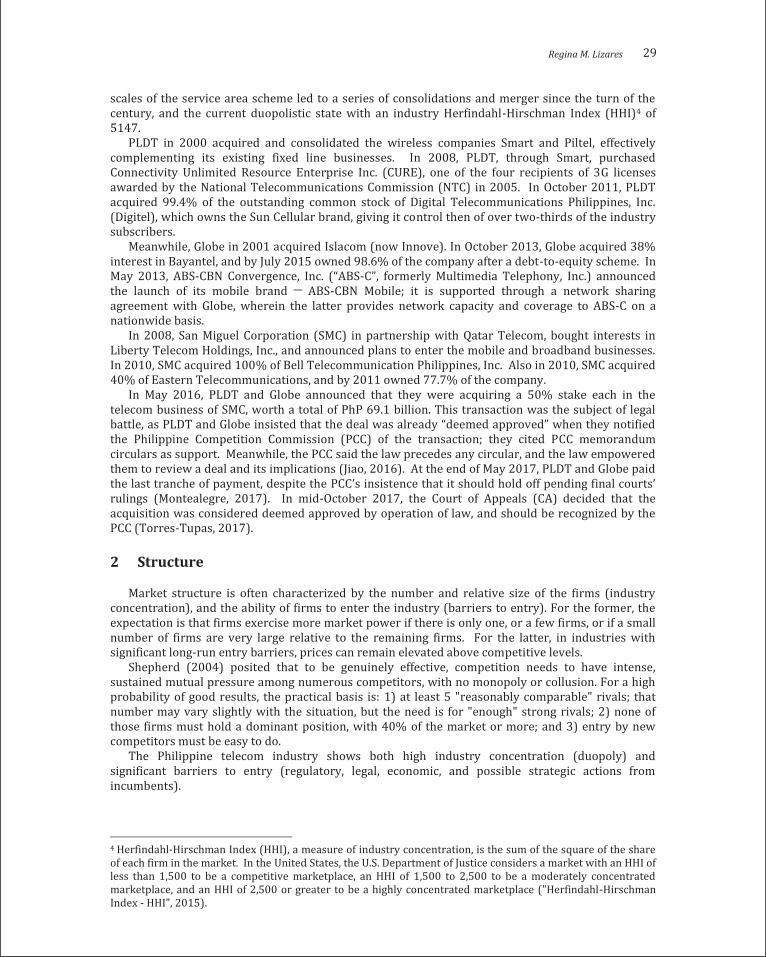
scales of the service area scheme led to a series of consolidations and merger since the turn of the century, and the current duopolistic state with an industry Herfindahl-Hirschman Index (HHI)4 of 5147.
PLDT in 2000 acquired and consolidated the wireless companies Smart and Piltel, effectively complementing its existing fixed line businesses. In 2008, PLDT, through Smart, purchased Connectivity Unlimited Resource Enterprise Inc. (CURE), one of the four recipients of 3G licenses awarded by the National Telecommunications Commission (NTC) in 2005. In October 2011, PLDT acquired 99.4% of the outstanding common stock of Digital Telecommunications Philippines, Inc. (Digitel), which owns the Sun Cellular brand, giving it control then of over two-thirds of the industry subscribers.
Meanwhile, Globe in 2001 acquired Islacom (now Innove). In October 2013, Globe acquired 38% interest in Bayantel, and by July 2015 owned 98.6% of the company after a debt-to-equity scheme. In May 2013, ABS-CBN Convergence, Inc. (“ABS-C”, formerly Multimedia Telephony, Inc.) announced the launch of its mobile brand ─ ABS-CBN Mobile; it is supported through a network sharing agreement with Globe, wherein the latter provides network capacity and coverage to ABS-C on a nationwide basis.
In 2008, San Miguel Corporation (SMC) in partnership with Qatar Telecom, bought interests in Liberty Telecom Holdings, Inc., and announced plans to enter the mobile and broadband businesses. In 2010, SMC acquired 100% of Bell Telecommunication Philippines, Inc. Also in 2010, SMC acquired 40% of Eastern Telecommunications, and by 2011 owned 77.7% of the company.
In May 2016, PLDT and Globe announced that they were acquiring a 50% stake each in the telecom business of SMC, worth a total of PhP 69.1 billion. This transaction was the subject of legal battle, as PLDT and Globe insisted that the deal was already “deemed approved” when they notified the Philippine Competition Commission (PCC) of the transaction; they cited PCC memorandum circulars as support. Meanwhile, the PCC said the law precedes any circular, and the law empowered them to review a deal and its implications (Jiao, 2016). At the end of May 2017, PLDT and Globe paid the last tranche of payment, despite the PCC’s insistence that it should hold off pending final courts’ rulings (Montealegre, 2017). In mid-October 2017, the Court of Appeals (CA) decided that the acquisition was considered deemed approved by operation of law, and should be recognized by the PCC (Torres-Tupas, 2017).
2 Structure
Market structure is often characterized by the number and relative size of the firms (industry concentration), and the ability of firms to enter the industry (barriers to entry). For the former, the expectation is that firms exercise more market power if there is only one, or a few firms, or if a small number of firms are very large relative to the remaining firms. For the latter, in industries with significant long-run entry barriers, prices can remain elevated above competitive levels.
Shepherd (2004) posited that to be genuinely effective, competition needs to have intense, sustained mutual pressure among numerous competitors, with no monopoly or collusion. For a high probability of good results, the practical basis is: 1) at least 5 "reasonably comparable" rivals; that number may vary slightly with the situation, but the need is for "enough" strong rivals; 2) none of those firms must hold a dominant position, with 40% of the market or more; and 3) entry by new competitors must be easy to do.
The Philippine telecom industry shows both high industry concentration (duopoly) and significant barriers to entry (regulatory, legal, economic, and possible strategic actions from incumbents).
4 Herfindahl-Hirschman Index (HHI), a measure of industry concentration, is the sum of the square of the share of each firm in the market. In the United States, the U.S. Department of Justice considers a market with an HHI of less than 1,500 to be a competitive marketplace, an HHI of 1,500 to 2,500 to be a moderately concentrated marketplace, and an HHI of 2,500 or greater to be a highly concentrated marketplace ("Herfindahl-Hirschman Index - HHI", 2015).
28 Assessment of the Conduct, Structure, and Performance of the Philippine Telecommunications Industry
Despite its ground-breaking contribution, SCP received criticism for being descriptive rather than theoretical, as the nature of these connections is usually not explained in detail (Perloff et al ., 2007). Furthermore, it was criticized for being static, deterministic, and limited in its view: (1) static, given its cross-sectional perspective in explaining the industry performance that result from a given industry structure; (2) deterministic, as it took industry structure as exogenously given, and firms having no latitude to alter the state of affairs; and (3) limited, with only a relatively few, critical aspects of structure explored, such as firm concentration and entry barriers (Porter, 1981).
These criticisms on the SCP approach spurred the expansion of the IO field. Criticism on SCP being empirically focused encouraged the growth in IO theoretical research, with economists developing price-theory models, analyzing industry with emphasis on monopolistic competition, game theory, or transaction costs (Perloff et al., 2007). Also, the criticisms on SCP being static, deterministic, and limited stimulated the development of: dynamic models of industry evolution; feedback effects of firm conduct (strategy) on market structure; and a richer set of elements (e.g., exit barriers, vertical bargaining relationship with suppliers and buyers) of industry structure important to competitive interaction being investigated (Porter, 1981). In the end, the conventional SCP approach uncovered many stable, robust, and empirical regularities; it also taught much about how markets look (Schmalensee, 1989).
This paper’s use of the SCP approach follows from Bain’s pioneering empirical tradition of relating aspects of industry structure to conduct and performance (usually profitability), and the other hundreds of studies that his approach encouraged, that forms the backbone of IO literature (Porter, 1981). SCP is ideal given the limited time frame of this paper’s data set, 2011 to 2016.
The definition of the market of interest1 is key in the SCP approach. The markets of interest for the telecom industry are the mobile-cellular and fixed line operators, providing voice and data (broadband) services2. Galla (2016) asserted that the Philippines telecom industry is currently heavily dominated by mobile communication, with the players shifting their emphasis from legacy telecoms of voice and short messaging, to data services, and internet connectivity. To the extent data is available, discussion is further subdivided to cover the prepaid and the postpaid markets. Due to the level of data disclosed by the telcos, the market cannot be subdivided into retail and wholesale. Lastly, the geographic scope of the market is national.
This paper divides into 5 sections: Section 2 covers Structure, Section 3 Conduct, and Section 4 Performance. Lastly, Section 5 concludes this paper.
1.1 Evolution of the Philippine Telecom Industry The Philippines’ telecom industry expanded rapidly since its liberalization in the 1980s, when
consumers waited up to 10 years for a landline connection and service quality was generally poor. A series of telecom reform from 1989 to 19953 opened up the industry, and saw an expansion in the number of players. This eroded the dominant operator, Philippine Long Distance and Telephone Company’s (PLDT) market share, particularly during the past decade, as consumer preferences shifted increasingly towards mobile broadband and digital services, disrupting traditional voice and SMS streams (Oxford Business Group, 2017). However, the fragmentation and lack of economies of
1 Telecom industry encompasses multiple service providers, including telephone companies, cable system operators, internet service providers, wireless carriers, and satellite operators. It also now includes software-based applications with a communications emphasis, and intermediate layers of software incorporated into end-to-end communication services. It also includes suppliers of telecoms equipment, and software products sold directly to consumers, and also to service providers, as well as the telecoms service providers (Lucky & Eisenberg, 2006). 2 They also provide interconnection services, but this service is not discussed in this paper. 3 In 1989, the NTC awarded two international gateway facility license to two non-PLDT players. In 1992, Congress granted franchises to the following mobile carriers: Piltel, Smart, Globe, Islacom, and Extelcom. In 1993, then President Ramos signed two EOs: 1) EO 59 mandated the compulsory interconnection of authorized public telecoms carriers in order to create a universally accessible, and fully integrated nationwide telecoms network; and 2) EO 109 required all mobile-cellular operators to install at least 400,000 telephone lines within three years, and International Gateway Facility (IGF) operators to put up 300,000 lines within five years. In 1995, RA 7923 The Public Telecommunications Act was passed; it sought to promote and govern the development of the telecoms industry, and to improve the delivery of telecoms services.
Regina M. Lizares 29
scales of the service area scheme led to a series of consolidations and merger since the turn of the century, and the current duopolistic state with an industry Herfindahl-Hirschman Index (HHI)4 of 5147.
PLDT in 2000 acquired and consolidated the wireless companies Smart and Piltel, effectively complementing its existing fixed line businesses. In 2008, PLDT, through Smart, purchased Connectivity Unlimited Resource Enterprise Inc. (CURE), one of the four recipients of 3G licenses awarded by the National Telecommunications Commission (NTC) in 2005. In October 2011, PLDT acquired 99.4% of the outstanding common stock of Digital Telecommunications Philippines, Inc. (Digitel), which owns the Sun Cellular brand, giving it control then of over two-thirds of the industry subscribers.
Meanwhile, Globe in 2001 acquired Islacom (now Innove). In October 2013, Globe acquired 38% interest in Bayantel, and by July 2015 owned 98.6% of the company after a debt-to-equity scheme. In May 2013, ABS-CBN Convergence, Inc. (“ABS-C”, formerly Multimedia Telephony, Inc.) announced the launch of its mobile brand ─ ABS-CBN Mobile; it is supported through a network sharing agreement with Globe, wherein the latter provides network capacity and coverage to ABS-C on a nationwide basis.
In 2008, San Miguel Corporation (SMC) in partnership with Qatar Telecom, bought interests in Liberty Telecom Holdings, Inc., and announced plans to enter the mobile and broadband businesses. In 2010, SMC acquired 100% of Bell Telecommunication Philippines, Inc. Also in 2010, SMC acquired 40% of Eastern Telecommunications, and by 2011 owned 77.7% of the company.
In May 2016, PLDT and Globe announced that they were acquiring a 50% stake each in the telecom business of SMC, worth a total of PhP 69.1 billion. This transaction was the subject of legal battle, as PLDT and Globe insisted that the deal was already “deemed approved” when they notified the Philippine Competition Commission (PCC) of the transaction; they cited PCC memorandum circulars as support. Meanwhile, the PCC said the law precedes any circular, and the law empowered them to review a deal and its implications (Jiao, 2016). At the end of May 2017, PLDT and Globe paid the last tranche of payment, despite the PCC’s insistence that it should hold off pending final courts’ rulings (Montealegre, 2017). In mid-October 2017, the Court of Appeals (CA) decided that the acquisition was considered deemed approved by operation of law, and should be recognized by the PCC (Torres-Tupas, 2017).
2 Structure
Market structure is often characterized by the number and relative size of the firms (industry concentration), and the ability of firms to enter the industry (barriers to entry). For the former, the expectation is that firms exercise more market power if there is only one, or a few firms, or if a small number of firms are very large relative to the remaining firms. For the latter, in industries with significant long-run entry barriers, prices can remain elevated above competitive levels.
Shepherd (2004) posited that to be genuinely effective, competition needs to have intense, sustained mutual pressure among numerous competitors, with no monopoly or collusion. For a high probability of good results, the practical basis is: 1) at least 5 "reasonably comparable" rivals; that number may vary slightly with the situation, but the need is for "enough" strong rivals; 2) none of those firms must hold a dominant position, with 40% of the market or more; and 3) entry by new competitors must be easy to do.
The Philippine telecom industry shows both high industry concentration (duopoly) and significant barriers to entry (regulatory, legal, economic, and possible strategic actions from incumbents).
4 Herfindahl-Hirschman Index (HHI), a measure of industry concentration, is the sum of the square of the share of each firm in the market. In the United States, the U.S. Department of Justice considers a market with an HHI of less than 1,500 to be a competitive marketplace, an HHI of 1,500 to 2,500 to be a moderately concentrated marketplace, and an HHI of 2,500 or greater to be a highly concentrated marketplace ("Herfindahl-Hirschman Index - HHI", 2015).

30 Assessment of the Conduct, Structure, and Performance of the Philippine Telecommunications Industry
2.1 Industry Concentration The Philippine telecom market is highly concentrated. Two major telcos, PLDT and Globe,
comprise almost 100% of the market, with an industry HHI of 5147, based on revenues as of 2016. This industry concentration has remained over the 5,000 level for the period 2011-2016 (See Figure 1).
Figure 1. Philippine Telecom Industry HHI, Revenue-Based, 2011 To 2016
Source: PLDT and Globe, 2011-2016
This fairly high level of industry concentration is also seen in the telecom industry in other countries, particularly in the mobile-cellular sub-market. In the following countries, the three largest players have the following market shares: Canada (96%), UK (73.2%), US (81.1%), and Germany (86.7%). However, these concentration levels are not as high as that of the Philippines; furthermore, a fourth wireless operator with greater than 10% market share exists in the UK, US, and Germany (SECOR Consulting, 2010). In fact, the Philippines is one of the more concentrated markets (EY, 2014; See Figure 2).
Figure 2. Selected Countries Mobile-Cellular Sub-Market HHI, Subscriber-Based, 2014
Source: EY, 2014
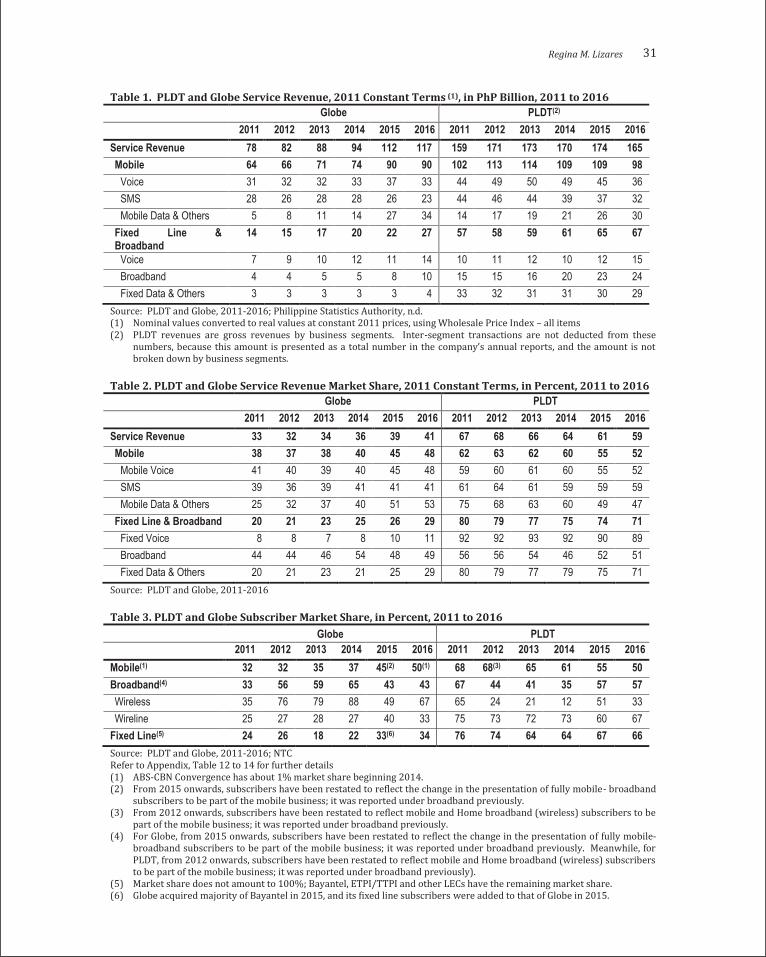
PLDT dominated the telecom market, for the period 2011 to 2016, for both service revenues (See Table 1 and 2), and subscriber base (See Table 3). At the end of 2016, in terms of service revenue, PLDT’s market share was at 59%, below though its five-year average (2011 to 2016) of 64% market share (See Table 2). PLDT dominated all sub-markets in terms of service revenue, for the period 2011 to 2016, except for mobile data & others in 2015 and 2016, and broadband in 2014 (See Table 2). Meanwhile, in terms of subscriber base, PLDT and Globe equally shared the mobile sub-market in 2016, but PLDT had the larger market share in both the broadband and fixed line sub-markets (See Table 3).
5590 5621 5527 5415 5233 5147
01000200030004000500060007000
2011 2012 2013 2014 2015 2016
5000 47004000
3600 3600 34002800 2600 2500 2500
21001400
0
1000
2000
3000
4000
5000
6000
Philippines China Norway Singaore South Africa Malaysia UK Indonesia Brazil Russia US India
Regina M. Lizares 31
Table 1. PLDT and Globe Service Revenue, 2011 Constant Terms (1), in PhP Billion, 2011 to 2016 Globe PLDT(2)
2011 2012 2013 2014 2015 2016 2011 2012 2013 2014 2015 2016 Service Revenue 78 82 88 94 112 117 159 171 173 170 174 165 Mobile 64 66 71 74 90 90 102 113 114 109 109 98
Voice 31 32 32 33 37 33 44 49 50 49 45 36 SMS 28 26 28 28 26 23 44 46 44 39 37 32 Mobile Data & Others 5 8 11 14 27 34 14 17 19 21 26 30
Fixed Line & Broadband
14 15 17 20 22 27 57 58 59 61 65 67
Voice 7 9 10 12 11 14 10 11 12 10 12 15 Broadband 4 4 5 5 8 10 15 15 16 20 23 24 Fixed Data & Others 3 3 3 3 3 4 33 32 31 31 30 29
Source: PLDT and Globe, 2011-2016; Philippine Statistics Authority, n.d. (1) Nominal values converted to real values at constant 2011 prices, using Wholesale Price Index – all items (2) PLDT revenues are gross revenues by business segments. Inter-segment transactions are not deducted from these
numbers, because this amount is presented as a total number in the company’s annual reports, and the amount is not broken down by business segments.
Table 2. PLDT and Globe Service Revenue Market Share, 2011 Constant Terms, in Percent, 2011 to 2016 Globe PLDT
2011 2012 2013 2014 2015 2016 2011 2012 2013 2014 2015 2016 Service Revenue 33 32 34 36 39 41 67 68 66 64 61 59 Mobile 38 37 38 40 45 48 62 63 62 60 55 52
Mobile Voice 41 40 39 40 45 48 59 60 61 60 55 52 SMS 39 36 39 41 41 41 61 64 61 59 59 59 Mobile Data & Others 25 32 37 40 51 53 75 68 63 60 49 47
Fixed Line & Broadband 20 21 23 25 26 29 80 79 77 75 74 71 Fixed Voice 8 8 7 8 10 11 92 92 93 92 90 89 Broadband 44 44 46 54 48 49 56 56 54 46 52 51 Fixed Data & Others 20 21 23 21 25 29 80 79 77 79 75 71
Source: PLDT and Globe, 2011-2016
Table 3. PLDT and Globe Subscriber Market Share, in Percent, 2011 to 2016 Globe PLDT
2011 2012 2013 2014 2015 2016 2011 2012 2013 2014 2015 2016 Mobile(1) 32 32 35 37 45(2) 50(1) 68 68(3) 65 61 55 50 Broadband(4) 33 56 59 65 43 43 67 44 41 35 57 57 Wireless 35 76 79 88 49 67 65 24 21 12 51 33 Wireline 25 27 28 27 40 33 75 73 72 73 60 67
Fixed Line(5) 24 26 18 22 33(6) 34 76 74 64 64 67 66 Source: PLDT and Globe, 2011-2016; NTC Refer to Appendix, Table 12 to 14 for further details (1) ABS-CBN Convergence has about 1% market share beginning 2014. (2) From 2015 onwards, subscribers have been restated to reflect the change in the presentation of fully mobile- broadband
subscribers to be part of the mobile business; it was reported under broadband previously. (3) From 2012 onwards, subscribers have been restated to reflect mobile and Home broadband (wireless) subscribers to be
part of the mobile business; it was reported under broadband previously. (4) For Globe, from 2015 onwards, subscribers have been restated to reflect the change in the presentation of fully mobile-
broadband subscribers to be part of the mobile business; it was reported under broadband previously. Meanwhile, for PLDT, from 2012 onwards, subscribers have been restated to reflect mobile and Home broadband (wireless) subscribers to be part of the mobile business; it was reported under broadband previously).
(5) Market share does not amount to 100%; Bayantel, ETPI/TTPI and other LECs have the remaining market share. (6) Globe acquired majority of Bayantel in 2015, and its fixed line subscribers were added to that of Globe in 2015.
30 Assessment of the Conduct, Structure, and Performance of the Philippine Telecommunications Industry
2.1 Industry Concentration The Philippine telecom market is highly concentrated. Two major telcos, PLDT and Globe,
comprise almost 100% of the market, with an industry HHI of 5147, based on revenues as of 2016. This industry concentration has remained over the 5,000 level for the period 2011-2016 (See Figure 1).
Figure 1. Philippine Telecom Industry HHI, Revenue-Based, 2011 To 2016
Source: PLDT and Globe, 2011-2016
This fairly high level of industry concentration is also seen in the telecom industry in other countries, particularly in the mobile-cellular sub-market. In the following countries, the three largest players have the following market shares: Canada (96%), UK (73.2%), US (81.1%), and Germany (86.7%). However, these concentration levels are not as high as that of the Philippines; furthermore, a fourth wireless operator with greater than 10% market share exists in the UK, US, and Germany (SECOR Consulting, 2010). In fact, the Philippines is one of the more concentrated markets (EY, 2014; See Figure 2).
Figure 2. Selected Countries Mobile-Cellular Sub-Market HHI, Subscriber-Based, 2014
Source: EY, 2014
PLDT dominated the telecom market, for the period 2011 to 2016, for both service revenues (See Table 1 and 2), and subscriber base (See Table 3). At the end of 2016, in terms of service revenue, PLDT’s market share was at 59%, below though its five-year average (2011 to 2016) of 64% market share (See Table 2). PLDT dominated all sub-markets in terms of service revenue, for the period 2011 to 2016, except for mobile data & others in 2015 and 2016, and broadband in 2014 (See Table 2). Meanwhile, in terms of subscriber base, PLDT and Globe equally shared the mobile sub-market in 2016, but PLDT had the larger market share in both the broadband and fixed line sub-markets (See Table 3).
5590 5621 5527 5415 5233 5147
01000200030004000500060007000
2011 2012 2013 2014 2015 2016
5000 47004000
3600 3600 34002800 2600 2500 2500
21001400
0
1000
2000
3000
4000
5000
6000
Philippines China Norway Singaore South Africa Malaysia UK Indonesia Brazil Russia US India
Regina M. Lizares 31
Table 1. PLDT and Globe Service Revenue, 2011 Constant Terms (1), in PhP Billion, 2011 to 2016 Globe PLDT(2)
2011 2012 2013 2014 2015 2016 2011 2012 2013 2014 2015 2016 Service Revenue 78 82 88 94 112 117 159 171 173 170 174 165 Mobile 64 66 71 74 90 90 102 113 114 109 109 98
Voice 31 32 32 33 37 33 44 49 50 49 45 36 SMS 28 26 28 28 26 23 44 46 44 39 37 32 Mobile Data & Others 5 8 11 14 27 34 14 17 19 21 26 30
Fixed Line & Broadband
14 15 17 20 22 27 57 58 59 61 65 67
Voice 7 9 10 12 11 14 10 11 12 10 12 15 Broadband 4 4 5 5 8 10 15 15 16 20 23 24 Fixed Data & Others 3 3 3 3 3 4 33 32 31 31 30 29
Source: PLDT and Globe, 2011-2016; Philippine Statistics Authority, n.d. (1) Nominal values converted to real values at constant 2011 prices, using Wholesale Price Index – all items (2) PLDT revenues are gross revenues by business segments. Inter-segment transactions are not deducted from these
numbers, because this amount is presented as a total number in the company’s annual reports, and the amount is not broken down by business segments.
Table 2. PLDT and Globe Service Revenue Market Share, 2011 Constant Terms, in Percent, 2011 to 2016 Globe PLDT
2011 2012 2013 2014 2015 2016 2011 2012 2013 2014 2015 2016 Service Revenue 33 32 34 36 39 41 67 68 66 64 61 59 Mobile 38 37 38 40 45 48 62 63 62 60 55 52
Mobile Voice 41 40 39 40 45 48 59 60 61 60 55 52 SMS 39 36 39 41 41 41 61 64 61 59 59 59 Mobile Data & Others 25 32 37 40 51 53 75 68 63 60 49 47
Fixed Line & Broadband 20 21 23 25 26 29 80 79 77 75 74 71 Fixed Voice 8 8 7 8 10 11 92 92 93 92 90 89 Broadband 44 44 46 54 48 49 56 56 54 46 52 51 Fixed Data & Others 20 21 23 21 25 29 80 79 77 79 75 71
Source: PLDT and Globe, 2011-2016
Table 3. PLDT and Globe Subscriber Market Share, in Percent, 2011 to 2016 Globe PLDT
2011 2012 2013 2014 2015 2016 2011 2012 2013 2014 2015 2016 Mobile(1) 32 32 35 37 45(2) 50(1) 68 68(3) 65 61 55 50 Broadband(4) 33 56 59 65 43 43 67 44 41 35 57 57 Wireless 35 76 79 88 49 67 65 24 21 12 51 33 Wireline 25 27 28 27 40 33 75 73 72 73 60 67
Fixed Line(5) 24 26 18 22 33(6) 34 76 74 64 64 67 66 Source: PLDT and Globe, 2011-2016; NTC Refer to Appendix, Table 12 to 14 for further details (1) ABS-CBN Convergence has about 1% market share beginning 2014. (2) From 2015 onwards, subscribers have been restated to reflect the change in the presentation of fully mobile- broadband
subscribers to be part of the mobile business; it was reported under broadband previously. (3) From 2012 onwards, subscribers have been restated to reflect mobile and Home broadband (wireless) subscribers to be
part of the mobile business; it was reported under broadband previously. (4) For Globe, from 2015 onwards, subscribers have been restated to reflect the change in the presentation of fully mobile-
broadband subscribers to be part of the mobile business; it was reported under broadband previously. Meanwhile, for PLDT, from 2012 onwards, subscribers have been restated to reflect mobile and Home broadband (wireless) subscribers to be part of the mobile business; it was reported under broadband previously).
(5) Market share does not amount to 100%; Bayantel, ETPI/TTPI and other LECs have the remaining market share. (6) Globe acquired majority of Bayantel in 2015, and its fixed line subscribers were added to that of Globe in 2015.
32 Assessment of the Conduct, Structure, and Performance of the Philippine Telecommunications Industry
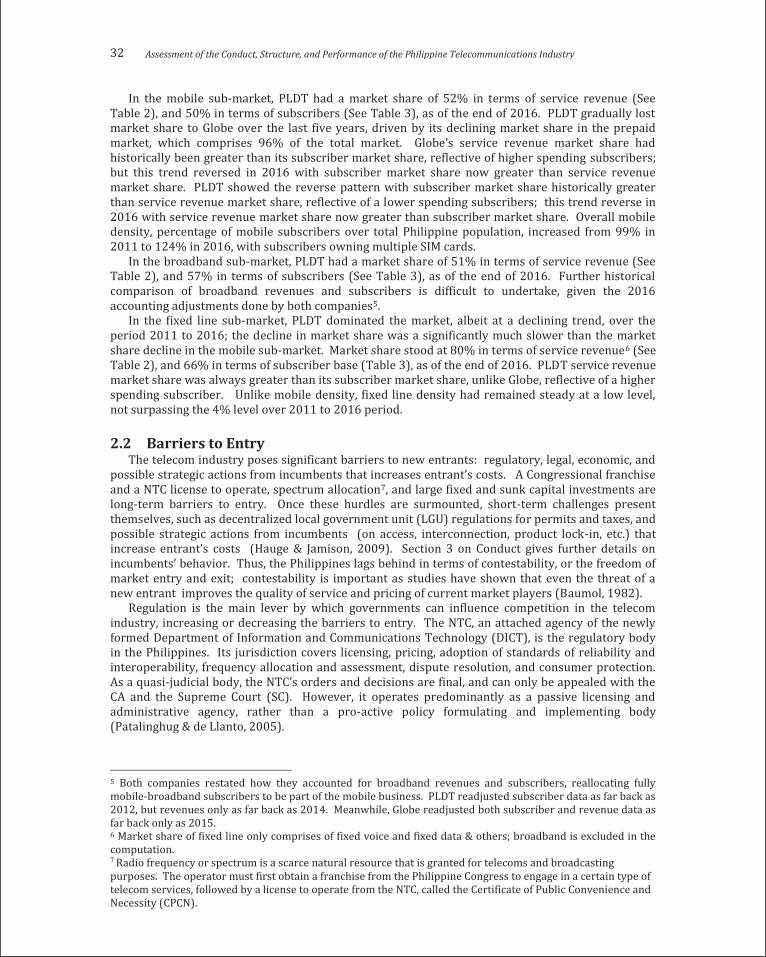
In the mobile sub-market, PLDT had a market share of 52% in terms of service revenue (See Table 2), and 50% in terms of subscribers (See Table 3), as of the end of 2016. PLDT gradually lost market share to Globe over the last five years, driven by its declining market share in the prepaid market, which comprises 96% of the total market. Globe’s service revenue market share had historically been greater than its subscriber market share, reflective of higher spending subscribers; but this trend reversed in 2016 with subscriber market share now greater than service revenue market share. PLDT showed the reverse pattern with subscriber market share historically greater than service revenue market share, reflective of a lower spending subscribers; this trend reverse in 2016 with service revenue market share now greater than subscriber market share. Overall mobile density, percentage of mobile subscribers over total Philippine population, increased from 99% in 2011 to 124% in 2016, with subscribers owning multiple SIM cards.
In the broadband sub-market, PLDT had a market share of 51% in terms of service revenue (See Table 2), and 57% in terms of subscribers (See Table 3), as of the end of 2016. Further historical comparison of broadband revenues and subscribers is difficult to undertake, given the 2016 accounting adjustments done by both companies5.
In the fixed line sub-market, PLDT dominated the market, albeit at a declining trend, over the period 2011 to 2016; the decline in market share was a significantly much slower than the market share decline in the mobile sub-market. Market share stood at 80% in terms of service revenue6 (See Table 2), and 66% in terms of subscriber base (Table 3), as of the end of 2016. PLDT service revenue market share was always greater than its subscriber market share, unlike Globe, reflective of a higher spending subscriber. Unlike mobile density, fixed line density had remained steady at a low level, not surpassing the 4% level over 2011 to 2016 period.
2.2 Barriers to Entry The telecom industry poses significant barriers to new entrants: regulatory, legal, economic, and
possible strategic actions from incumbents that increases entrant’s costs. A Congressional franchise and a NTC license to operate, spectrum allocation7, and large fixed and sunk capital investments are long-term barriers to entry. Once these hurdles are surmounted, short-term challenges present themselves, such as decentralized local government unit (LGU) regulations for permits and taxes, and possible strategic actions from incumbents (on access, interconnection, product lock-in, etc.) that increase entrant’s costs (Hauge & Jamison, 2009). Section 3 on Conduct gives further details on incumbents’ behavior. Thus, the Philippines lags behind in terms of contestability, or the freedom of market entry and exit; contestability is important as studies have shown that even the threat of a new entrant improves the quality of service and pricing of current market players (Baumol, 1982).
Regulation is the main lever by which governments can influence competition in the telecom industry, increasing or decreasing the barriers to entry. The NTC, an attached agency of the newly formed Department of Information and Communications Technology (DICT), is the regulatory body in the Philippines. Its jurisdiction covers licensing, pricing, adoption of standards of reliability and interoperability, frequency allocation and assessment, dispute resolution, and consumer protection. As a quasi-judicial body, the NTC’s orders and decisions are final, and can only be appealed with the CA and the Supreme Court (SC). However, it operates predominantly as a passive licensing and administrative agency, rather than a pro-active policy formulating and implementing body (Patalinghug & de Llanto, 2005).
5 Both companies restated how they accounted for broadband revenues and subscribers, reallocating fully mobile-broadband subscribers to be part of the mobile business. PLDT readjusted subscriber data as far back as 2012, but revenues only as far back as 2014. Meanwhile, Globe readjusted both subscriber and revenue data as far back only as 2015. 6 Market share of fixed line only comprises of fixed voice and fixed data & others; broadband is excluded in the computation. 7 Radio frequency or spectrum is a scarce natural resource that is granted for telecoms and broadcasting purposes. The operator must first obtain a franchise from the Philippine Congress to engage in a certain type of telecom services, followed by a license to operate from the NTC, called the Certificate of Public Convenience and Necessity (CPCN).
Regina M. Lizares 33
The requirement for a Congressional franchise for a service provider is unique to the Philippines. The cumbersome and protracted process of securing a franchise from Congress, apart from separate licenses and permits to operate from the regulator, various national government agencies, and LGUs, can be seen as a disincentive for new players to invest (Mirandilla-Santos, 2016).
The availability of spectrum may be the current largest single barrier to entry. The PLDT and Globe PhP 69.1 billion purchases of SMC’s telecom assets leaves less than a quarter of spectrum available for a third entrant; Globe claims this is sufficient to enable a future telecom player (Genio, 2016). This transaction was the subject of legal battle between PLDT and Globe versus the PCC; in mid-October 2017, the Court of Appeals (CA) decided that the acquisition was considered deemed approved by operation of law, and should be recognized by the PCC (Torres-Tupas, 2017).
Furthermore, there are other issues in the current regulatory framework that impacts competition overall. One, interconnection agreements of telcos are not made available to the public on the argument that they are trade secrets; and the NTC is not forcing the telcos to do so. Two, the NTC has not enforced unbundled access to network elements since it has not yet established rates, nor the settling procedures; they claim complexity of the process, and assert that they lack the power to compel the telcos to submit the necessary information. Three, cross-subsidization of unprofitable local exchange areas to meet universal service goals is explicitly allowed in the Public Telecommunications Policy Act (Republic Act (RA) No. 7925); whether the benefit of universal service outweighs the anticompetitive impact of cross-subsidies is for debate. Four and last, the NTC is unable to require number portability8 in the face of strong opposition from incumbent operators (Habito, 2016a; USAID, 2016).
Economically, telcos require massive capital investments, implying high barriers to entry and exit, especially since a significant portion of the investment incurred is fixed and sunk. It is also characterized by a network of switches, transmission links, and terminal or distribution points that give rise to economies of scale and scope. Furthermore, the sector enjoys network externalities, with the benefits to telcos increasing with the number of users that they are able to reach. Granted all these, perfect competition is unlikely in the sector, but neither is it a natural monopoly. Being multi-product in nature, different portions of the telecom network can be opened to varying degrees of competition (Serafica, 2001).
Network infrastructure alone for a newcomer can cost as much as USD 2.5 billion, as quoted from Globe CEO Ernest Cu (Waring, 2015). The NTC once estimated the cost to bring 2 Mbps internet connection to the entire country at PhP 800 billion (Habito, 2016b). With a constitutional limit of 40% on foreign ownership, this effectively limits the number of companies that can inject fresh new capital, bring in state-of-the art technology, and compete in the market.
In addition to the large up-front capital costs, large annual capex are required to continually maintain, upgrade, and expand the network infrastructure. Today, Philippine telcos continue to invest in major infrastructure programs to improve the overall broadband service in the country, and this is expected to continue even beyond 2020 (Genio, 2016). Figure 3 shows that capex for 2014 and 2015 amounted to 24% and 27%, respectively, of the telcos’ service revenues; in 2016, PLDT and Globe combined spent Php277 billion in capex, or an average of 29% its service revenue.
Figure 3. Selected Countries Capex: Service Revenue Ratio, in Percent, 2014 and 2015
Source: Genio, 2016; PLDT and Globe, 2011-2015
8 Ability of consumers to change from one provider to another without changing numbers
33
23 2226
2116 16 16 15 14 15
12
2721
3627 26 23 23
1714 14 14 13 13 13
27 27
010203040
China Philippines Singapore Indonesia Thailand India Korea Taiwan US HongKong
Japan Malaysia Globe PLDT
2014 2015

32 Assessment of the Conduct, Structure, and Performance of the Philippine Telecommunications Industry
In the mobile sub-market, PLDT had a market share of 52% in terms of service revenue (See Table 2), and 50% in terms of subscribers (See Table 3), as of the end of 2016. PLDT gradually lost market share to Globe over the last five years, driven by its declining market share in the prepaid market, which comprises 96% of the total market. Globe’s service revenue market share had historically been greater than its subscriber market share, reflective of higher spending subscribers; but this trend reversed in 2016 with subscriber market share now greater than service revenue market share. PLDT showed the reverse pattern with subscriber market share historically greater than service revenue market share, reflective of a lower spending subscribers; this trend reverse in 2016 with service revenue market share now greater than subscriber market share. Overall mobile density, percentage of mobile subscribers over total Philippine population, increased from 99% in 2011 to 124% in 2016, with subscribers owning multiple SIM cards.
In the broadband sub-market, PLDT had a market share of 51% in terms of service revenue (See Table 2), and 57% in terms of subscribers (See Table 3), as of the end of 2016. Further historical comparison of broadband revenues and subscribers is difficult to undertake, given the 2016 accounting adjustments done by both companies5.
In the fixed line sub-market, PLDT dominated the market, albeit at a declining trend, over the period 2011 to 2016; the decline in market share was a significantly much slower than the market share decline in the mobile sub-market. Market share stood at 80% in terms of service revenue6 (See Table 2), and 66% in terms of subscriber base (Table 3), as of the end of 2016. PLDT service revenue market share was always greater than its subscriber market share, unlike Globe, reflective of a higher spending subscriber. Unlike mobile density, fixed line density had remained steady at a low level, not surpassing the 4% level over 2011 to 2016 period.
2.2 Barriers to Entry The telecom industry poses significant barriers to new entrants: regulatory, legal, economic, and
possible strategic actions from incumbents that increases entrant’s costs. A Congressional franchise and a NTC license to operate, spectrum allocation7, and large fixed and sunk capital investments are long-term barriers to entry. Once these hurdles are surmounted, short-term challenges present themselves, such as decentralized local government unit (LGU) regulations for permits and taxes, and possible strategic actions from incumbents (on access, interconnection, product lock-in, etc.) that increase entrant’s costs (Hauge & Jamison, 2009). Section 3 on Conduct gives further details on incumbents’ behavior. Thus, the Philippines lags behind in terms of contestability, or the freedom of market entry and exit; contestability is important as studies have shown that even the threat of a new entrant improves the quality of service and pricing of current market players (Baumol, 1982).
Regulation is the main lever by which governments can influence competition in the telecom industry, increasing or decreasing the barriers to entry. The NTC, an attached agency of the newly formed Department of Information and Communications Technology (DICT), is the regulatory body in the Philippines. Its jurisdiction covers licensing, pricing, adoption of standards of reliability and interoperability, frequency allocation and assessment, dispute resolution, and consumer protection. As a quasi-judicial body, the NTC’s orders and decisions are final, and can only be appealed with the CA and the Supreme Court (SC). However, it operates predominantly as a passive licensing and administrative agency, rather than a pro-active policy formulating and implementing body (Patalinghug & de Llanto, 2005).
5 Both companies restated how they accounted for broadband revenues and subscribers, reallocating fully mobile-broadband subscribers to be part of the mobile business. PLDT readjusted subscriber data as far back as 2012, but revenues only as far back as 2014. Meanwhile, Globe readjusted both subscriber and revenue data as far back only as 2015. 6 Market share of fixed line only comprises of fixed voice and fixed data & others; broadband is excluded in the computation. 7 Radio frequency or spectrum is a scarce natural resource that is granted for telecoms and broadcasting purposes. The operator must first obtain a franchise from the Philippine Congress to engage in a certain type of telecom services, followed by a license to operate from the NTC, called the Certificate of Public Convenience and Necessity (CPCN).
Regina M. Lizares 33
The requirement for a Congressional franchise for a service provider is unique to the Philippines. The cumbersome and protracted process of securing a franchise from Congress, apart from separate licenses and permits to operate from the regulator, various national government agencies, and LGUs, can be seen as a disincentive for new players to invest (Mirandilla-Santos, 2016).
The availability of spectrum may be the current largest single barrier to entry. The PLDT and Globe PhP 69.1 billion purchases of SMC’s telecom assets leaves less than a quarter of spectrum available for a third entrant; Globe claims this is sufficient to enable a future telecom player (Genio, 2016). This transaction was the subject of legal battle between PLDT and Globe versus the PCC; in mid-October 2017, the Court of Appeals (CA) decided that the acquisition was considered deemed approved by operation of law, and should be recognized by the PCC (Torres-Tupas, 2017).
Furthermore, there are other issues in the current regulatory framework that impacts competition overall. One, interconnection agreements of telcos are not made available to the public on the argument that they are trade secrets; and the NTC is not forcing the telcos to do so. Two, the NTC has not enforced unbundled access to network elements since it has not yet established rates, nor the settling procedures; they claim complexity of the process, and assert that they lack the power to compel the telcos to submit the necessary information. Three, cross-subsidization of unprofitable local exchange areas to meet universal service goals is explicitly allowed in the Public Telecommunications Policy Act (Republic Act (RA) No. 7925); whether the benefit of universal service outweighs the anticompetitive impact of cross-subsidies is for debate. Four and last, the NTC is unable to require number portability8 in the face of strong opposition from incumbent operators (Habito, 2016a; USAID, 2016).
Economically, telcos require massive capital investments, implying high barriers to entry and exit, especially since a significant portion of the investment incurred is fixed and sunk. It is also characterized by a network of switches, transmission links, and terminal or distribution points that give rise to economies of scale and scope. Furthermore, the sector enjoys network externalities, with the benefits to telcos increasing with the number of users that they are able to reach. Granted all these, perfect competition is unlikely in the sector, but neither is it a natural monopoly. Being multi-product in nature, different portions of the telecom network can be opened to varying degrees of competition (Serafica, 2001).
Network infrastructure alone for a newcomer can cost as much as USD 2.5 billion, as quoted from Globe CEO Ernest Cu (Waring, 2015). The NTC once estimated the cost to bring 2 Mbps internet connection to the entire country at PhP 800 billion (Habito, 2016b). With a constitutional limit of 40% on foreign ownership, this effectively limits the number of companies that can inject fresh new capital, bring in state-of-the art technology, and compete in the market.
In addition to the large up-front capital costs, large annual capex are required to continually maintain, upgrade, and expand the network infrastructure. Today, Philippine telcos continue to invest in major infrastructure programs to improve the overall broadband service in the country, and this is expected to continue even beyond 2020 (Genio, 2016). Figure 3 shows that capex for 2014 and 2015 amounted to 24% and 27%, respectively, of the telcos’ service revenues; in 2016, PLDT and Globe combined spent Php277 billion in capex, or an average of 29% its service revenue.
Figure 3. Selected Countries Capex: Service Revenue Ratio, in Percent, 2014 and 2015
Source: Genio, 2016; PLDT and Globe, 2011-2015
8 Ability of consumers to change from one provider to another without changing numbers
33
23 2226
2116 16 16 15 14 15
12
2721
3627 26 23 23
1714 14 14 13 13 13
27 27
010203040
China Philippines Singapore Indonesia Thailand India Korea Taiwan US HongKong
Japan Malaysia Globe PLDT
2014 2015

34 Assessment of the Conduct, Structure, and Performance of the Philippine Telecommunications Industry
Once these long-term barriers are surmounted, the roll out of network encounters issues on permits, clearances, right of way, site acquisition, and broad discretion levels of permitting agencies. On the LGU level, bureaucratic and bribery issues, arbitrary fees for permits, and clearances are reported. On the national level, national government agencies also require telcos to secure clearances for various purposes. Apart from government, exclusive villages and homeowners’ associations may give telcos a difficult time to set up in their area (Mirandilla-Santos, 2016).
The DICT has taken steps to address the LGU level constraints9. It has drafted an Executive Order (EO), to be signed by President Duterte, mandating that LGUs must approve applications for the construction, installation, and operation of telecom facilities within seven days from when these are requested. An additional two days may be given to the Local Chief Executive to decide whether or not the permit shall be approved. This is a significant reduction from the current average of eight months. In addition, the DICT is working on an initiative to issue a Joint Memorandum Circulars with LGUs to standardize fees, and speed up permit processing (Abellanosa, 2017).
Lastly, incumbent telcos can engage in strategic non-cooperative actions, with past instances showing that they have. On the operations side, this may be in the form of delayed, insufficient or expensive10 interconnection, unequal access settlements, or dispute on revenue-sharing arrangements (Patalinghug & de Llanto, 2005). On the marketing side, this may be in the form of customer product/contract lock-in, promotions that effectively temporarily drop prices, or further increase in advertising intensity; in terms of advertising, telcos’ expenditures are one of the highest (Nielsen, 2016).
3 Conduct
Conduct refers to how players respond to market incentives, and competitive pressures. Key indicators of conduct are relative pricing and product offering, and service quality.
The market structure strongly influences the conduct of market players. Given the telecom industry’s duopoly, PLDT’s and Globe’s conduct involve strategic considerations; each firm must consider how their actions affect their rivals, and how they are likely to react. As such, it is typical to see both companies mirror each other in terms of their actions.
The telcos employ price discrimination, as evidenced by their complex buffet pricing and bundled products. Prices, reflected by average revenue per user (ARPU), have dropped over the years by as much as 8% per annum for the period 2011-2016 for some mobile-cellular brands, to one of the lowest ARPU levels in the world (GSMA, 2014; Statista, n.d.). Despite these, prices as a percentage of gross national income (GNI)11 per capita for information and communication technologies (ICT) services are at best on par, or above regional averages, depending on the particular ICT service12. These higher prices effectively serve as a barrier to usage (ITU, 2016). Churn also remains elevated, at one of the highest level in the world (GSMA, 2104), challenging telcos to compete as well on customer retention, and innovation (on tariff structure, product and services). Meanwhile, in terms of service quality, the Philippines ranks low in connection speed (Akamai, 2017; OpenSignal, 2017).
Competitive conduct can quickly change if the number of incumbents increase, as shown by a study of Bresnahan & Reiss (1991). Using data on geographically isolated monopolies, duopolies, and oligopolies, they study the relationship between the number of firms in a market, market size, and competition. They find out that in markets with five or fewer incumbents, almost all variation in competitive conduct occurs with the entry of the second or third firm. The Philippines, however,
9 The EO and DICT plans were presented in the Philippine Telecom Summit held on March 2017. 10 Wholesale pricing and access charges are not regulated by the NTC (Mirandilla-Santos, 2016). 11 GNI = Gross domestic product + factor incomes earned by foreign residents – income earned in the domestic economy by non-residents. 12 Philippine mobile-cellular services cost 3.4% of GNI per capita, in-line with the Asia-Pacific regional average; fixed-broadband services cost 7.5% of GNI per capita, higher than half of the countries in the region that offer prices below 5% of GNI per capita; prepaid handset-based mobile-broadband plans cost 1.5% of GNI per capita, similar to the majority of countries in the region that price less than 5% of GNI per capita; and postpaid computer-based mobile-broadband plans cost 6.7% of GNI per capita, 4.5x higher than the prepaid handset option (ITU, 2016).
Regina M. Lizares 35
over the last decade has been on a path of consolidation, increasing industry concentration through a series of mergers and acquisitions (M&A).
3.1 Pricing and Product Offering PLDT’s and Globe’s pricing and product offerings are directionally similar, despite the many, and
at times complex buffet pricing and bundled products they offer (See Tables 4 to 7). Despite the competitive pricing, which has resulted in declining ARPUs over the years of as much as 8% per annum for some brands, telecom prices in the Philippines remains moderately high, serving as a barrier to usage. As per Tirole (1993), the observation of a market price speaks little about the competitiveness of the corresponding industry, unless one can observe prices in industries with similar cost structures (for instance, different geographical markets); or can observe temporal pattern of the industry price; or can accurately measure firm’s marginal costs.
Offering several different plans and options allows the telcos to practice price discrimination, charging different prices to different customers. In particular, telcos practice second-degree price discrimination, charging different prices per unit for different quantities of the same service. Price discrimination is a means of capturing consumer surplus, and transferring it to the telcos. By offering different plans and options, the customers choose the plan that best matches their need, effectively sorting themselves into groups which are relatively homogeneous in terms of demand (Rubinfeld & Pindyck, 2013).
Telcos’ offerings are nearly identical, both on landline and broadband (See Tables 4 and 5), and mobile (See Tables 6 and 7). Telcos have to continually come up with new tariff plans to attract more customers, and maintain client base (Cayanan & Suan, 2014), particularly in the mobile-cellular sub-segment. A key area is flexibility, and both telcos focus on customization13. Mobile users favor prepaid bundles (96% of total mobile subscribers) over postpaid contract plans; Tables 6 and 7 show the many prepaid offering of just two of the brands in the market. Multiple SIM ownership is common, and users regularly swap SIMs (or even own dual-SIM handsets) in order to take advantage of the best deals and promotions regularly refreshed by the operators (GSMA, 2014).
Table 4. PLDT and Globe Postpaid Home Wireless Landline PLDT Globe
Monthly Service Fee (PhP) 600 450 Local calls (to all networks) Unlimited Unlimited National long distance calls (PhP/minute) To same network 1.00 Unlimited
To other network 5.10 7.50 International long distance (USD/minute) 0.40 0.40 Calls to mobile (PhP/minute) To same network
To other networks 6.50 6.50
6.50 7.50
SMS (PhP/SMS) Free 120 SMS n.a. Domestic 1.00 1.00 International 5.00 n.a.
Lock-up period (months) 12 12 One-time charge (PhP) 100 Sim activation 1,000 handset
Source: PLDT and Globe websites, as of June 2017
13 Bundles can be designed to suit the consumers’ budget, lifestyle and needs. Type, number of call minutes and text, data allowance, and duration of the bundle (day/s), month/s)) are parameters that can be changed.

34 Assessment of the Conduct, Structure, and Performance of the Philippine Telecommunications Industry
Once these long-term barriers are surmounted, the roll out of network encounters issues on permits, clearances, right of way, site acquisition, and broad discretion levels of permitting agencies. On the LGU level, bureaucratic and bribery issues, arbitrary fees for permits, and clearances are reported. On the national level, national government agencies also require telcos to secure clearances for various purposes. Apart from government, exclusive villages and homeowners’ associations may give telcos a difficult time to set up in their area (Mirandilla-Santos, 2016).
The DICT has taken steps to address the LGU level constraints9. It has drafted an Executive Order (EO), to be signed by President Duterte, mandating that LGUs must approve applications for the construction, installation, and operation of telecom facilities within seven days from when these are requested. An additional two days may be given to the Local Chief Executive to decide whether or not the permit shall be approved. This is a significant reduction from the current average of eight months. In addition, the DICT is working on an initiative to issue a Joint Memorandum Circulars with LGUs to standardize fees, and speed up permit processing (Abellanosa, 2017).
Lastly, incumbent telcos can engage in strategic non-cooperative actions, with past instances showing that they have. On the operations side, this may be in the form of delayed, insufficient or expensive10 interconnection, unequal access settlements, or dispute on revenue-sharing arrangements (Patalinghug & de Llanto, 2005). On the marketing side, this may be in the form of customer product/contract lock-in, promotions that effectively temporarily drop prices, or further increase in advertising intensity; in terms of advertising, telcos’ expenditures are one of the highest (Nielsen, 2016).
3 Conduct
Conduct refers to how players respond to market incentives, and competitive pressures. Key indicators of conduct are relative pricing and product offering, and service quality.
The market structure strongly influences the conduct of market players. Given the telecom industry’s duopoly, PLDT’s and Globe’s conduct involve strategic considerations; each firm must consider how their actions affect their rivals, and how they are likely to react. As such, it is typical to see both companies mirror each other in terms of their actions.
The telcos employ price discrimination, as evidenced by their complex buffet pricing and bundled products. Prices, reflected by average revenue per user (ARPU), have dropped over the years by as much as 8% per annum for the period 2011-2016 for some mobile-cellular brands, to one of the lowest ARPU levels in the world (GSMA, 2014; Statista, n.d.). Despite these, prices as a percentage of gross national income (GNI)11 per capita for information and communication technologies (ICT) services are at best on par, or above regional averages, depending on the particular ICT service12. These higher prices effectively serve as a barrier to usage (ITU, 2016). Churn also remains elevated, at one of the highest level in the world (GSMA, 2104), challenging telcos to compete as well on customer retention, and innovation (on tariff structure, product and services). Meanwhile, in terms of service quality, the Philippines ranks low in connection speed (Akamai, 2017; OpenSignal, 2017).
Competitive conduct can quickly change if the number of incumbents increase, as shown by a study of Bresnahan & Reiss (1991). Using data on geographically isolated monopolies, duopolies, and oligopolies, they study the relationship between the number of firms in a market, market size, and competition. They find out that in markets with five or fewer incumbents, almost all variation in competitive conduct occurs with the entry of the second or third firm. The Philippines, however,
9 The EO and DICT plans were presented in the Philippine Telecom Summit held on March 2017. 10 Wholesale pricing and access charges are not regulated by the NTC (Mirandilla-Santos, 2016). 11 GNI = Gross domestic product + factor incomes earned by foreign residents – income earned in the domestic economy by non-residents. 12 Philippine mobile-cellular services cost 3.4% of GNI per capita, in-line with the Asia-Pacific regional average; fixed-broadband services cost 7.5% of GNI per capita, higher than half of the countries in the region that offer prices below 5% of GNI per capita; prepaid handset-based mobile-broadband plans cost 1.5% of GNI per capita, similar to the majority of countries in the region that price less than 5% of GNI per capita; and postpaid computer-based mobile-broadband plans cost 6.7% of GNI per capita, 4.5x higher than the prepaid handset option (ITU, 2016).
Regina M. Lizares 35
over the last decade has been on a path of consolidation, increasing industry concentration through a series of mergers and acquisitions (M&A).
3.1 Pricing and Product Offering PLDT’s and Globe’s pricing and product offerings are directionally similar, despite the many, and
at times complex buffet pricing and bundled products they offer (See Tables 4 to 7). Despite the competitive pricing, which has resulted in declining ARPUs over the years of as much as 8% per annum for some brands, telecom prices in the Philippines remains moderately high, serving as a barrier to usage. As per Tirole (1993), the observation of a market price speaks little about the competitiveness of the corresponding industry, unless one can observe prices in industries with similar cost structures (for instance, different geographical markets); or can observe temporal pattern of the industry price; or can accurately measure firm’s marginal costs.
Offering several different plans and options allows the telcos to practice price discrimination, charging different prices to different customers. In particular, telcos practice second-degree price discrimination, charging different prices per unit for different quantities of the same service. Price discrimination is a means of capturing consumer surplus, and transferring it to the telcos. By offering different plans and options, the customers choose the plan that best matches their need, effectively sorting themselves into groups which are relatively homogeneous in terms of demand (Rubinfeld & Pindyck, 2013).
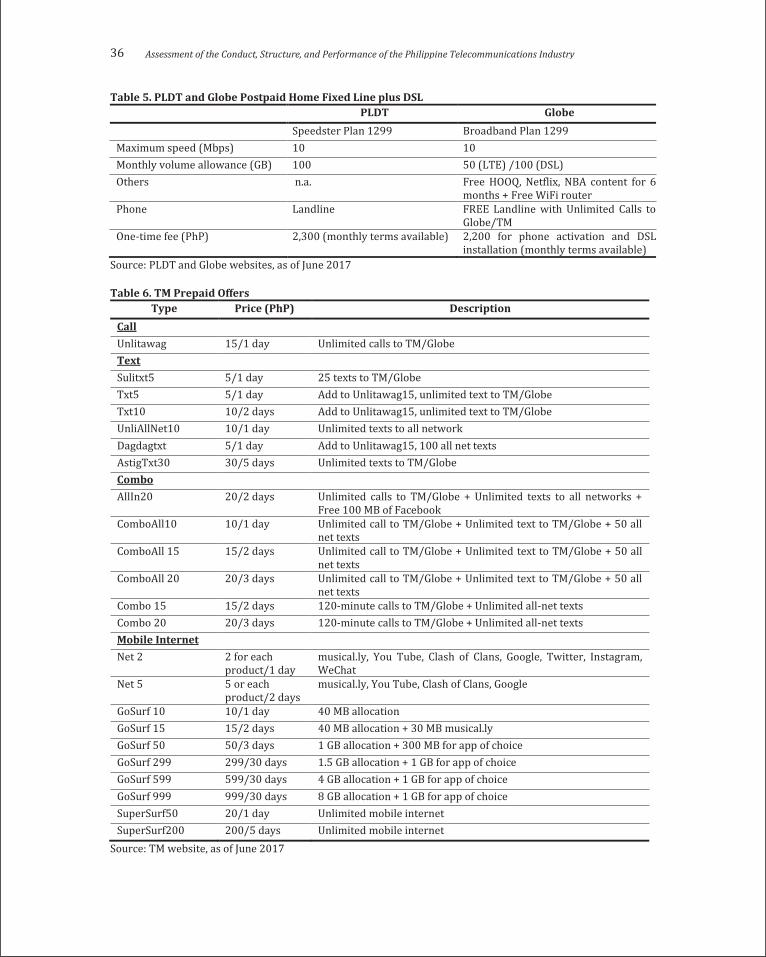
Telcos’ offerings are nearly identical, both on landline and broadband (See Tables 4 and 5), and mobile (See Tables 6 and 7). Telcos have to continually come up with new tariff plans to attract more customers, and maintain client base (Cayanan & Suan, 2014), particularly in the mobile-cellular sub-segment. A key area is flexibility, and both telcos focus on customization13. Mobile users favor prepaid bundles (96% of total mobile subscribers) over postpaid contract plans; Tables 6 and 7 show the many prepaid offering of just two of the brands in the market. Multiple SIM ownership is common, and users regularly swap SIMs (or even own dual-SIM handsets) in order to take advantage of the best deals and promotions regularly refreshed by the operators (GSMA, 2014).
Table 4. PLDT and Globe Postpaid Home Wireless Landline PLDT Globe
Monthly Service Fee (PhP) 600 450 Local calls (to all networks) Unlimited Unlimited National long distance calls (PhP/minute) To same network 1.00 Unlimited
To other network 5.10 7.50 International long distance (USD/minute) 0.40 0.40 Calls to mobile (PhP/minute) To same network
To other networks 6.50 6.50
6.50 7.50
SMS (PhP/SMS) Free 120 SMS n.a. Domestic 1.00 1.00 International 5.00 n.a.
Lock-up period (months) 12 12 One-time charge (PhP) 100 Sim activation 1,000 handset
Source: PLDT and Globe websites, as of June 2017
13 Bundles can be designed to suit the consumers’ budget, lifestyle and needs. Type, number of call minutes and text, data allowance, and duration of the bundle (day/s), month/s)) are parameters that can be changed.
36 Assessment of the Conduct, Structure, and Performance of the Philippine Telecommunications Industry
Table 5. PLDT and Globe Postpaid Home Fixed Line plus DSL PLDT Globe
Speedster Plan 1299 Broadband Plan 1299 Maximum speed (Mbps) 10 10 Monthly volume allowance (GB) 100 50 (LTE) /100 (DSL) Others n.a. Free HOOQ, Netflix, NBA content for 6
months + Free WiFi router Phone Landline FREE Landline with Unlimited Calls to
Globe/TM One-time fee (PhP) 2,300 (monthly terms available) 2,200 for phone activation and DSL
installation (monthly terms available) Source: PLDT and Globe websites, as of June 2017
Table 6. TM Prepaid Offers Type Price (PhP) Description
Call Unlitawag 15/1 day Unlimited calls to TM/Globe Text Sulitxt5 5/1 day 25 texts to TM/Globe Txt5 5/1 day Add to Unlitawag15, unlimited text to TM/Globe Txt10 10/2 days Add to Unlitawag15, unlimited text to TM/Globe UnliAllNet10 10/1 day Unlimited texts to all network Dagdagtxt 5/1 day Add to Unlitawag15, 100 all net texts AstigTxt30 30/5 days Unlimited texts to TM/Globe Combo AllIn20 20/2 days Unlimited calls to TM/Globe + Unlimited texts to all networks +
Free 100 MB of Facebook ComboAll10 10/1 day Unlimited call to TM/Globe + Unlimited text to TM/Globe + 50 all
net texts ComboAll 15 15/2 days Unlimited call to TM/Globe + Unlimited text to TM/Globe + 50 all
net texts ComboAll 20 20/3 days Unlimited call to TM/Globe + Unlimited text to TM/Globe + 50 all
net texts Combo 15 15/2 days 120-minute calls to TM/Globe + Unlimited all-net texts Combo 20 20/3 days 120-minute calls to TM/Globe + Unlimited all-net texts Mobile Internet Net 2 2 for each
product/1 day musical.ly, You Tube, Clash of Clans, Google, Twitter, Instagram, WeChat
Net 5 5 or each product/2 days
musical.ly, You Tube, Clash of Clans, Google
GoSurf 10 10/1 day 40 MB allocation GoSurf 15 15/2 days 40 MB allocation + 30 MB musical.ly GoSurf 50 50/3 days 1 GB allocation + 300 MB for app of choice GoSurf 299 299/30 days 1.5 GB allocation + 1 GB for app of choice GoSurf 599 599/30 days 4 GB allocation + 1 GB for app of choice GoSurf 999 999/30 days 8 GB allocation + 1 GB for app of choice SuperSurf50 20/1 day Unlimited mobile internet SuperSurf200 200/5 days Unlimited mobile internet
Source: TM website, as of June 2017
Regina M. Lizares 37
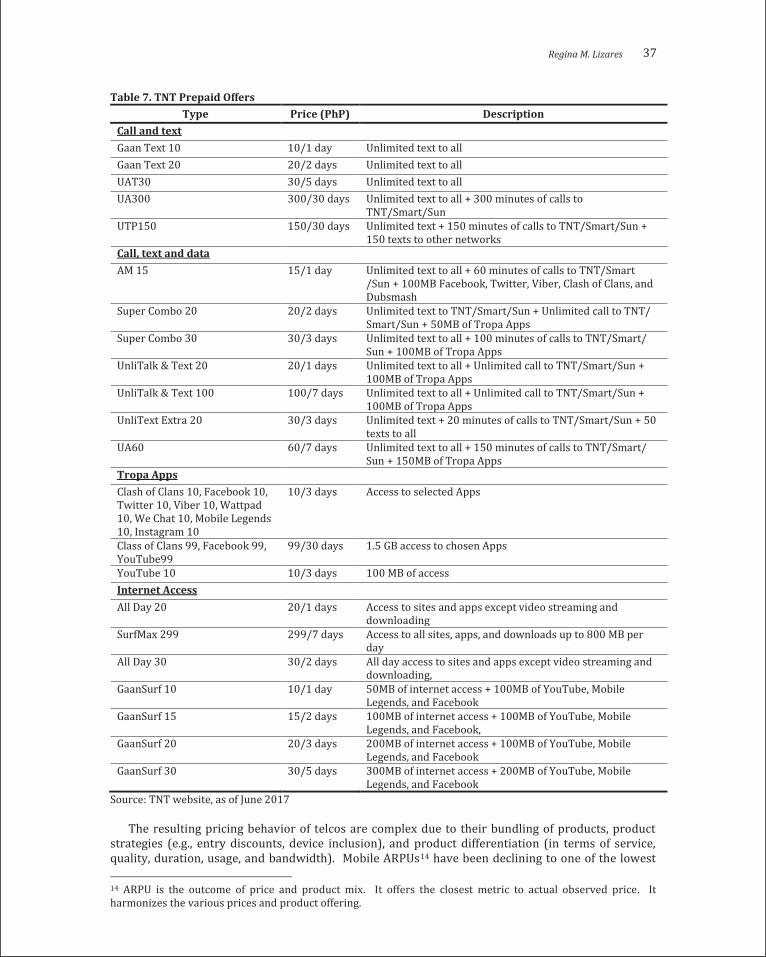
Table 7. TNT Prepaid Offers Type Price (PhP) Description
Call and text Gaan Text 10 10/1 day Unlimited text to all Gaan Text 20 20/2 days Unlimited text to all UAT30 30/5 days Unlimited text to all UA300 300/30 days Unlimited text to all + 300 minutes of calls to
TNT/Smart/Sun UTP150 150/30 days Unlimited text + 150 minutes of calls to TNT/Smart/Sun +
150 texts to other networks Call, text and data AM 15 15/1 day Unlimited text to all + 60 minutes of calls to TNT/Smart
/Sun + 100MB Facebook, Twitter, Viber, Clash of Clans, and Dubsmash
Super Combo 20 20/2 days Unlimited text to TNT/Smart/Sun + Unlimited call to TNT/ Smart/Sun + 50MB of Tropa Apps
Super Combo 30 30/3 days Unlimited text to all + 100 minutes of calls to TNT/Smart/ Sun + 100MB of Tropa Apps
UnliTalk & Text 20 20/1 days Unlimited text to all + Unlimited call to TNT/Smart/Sun + 100MB of Tropa Apps
UnliTalk & Text 100 100/7 days Unlimited text to all + Unlimited call to TNT/Smart/Sun + 100MB of Tropa Apps
UnliText Extra 20 30/3 days Unlimited text + 20 minutes of calls to TNT/Smart/Sun + 50 texts to all
UA60 60/7 days Unlimited text to all + 150 minutes of calls to TNT/Smart/ Sun + 150MB of Tropa Apps
Tropa Apps Clash of Clans 10, Facebook 10, Twitter 10, Viber 10, Wattpad 10, We Chat 10, Mobile Legends 10, Instagram 10
10/3 days Access to selected Apps
Class of Clans 99, Facebook 99, YouTube99
99/30 days 1.5 GB access to chosen Apps
YouTube 10 10/3 days 100 MB of access Internet Access All Day 20 20/1 days Access to sites and apps except video streaming and
downloading SurfMax 299 299/7 days Access to all sites, apps, and downloads up to 800 MB per
day All Day 30 30/2 days All day access to sites and apps except video streaming and
downloading, GaanSurf 10 10/1 day 50MB of internet access + 100MB of YouTube, Mobile
Legends, and Facebook GaanSurf 15 15/2 days 100MB of internet access + 100MB of YouTube, Mobile
Legends, and Facebook, GaanSurf 20 20/3 days 200MB of internet access + 100MB of YouTube, Mobile
Legends, and Facebook GaanSurf 30 30/5 days 300MB of internet access + 200MB of YouTube, Mobile
Legends, and Facebook Source: TNT website, as of June 2017
The resulting pricing behavior of telcos are complex due to their bundling of products, product strategies (e.g., entry discounts, device inclusion), and product differentiation (in terms of service, quality, duration, usage, and bandwidth). Mobile ARPUs14 have been declining to one of the lowest
14 ARPU is the outcome of price and product mix. It offers the closest metric to actual observed price. It harmonizes the various prices and product offering.
36 Assessment of the Conduct, Structure, and Performance of the Philippine Telecommunications Industry
Table 5. PLDT and Globe Postpaid Home Fixed Line plus DSL PLDT Globe
Speedster Plan 1299 Broadband Plan 1299 Maximum speed (Mbps) 10 10 Monthly volume allowance (GB) 100 50 (LTE) /100 (DSL) Others n.a. Free HOOQ, Netflix, NBA content for 6
months + Free WiFi router Phone Landline FREE Landline with Unlimited Calls to
Globe/TM One-time fee (PhP) 2,300 (monthly terms available) 2,200 for phone activation and DSL
installation (monthly terms available) Source: PLDT and Globe websites, as of June 2017
Table 6. TM Prepaid Offers Type Price (PhP) Description
Call Unlitawag 15/1 day Unlimited calls to TM/Globe Text Sulitxt5 5/1 day 25 texts to TM/Globe Txt5 5/1 day Add to Unlitawag15, unlimited text to TM/Globe Txt10 10/2 days Add to Unlitawag15, unlimited text to TM/Globe UnliAllNet10 10/1 day Unlimited texts to all network Dagdagtxt 5/1 day Add to Unlitawag15, 100 all net texts AstigTxt30 30/5 days Unlimited texts to TM/Globe Combo AllIn20 20/2 days Unlimited calls to TM/Globe + Unlimited texts to all networks +
Free 100 MB of Facebook ComboAll10 10/1 day Unlimited call to TM/Globe + Unlimited text to TM/Globe + 50 all
net texts ComboAll 15 15/2 days Unlimited call to TM/Globe + Unlimited text to TM/Globe + 50 all
net texts ComboAll 20 20/3 days Unlimited call to TM/Globe + Unlimited text to TM/Globe + 50 all
net texts Combo 15 15/2 days 120-minute calls to TM/Globe + Unlimited all-net texts Combo 20 20/3 days 120-minute calls to TM/Globe + Unlimited all-net texts Mobile Internet Net 2 2 for each
product/1 day musical.ly, You Tube, Clash of Clans, Google, Twitter, Instagram, WeChat
Net 5 5 or each product/2 days
musical.ly, You Tube, Clash of Clans, Google
GoSurf 10 10/1 day 40 MB allocation GoSurf 15 15/2 days 40 MB allocation + 30 MB musical.ly GoSurf 50 50/3 days 1 GB allocation + 300 MB for app of choice GoSurf 299 299/30 days 1.5 GB allocation + 1 GB for app of choice GoSurf 599 599/30 days 4 GB allocation + 1 GB for app of choice GoSurf 999 999/30 days 8 GB allocation + 1 GB for app of choice SuperSurf50 20/1 day Unlimited mobile internet SuperSurf200 200/5 days Unlimited mobile internet
Source: TM website, as of June 2017
Regina M. Lizares 37
Table 7. TNT Prepaid Offers Type Price (PhP) Description
Call and text Gaan Text 10 10/1 day Unlimited text to all Gaan Text 20 20/2 days Unlimited text to all UAT30 30/5 days Unlimited text to all UA300 300/30 days Unlimited text to all + 300 minutes of calls to
TNT/Smart/Sun UTP150 150/30 days Unlimited text + 150 minutes of calls to TNT/Smart/Sun +
150 texts to other networks Call, text and data AM 15 15/1 day Unlimited text to all + 60 minutes of calls to TNT/Smart
/Sun + 100MB Facebook, Twitter, Viber, Clash of Clans, and Dubsmash
Super Combo 20 20/2 days Unlimited text to TNT/Smart/Sun + Unlimited call to TNT/ Smart/Sun + 50MB of Tropa Apps
Super Combo 30 30/3 days Unlimited text to all + 100 minutes of calls to TNT/Smart/ Sun + 100MB of Tropa Apps
UnliTalk & Text 20 20/1 days Unlimited text to all + Unlimited call to TNT/Smart/Sun + 100MB of Tropa Apps
UnliTalk & Text 100 100/7 days Unlimited text to all + Unlimited call to TNT/Smart/Sun + 100MB of Tropa Apps
UnliText Extra 20 30/3 days Unlimited text + 20 minutes of calls to TNT/Smart/Sun + 50 texts to all
UA60 60/7 days Unlimited text to all + 150 minutes of calls to TNT/Smart/ Sun + 150MB of Tropa Apps
Tropa Apps Clash of Clans 10, Facebook 10, Twitter 10, Viber 10, Wattpad 10, We Chat 10, Mobile Legends 10, Instagram 10
10/3 days Access to selected Apps
Class of Clans 99, Facebook 99, YouTube99
99/30 days 1.5 GB access to chosen Apps
YouTube 10 10/3 days 100 MB of access Internet Access All Day 20 20/1 days Access to sites and apps except video streaming and
downloading SurfMax 299 299/7 days Access to all sites, apps, and downloads up to 800 MB per
day All Day 30 30/2 days All day access to sites and apps except video streaming and
downloading, GaanSurf 10 10/1 day 50MB of internet access + 100MB of YouTube, Mobile
Legends, and Facebook GaanSurf 15 15/2 days 100MB of internet access + 100MB of YouTube, Mobile
Legends, and Facebook, GaanSurf 20 20/3 days 200MB of internet access + 100MB of YouTube, Mobile
Legends, and Facebook GaanSurf 30 30/5 days 300MB of internet access + 200MB of YouTube, Mobile
Legends, and Facebook Source: TNT website, as of June 2017
The resulting pricing behavior of telcos are complex due to their bundling of products, product strategies (e.g., entry discounts, device inclusion), and product differentiation (in terms of service, quality, duration, usage, and bandwidth). Mobile ARPUs14 have been declining to one of the lowest
14 ARPU is the outcome of price and product mix. It offers the closest metric to actual observed price. It harmonizes the various prices and product offering.

38 Assessment of the Conduct, Structure, and Performance of the Philippine Telecommunications Industry
levels in the world (GSMA, 2014) (See Figure 4). Though monthly postpaid ARPU in 2015 is comparable to the range of ARPUs in developed country, postpaid comprises only 4% of the market as of end 2016; prepaid monthly ARPUs is less than USD3 (See Figure 5).
Benchmarking prices among selected Asia-Pacific countries show that the Philippines has one of the highest prices across all telecom services (See Figure 6), despite the declining ARPUs in mobile services. In all telecom services, except mobile-broadband prepaid handset-based, the Philippines has consistently the highest price as a percent of GNI per capita. Note that all the Asia-Pacific countries, except for Australia, Japan and New Zealand, are classified as developing countries (ITU, 2016)15. Narrowing the benchmarking of prices to just the neighboring ASEAN countries (Indonesia, Malaysia, Thailand and Vietnam, ex-Singapore), the Philippines’ prices are still the highest as a percent of GNI per capita except for fixed broadband. Figure 4. Philippine Telco Monthly ARPU, in PhP, 2011 to 2016
Source: PLDT and Globe, 2011-2016 (1) Smart, TNT and Sun Cellular are PLDT brands, while Globe and TM are Globe brands. (2) PLDT computes gross monthly ARPU by dividing gross mobile-cellular service revenues for the month, gross of
discounts, allocated content provider costs, and interconnection income, but excluding inbound roaming revenues, by the average number of subscribers in the month. Meanwhile, Globe computes ARPU by dividing recurring gross service revenues (gross of interconnect expenses) segment, by the average number of the segment’s subscribers, and then dividing the quotient by the number of months in the period.
(3) Globe’s 2015 and 2016 subscribers have been restated to reflect the change in the presentation of fully mobile-broadband subscribers to be part of the mobile business; it was reported under broadband previously. 2015 and 2016 ARPUs have been restated as well to reflect the said changes.
15 ITU follows the country classification of the United Nations (UN). It acknowledges that “… the definition of developing countries used in UN data includes a number of high-income economies, including some at the very top of the global income distribution …” (ITU, 2015, p. 12); and that “… the developing countries category includes countries at very different levels of both economic and ICT development” (ITU, 2015, p. 57).
171
107 101
63
190
117 124
82 75 90
- 20 40 60 80
100 120 140 160 180 200
2011 2012 2013 2014 2015 2016
Prepaid
Globe TM Smart
TNT Sun Cellular
1,223 1,128
1,548
966
450 443
- 200 400 600 800
1,000 1,200 1,400 1,600 1,800
2011 2012 2013 2014 2105 2016
Postpaid
Globe Smart Sun Cellular
Regina M. Lizares 39
Figure 5. Selected Countries Wireless Average Monthly ARPU, in USD, 2015
Source: Statista, n.d. (1) Based on the highest ARPU for the year, converted to USD using 2015 average PhP: USD exchange rate =
45.50:1 (BSP, 2017).
Figure 6. Asia-Pacific Telecom Prices, in Percent of GNI per Capita, 2015
Source: ITU, 2016
48.5442.92
38.26 36.5331.76 30.7
28.32 25.94 25.6722.46 22.11 21.15
2.83 (1)
24.66 (1)
0
10
20
30
40
50
60
Canada UnitedStates
Switzerland Norway Australia Singapore Japan Netherlands UnitedKingdom
Hong Kong France Sweden PhilippinePrepaid
PhilippinePostpaid
3.52
1.21
0.56
0.31
6.74
0.63
1.32
0.43
1.25
1.36
2.98
0.83
1.30
0.35
2.20
1.21
0.50
0.16
1.50
0.39
0.88
0.22
2.37
1.36
3.09
0.29
0.78
0.28
1.79
3.89
1.43
0.63
7.53
1.32
1.11
1.29
0.51
9.51
5.11
1.53
3.12
0.70
2.81
0.94
0.30
0.17
3.42
0.39
0.56
0.80
0.84
1.80
2.11
0.18
0.65
0.27
0.00 1.00 2.00 3.00 4.00 5.00 6.00 7.00 8.00 9.00 10.00
Vietnam
Thailand
Sri Lanka
Singapore
Philippines
New Zealand
Malaysia
Korea (Rep)
Japan
Indonesia
India
Hong Kong
China
Australia
Mobile Cellular
Fixed Broadband
Mobile Broadband, Pre-paid
Mobile Broadband, Postpaid

40 Assessment of the Conduct, Structure, and Performance of the Philippine Telecommunications Industry
All four telecom sub-baskets showed improvement in price as a percentage of GNI per capita in 2015 versus 2014 (See Table 8). The price improvement was not enough though for the Philippines to move up a quartile: (1) mobile-cellular services cost 3.4% of GNI per capita, in-line with the Asia-Pacific regional average; (2) fixed-broadband services cost 7.5% of GNI per capita, higher than half of the countries in the region that offer prices below 5% of GNI per capita; (3) prepaid handset-based mobile-broadband plans cost 1.5% of GNI per capita, similar to the majority of countries in the region that price less than 5% of GNI per capita; and (4) postpaid computer-based mobile-broadband plans cost 6.7% of GNI per capita, 4.5x higher than the prepaid handset option16 (ITU, 2015; ITU, 2016).
Table 8. Philippine Telecom Services, 2014 to 2015
Mobile-cellular Fixed-broadband
Prepaid handset-based mobile-broadband
Postpaid computer-based mobile-broadband
2014 2015 2014 2015 2014 2015 2014 2015
Global rank (out of a total of)
115 (182)
121 (193)
122 (181)
126 (190)
87 (167)
88 (184)
117 (162)
131 (184)
Quartile 3rd 3rd 3rd 3rd 2nd 2nd 3rd 3rd Price, % of GNI per capita 3.8 3.4 8.3 7.5 2.5 1.5 8.3 6.7 Source: ITU, 2015; ITU, 2016
The price of the service (and of the device) remains a critical determinant of whether people make use of telecom services (ITU, 2016). Except for mobile-cellular services, access and usage in the Philippines remain depressed compared to other Asia-Pacific countries, and globally (See Table 9). Broadband adoption for 4 Mbps, the lowest speed measured, is only at 39%, and adoption level lowers as speed offering increases (See Figure 7). Narrowing the benchmarking to just the neighboring ASEAN countries (Indonesia, Malaysia, Thailand and Vietnam, ex-Singapore), the Philippines continues to show lower numbers for access and usage, except for international internet bandwidth where it is higher than Indonesia, Malaysia (just in 2015), and Vietnam (See Table 9); and lower broadband adoption, except for speeds above 15 Mbps where is it higher than Indonesia (See Figure 7). The barrier to usage has a direct economic impact, as well as an indirect economic impact through spill-over effects over the rest of the economy. In the case of mobile-broadband, adoption can contribute an annual 0.61% of GDP (ITU, 2012).
Table 9. Asia-Pacific Access and Usage Indicators, 2015 Fixed
telephone subs/100
inhabitants(1)
Mobile-cellular
subs/100 inhabitants(2)
International Internet bandwidth bit/s/
internet user(3)
Fixed broadband subs/100
inhabitants(4)
Active mobile broadband subs/100
inhabitants(5) Country 2014 2015 2014 2015 2014 2015 2014 2015 2014 2015
Australia 38.9 38.0 131.2 132.8 75,569 81,564 27.7 27.9 112.2 112.9 China 17.9 16.5 92.3 93.2 5,141 6,530 14.4 18.6 41.8 56.0 Hong Kong 60.9 59.2 233.6 228.8 3,487,142 4,155,651 31.4 31.9 104.5 107.0 India 2.1 2.0 74.5 78.8 4,982 5,725 1.2 1.3 5.5 9.47 Indonesia 10.4 8.8 128.8 132.3 6,225 6,584 1.2 1.1 34.7 42.0 Japan 50.1 50.2 120.2 125.1 49.150 62,618 29.8 30.5 121.4 126.4 Korea (Rep) 59.5 58.1 115.7 118.5 43,358 46,764 38.8 40.2 108.6 109.7 Malaysia 14.6 14.3 148.8 143.9 29,932 34,119 10.1 9.0 58.3 89.9 New Zealand 40.6 40.2 112.1 121.8 95,081 108,506 31.0 31.5 92.7 114.2 Philippines 3.1 3.0 111.2 118.1 27,688 37,409 2.9 3.4 28.5 36.7 Singapore 36.2 36.0 146.9 146.1 677,144 737,006 26.7 26.5 141.7 142.2 Sri Lanka 12.6 12.0 103.2 112.8 12,651 13,886 2.6 3.1 13.0 15.8
16 In developing countries, fixed-broadband costs on average twice as much as mobile-broadband.
Regina M. Lizares 41
Fixed telephone subs/100
inhabitants(1)
Mobile-cellular
subs/100 inhabitants(2)
International Internet bandwidth bit/s/
internet user(3)
Fixed broadband subs/100
inhabitants(4)
Active mobile broadband subs/100
inhabitants(5) Thailand 8.5 7.9 144.4 125.8 54,788 64,907 8.1 9.2 79.9 75.3 Vietnam 6.0 6.3 147.1 130.6 20,749 24,373 6.5 8.1 31.0 39.0
Source: ITU, 2016 (1) Fixed-telephone subscriptions refers to the sum of active analogue fixed-telephone lines, voice-over-IP (VoIP)
subscriptions, fixed wireless local loop (WLL) subscriptions, ISDN voice-channel equivalents, and fixed public payphones. (2) Mobile-cellular telephone subscriptions refers to the number of subscriptions to a public mobile-telephone service
providing access to the public switched telephone network (PSTN) using cellular technology. It includes both the postpaid subscriptions, and active prepaid accounts (i.e. that have been active during the past three months). It includes all mobile-cellular subscriptions that offer voice communications. It excludes subscriptions via data cards, or USB modems, subscriptions to public mobile data services, private trunked mobile radio, telepoint, radio paging, and telemetry services.
(3) International Internet bandwidth refers to the total used capacity of international Internet bandwidth, in megabits per second (Mbit/s) – the average (over a 12-month period) traffic load of international fiber-optic cables, and radio links for carrying Internet traffic. International Internet bandwidth (bit/s) per Internet user is calculated by converting to bits per second, and dividing by the total number of Internet users.
(4) Fixed-broadband subscriptions refers to fixed subscriptions for high-speed access to the public Internet (a TCP/IP connection), at downstream speeds equal to or greater than 256 kbit/s, irrespective of the method of payment. It includes cable modem, DSL, fiber-to-the-home/building, other fixed-broadband subscriptions, satellite broadband, and terrestrial fixed wireless broadband. It includes fixed WiMAX and any other fixed wireless technologies, and both residential subscriptions, and subscriptions for organizations. It excludes subscriptions that have access to data communications (including the Internet) via mobile-cellular networks.
(5) Active mobile-broadband subscriptions refers to the sum of standard mobile-broadband subscriptions, and dedicated mobile-broadband subscriptions. The subscriptions can be used through handset-based, or computer-based (USB/dongles) devices. It covers actual subscribers, not potential subscribers, even though the latter may have broadband-enabled handsets.
Figure 7. Asia-Pacific Broadband Adoption (IPV4 (1)), in Percent of Population, Q4 2016
Source: Akamai17, 2016; covers 148 countries (1) Internet Protocol version 4 (Ipv4) is the fourth version of the Internet Protocol (IP)
17 Akamai is a content delivery network and cloud services provider headquartered in Massachusetts, USA. Since 2008, they have come up quarterly with a “State of the Internet” report that shares informed view into online connectivity, cyber security trends, and metrics, including internet connection speeds, broadband adoption, mobile usage, outages, cyberattacks, and web security threats.
11
43
38
11
69
51
6
32
14
52
5
10
54
5
19
37
72
65
22
85
72
11
52
32
73
18
19
71
20
35
86
87
95
82
98
94
39
91
72
93
76
42
94
81
81
0 20 40 60 80 100 120
Vietnam
Thailand
Taiwan
Sri Lanka
South Korea
Singapore
Philippines
New Zealand
Malaysia
Japan
Indonesia
India
Hong Kong
China
Australia
% Above 4 Mbps% Above 10 Mbps% Above 15 Mbps

42 Assessment of the Conduct, Structure, and Performance of the Philippine Telecommunications Industry
3.2 Service Quality Among the Asia-Pacific countries, the Philippines ranks poorly in terms of internet connection
speed, and at best, on average in terms of mobile connection speed, but still below global averages. Both telcos have comparable mobile network performance.
In terms of average internet interconnection speed, the Philippines has shown an increase year on year (YoY) and quarter on quarter (QoQ), at the end of the first quarter of 2017 (Akamai, 2017) (See Table 10). Despite this, the Philippines ranks the lowest among the 15 countries surveyed in Asia-Pacific, and is in the third quartile globally for average internet interconnection speed. The Philippines’ average speed is only 17% that of the highest average speed ─ South Korea (See Table 10).
Table 10. Asia-Pacific Average Connection Speed (IPV4), Q1 2017 Global Rank Country Q1 2017 Avg Mbps QoQ Chg (%) YoY Chg (%)
1 South Korea 28.6 9.3 -1.7 4 Hong Kong 21.9 -0.2 10 7 Singapore 20.3 0.8 23 8 Japan 20.2 3.1 11
16 Taiwan 16.9 7.9 14 21 Thailand 16.0 20 49 27 New Zealand 14.7 14 40 50 Australia 11.1 9.6 26 58 Vietnam 9.5 15 89 62 Malaysia 8.9 9.1 40 68 Sri Lanka 8.5 17 58 74 China 7.6 20 78 77 Indonesia 7.2 6.7 59 89 India 6.5 17 87
100 Philippines 5.5 20 57 Source: Akamai, 2017; covers 148 countries
Meanwhile, average page load time18 provides insight into performance across devices and networks. Of the 74 countries reviewed globally, the Philippines falls slightly below the mid-range for broadband, and slightly above the mid-range for mobile, in terms of average page load time. It however falls below its neighboring ASEAN countries (Indonesia, Malaysia, Thailand and Vietnam, ex-Singapore) for all three measures (See Table 11).
Table 11. Asia-Pacific Average Page Load Times Based on Real User Monitoring, Q4 2016
Country Avg. Page Load Time Broadband (millisecond)
Avg. Page Load Time Mobile (millisecond) Mobile Penalty19
Australia 3535 4648 1.3x China 2696 2311 0.9x Hong Kong 2265 3534 1.6x India 3848 5018 1.3x
18 This measurement does not just reflect broadband network speeds. It is also influenced by factors such as average page weight, page composition, and the Akamai customer content consumed by users within these countries. 19 Mobile penalty is the ratio of average page load times on mobile connections versus average load times on broadband connections. This ratio should not be taken as a pure comparison of mobile versus broadband network speeds, as these speeds are just one factor in the overall user experience. Mobile penalty lower than 1.0x means that average page load times is faster on mobile connections than on broadband connections.
Regina M. Lizares 43
Country Avg. Page Load Time Broadband (millisecond)
Avg. Page Load Time Mobile (millisecond) Mobile Penalty19
Indonesia 3606 4892 1.4x Japan 2133 2975 1.4x Malaysia 3250 3386 1.0x New Zealand 2064 4704 2.3x Philippines 3925 6747 1.7x Singapore 2133 2764 1.3x South Korea 1898 2725 1.4x Sri Lanka 2740 3044 1.1x Taiwan 2236 3182 1.4x Thailand 2361 1555 0.7x Vietnam 2533 3758 1.5x Ranges 1.4 seconds (Israel) to 6.7
seconds (Venezuela) 0.6 seconds (Saudi Arabia) to 9.0 seconds (Nigeria)
0.4x (Saudi Arabia) to 2.3x (New Zealand)
Source: Akamai, 2016; covers 74 countries
In terms of average mobile connection speed, the Philippines ranks in the mid-range in Asia-Pacific, and offers faster connection speed than all its neighboring ASEAN countries except Indonesia (See Figure 8). But this is still below the global mid-range with the Philippines’ average speed only 33% that of the highest average speed ─ United Kingdom.
Figure 8. Asia-Pacific Average Mobile Connection Speeds (IPV4), in Mbps (1), Q1 2017
Source: Akamai, 2017; covers 62 countries Note: Range is from 26.0 (UK) to 2.8 (Venezuela) (1) Source data in this section encompasses usage from smartphones, tablets, computers, and other devices that connect to
the internet through mobile network providers. (2) Fewer than 25,000 unique Ipv4 addresses classified as mobile observed
Direct comparison of mobile network metrics show that Globe and PLDT/Smart have very similar performance (See Figure 9), particularly in terms of download speed (3G and overall), and latency20 (4G). PLDT/Smart only shows better performance than Globe in latency (3G). Meanwhile in 4G,
20 Latency is the delay data experiences as it makes a round trip through the network. A lower score in this metric is a sign of a more responsive network.
15.7 15.6
13.0 13.0 12.811.8
9.38.7 8.6 8.6
6.9 6.85.3 4.9 4.4
0.0
2.0
4.0
6.0
8.0
10.0
12.0
14.0
16.0
18.0
Australia Japan NewZealand
Taiwan Indonesia SouthKorea
China Philippines(2)
Singapore Thailand Sri Lanka Hong Kong Vietnam India Malaysia
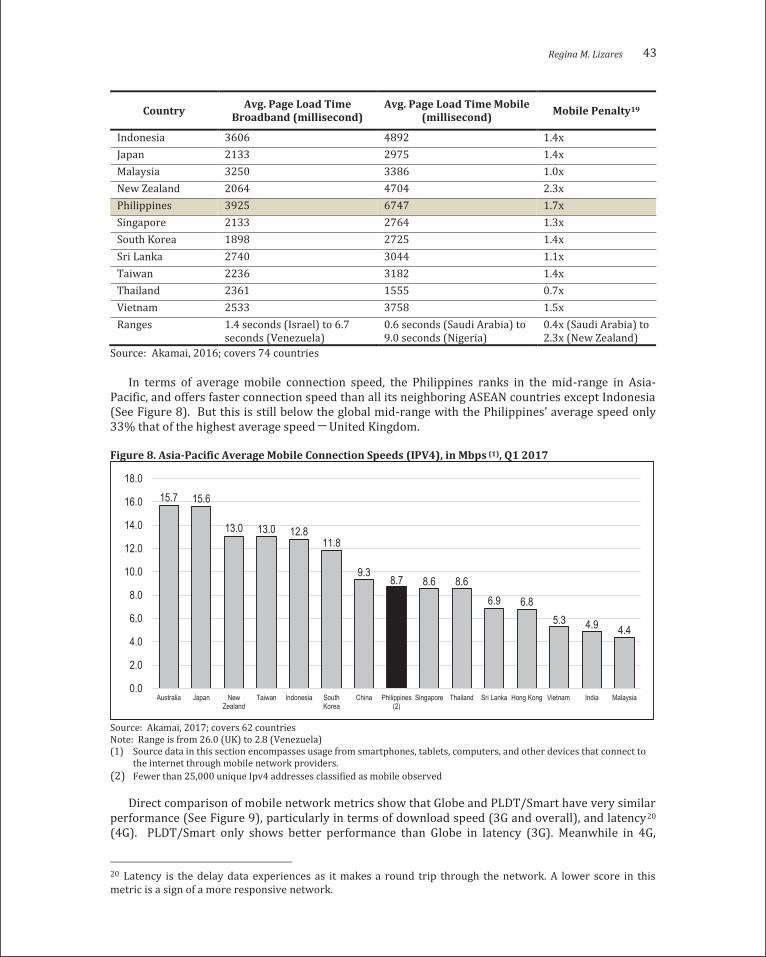

44 Assessment of the Conduct, Structure, and Performance of the Philippine Telecommunications Industry
PLDT/Smart surpasses Globe in terms of LTE speed tests, but Globe is ahead of PLDT/Smart in terms of LTE availability. Nevertheless, LTE access currently is far from widespread in the Philippines, and LTE connection speeds for both telcos are relatively slow compared to the worldwide average of 17.4 Mbps.
Figure 9. Philippine Mobile Network Comparison, 2017
Source: OpenSignal21
4 Performance
Performance refers to the outcomes resulting from the current market structure, and conduct of industry players. Key indicators of financial performance include revenue growth, EBITDA margins, return on equity (ROE), and return on assets (ROA) over time. Economists compute also for market power as a gauge of market performance.
Overall, the Philippine telecom market grew over the period 2011 to 2016, with EBITDA margins, and return ratios having been healthy. Indication also point to telcos having market power.
4.1 Financial Performance Philippine telecom revenues have increased from PhP 237 to PhP 282 billion22, in constant 2011
prices, for the period 2011 to 2016, representing a 3.8% compound annual growth rate (CAGR). Revenue growth has been driven by mobile data & others, and broadband (See Figure 10).
21 OpenSignal is a UK company that specializes in wireless coverage mapping. The company crowdsources data on carrier signal quality from users who have its consumer mobile application installed. 22 Combined service revenue of PLDT and Globe
Regina M. Lizares 45
Figure 10. Philippine Telcom Revenue Growth (2011 Constant Terms), in Percent, 2011 to 2016
Source: PLDT and Globe, 2011-2016
Globe’s and PLDT’s EBITDA margins averaged 40% and 47%, respectively, for the period 2011 to 2016 (See Figure 11). Compared to other regional telcos, for fiscal year 2016, only Maxis and Telekom Indonesia had EBITDA margins larger than that of Globe and PLDT, and both Globe and PLDT had EBITDA margins higher than the regional average of 37% (See Figure 12).
Figure 11. PLDT and Globe EBITDA Margin, in Percent, 2011 to 2016
Source: Eikon Thompson Reuter, 2017
Figure 12. Selected ASEAN EBITDA Margin, in Percent, 2016
Source: Eikon Thompson Reuters, 2017
3.8%
2.6%
-1.5%
-4.7%
45.7
6.5%
13.6%
15.7%
-1.7%
Service Revenue
Mobile
Voice
SMS
Mobile Data & Others
Fixed Line & Broadband
Voice
Broadband
Fixed Data & Others
43 41 39 38 38 40
54 51 48 4842 40
0
10
20
30
40
50
60
2011 2012 2013 2014 2015 2016Globe PLDT
5350
4040
3931
30292929
MaxisTelekom IndonesiaGlobePLDTAxiataTelekom MalasyiaSingtelM1DigicomStarHub
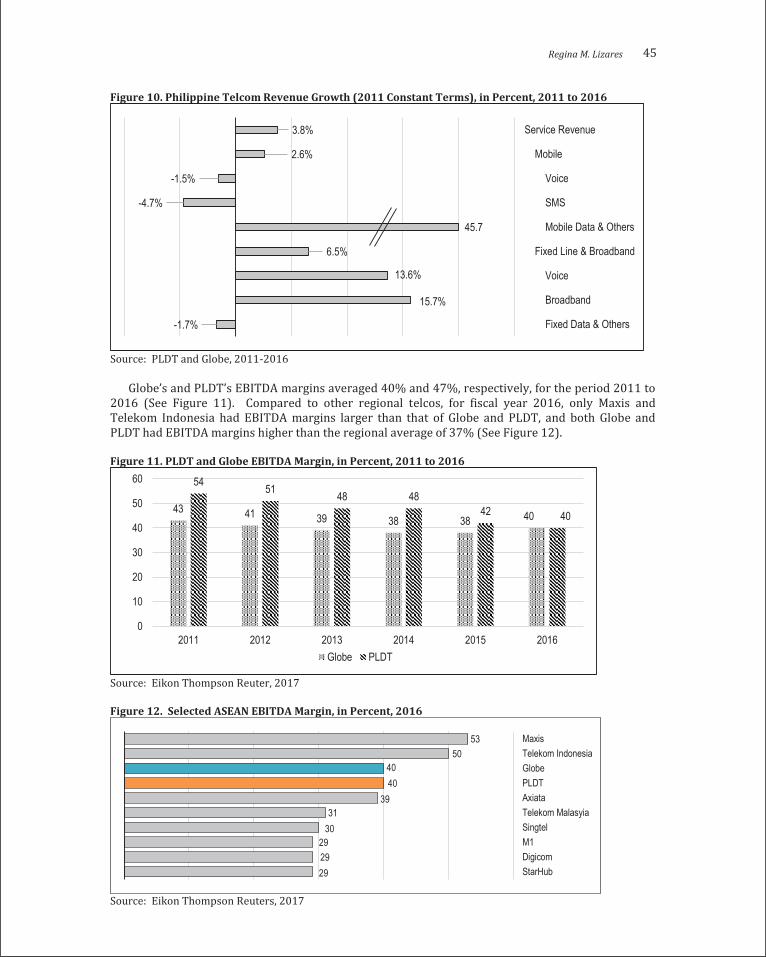
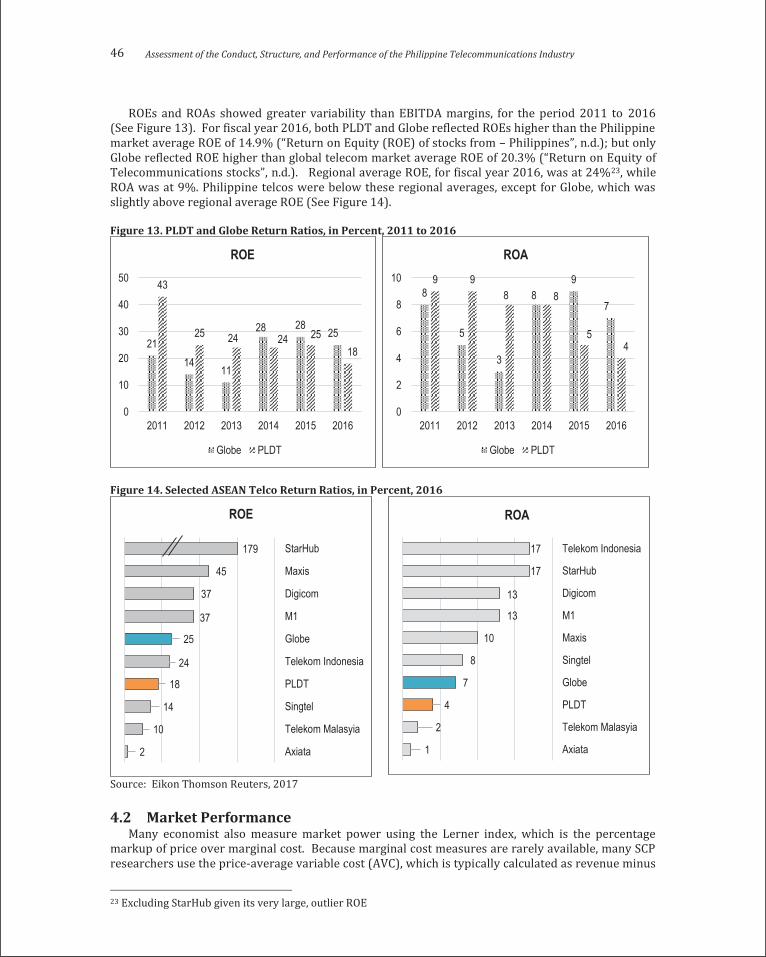
46 Assessment of the Conduct, Structure, and Performance of the Philippine Telecommunications Industry
ROEs and ROAs showed greater variability than EBITDA margins, for the period 2011 to 2016 (See Figure 13). For fiscal year 2016, both PLDT and Globe reflected ROEs higher than the Philippine market average ROE of 14.9% (“Return on Equity (ROE) of stocks from – Philippines”, n.d.); but only Globe reflected ROE higher than global telecom market average ROE of 20.3% (“Return on Equity of Telecommunications stocks”, n.d.). Regional average ROE, for fiscal year 2016, was at 24%23, while ROA was at 9%. Philippine telcos were below these regional averages, except for Globe, which was slightly above regional average ROE (See Figure 14).
Figure 13. PLDT and Globe Return Ratios, in Percent, 2011 to 2016
Figure 14. Selected ASEAN Telco Return Ratios, in Percent, 2016
Source: Eikon Thomson Reuters, 2017
4.2 Market Performance Many economist also measure market power using the Lerner index, which is the percentage
markup of price over marginal cost. Because marginal cost measures are rarely available, many SCP researchers use the price-average variable cost (AVC), which is typically calculated as revenue minus
23 Excluding StarHub given its very large, outlier ROE
2114
11
28 2825
43
25 24 24 2518
0
10
20
30
40
50
2011 2012 2013 2014 2015 2016
ROE
Globe PLDT
8
5
3
89
7
9 98 8
54
0
2
4
6
8
10
2011 2012 2013 2014 2015 2016
ROA
Globe PLDT
179
45
37
37
25
24
18
14
10
2
StarHub
Maxis
Digicom
M1
Globe
Telekom Indonesia
PLDT
Singtel
Telekom Malasyia
Axiata
ROE
17
17
13
13
10
8
7
4
2
1
Telekom Indonesia
StarHub
Digicom
M1
Maxis
Singtel
Globe
PLDT
Telekom Malasyia
Axiata
ROA
Regina M. Lizares 47
payroll minus material cost divided by revenue (Perloff et al., 2007). The extent to which a firm can benefit from the industry’s monopolistic or oligopolistic condition is dependent as well on the flexibility of its demand curve. The Lerner index is between 0 and 1; the closer it is to 0, the closer it is to perfect competition; the closer it is to 1, the higher market power the seller has, and hence the closer it is to a monopoly. PLDT’s and Globe’s Lerner index are at the 0.7 level (See Figure 15). It has remained at this level, even with the presence of Digitel until 2010.
Figure 15. Philippine Telecom Industry Lerner Index, 2008 to 2016
Source: PLDT and Globe, 2011-2016; Digitel, 2010
Ideally, in the presence of longer time series data, the appropriate performance analysis for capital-intensive network industries, like telecoms, is to compute for its real internal rates of return (IRR)24. Once IRR is computed, it should be compared to the real market opportunity cost, and/or the real IRR of other capital intensive industries over the same period. Only when the firm’s IRR are in excess of the market opportunity cost or other industry IRRs can it be concluded that market power is being exercised.
5 Conclusion
For the period 2011 to 2016, several significant changes occurred in the Philippine telecom industry. Mobile density increased over the five year period from 99% to 124%, aided by: (1) sustained annual capital expenditure (capex) of the telecom companies (telcos) of over 20% of service revenue for the period 2014 to 2015; and (2) innovative buffet pricing and product bundles to attract and retain customers. Though telecom prices decreased and quality improved, compared to other countries, prices remain moderately high, serving as a barrier to usage, and quality was still relatively poorer. Regulators, who can influence these prices and quality, and overall industry competition, were passive and behaved administratively, and were not pro-active policy formulators and implementers (Patalinghug & de Llanto, 2005).
This paper aimed to assess this condition existing in the Philippine telecom industry using the Structure-Conduct-Performance (SCP) framework. The SCP framework suggests that the industry’s performance, the success of an industry in producing benefits for consumers, depends on the conduct, behavior of sellers and buyers, which depends on the structure of the market.
In terms of structure, the telecom market is highly concentrated, with significant barriers to entry. It is a duopoly, with an industry HHI of 5147, as of 2016. Entry barriers are high, lowering market
24 Real IRR is computed by using annual real cash flow of the firm, which is nominal EBITDA minus annual capex and other cash investment, deflated to convert it to real terms.
0.75 0.76 0.74 0.73 0.73 0.72
0.810.73 0.750.74 0.72 0.71
0.770.74 0.74 0.75 0.72 0.72
0.68 0.67 0.66
0.00
0.10
0.20
0.30
0.40
0.50
0.60
0.70
0.80
0.90
2008 2009 2010 2011 2012 2013 2014 2015 2016Globe PLDT Digitel

48 Assessment of the Conduct, Structure, and Performance of the Philippine Telecommunications Industry
contestability, or the threat of a new entrant challenging the incumbents. Barriers to entry are substantial: a Congressional franchise and a NTC license to operate; spectrum allocation; large initial fixed and sunk capital investments (as much as USD 2.5 billion), and on-going capex (close to 30% capex to service revenue ratio); decentralized LGU regulation for permits and taxes; and possible strategic non-cooperative behavior from incumbents (on access, interconnection, product lock-in, etc.). More thoughtful regulations (with respect to franchises, licenses, spectrum allocation, and taxes) and more active regulators can partially lower the entry barriers of this naturally high capital intensive industry; as well as enforce increasing service quality demands on telcos.
This market structure strongly influences the conduct of the incumbents. The Philippine telecom industry employs second-degree price discrimination, as evidenced by its complex buffet and bundled pricing and products. Given the duopoly, PLDT and Globe’s actions echo each other, in terms of product and pricing, service quality, customer retention activities, and innovations (on tariff structure and products). Their actions involve strategic deliberations, as they consider how their actions affect their rivals, and how they are likely to react. Economist have shown that competitive conduct would quickly change with an entry of a third firm. However, over the last decade, the Philippine telecom market has been on a path of consolidation, increasing industry concentration through a series of M&A.
Industry ARPU has been declining to one of the lowest level in the world, while churn is one of the highest in the world. Despite this, prices are at best on par, or higher than regional average, while service quality (interconnection speeds) is lower.
Lastly, both the market structure and conduct of incumbents impact the market performance. Philippine telecom market has grown 3.8% CAGR, in 2011 constant terms, for the period 2011 to 2016. Industry EBITDA margins, ROE, and ROAs have been healthy. Market power is also exercised by the incumbents, with a Lerner index at the 0.7 level.
Extending this study, further research can be done on the relationship of the Philippine telecom industry’s SCP, or portions of it, to the country’s more expensive (See Figure 6) and poorer access (See Table 9) and quality services (See Tables 10 and 11), vis-à-vis other countries. How is it that despite the high telecom prices as a percentage of GNI per capita (See Figure 6), there is declining (See Figure 4) and lower comparable ARPUs (See Figure 5)? Is the pricing the cause or the outcome of low usage (See Table 9 and Figure 6); or even slow interconnection speed (See Table 10), average page load time (See Table 11), and average mobile connection speed (See Figure 8)?
In summary, the Philippine telecom industry is highly concentrated with low market contestability. The incumbents commonly parallel each other’s strategic actions and foil each other from exercising excessive market power (of raising prices or reducing service quantity/quality).
References
Abellanosa, V. (2017). From eight months to seven days: DICT calls for expediting of permits for telco services. Department of Information and Commutations Technology. Retrieved from http://www.dict.gov.ph/wp-content/uploads/2017/05/The-Upload-PR4B_FINAL_FOR_PRINT_ 04-21-2017.pdf
Akamai. (2016). State of the internet Q4 2016 report. Retrieved from https://www.akamai.com/us/ en/multimedia/documents/state-of-the-internet/q4-2016-state-of-the-internet-connectivity-report.pdf
Akamai. (2017). State of the internet Q1 2017 report. Retrieved from https://www.google.com.ph/ search?q=akamai+state+of+internet+report+q1+2017&oq=akamai+&aqs=chrome.4.69i57j0l3j35i39l2.3199j0j7&sourceid=chrome&ie=UTF-8
Bangko Sentral ng Pilipinas (BSP). (2017). Pesos per US dollar rate (2011-2017). Retrieved from http://www.bsp.gov.ph/statistics/spei_new/tab12_pus.htm
Baumol, W. (1982). Contestable markets: An uprising in the theory of industry structure. American Economic Review, 72(1), 1-15.
Bresnahan, T., & Reiss, P. (1991). Entry and competition in concentrated markets. Journal of Political Economy, 99(5), 977-1009.
Regina M. Lizares 49
Cayanan, A., & Suan, I. (2014). Pricing in regulated industries: The telecommunications sector. Philippine Management Review, 21, 53-68.
Delavin, I. (2017, March 23). ABS-CBN expects mobile unit to break even. Business World Online. Retrieved from http://www.bworldonline.com/content.php?section=Corporate&title=abs-cbn-expects-mobile-unit-to-break-even-&id=142641
Digital Telecommunications Philippines, Inc. (2010). SEC form 17-A. Eikon Thomson Reuters. Retrieved from http://financial.thomsonreuters.com/
Galla, P. (2016). The problem of #phinternet: How can President Duterte make Philippine telecommunications faster, more reliable, cheaper, and more accessible across the country? Retrieved from http://www.democracy.net.ph
Genio, G. (2016, June). Globe briefing. Raffles Hotel, Makati City. Globe Telecom, Inc. (2011-2016). SEC form 17-A. Retrieved from http://investor-
relations.globe.com.ph/ GSMA. (2014). Country overview: Philippines growth through innovation. Retrieved from
https://www.gsmaintelligence.com/research/2014/12/country-overview-philippines/449/ Habito, C. (2016a). Our internet speed-er, slowness. Philippine Daily Inquirer. Retrieved from
http://opinion.inquirer.net/95403/internet-speed-er-slowness Habito, C. (2016b). Falling short on telecoms policy. Philippine Daily Inquirer. Retrieved from
http://opinion.inquirer.net/96711/falling-short-telecoms-policy Hauge, J., & Jamison, M. (2009). Analyzing telecommunications market competition: Foundations for
best practice. Retrieved from http://citeseerx.ist.psu.edu/viewdoc/download?doi= 10.1.1.542. 6468& rep=rep1&type=pdf
Herfindahl-Hirschman Index – HHI. (2015). Retrieved from http://www.investopedia.com/ terms/h/hhi.asp
Oxford Business Group. (2017). Deregulation in Philippines' telecoms sector improves service and quality [Web log post]. Retrieved from https://www.oxfordbusinessgroup.com/overview/ mobile-nation-increasing-investment-has-led-improvements-service-and-quality-while-competition-set
EY. (2014). Inside telecommunications. Retrieved from http://file:///E:/Documents/EY-inside-telecommunications-issue-12.pdf
International Telecommunication Unit. (2012). The economic impact of broadband in the Philippines. Retrieved from https://www.itu.int/ITU-D/treg/broadband/BB_MDG_Philippines_BBCOM.pdf
International Telecommunication Unit. (2015). Measuring the information society report. Retrieved from http://www.itu.int/en/ITU-D/Statistics/Pages/publications/mis2014.aspx
International Telecommunication Unit. (2016). Measuring the information society report. Retrieved from http://www.itu.int/en/ITU-D/Statistics/Pages/publications/mis2016.aspx
Jiao, C. (2016, July 13). PLDT, Globe sue competition watchdog, block review of SMC buyout. CNN Philippines. Retrieved from http://cnnphilippines.com/business/2016/07/13/PLDT-Globe-sue-competition-watchdog.html
Lucky, R., & Eisenberg, J. (2006). Renewing U.S. telecommunications research. Washington, D.C.: National Academies Press. Retrieved from https://www.nap.edu/read/11711/chapter/
Mirandilla-Santos, M. (2016). Philippine broadband: A policy brief. Arangkada Philippines- Policy Briefs and Policy Notes. Retrieved from http://www.investphilippines.info/arangkada/policy-briefs/
Montealegre, K. (2017, June 1). PCC hits telcos over final payment for SMC assets. Business World Online. Retrieved from http://www.bworldonline.com/content.php?section=Corporate&title =pcc-hits-telcos-over-final-payment-for-smc-assets&id=146070
National Telecommunications Communication. (2012-2014). Annual Report. Retrieved from http://ntc.gov.ph/?page_id=1054
Nielsen. (2016). What people watch, what people buy [Web log post]. Nielsen.com. Retrieved from http://www.nielsen.com/ph/en.html
OpenSignal. (2017). State of mobile networks: Philippines. Retrieved from https://opensignal.com/reports/2017/03/philippines/state-of-the-mobile-network
50 Assessment of the Conduct, Structure, and Performance of the Philippine Telecommunications Industry
Patalinghug, E., & de Llanto, G. (2005). Competition policy and regulation in power and telecommunications (Discussion paper series no. 2005-18). Makati City: Philippine Institute for Development Studies.
Perloff, J., Karp, L., & Golan, A. (2007). Estimating market power and strategies. New York, NY: Cambridge University Press.
Philippine Long Distance Telecommunications Company. (2011-2016). SEC form 17-A. Retrieved from http://www.pldt.com/investor-relations
Pindyck, R. S., & Rubinfeld, D. L. (2013) Microeconomics. Singapore: Pearson Education, South Asia Pte. Ltd.
Philippine Statistics Authority. (n.d.). Price indices. Psa.gov.ph. Retrieved from https://psa.gov.ph/ business/price-indices
Population, total. (n.d.). Data.worldbank.org. Retrieved from http://data.worldbank.org/indicator/ SP.POP.TOTL?locations=PH
Porter, M. E. (1981). The contributions of industrial organization to strategic management. Academy of Management Review, 6(4), 609-620.
Return on Equity (ROE) of stocks from – Philippines. (n.d.). Returnsonequity.com. Retrieved from http://www.returnsonequity.com/country-Philippines.html
Return on Equity of Telecommunications stocks. (n.d.). Returnsonequity.com. Retrieved from http://www.returnsonequity.com/industry-Telecommunications.html
Schmalensee, R. (1989). Inter-industry studies of structure and performance. In R. Schmalensee and R. Willig (eds.), Handbook of industrial organization, Volume II (pp. 951-1009). Amsterdam: North Holland.
Secor Consulting. (2010). Perspectives on scenarios for foreign direct investment in the Canadian telecommunications industry. Retrieved from https://www.ic.gc.ca/eic/site/smt-gst.nsf/vwapj/ MTS_Allstream_RelatedDocuments.pdf/$FILE/MTS_Allstream_RelatedDocuments.pdf
Serafica, R. (2001). Competition in Philippine telecommunications: A survey of the critical issues. (Working Paper Series 2001-01). Manila: Philippine Institute for Development Studies.
Shepherd, W. (2004). Access pricing, innovation, and effective competition. Australian Competition and Consumer Commission. Retrieved from https://www.accc.gov.au/system/files/ Session%202_Dynamic%20Efficiencies%20-%20William%20G%20Sherpherd%20(paper)%20-%20Access%20Pricing,%20Innovation,%20%26%20Effective%20Competition.pdf
Somosot, J. (2016, May 6). ABS-CBN mobile lost more than a million subscribers in 2015. International Business Times. Retrieved from http://www.ibtimes.ph/abs-cbn-mobile-lost-more-million-subscribers-2015-2105
Statista. (n.d.). Mobile ARPU by country 2015 | Statistic. Retrieved from https://www.statista.com/ statistics/203642/forecast-for-the-global-average-revenue-per-mobile-user-in-2015-by-region/
Tirole, J. (1993). The theory of industrial organization (2nd ed.). Cambridge, Massachusetts: The MIT Press.
Torres-Tupas, T. (2017). CA affirms PLDT, Globe buyout deal of SMC’s telco assets. Business.inquirer.net. Retrieved from http://business.inquirer.net/239099/ca-affirms-pldt-globe-buyout-deal-of-smcs-telco-assets
USAID. (2016). The Philippines and the Trans-Pacific Agreement: A readiness assessment. Retrieved from https://www.uschamber.com/sites/default/files/2the_philippines_and_the_tpp-_a_ readiness_assessment.pdf
Waring, J. (2015). Blog: Will three be a crowd in the Philippines [Web log post]. Retrieved from http://www.mobileworldlive.com/asia/asia-blogs/blog-will-three-be-a-crowd-in-the-philippines/
Regina M. Lizares 51
Appendix
Table 12. Philippine Mobile Subscriber Base, in Thousands, 2011 to 2016 2011 2012 2013 2014 2015 2016
Globe 30,040 33,119 38,475 44,041 56,183(1) 62,800(1) PLDT(2) 63,697 71,798 72,063 72,511 68,612 62,763 ABS CBN Convergence, Inc. 52(3) 1,700(4) 493(5) 904(5) Total Subscribers 93,737 104,917 110,590 118,252 125,288 126,467 Population, in million(6) 95 96 98 99 101 102 Mobile Density, in % 99 109 113 119 124 124 Market Share, in % 100 100 100 100 100 100 Globe 32 32 35 37 45 50 PLDT 68 68 65 61 55 50 ABS-CBN Convergence, Inc. 0 1 0 1
Source: PLDT and Globe, 2011-2016 (1) From 2015 onwards, subscribers have been restated to reflect the change in the presentation of fully
mobile- broadband subscribers to be part of the mobile business; it was reported under broadband previously.
(2) From 2012 onwards, subscribers have been restated to reflect mobile and Home broadband (wireless) subscribers to be part of the mobile business; it was reported under broadband previously.
(3) National Telecommunications Commission (NTC) (4) Somosot, 2016 (5) Delavin, 2017 (6) "Population, total", n.d.; 2016 is an estimate based on the average of prior population growth rates.
Table 13. Philippine Broadband Subscriber Base, in Thousands, 2011 to 2016 Globe(1) PLDT(2)
2011 2012 2013 2014 2015 2016 2011 2012 2013 2014 2015 2016
Broadband 1,411 1,672 2,032 2,778 1,069 1,131 2,931 1,331 1,415 1,481 1,415 1,515 Wireless 1,122 1,331 1,654 2,351 421 520 2,068 427 436 332 436 259 Wireline 289 341 378 427 647 611 862 904 979 1,149 979 1,256 Market Share, in % 33 56 59 65 43 43 67 44 41 35 57 57 Wireless 35 76 79 88 49 67 65 24 21 12 51 33 Wireline 25 27 28 27 40 33 75 73 72 73 60 67
Source: PLDT and Globe, 2011-2016 (1) From 2015 onwards, subscribers have been restated to reflect the change in the presentation of fully
mobile- broadband subscribers to be part of the mobile business; it was reported under broadband previously.
(2) From 2012 onwards, subscribers have been restated to reflect mobile and Home broadband (wireless) subscribers to be part of the mobile business; it was reported under broadband previously.
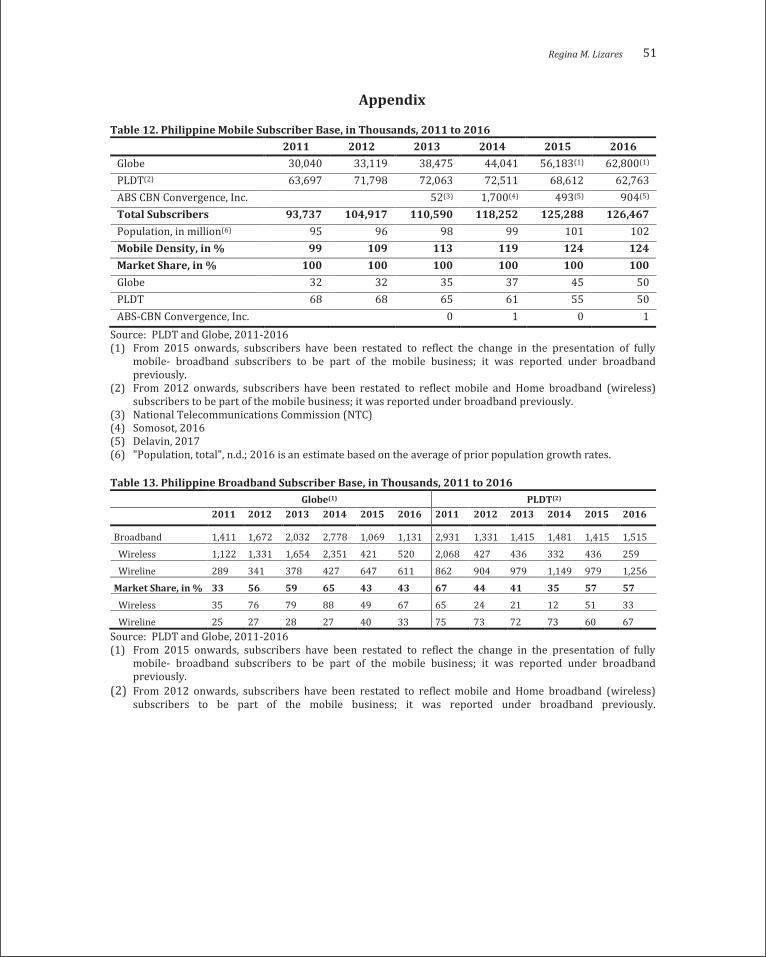
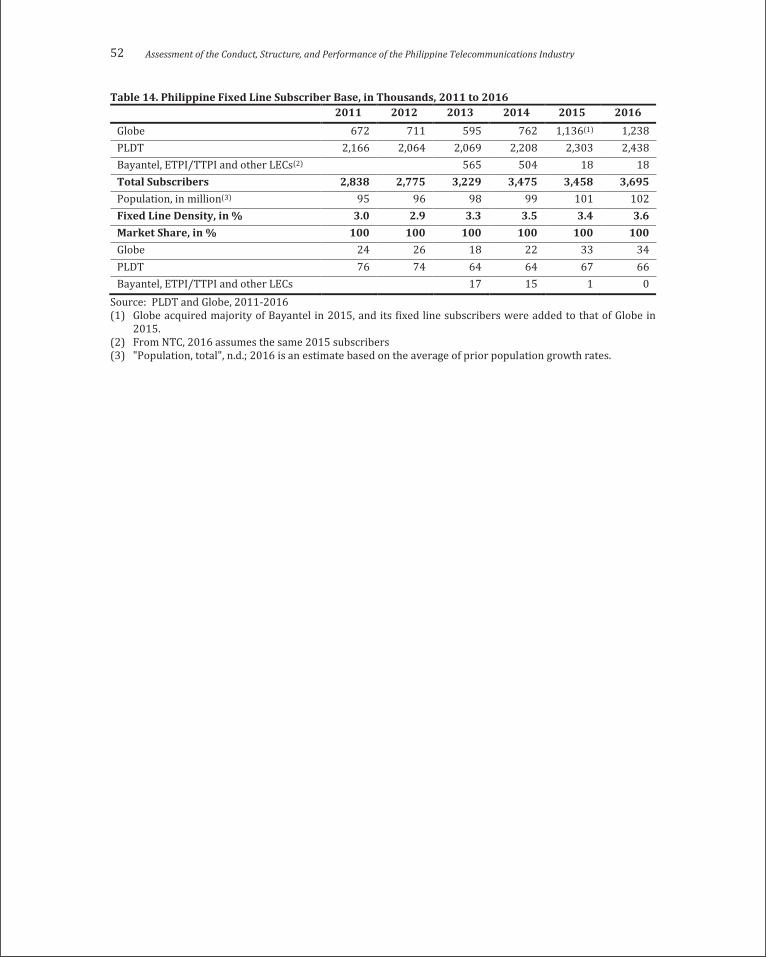
52 Assessment of the Conduct, Structure, and Performance of the Philippine Telecommunications Industry
Table 14. Philippine Fixed Line Subscriber Base, in Thousands, 2011 to 2016 2011 2012 2013 2014 2015 2016
Globe 672 711 595 762 1,136(1) 1,238 PLDT 2,166 2,064 2,069 2,208 2,303 2,438 Bayantel, ETPI/TTPI and other LECs(2) 565 504 18 18 Total Subscribers 2,838 2,775 3,229 3,475 3,458 3,695 Population, in million(3) 95 96 98 99 101 102 Fixed Line Density, in % 3.0 2.9 3.3 3.5 3.4 3.6 Market Share, in % 100 100 100 100 100 100 Globe 24 26 18 22 33 34 PLDT 76 74 64 64 67 66 Bayantel, ETPI/TTPI and other LECs 17 15 1 0
Source: PLDT and Globe, 2011-2016 (1) Globe acquired majority of Bayantel in 2015, and its fixed line subscribers were added to that of Globe in
2015. (2) From NTC, 2016 assumes the same 2015 subscribers (3) "Population, total", n.d.; 2016 is an estimate based on the average of prior population growth rates.
Philippine Management Review 2018, Vol. 25, 53-70.
Social Distance, Connectedness, and Product Familiarity on Endorsement Evaluations: An Experimental Approach
Dave Centeno, Ph.D.*University of the Philippines, Cesar E.A. Virata School of Business, Diliman, Quezon City 1101, Philippines
Contrary to previous research on social distance suggesting that widened social distance is linked to power, this paper argues that indeed narrowing social distance creates increased favorable evaluations in the context of endorsements. By experimentally framing the source such as celebrity endorsers into a close relationship social category (e.g., ‘friend’, ‘family’), product attitudes and purchase intentions increase. This effect was mediated by connectedness and was moderated by the familiarity of consumers towards the product. The research context is in the Philippines where celebrity culture is predominantly relational due to its highly collectivistic culture. Implications on close relationship and relational paradigm in celebrity endorsements are discussed.
Keywords: celebrity endorsements, connectedness, Philippines, product familiarity, social distance
Acknowledgment: The author wishes to thank the University of the Philippines Ph.D. Incentive Award for funding this research.
1 Introduction
Celebrity endorsements remain a major investment among advertisers in the United States (Nielsen Media Research, 2015) as they are also widespread in Asia: 70% of South Korean and Japan’s commercials feature celebrities, and the strategy has gained momentum in China, India, and The Philippines (Euromonitor International, 2014; Sharma, 2012). These Asian markets have shifted to a consumer culture where celebrities are staple components of consumption discourses (Fitzsimmons & Lent, 2013). As celebrities have come to play a major part in modern, consumption culture, ways on how marketers can utilize celebrity power to create and appeal to emotional bond with consumer and to avoid animosity (Leong et al., 2008) should be given attention in celebrity endorsement research streams (e.g., Chao, Wührer, & Werani, 2005; Escalas & Bettman, 2009; Euromonitor International, 2014; Hung, Chan, & Tse, 2011; Thomson, 2006). Grounded in these issues, the industry report of Euromonitor identified major practical challenges faced by marketers in celebrity endorsement strategy, like how celebrities can emotionally appeal and bond with consumers. This study attempted to address such practical issues through theoretical explorations and development on the notion of narrowed social distance as conveyed by celebrities.
Celebrity endorsement definitions and approaches are traditionally in the models of source credibility (Goldsmith, Lefferty, & Newell, 2000; Hovland & Weiss, 1951), source attractiveness (Ohanian, 1991; Stephens & Rice, 1998), and match-up hypothesis (Rifon, Choi, Trimble, & Li, 2004). As the area of celebrity endorsements grows interestingly in the recent decades of consumer research, scholars have been devoted to understanding the underlying consumer processes that eventually elicit effectiveness of marketing campaigns (Keel & Nataraajan, 2012). Dominant existing models of celebrity influence have become mature, and much has been written on these models that serve as framework for celebrity selection (Erdogan, 1999). Celebrities may provide central information when an aspect of the celebrity matches the product (e.g., match-up, credibility, and attractiveness linked to the product category). However, such traditional models may pose limitations. For example, the source credibility and meaning transfer—or perceptions about a celebrity transferred to brands (McCracken, 1989)—cannot account for changes in the consumer and the celebrity and could be regarded as one-time and transactional advertising model (i.e., one-time transaction, short-term customer relationship versus a “relational model”) (Kimelfeld & Watt, 2001). Meanwhile, the image congruence or product match-up model should regard the integral changes of
*Correspondence: Tel: +63 2 928 4571; Fax: +63 2 929 7991. Email: [email protected]