assessment of seismic and infrasound signals in … · assessment of seismic and infrasound signals...
TRANSCRIPT
ASSESSMENT OF SEISMIC AND INFRASOUND SIGNALS IN KOREAWITH GROUND TRUTH
Brian Stump1, Myung-Soon Jun2, Chris Hayward1, Jeong-Soo Jeon2, Il-Young Che2,Sara Mihan House1, and Tae-Sung Kim1
Southern Methodist University1
Korea Institute of Geosciences and Mineral Resources2
Sponsored by Defense Threat Reduction Agency
Contract No. DSWA01-98-C-0131
ABSTRACT
A four-element, 1-km aperture seismo-acoustic array is being operated northeast of Seoul, Korea. Each elementof the array consists of a GS-13 vertical seismometer (1 Hz) in a shallow borehole (~10 m) and a low-frequencyacoustic gauge connected to an 11-element hose array (7.6 m hoses) at the surface. The array is being used toassess the importance of co-located seismic and acoustic sensors for the purposes of: (1) quantifying wind as asource of seismic and acoustic noise; (2) constraining propagation path effects in the atmosphere and solidearth; (3) locating the sources of the waves; (4) characterizing the source type. Combined analysis of theseismic and acoustic data can be particularly important in identifying sources of industrial blasting. Seismicnoise estimates illustrate a level that is only slightly above the low noise model on average. Acoustic noiselevels resolve the microbaroms during low noise times but document a nearly 50 dB increase in noise during thewindiest periods. Infrasonic noise in the 0.01 to 5 Hz band increases rapidly with wind velocity. The seismicnoise shows little or no dependence on wind velocity. Analysis of the data suggests that there are many moreacoustic signals than seismic (4-10 times). The majority of the acoustic signals occurs during working hoursand are constrained to several narrow azimuth ranges. These observations suggest that the signals are manmade. Approximately 1/4 of all seismic signals are associated with an acoustic arrival. The seismo-acousticobservations come from sources in the 30 to 200 km range and occur during working hours, local time. The 30to 200 km observation distance is surprising in that average atmospheric velocity models predict no acousticreturns in this range. Average atmospheric models modified by meteorological data for the troposphere indicatethe possibility of ducting in the troposphere as an explanation for these arrivals. Event location is based uponregional seismic phase identification (Pn, Pg, PmP, Lg, Rg) using the array and back azimuth estimates from boththe seismic and acoustic data. Aliasing for the short wavelength infrasound signals is reduced using broadbandback azimuth estimates. Additional infrasound sensors with 100 m offset are planned to further reduce thealiasing problem. Many of the infrasound signals have good signal to noise from 1 to beyond 4 Hz. Despite thesmall size of the array, event clusters are identified at regional distances. Waveform comparisons of theseclusters suggest that the events are from common source areas. The high Q path of the Korean Peninsula resultsin regional seismograms that have significant energy to frequencies as high as 16 Hz, the corner frequency forthe anti-alias filters. Events associated with acoustic signals are presumed to be from mining regions. Groundtruth in the form of in-mine observations provides validation of this interpretation. These data are also used toassess blasting practices and their relationship to the observed seismic and infrasound signals. The existence ofRg arrivals and dominance of P energy at high frequency are consistent with this interpretation. There is moreevent-to-event variation in the acoustic signals than the sesmic signals within the event groups, suggesting theeffect of variable atmospheric propagation effects consistent with ray paths in the troposphere.
KEY WORDS: Seismo-acoustic, mining, discrimination, infrasound
OBJECTIVE
The Korean Peninsula (Figure 1) provides a unique laboratory for studying regional seismic wave propagation.Numerous broadband seismic stations in the region and a variety of natural and man-made sources provideopportunities for characterizing wave propagation and source effects within the region. The region includes two
303431

23rd Seismic Research Review: Worldwide Monitoring of Nuclear Explosions – October 2-5, 2001
432
seismic arrays, KSRS and CHNAR, the seismo-acoustic array near Chulwon operated by Korea Institute of Geosciences and Mineral Resources (KIGAM) and Southern Methodist University (SMU). Figure 1 illustrates the seismicity of the region using preliminary event locations made in this study as well as event locations by others.
Figure 1. The map shows the events located on the basis of two months of CHNAR data. Seismo-acoustic
events are shown as solid red dots; seismic events without acoustic signals are shown as yellow dots; events from the Korean NDC bulletin are marked as blue stars; and ground-truth studies based on event locations are highlighted as solid pink and blue circles. The broadband stations, the existing seismo-acoustic research array CHNAR, and the IMS array KSAR are light blue triangles. The inset images are taken from Landsat-7 satellite imagery and show two of the verified sources. (adapted from Stump et al., 2000)
Intra-plate earthquakes are observed in and around the Korean Peninsula (Jun, 1991; Jun and Kulhanek, 1991; Kim, 1980). Focal mechanisms for 22 of the largest events in the last century (Jun et al., 1999) show predominantly strike-slip faulting with a small amount of thrust. The average compressional axis trends ENE to WSW across the entire Peninsula , which suggests the peninsula, is a single tectonic region and possibly single seismic structure. In NE China, the Tan-Lu fault is a particularly active source region. This left-lateral fault system may have originated the 1975 Haicheng earthquake. The peninsula also has an active mining industry. Near-surface mining explosions generate regionally observed seismic and acoustic signals (Hagerty et al., 1999). Sorrels, Herrin and Bonner (1997) have used such acoustic signals recorded at TXAR to identify mining explosions in southwestern New Mexico. RESEARCH ACCOMPLISHED
In the last year, the work has focused on four areas: (1) Quantifying wind as a source of seismic and acoustic noise; (2) Constraining propagation path effects in the atmosphere and earth; (3) Determining event origins; (4) Characterizing source types. The following discussion is organized into these four areas. Quantification of Wind as a Source of Seismic and Acoustic Noise Seismic and infrasound noise analysis was undertaken for a twenty-day period (Day 30-49, 2000) during which the sites were snow covered. The purpose was to quantify the absolute seismic and acoustic noise levels at the array elements, the variation of each with local winds, and the relationship between seismic and acoustic noise.
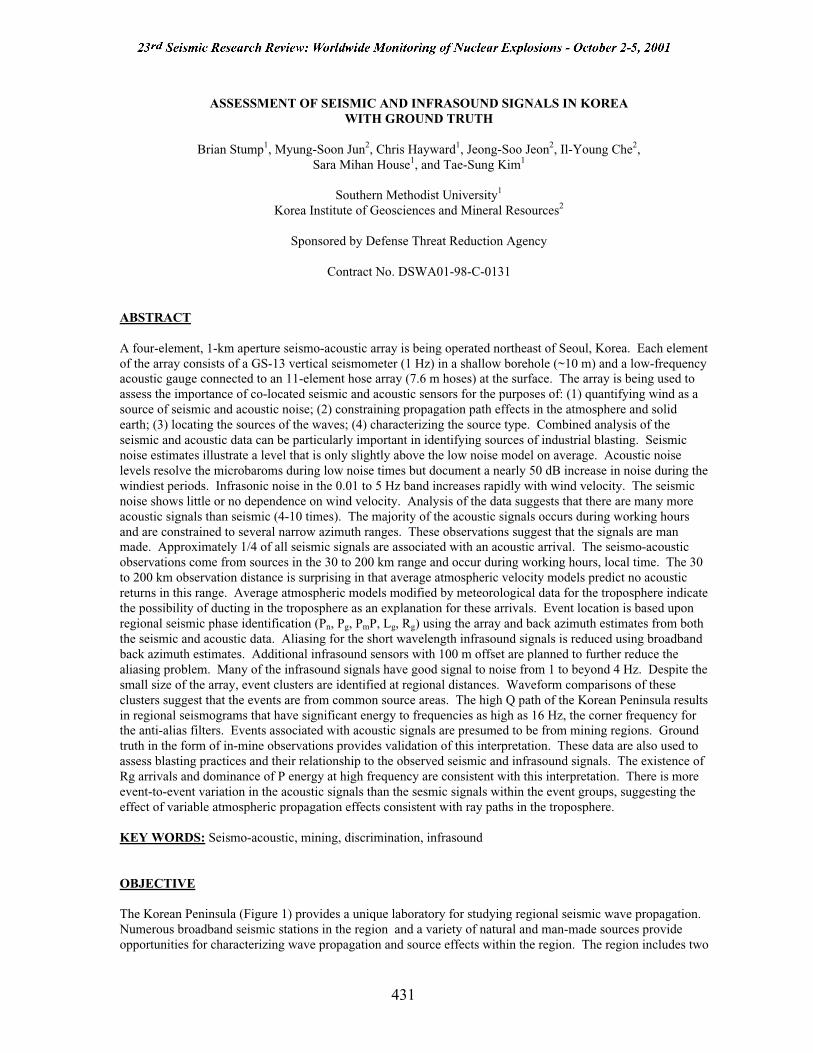
InfrasoundThe infrasound noise estimates for a representative array element (CHN00) are given in Figure 2 (left).Microbaroms show as a noise peak between 4 and 8 s. The effect of wind on spectral noise levels is shown inFigure 2 (right). Wind speed is measured10 m above ground at the array hub (CHN00). Below 4 Hz, noiselevels increase with winds in excess of 1-2 m/s. Hedlin et al., 1999, have reported similar effects.
Obs
erve
d D
ensi
ty (P
erce
nt/d
B)
0
5
10
15
20
25
30
Frequency (Hz) 1/81/4 1/2 1 2 4 8 16
-30
-20
-10
0
10
30
40
50
60
Low Noise Model
High Noise Model
INFRASOUND NOISE AS A FUNCTION OF FREQUENCYP
ower
(dB
rel
1 P
a2/H
z)
Frequency (Hz)
CHN00/sd from 2000030:00:00:00 to 2000049:23:59:00
-70
-60-60
-50-50
-40-40
-30-30
-20-20
-10-10
00
1010
2020
0 2 4 6 8 10 12
Noise Analysis of CHN00/sd from 2000030:00:00:00 to 2000049:23:59:00
Wind Speed (m/s)
Noi
se P
ower
(dB
rel 1
nm
2 /H
z or
1 P
a2/H
z
0.0095 Hz0.24 Hz0.58 Hz1.1 Hz1.8 Hz2.8 Hz4.3 Hz6.5 Hz9.6 Hz14 Hz
-60
-50
-40
-30
-20
-10
0
10
INFRASOUND NOISE AS A FUNCTION OF WIND VELOCITY
Figure 2: The power-normalized probability density as a function of frequency of 20 days of infrasound noiseat CHN00 is plotted to the left. Noise power as a function of wind speed for different narrow bandfrequencies are plotted to the right.
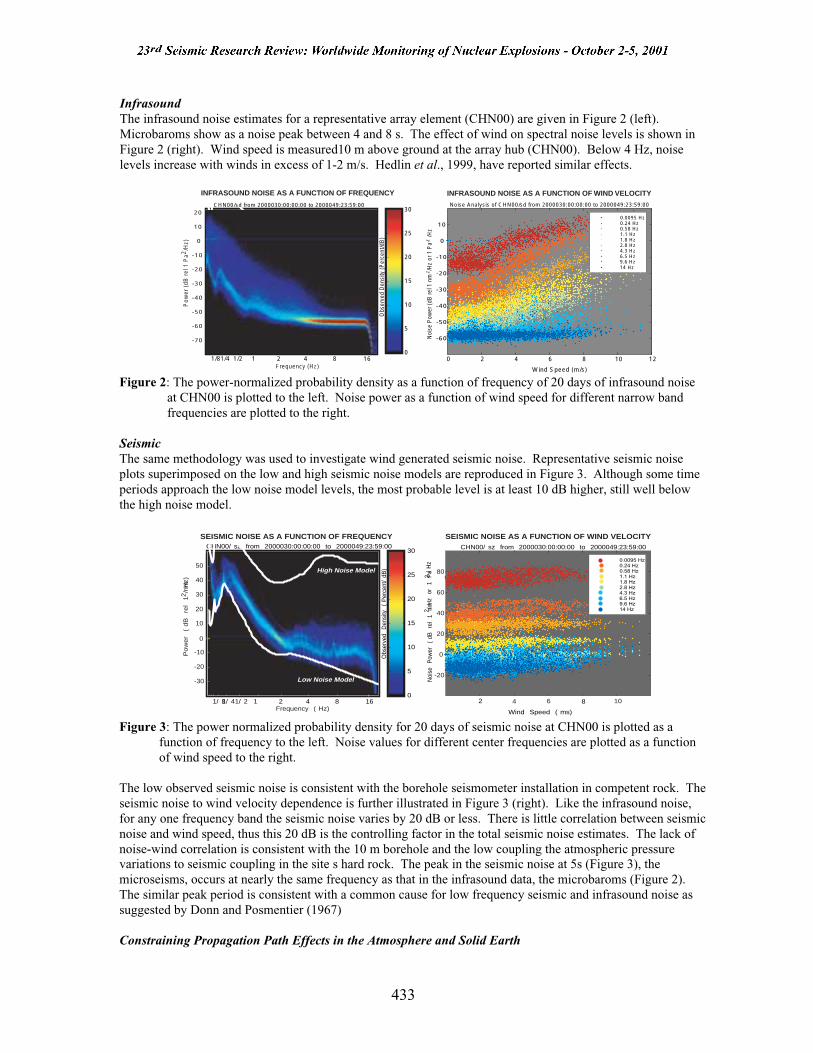
SeismicThe same methodology was used to investigate wind generated seismic noise. Representative seismic noiseplots superimposed on the low and high seismic noise models are reproduced in Figure 3. Although some timeperiods approach the low noise model levels, the most probable level is at least 10 dB higher, still well belowthe high noise model.
CHN00/sz from 2000030:00:00:00 to 2000049:23:59:00
Observed Density (Percent/dB)
0
5
10
15
20
25
30
1/81/41/2 1 2 4 8 16
-30
-20
-10
0
10
30
40
50
60
Low Noise Model
High Noise Model
SEISMIC NOISE AS A FUNCTION OF FREQUENCY
Power (dB rel 1 nm
2/Hz)
Frequency (Hz)2 8
Wind Speed (ms)
22
Noise Power (dB rel 1 nm/Hz or 1 Pa/Hz
4 6 10
CHN00/sz from 2000030:00:00:00 to 2000049:23:59:00
SEISMIC NOISE AS A FUNCTION OF WIND VELOCITY
0.0095 Hz0.24 Hz0.58 Hz1.1 Hz1.8 Hz2.8 Hz4.3 Hz6.5 Hz9.6 Hz14 Hz
-20
0
20
40
60
80
20
0
Figure 3: The power normalized probability density for 20 days of seismic noise at CHN00 is plotted as afunction of frequency to the left. Noise values for different center frequencies are plotted as a functionof wind speed to the right.
The low observed seismic noise is consistent with the borehole seismometer installation in competent rock. Theseismic noise to wind velocity dependence is further illustrated in Figure 3 (right). Like the infrasound noise,for any one frequency band the seismic noise varies by 20 dB or less. There is little correlation between seismicnoise and wind speed, thus this 20 dB is the controlling factor in the total seismic noise estimates. The lack ofnoise-wind correlation is consistent with the 10 m borehole and the low coupling the atmospheric pressurevariations to seismic coupling in the site s hard rock. The peak in the seismic noise at 5s (Figure 3), themicroseisms, occurs at nearly the same frequency as that in the infrasound data, the microbaroms (Figure 2).The similar peak period is consistent with a common cause for low frequency seismic and infrasound noise assuggested by Donn and Posmentier (1967)
Constraining Propagation Path Effects in the Atmosphere and Solid Earth
305433

SeismicWave propagation characteristics across the Korean Peninsula must be quantified to interpret the seismogramsrecorded at CHNAR. Fortunately, there are many seismographs on the Peninsula including KIGAM sbroadband network (Figure 1) and the IMS array KSRS. Data from these stations for a preliminary event set(Table 1 and Figure 4) was obtained to constrain estimates of propagation path effects.
Figure 4: The map shows events (red stars) and seismic stations (blue diamonds) that were used in thepreliminary wave propagation effects and source effects study.
Table 1. The table shows origin time and magnitude of 9 events located by KMA (Korea MeteorologicalAdministration) and used to select a seismograms from stations on the Korean Peninsula.
Origin time(GMT) Location ( Degree )Event
No.Mon-Day-Year Hour-Min-Sec Lat. Lon.
Mag.FocalDepth(km)
E1 9-11-99 20-56-53.0 35.9 129.3 3.2 5.9E2 12-27-99 03-29-19.9 36.8 128.2 3.0 3.45E3 01-18-00 06-08-49.5 38.7 127.9 3.0 14.3 ?E4 05-11-00 06-01-08.4 38.6 127.8 2.9 0E5 07-23-00 22-00-00.1 38.5 127.8 3.0 0E6 10-27-00 22-10-11.8 37.1 126.7 2.7 SeaE7 12-02-00 07-53-40.0 34.6 126.9 3.1 ?E8 12-09-00 09-51-00.0 36.5 130.0 3.7 SeaE9 12-21-00 23-19-38.5 36.3 127.4 2.7 ?
Figure 4 summarizes the event locations for events in Table 1 and shows the location of regional seismicstations. Events 1-2 and 7-8 are associated with earthquakes recognized by the KMA. Based upon associatedinfrasound signals at CHNAR, events 3-5 are explosions. This event set provides an opportunity to study bothwave propagation through the peninsula and waveform characteristics associated with particular source types.As an example, consider the unfiltered record section from event 7 (Figure 5). At nearest stations Pg is the firstarrival; beyond 150 km Pn is first. The largest phase associated with this earthquake is Lg. A Rg phase can beidentified at stations less than 200 km from shallow events. At about 100 km, PmP is a strong phase. Such dataprovides important constraints upon regional propagation models. Figure 5 illustrates that modest magnitude(3.1) earthquakes can provide significant waveform data for constraining these models.
306434

Figure 5: A record section shows waveforms from the stations from the KIGAM broadband network for Event7 (Table 1 and Figure 4).
InfrasoundStump et al.(2000) found that approximately one quarter of all seismic events recorded at CHNAR haveassociated infrasound signals. These events are attributed to mining explosions. At CHNAR they observed anaverage of three to four seismic events and one seismo-acoustic event per day. Analysis of the acoustic datasuggested that there were many more acoustic signals than seismic. This observation motivated a more in depthanalysis of the acoustic data at CHNAR in hopes of building a database useful for studying acoustic wavepropagation effects. Seven days of CHNAR acoustic data were analyzed for each of October, November,February, April, June and August. Figure 6 summarizes the approach azimuth and time of day of these signalsas determined by processing the array data.
Figure 6: The azimuth of acoustic events from CHNAR as a function of month of year is displayed to the left.One-week periods of data from the months of October, November, February, April, June and Augustwere analyzed. The hour (GMT) at which each of the events occurred is displayed to the right.
An average of nearly 50 coherent acoustic signals per day was observed on the CHNAR array, ten times morethan the number of coherent seismic signals. Figure 6 (left), illustrates that the acoustic signals observed atCHNAR come from distinct azimuths that vary with month, possibly reflecting changes in regional windpatterns. For example, a large number of signals were observed between 80 and 140 degrees during June andAugust but not other months. These events are probably man made since they occur during normal work hours(Figure 6 right).
307435

Locating the Sources of the Waves
SeismicThe network seismic data for the analyzed events (Table 1 and Figure 4) provide an initial resource to developempirical travel time curves for the Korean Peninsula. Such curves may then be compared to complementarywork (Lee, 1979; Kim et al., 1983; Kim et al., 1985; Kim, 1995; Kim et al., 1997; Kim et al., 1998a; Kim et al,1998b). Using this data in a complete waveform modeling exercise will more fully resolve the distance andsource contributions effects in observations. As a first step to understand the propagation in Korea, arrival timepicks of all regional phases were made using the KMA event locations. The velocities of Pn, Pg, Lg phase werecalculated as 8.2 km/sec, 6.6 km/sec, and 3.8 km/sec (Figure 7) respectively with individual arrival time errorsas large as 5-10 s.
Event locations reported in Stump et al., 2000 used the simple relationship distance X= (tLg - tp) Æ 8 to producesingle array locations from Lg-P time and back azimuth estimates from CHNAR. The data reproduced in Figure7 suggests that for distances shorter than the Pg to Pn crossover, 155 km, that the simple distance estimate isX<155 = (tLg - tPg) Æ 8.9 and that beyond the crossover distance the simple estimate is X>155 = (tLg - tPn) Æ 7.1. AsFigure 5 illustrates, Pn is an emergent arrival that is over shadowed by Pg and so for small magnitude eventscare must be taken that Pn is indeed the identified first arrival used for estimating distance. For single arraylocations phase velocity measurements from the array can confirm phase identity.
InfrasoundMost seismo-acoustic signals (Figure 1) are 30 to 200 km from the array. These locations are based upon theseismic data and its association with an infrasound arrival (Stump et al., 2000). Locating acoustic-only signalsrequires an atmospheric velocity model. The first approach is to use an Effective Sound Velocity Structure(ESVS) based upon average seasonal variations in winds. Such a model predicts that between 30 to 200 kmfrom the source, there will be no arrivals.
Figure 7: The figure shows arrival time data from the nine events in Table 1 based upon the KMA locationsand the estimated travel time for each of the individual phases. A linear least square fit has been madeto the picks.
At CHNAR, all observed seismo-acoustic signals fall within this theoretical blind zone. Arrivals in this rangecan be produced by tropospheric wind generated turning rays (Garc s et al ., 1998). Hagerty et al. (1999)attribute a troposphere duct to the infrasound first arrival from Kazakhstan mining explosions 250 km away.They also report that seasonal variations in troposphere winds lead to significant variations in the signaldetectability. Che et al. (2000) have compared acoustic propagation in Korea based a seasonally averagedESVS and a model with a troposphere based on regional meteorological observations. The seasonally averagedESVS for October predicts no arrivals out to 220 km for paths traveling from S80W and only a single, lowatmospheric arrival at close range from N80E.
308436

23rd Seismic Research Review: Worldwide Monitoring of Nuclear Explosions – October 2-5, 2001
437
Figure 9. The figure shows a comparison of ESVS model for October in Korea (dotted line) with velocity model developed from meteorological observations in the troposphere. The left figure is for direction S80W and the right figure is for N80E.
Figure 9 compares the average October troposphere model with a model modified by local meteorological observations in October at Osan, Republic of Korea. The strong effect of low altitude winds is illustrated with ray tracing through the troposphere in the modified model (Figure 10). The velocity increase below 8 km for the S80W path provides a duct for the infrasound arrivals from 50 to 250 km away. Such troposphere ducting may result in the reported infrasound observations. This illustrates the importance of using local meteorological data during infrasound interpretation.
Figure 10. Plots show ray tracing through troposphere model based upon meteorological data. The left figure is
for S80W and right figure is for N80E. Characterizing Source Type
Seismic Combining seismic and infrasound data can provide improved event characterization and identification. Regional seismic signatures indicative of a shallow explosive source include observations of strong high frequency P wave energy relative to Lg (Hartse et al., 1997) and short period Rg energy although regional attenuation along the propagation path can also affect P to Lg ratios and the Rg propagation degrades beyond 100-200 km . The preliminary data (Figure 4) provides an assessment of these propagation path effects. Figure 11 compares high frequency 8-10 Hz data from Event 7, an earthquake from the far southern tip of Korea and Event 4, an event from the north with an associated infrasound signal (Table 1). For event 4, Rg is observed at close stations such as CHNAR. For event 4, the P energy is dominant while for event 7 Lg dominates over P.

Figure 11: The left record section shows bandpass-filtered seismograms (8-10 Hz) from Event 7 (earthquake)
and the right shows Event 4 (explosion based on accompanying infrasound signal).
Based on the network data reproduced in Figure 11, the relationship between P and Lg energy is insensitive torange. Detailed studies of the network data provide additional constraints on the regional Q structure across theKorean peninsula and a more detailed physical assessment of the contribution of propagation path effects to theregional phases.
Ground truth data provide the opportunity to further investigate the characteristics of seismic and acousticsignals and relate them to the source. A cluster of seismo-acoustic events 100 km to the SW of CHNAR wasidentified (Figure 1) and associated with the construction of Seoul s new Inchon International Airport.Overhead imagery of the construction site is included in Figure 1. Video images of the construction explosionindicate that besides the main blast designed to fracture the material for removal, additional nearly unstemmedexplosives may be used to break individual rocks too large to remove mechanically. These additional blasts mayradiate significant infrasound energy. The total blast duration is about 300 ms. Ground truth information,including some near-source seismic records, have been obtained from five mining and construction operationsacross the Republic of Korea. This information is used to assess the source size and characteristics and theassociated seismic and infrasound signals. No explosions in this set exceed 3000 kg and many are muchsmaller, consistent with the small size of seismic signals reported for many of the seismo-acoustic events inStump et al., 2000. A short event duration, 300 ms for the event at Inchon International Airport, is consistentwith a small size explosive.
CONCLUSIONS AND RECOMMENDATIONS
1. Infrasound noise at CHNAR is strongly dependent upon near-surface wind velocity but seismic noise is almostindependent of observed wind velocity.
2. The frequency locations of the amplitude peaks are the same for both microbaroms and microseisms.
3. In and around the Korean Peninsula, regional earthquakes and explosions are observed well beyond 400 km and canprovide the basis for separating propagation and source effects at regional distances. Energy in excess of 8 Hz fromthese small events is efficiently transmitted along these propagation paths.
4. KIGAM broadband network data provides data for travel time analysis and waveform modeling. A preliminaryvelocity model has been developed from this data with Pn, Pg and Lg velocities of 8.2, 6.6 and 3.8 km/s. A modifiedsingle array location procedure is proposed based upon this preliminary model.
5. Infrasound signal travel paths in the 30 to 200 km range can be explained by local tropospheric winds and thereforelocal metrological must be included in the models.
6. There are nearly ten times more acoustic signals observed at CHNAR than seismic. Analysis of selected time windowsover one year suggests that signal source location changes with time. Repeated signals are observed over < – 5o
azimuth bands during certain times of the year.
7. Evidence exists for the efficient generation of high frequency P energy relative to Lg for explosions over a large rangeof source to receiver distances suggesting that propagation path effects are secondary to this source effect.
8. Ground truth on mining explosions suggests that the majority of industrial explosions are < 3000 kg and < 300 ms totalduration consistent with small, high frequency regional signals.
310438

REFERENCES
Che, Il-Young, J.-S. Jeon and M.-S. Jun (2000). Infrasound wave propagation characteristics in Korea.
Donn, W. L. and E. S. Posmentier (1966), Infrasonic waves for the marine storm of April 7, J. Geophys. Res., 72, 2053.
Garc s, M. A., R. A. Hansen and K. G. Lindquist (1998), Traveltimes for infrasonic waves propagating in a stratifiedatmosphere, Geophys. J. Int., 135, 255-263.
Hagerty, M.T., W.-Y. Kim and P. Martysewvich (1999). Characteristics of Infrasound Produced by Large MiningExplosions in Kazakhstan, in Proceedings of the 21st Annual Seismic Research Symposium on Monitoring AComprehensive Test Ban Treaty, 21-24 September 1999.
Hartse, H.E., S.R. Taylor, W.S. Phillips and G.E. Randall (1997). Preliminary Study of Seismic Discrimination in CentralAsia with Emphasis on Western China, Bull. Seism. Soc. Am., 87, 1464-1474.
Jun, M.-S., J.-S. Jeon and I.-Y. Che (1999). Earthquake Mechanism of Korean Peninsula, in preparation.
Jun, M.-S. (1991). Body-Wave Analysis for Shallow Intraplate Earthquakes in the Korean Peninsula and Yellow Sea,Tectonophysics, 192, 345-357.
Jun, M.-S. and O. Kulhane (1991). Source Parameters of Earthquakes In and Around the Korean Peninsula Deduced fromSpectral Analysis, Physics of the Earth and Planetary Interiors, 65, 255-266.
Kim, S. J. and S. G. Kim (1983), A study on the Crustal Structure of South Korea by using Seismic Waves, Jour. KoreanInst. Mining Geol., Vol. 16, NO. 1, P. 51-61.
Kim, S. K. and B. H. Jung, (1985), Crustal Structure of the Southern Part of Korea, Jour. Korean Inst. Mining Geol., Vol.18, NO. 2, P. 151-157.
Kim, S. K. (1995), A study on the Crustal Structure of the Korean Peninsula,The Journal of the Geological Society of Korea, Vol. 31, No.4, p. 393-403.
Kim, S.G. and S. K. Lee (1997), Determination of Lateral Variations for Pn Velocity Structure Beneath the KoreanPeninsula Using Seismic Tomography, Econ. Environ. Geol., Vol. 30, No. 6, p. 625-635.
Kim, S. G. and Z. Wu (1997). Uncertainties of Seismic Source Determination Using a 3-Component Single Station, J. Phys.Earth, 45, 1-11.
Kim, S.G. and Q. Li (1998), 3-D Crustal Velocity Tomography in the Southern Part of The Korean Peninsula, Econ.Environ. Geol., Vol. 31, No. 2, p. 127-139.
Kim, S.G. and Q. Li. (1998), 3-D Crustal Velocity Tomography in the Central Korean Peninsula, Econ. Environ. Geol., Vol.31, No. 3, p. 235-247.
Kim, W. Y., D. W. Simpson, and P. G. Richards (1994). High-frequency spectra of regional phases from earthquakes andchemical explosions, , Bull. Seism. Soc. Am., 84, 1365-1386.
Lee, K (1979), On Crustal Structure of the Korean Peninsula, The Journal of the Geological Society of Korea, Vol. 15, No.4,p. 253-258.
McKisic, J. Michael (1997). Infrasound and the Infrasonic Monitoring of Atmospheric Nuclear Explosions: A LiteratureReview, Phillips Laboratory Technical Report, PL-TR-97-2123, 28 February 1997, Phillips Laboratory, HanscomAFB, MA 01731-3010
Stump, B., C. Hayward, S.M. House, M.-S. Jun and J.-S. Jeon, 2000. A Small Aperture Seismo-Acoustic Array, SignalsAssessment, in Proceedings of the 22nd Annual Seismic Research Symposium in Monitoring A ComprehensiveTest Ban Treaty, September 2000, New Orleans, LA.
311439