assessment of ph and temperature effects on collagen gel
TRANSCRIPT

Assessment of pH and Temperature Effects on Collagen Gel Microstructure Using
Second Harmonic Generation and Scanning Electron Microscopies
By
Ariana Joseph
A Thesis Submitted to
Saint Mary’s University, Halifax, Nova Scotia
in Partial Fulfilment of the Requirements for
the Degree of Bachelor of Science with Honours in Biology
April 2020, Halifax, Nova Scotia
Copyright Ariana Joseph, 2020
Approved: __________________
Dr. Danielle Tokarz
Supervisor
Approved: __________________
Dr. Anne Dalziel
Examiner
Date: April 10, 2020

i
Assessment of pH and Temperature Effects on Collagen Gel Microstructure Using
Second Harmonic Generation and Scanning Electron Microscopies
by Ariana Joseph
ABSTRACT
Collagen is a fibrous structural protein that possesses a characteristic triple-helical
conformation which aids in the stabilisation of molecular confirmations. For example, in
tissues collagen aids in maintaining the structural integrity. Collagen accounts for 30% of
the total protein content in the body and is a major constituent of the extracellular matrix
(ECM). The ECM provides structural support for cellular components and is a key
regulator of biochemical functions in the human body related to tissue growth and
development. Thus, for the maintenance of normal organ function and to facilitate wound
healing, homeostasis of the ECM is crucial. Sustained homeostatic dysregulation results in
terminal and pathological conditions such as cancer where structural variation in the ECM
is not well understood and is difficult to characterize.
In the current research, natural collagen hydrogels synthesized in differing chemical
environments were investigated by second harmonic generation (SHG) and scanning
electron microscopies (SEM). The gels were synthesized within biologically relevant
ranges of polymerization pH and polymerization temperatures to investigate how these
variables affect the structure and morphology of collagen fibrils. Results of imaging dried
samples with SEM revealed structural parameters of collagen D-banding periodicity of
59.8 ± 4 nm in gels simulating normal physiological conditions and was in line with the
~67 nm periodicity reported for in vivo native-banded fibrils. Qualitative analysis of the
hydrogels revealed lower fibril content and thicker fibrils at lower temperatures which was
evidenced by higher SHG signals in quantitative analysis. The fibril diameter was
maximum at pH 6.5, and lower fibril content was observed at a lower pH. Statistically
significant differences were observed in average fibril diameter and in SHG intensities for
varied polymerization temperature and pH, demonstrating that the technique can probe
collagen microstructure and provide a greater understanding of ultrastructural changes
occurring within the ECM.
[April 10, 2020]

ii
ACKNOWLEDGEMENTS
I would like to thank my supervisor, Dr. Danielle Tokarz and her research associate, Dr.
Richard Cisek for their expert guidance throughout my undergraduate career, and who
shared in the excitement of this past year of discovery. Their unwavering enthusiasm kept
me enamoured with my study and fostered my love for creativity and research.
My appreciation also extends to the Tokarz laboratory members, both past and
present with special thanks to Katherine P., Kennedy and MacAulay for their suggestions,
contributions to this project and for helping to maintain a positive environment for learning
science.
To Dr. Anne Dalziel, Dr. Colleen Barber, Dr. David Chiasson and the Honours
Class of 2020 for their encouragement, shared curiosity in research and willingness to
provide me with feedback every step along the way. I am honoured to have had access to
such an enthusiastic support group.
I would like to extend special thanks to both the Chemistry and Biology
Departments for the opportunity to contribute positively to the scientific community. To
Alyssa Doué, Xiang Yang, Matt Logan, Jing Yang, Carmen Cranley, and Caila Lebans for
dealing with my constant requests and any questions I have had along the way.
Lastly, I would like to thank my loved one, family (especially my parents,
grandmother and my mom-away-from-home, Julia) and friends for their prayers,
understanding, and unwavering support throughout this journey. To you, I will be forever
indebted.

iii
TABLE OF CONTENTS
Abstract i
Acknowledgements ii
Table of Contents iii
List of Tables v
List of Figures vi
List of Abbreviations and Acronyms vii
1. Introduction 1
1.1 Motivation 1
1.2 Extracellular Matrix 2
1.3 Relationship of Pancreatic Tumour Pathology and Collagen 4
1.3.1 Hallmarks of Pancreatic Collagen 4
1.3.2 Vertebrate Collagen Types: I, III, IV, V 9
1.3.3 Effect of Cancer Growth on Collagen Fibre Architecture 11
1.4 Collagen Gels as Model Biological Systems 13
1.5 Introduction to Second Harmonic Generation (SHG) Microscopy 15
1.6 Objectives 17
2. Experimental Methods and Materials 19
2.1 Synthesizing Collagen Gels 19
2.2 Fibril Detection in Collagen type I Gels 20
2.2.1 Synthesis of Curcumin Dye 20
2.2.2 Experimental Control – Acrylamide Gel Preparation 20
2.3 Characterization of Collagen Gels 21
2.3.1 Second Harmonic Generation 21
2.3.2 Scanning Electron Microscopy 24
2.3.3 Cross-Polarized Light Microscopy 25
3. Results and Discussion 27

iv
3.1 Determining the presence of collagen fibrils and fibril density using Cross-
Polarized Microscopy 27
3.2 Polymerization temperature and pH effects on gel microstructure 30
3.3 SHG microscopy of collagen gel microstructure 37
4. Future Studies 43
5. References 45
6. Appendix 55

v
List of Abbreviations:
PDAC Pancreatic Ductal Adenocarcinoma
ECM Extracellular Matrix
LOX Lysol Oxidase
CAF Cancer Associated Fibroblast
EMT Epithelial-Mesenchymal Transition
SEM Scanning Electron Microscopy
SHG Second Harmonic Generation
PBS Phosphate-Buffered Saline
dH₂O Deionized Water
v/v Volume by Volume (Volume Percent)
APS Ammonium Persulphate
TEMED Tetramethylethylenediamine
Fs Femtosecond
Nm Nanometre
MHz Megahertz
NA Numerical Aperture
HMDS Hexamethyldisiloxane

vi
List of Tables:
Table 1. Predominant Vertebrate Collagen Types, Forms and Distributions……..….…..8
Table 2. Experimental plan outlining the number of gels synthesized at the given pH and
temperature…..………………………………………………..…………………………20

vii
List of Figures:
Figure 1: Schematic of cancer progression………………………….………..………...…3
Figure 2: Characteristic structure of in situ collagen: molecule or monomer (a), microfibril
(b), fibril with emphasized D-periodicity (c) and fibre (d) during various stages of collagen
assembly………………………………………………………………………………...…5
Figure 3: Supramolecular structures depicted for each collagen classification: fibrous
collagens (a), non-fibrous collagens (b) and filamentous collagens (c)……………….…..7
Figure 4: Molecular Structure of Collagen Type I …………………………….…….…..10
Figure 5: A comparison between the molecular processes of a) multiphoton excitation
fluorescence and b) second harmonic generation………………………………….……..16
Figure 6: 0.15 mg/mL Turmeric Stain ……………………………………………….......20
Figure 7: Schematic of the nonlinear optical microscope with the laser traversing the x-y
plane……………………………………………………………………………………...22
Figure 8: Photomicrographs of collagen gels showing the staining ability of curcumin and
confirming the formation of collagen fibrils......................................................................28
Figure 9: Average collagen fibril density of 2.5 mg/mL acellular collagen hydrogels and
collagen monomers encapsulated in acrylamide gel (control) in arbitrary units (a.u.) as
measured by birefringence.………...…………………………………………………….29
Figure 10: Representative SEM images of 2.5 mg/mL acellular collagen hydrogels at 25
°C (A-D) 37 °C (E-H) and at pH 5.5, 6.5, 7.5, and 8.5.…………………………………....31
Figure 11: Mean diameter of collagen fibrils in nm at various pHs and temperatures. Error
bars represent the standard deviation. ……………..……………...……………………...33
Figure 12: SEM images of self-assembled collagen fibrils following polymerization at
25°C (a-c) and 37°C (d-e) showing D-banding periodicities. ………………………........35
Figure 13: Mean D-banding periodicity of collagen fibrils in nm at various pHs and
temperatures……………………………………………...…………………………....…37
Figure 14: Representative SHG images of 2.5 mg/mL acellular collagen hydrogels at 25
°C (A-D) 37 °C (E-H) and at pH 5.5, 6.5, 7.5, and 8.5.........................................................38
Figure 15: Average collagen fibril density in counts at varying pH and temperature
conditions as measured by SHG intensity………………………………………………...39

1
Introduction
1.1 Motivation
Pancreatic cancer is currently the third- and fourth-leading cause of cancer-related deaths
in the United States and Canada respectively (Canadian Cancer Society’s Advisory
Committee on Cancer Statistics, 2017; Wallis, 2018). The most common malignancy of
the pancreas, pancreatic ductal adenocarcinoma (PDAC), retains its status as the deadliest
of cancers as it is rarely detected during early stages. It remains asymptotic until metastasis
to distant organs (Poruk et al. 2014: Canadian Cancer Society’s Advisory Committee on
Cancer Statistics, 2018).
Diagnosis of pancreatic cancer poses significant challenge for pathologists as the
disease is often characterized by non-specific symptoms, and is dependent upon the
availability of major blood vessels around the tumour to support invasion and metastasis
(McGuigan et al. 2018). These factors mean that by the time characteristic symptoms have
developed, the tumour is at an advanced stage where resection or removal of a section of
the pancreas, is no longer feasible (Poruk et al. 2014; McGuigan et al. 2018). Currently,
surgical resection is the only plausible cure for PDAC however, remission rates remain
relatively high and the rates of long-term survival remain significantly low (Poruk et al.
2014; McGuigan et al. 2018). Owing to the lower incidence rate of PDAC throughout the
population compared to other aggressive cancer types, there remains no sensitive screening
methods for this cancer in current clinical care (McGuigan et al. 2018).
Although cancer stage remains independent of cancer survival, cancers presented at
later stages generally have lower survival rates (Canadian Cancer Society’s Advisory

2
Committee on Cancer Statistics, 2018). Thus, in an effort to improve the prognosis and
outcomes of PDAC, the disease and its mechanisms need to be understood on the macro-
and microstructural levels to determine strategies for earlier detection and intervention.
Formerly, it was theorized that most cancers resulted from the amassing of somatic
mutations in epithelial cells (Bhowmick et al. 2004; Tokarz et al. 2019). Recent studies
have built on this theory attributing the tumour microenvironment (inclusive of the
extracellular matrix (ECM), blood vasculature, inflammatory cells and fibroblasts) to
cancer progression (Tokarz et al. 2019). Specifically, there is reduced oxygenation of
tissues which impacts the microenvironment’s pH and alters the matrix’s structure and
function (Roma-Rodrigues et al. 2019). However, two issues pertaining to our
understanding of the initiation and proliferation of cancer remain: 1) the chemical factors
that give rise to and foster the disease are unclear and, 2) there remains no suitable
biological model system in which the interaction of pancreatic cancer cells with matrix
proteins, such as collagen can be studied.
1.2 Extracellular Matrix
The growth, development and organization of cells are uniquely coupled to its
microenvironment. The ECM is often broadly referred to as the cellular microenvironment;
however, the ECM is multifaceted and ordered in an effort to retain the geometric shape
and structural integrity of many tissues such as bone, cartilage and basement membranes
(Frantz et al. 2010). The ECM also plays a crucial role in the regulation of cell and tissue
function and comprises a complex and dynamic array of structural proteins,
glycosaminoglycans, glycoproteins and proteoglycans (Frantz et al. 2010; Harjanto et al.

3
2011). Previously, the ECM functionality was entirely attributed to maintaining structural
framework and tissue structure. However, it has recently been found to influence chemical
signalling, affecting numerous cellular processes such as cell growth, differentiation,
adhesion and migration among others (Frantz et al. 2010).
To maintain normal organ function and to facilitate wound healing, homeostatic
regulation of the ECM is important. The scaffold structure of the matrix is maintained
through synthesis, secretion and modification and orientation of its components by the cells
(Frantz et al. 2010; Cox and Erler 2011). However, sustained homeostatic dysregulation
and uncontrolled matrix remodelling can promote the development of terminal and
pathological conditions (Cox and Erler, 2011). In particular, ECM remodelling is an
essential part of tumour malignancy and metastasis (Figure 2).
The tumour microenvironment is
heterogenous, comprising both cellular and acellular
components. As collagen is a major component of the
ECM, it is a key determinant in the ECM’s functional
properties (Walker et al. 2018). The proliferation of
cancer cells induces changes in ECM architecture and
these cells require constant interaction with the ECM
(Walker et al. 2018). Specifically, during
tumorigenesis there is increased secretion of fibrillar
collagens and fibronectin increasing density in the
stroma. This is typically accompanied by an increase in
Figure 1: Schematic of
cancer progression.
Figure adapted from Cox
and Erler (2011).

4
LOX cross-linkages increasing ECM stiffness and linearization of collagen fibres
responsible for alignment of fibres, and aiding tumour metastasis (Fang et al. 2014; Walker
et al. 2018). Despite this knowledge, the specific effects of increased collagen deposition
within the ECM associated with cancer progression remains unknown (Walker et al. 2018).
Levental et al., (2009) and Karagiannis et al., (2012) identified a correlation between
increased collagen cross-linkages and deposition and tumour progression resulting from an
increase in integrin signalling by fibroblasts.
1.3 Relationship between Pancreatic Tumour Pathology and Collagen
1.3.1 Hallmarks of Pancreatic Collagen
Collagen accounts for one-third of the total protein content in the human body and is the
most prevalent structural protein in connective tissue ECM (Gelse et al. 2003; Frantz et al.
2010). Collagen is best defined as a structural glycoprotein containing singular or multiple
homologous α chains which possess a triple-helical conformation (Xu et al. 2019). The
amino acid sequences of the α chain are characteristically aligned as glycine-X-Y repeats,
with X and Y frequently represented by proline and hydroxyproline, although other amino
acids may be represented along the length of the chain (Fang et al. 2014; Xu et al. 2019).
In situ collagen possesses a hierarchal structure (Figure 1; Shoulders and Raines, 2009).
Amino acid sequences undergo an assembly mechanism to form large-scale molecular
structures which are components of pancreatic tissues (Shoulders and Raines, 2009).

5
Figure 2: Characteristic structure of in situ collagen: molecule or monomer (a),
microfibril (b), fibril with emphasized D-periodicity (c) and fibre (d) during various
stages of collagen assembly. Figure reproduced with permission from Kotova et al. 2015.
The biosynthesis and “self-assembly” of collagen fibres occurs via post
translational modification (Lodish et al. 2000). Collagen chains are first synthesized as
polypeptide precursors known as procollagens and undergo a series of modifications in the
rough endoplasmic reticulum, Golgi apparatus and the extracellular space (Lodish et al.
2000). In the endoplasmic reticulum, the polypeptide chains are glycosylated, hydroxylated
and interactions of cysteine residues allow for the formation of interchain disulphide bonds
(Lodish et al. 2000). Disulphide bonds between the C-terminus of three procollagens align
and initiate triple helical formation towards the N-terminal (Lodish et al. 2000).
Collagen is secreted into the extracellular matrix via exocytosis where it undergoes
supramolecular assembly of its fibrils (Lodish et al. 2000; Xu et al. 2019). This may occur
following the procollagen cleavage in the transport vesicles (Golgi to membrane carriers)
or may occur in the plasma membranes of fibroblasts (Xu et al. 2019). The tensile strength
characteristic of collagen fibres is attributed to covalent intra- and inter-molecular Lysol

6
oxidase (LOX), glycosylation and transglutaminase cross-linkages which differ across
collagen (Xu et al. 2019).
In vitro collagen fibril assembly while similar to in vivo fibril assembly in that it is
a multi-step process, varies largely because of its dependence on environmental variables
such as temperature and pH. Gelman et al. (1979) proposed that collagen fibrils synthesized
in vitro undergo a multi-mechanistic accretion process involving one temperature-
independent and two temperature-dependent steps. The first and third processes are
temperature-dependent to initiate the formation of an unidentified intermediate and to
facilitate lateral growth of the fibrils respectively, while the second is temperature-
independent to allow for linear growth of the filaments. These three steps are required for
the formation of fibrils which possess similar periodicities and ultrastructural properties to
those of in vivo fibrils. It is hypothesized that the accretion process enables optimization of
the gel microstructure and produces fibrils with increased structural integrity.
Collagen can be classified on the basis of fibrous, non-fibrous and filamentous
ultrastructure (Figure 2; Bailey, 1987; Lodish et al. 2000). The former maintains the
structural integrity of the fibrils while the latter maintains a degree of tissue flexibility
(Lodish et al. 2000). Collagenous structures in the ECM may also be classed as fibrillar,
network and transmembrane collagenous domains (Lodish et al. 2000; Gelse et al. 2003;
Abraham et al. 2008). There are 28 different types of vertebrate collagen encoded by 42
individual genes which differ in their polypeptide sequences and in their molecular
structures and weight (Shoulders and Raines, 2009; Karsdal, 2016; Xu et al. 2019). Among
these types, a few of which are highlighted in Table 1, it is mainly collagen types I, III and

7
V (which are secreted by fibroblasts) and collagen type IV (which is produced by epithelial
and endothelial cells) (Xu et al, 2019) that are major components of the ECM.
Figure 3: Supramolecular structures depicted for each collagen classification: fibrous
collagens (a), non-fibrous collagens (b) and filamentous collagens (c). Figure adapted
from Figure 1 of Bailey 1987.

8
Table 1. Predominant Vertebrate Collagen Types, Forms and Distribution.
¹ Gelse et al. 2003
² Abraham et al. 2008
³ Shoulders and Raines, 2009
⁴ Fang et al. 2014
Fibrous collagens (types I, II, III and V) possess a characteristic D-banding
periodicity where D ~67nm (Chapman, 1985; Lodish et al. 2000; Shoulder and Raines,
2009). This structure is unique to collagens found in the interstitial matrix and is not
characteristic of basement membrane collagen (i.e. type IV collagen; Chapman, 1985).
Collagen
Class¹, ³, ⁴
Type¹,
², ⁴
Molecular
Composition¹, ², ³
Polymerized
Form¹, ³, ⁴
Tissue
Distribution and
Composition¹, ², ³, ⁴
Structural
Details
(Monomer
Size,
Banding
Details) ²
Fibril-
forming
I [α1(I)]₂α2(I) Fibril
Abundant and
widespread: bone,
dermis, tendon,
ligaments, cornea
300 nm, 67-
nm banded
fibrils
II [α1(II)]₃ Fibril
Cartilage, vitreous
humour, nucleus
pulposus,
intervertebral disc
300 nm, 67-
nm fibrils
III [α1(III)]₃ Fibril
Skin, vessel wall,
reticular fibres of
most tissues
(lungs, liver,
spleen, etc.);
frequently with
type I
300 nm, 67-
nm fibrils
V [α1(V)]₂α2(V) and
α1(V)α2(V)α3(V)
Fibril
(assembly
occurs with
type I)
Lung, cornea,
bone, foetal
membranes
390 nm N-
terminal
globular
domain,
small fibres
Basement
membrane IV
[α1(IV)]₂α2(IV);
α1-α6
Sheet-like
network
Basement
membrane
390 nm, C-
terminus
globular
domain,
nonfibrillar

9
While some studies credit this periodicity to the displacement of collagen molecules
produced from side-by-side interactions (Lodish et al. 2000), others suggest this structural
parameter occurs because of gaps and overlaps within the collagen fibril (Shoulder and
Raines, 2009). While the molecular origin of this periodicity remains unknown, it is often
referred to as D-banding periodicity and manifests in the form of repeated striations or
ridges throughout the length of the collagens fibrils which can be visualized using electron
microscopy (Chapman, 1985; Lodish et al. 2000).
1.3.2 Vertebrate Collagen Types: I, III, IV, V
Fibril-forming collagens: Types I, III, V
Type I collagen, a fibrillar type collagen, is a major component of connective tissues (Gelse
et al. 2003; Karsdal, 2016). It is a key regulator of the structural composition of several
fibrous tissue types exclusive of cartilage (Karsdal, 2016). Collagen I is by far the best
investigated collagen type and has previously been referred to as the archetypal collagen
because of the lack of imperfections associated with its triple-helical structure (Gelse et al.
2003; Shoulders and Raines, 2009; Karsdal, 2016). Type I collagen is the principal protein
of the interstitial matrix and is expressed in almost all connective tissues (Karsdal, 2016).
Collagen type I is responsible for the desmoplastic reaction in PDAC (Öhlund et al. 2013;
Weniger et al. 2018). This reaction is defined as the excessive deposition or growth of
stroma within regions of the tumour and occurs because of increased synthesis of ECM
proteins by stromal cells such as fibroblasts (DeClerk, 2012). Desmoplastic reactions are
responsible for the qualitative and quantitative changes in the ECM, such as disruptions
within the basement membrane (Öhlund et al. 2013; Weniger et al. 2018).

10
Figure 4: Molecular Structure of Collagen Type I. Collagen template adapted from The
Protein Data Bank, Protein: 1BKV (Berman et al. 2000). Image was modified using Protein
Data Bank Software (Bioassembly 1; spacefilled and coloured by amino acid residue).
Types III and V are both fibrillar type collagens. Type III collagen is often present in
type I collagen-containing interstitial matrices and connective tissues such as skin, internal
organs and the vascular system (Karsdal, 2016). Type V, on the other hand, is essential in
the fibrillation of collagen types I and III (Karsdal, 2016). Specifically, it determines
collagen assembly in individual tissues and plays an important role in optimal fibrillar
formation and tissue quality (Karsdal, 2016). Karsdal (2016) proposed that type V collagen
is integrated into the interior of the fibrils, while type I collagen assembles along the fibril
surface.
Arg
Hyp
Thr
Leu
Pro
Ala
Ile

11
Basement Membrane Collagen: Type IV
Type IV, on the other hand is a network-forming collagen. It is a major component of
the basement membrane, which functions as a barrier between tissue compartments and
contains key signalling proteins important for physiological and pathological functions
(Karsdal, 2016). Characteristically, collagen IV fibrils have 21-26 interruptions of their
Glycine-X-Y repeat which decreases structural rigidity and increases flexibility of the
structure for optimal network formation (Karsdal, 2016).
When collagen turnover becomes dysregulated, it tends to promote pathological
conditions such as cancer by influencing tumour cell behaviour and immunity (Nissen et
al. 2019). Cancer cells also alter collagen forming a reinforcing cell-collagen loop which
allows for cancer progression and metastasis (Xu et al., 2019). Although ECM alterations
are not well understood, an upregulation of fibrillar collagen types (desmoplasia of types
I, III and V) and suppression of basement membrane forming collagens (i.e., type IV) are
hallmarks of many cancers inclusive of pancreatic cancer (Nissen et al. 2019). For example,
the microstructure of the pancreas during tumefaction is defined by dense regions of
collagen I and III bundles and a loss of basement membrane integrity (Öhlund et al. 2013).
1.3.3 Effects of Pancreatic Cancer Growth on Collagen Fibre Architecture
Cancer proliferation and progression results in structural changes within the extracellular
matrix (ECM) of cells. During cancer development, the content and integrity of the matrix
is altered in order to support the biological and biochemical properties of cancer cells (Xu
et al. 2019). Specifically, changes within collagen content and architecture are strongly

12
influenced by mutations in tumour suppressor genes, proto-oncogenes and G-proteins (Xu
et al. 2019).
Collagenous ultrastructure is strongly influenced by the mutated tumour suppressor
gene, p53. Under mutant conditions, the p53 pathway is responsible for regulating: 1)
collagen bundle alignment 60° to 90° relative to the cancer border (Kenny et al. 2017) and
2) collagen’s response to stimulation from pancreatic cancer cells (Xu et al. 2019). Other
tumour suppressor genes also play a role in cancer progression. Progression can be
controlled via the deletion or silencing of specific genes which results in increased
recruitment of cancer-associated fibroblasts (CAFs) and production of the gene responsible
for collagen type I synthesis (Jolly et al. 2016; Alvarez-Garcia et al. 2019; Xu et al. 2019).
Mutant proto-oncogenes also interact with collagen to allow for cancer progression
and metastasis. In pancreatic cancer, mutant proto-oncogenes such as KRAS work along
with the epithelial-mesenchymal transition (EMT) regulator enhancing collagen
production by pancreatic cancer cells (Shields et al. 2019).
G protein family receptors such as Rho can alter the alignment of collagen influencing
the density of the matrix. In PDAC, Rho-associated protein kinase (ROCK)/ Rho signalling
can interact with CAFs to increase collagen type I degradation and regulate tumour cell
behaviour with the ECM (Vennin et al. 2017; Xu et al, 2019).
Currently, it remains difficult to study the effects of cancer growth on collagen’s
structure in vivo as these processes usually occur deep within the body and characterization
of collagenous tumour-associated architectures can only be accomplished using invasive
biopsy techniques (Tilbury and Campagnola, 2015). Thus, collagen gel model systems can
13
be useful for probing collagen’s structure and morphology in vitro as the gel’s properties
can be easily controlled to simulate the microenvironment of interest.
1.4 Collagen Gels as Model Biological Systems
Collagen gels have been studied extensively because of their ability to mimic biological
tissues in terms of structure and physiology. The potential of collagen to be reconstituted
makes it a suitable biopolymer for studies involving wound repair, drug delivery and both
pathological and nonpathological diseases which extensively remodel collagen.
Collagen hydrogels are advantageous in many studies including aging (Hsu et al.
1994), tissue engineering (Chevallay and Herbage, 2000; Gutowska et al. 2001), drug
delivery (Wallace and Rosenblatt, 2003), collagen assembly mechanisms (Cheng et al.
2008), wound-healing (Moulin et al. 1996) and cell migration (Even-Ram and Yamanda,
2005; Chen and Liu, 2017). The reason behind their popularity as a suitable model system
for research is because of its biocompatibility, immunogenicity, conservation across
species, ability to be naturally remodelled by cells and most importantly, its tunability (Zhu
and Kaufman, 2014; Chen and Liu, 2017). The versatility of the hydrogel is extremely
important when understanding the mechanisms of connective tissue pathology and disease
(Zhu and Kaufman, 2014; Chen and Liu, 2017).
Collagen reconstitution is controlled by polymerization conditions which impact
polymer aggregation and allow for the creation of gels with varying microstructures
(Pavone and Campagnola, 2014). Previous studies have determined that tuneable factors
such as collagen concentration, pH, temperature and ionic strength are determinants of
polymerization parameters, hydrogel microstructure (Zhu and Kaufman, 2014; Doyle,

14
2016). However, more recent combined scanning electron microscopy (SEM) and optical
microscopy studies have focused on investigating temperature and pH to produce
hydrogels with distinct architectures which may be similar to the tumour microenvironment
(Raub et al. 2007; Raub et al. 2008; Doyle, 2016) as during cancer progression, there is a
significant decrease in the matrix pH (pH ~6.5; Kato et al., 2013; Anemone et al., 2019).
While these variables have major effects on the structural and mechanical properties
of the collagen network, these conditions also influence the assembly and organization of
fibrils with the gel (Zhu and Kaufman, 2014). Normal polymerization conditions are
defined according to physiological conditions (37°C and pH ~7.4) and produce a
homogenous and reticular structure with fibrils of small diameter (Raub et al. 2007; Doyle,
2016). However, by probing the pH or gelation temperature dependence of the gel, the
structure becomes heterogenous and fibres either increase or decrease in size as the
variation in parameters exceeds those of normal physiological conditions (Doyle, 2016).
Collagen gels polymerized under varying chemical conditions can produce vastly different
microstructures specific to various future studies.
Over the last two decades, light microscopy techniques have been used in combination
with novel nonlinear optical microscopies such as second harmonic generation (SHG). This
method has proved advantageous as it uses long excitation wavelengths to provide precise
resolution required to probe the structures within the ECM with increased accuracy
(Tilbury et al. 2015). SHG microscopy is also optimal as the technique does not require the
use of extracellular dyes for identification which may alter the structure of the collagenous
matrix when heated by the laser (Pavone and Campagnola, 2014). Previous studies have

15
used SHG imaging for probing the collagenous architecture of PDAC (Tokarz et al. 2019)
demonstrating that the technique has the possibility of probing collagen gel ultrastructure,
fibril distribution and alignment.
1.5 Introduction to Second Harmonic Generation Microscopy
Figure 5: A comparison between the molecular processes of a) multiphoton
excitation fluorescence and b) second harmonic generation (Boyd, 2008). Figure
modified from Tokarz (2014).
Second harmonic generation (SHG) is a non-linear light matter interaction where two
photons are converted to one photon. Specifically, SHG is a nonlinear optical phenomenon
relying on the hyperpolarizability and non-centrosymmetric properties of a material
allowing for discrimination of chiral and nonchiral crystals and noncrystalline aggregates
(Hompland et al. 2008). This coherent process produces radiation at twice the frequency
Multiphoton
Excitation
Fluorescence (MPF)
Second Harmonic
Generation (SHG)
Stokes
shift
Excited
state
Virtual
state Molecular
Vibrational
and rotational
states
a) b)
ω Frequency

16
and half the wavelength (Hompland et al. 2008; Campagnola and Dong, 2011; Rouède et
al. 2017). Since the photons interact at a virtual state and the excited state is higher than
the combined energy of the two photons, molecular absorption of the laser photons does
not occur. Unlike fluorescence, there is no molecular absorption and associated Stokes
shift, hence this process does not deposit energy into the system (Mohler et al. 2003). As
there is no heat production associated with SHG, it has multiple benefits compared to other
excitation processes such as fluorescence microscopy, including a reduction in
photobleaching and phototoxicity of the sample (Mohler et al. 2003; Hompland et al.
2008). This provides longer duration scans than fluorescence, which can prove
advantageous in studies of biological samples. SHG microscopy is also a non-invasive
form of microscopy which allows for the study of in vivo biological phenomena without
the use of dyes as seen in fluorescence microscopy; overcoming a current barrier faced in
the advancement of biological research (Mohler et al. 2003). In addition, since SHG
microscopy involves the interaction of two photons which leads to a single photon at half
of the wavelength, it allows for use of longer wavelengths of light. Longer wavelengths of
light results in deeper tissue penetration, another issue associated with using biological
imaging techniques (Bueno et al. 2017).
Over the last two decades, SHG microscopy has gained popularity as a unique imaging
modality especially with regards to its applications in label-free tissue imaging and in situ
quantification of fibrillar protein architectures (Rouède et al. 2017). This technique has
been well explored with studies ranging from imaging of connective tissues and fibrotic
collagen, to imaging of reconstituted collagen structures and actin-myosin complexes

17
(Campagnola et al. 2002; Chu et al. 2004; Williams et al. 2005; Raub et al. 2007;
Campagnola and Dong, 2011; Tokarz et al. 2019).
SHG signal is generated by structures which are noncentrosymmetric (Hompland et
al. 2008). Thus, molecules and crystalline structures that lack a centre of symmetry are
essential for efficient SHG production and are birefringent (Bueno et al. 2016). The
strength of this signal is characterized by the second-order nonlinear optical susceptibility
tensor χ⁽²⁾ (Hermans et al. 2017). χ⁽²⁾ is defined as a non-zero value, where the number of
non-zero elements within a material is dependent on asymmetry properties of the molecules
or microcrystalline structure of the material (Bueno et al. 2016; Hermans et al. 2017).
Biological molecules that are known to produce strong SHG signals include but are not
limited to collagen (Cox, 2011; Tokarz et al. 2019), myosin (Campagnola et al. 2002) and
polysaccharides such as starch (Cox, 2011; Cisek et al. 2015). Since collagen has a highly
ordered molecular arrangement which gives rise to non-centrosymmetric symmetry, it is a
suitable candidate for investigation using SHG microscopy (Hompland et al. 2008).
1.6 Objectives
This study focuses on quantitative ultrastructural analysis of collagen structure and
morphology under varying chemical conditions to gain a greater understanding of ECM-
associated cancer aetiology. Specifically, this project seeks to gain an understanding of
how chemical changes in the ECM affect the structure of collagen allowing for the
initiation and progression of PDAC.
The objectives of this study are to 1) develop a collagen gel protocol to synthesize
acellular hydrogels for study 2) determine the fibrillar structure of collagen in a 3-

18
dimensional matrix near physiological temperatures and tumour pH, and 3) create a model
system specific to SHG studies. By creating a model system through which we can study
the morphological changes of collagen fibres, there is a greater ability to deduce the fibrillar
structure and arrangement of fibrils produced in a 3-dimensional matrix similar to the
ECM. By changing temperature and pH, we hope to determine which extracellular
conditions produce the collagen structure and morphology characteristic of PDAC,
visualized by SHG microscopy.

19
2. Materials and Methods
2.1 Synthesizing Collagen Gels
Collagen Type I Gel Preparation:
The procedure used was modified from Raub et al. (2008). Briefly, collagen gels were
prepared by mixing the following solutions in order on ice: 20 µL 10× phosphate-buffered
saline (PBS) (pH 7.4; consisting of sodium chloride, potassium chloride, sodium phosphate
monobasic and potassium dihydrogen phosphate), 11.5 µL dH₂O, 166.7 µL 3.0 mg/ml
collagen type I monomer solution from bovine skin (C4243, Sigma Aldrich) and 1.8 µL 1
M sodium hydroxide. Following the addition of the first three solutions, the mixture was
vortexed at medium speed four times for 15 seconds to ensure homogeneity of the sample
with four 15 second rest periods on ice to prevent the initiation of polymerization after each
time it was vortexed. The mixture was then vortexed for another 15 seconds following pH
adjustments with either 0.1M or 1 M NaOH to reach the desired pH of 5.5, 6.5, 7.4, 7.5 or
8.5. 20 µL of the mixture was pipetted onto a slide. The sample was subsequently kept in
a high humidity container which consisted of a petri dish layered with a moist paper towel
at the incubation temperature and sealed with four layers of parafilm. Ensuring high
humidity during incubation avoided artefacts due to quick drying, and improved
repeatability as well as sample homogeneity. Collagen gels were prepared at a
concentration of 2.5 mg/ml, pH 5.5, 6.5, 7.4, 7.5 and 8.5 and the following temperatures:
25°C for 16 hours and 37°C for 40 minutes. Three separately synthesized gel mixtures were
made at each condition. In total, 30 gels were made (see table 2). Due to time constraints,
only type I collagen was investigated during this study.

20
Table 2. The number of gels synthesized at the given pH and temperature.
pH 5.5 6.5 7.4 7.5 8.5
Temperature
25°C 3 3 3 3 3
37°C 3 3 3 3 3
2.2 Fibril Detection in Collagen type I Gels
2.2.1 Synthesis of Turmeric Dye:
3.75 mg of milled Curcuma longa powder (Organic Earth Market) was
weighed and dissolved in 25 ml of 70% volume by volume (v/v) ethanol.
The prepared solution was left for 2 hours in a tightly sealed container
after which the solution was transferred to test tubes and centrifuged at
3000 rpm for 5 minutes. The supernatant from each tube was removed,
combined and stored until use (Figure 6).
2.2.2 Experimental Control -Acrylamide Gel Preparation:
Acrylamide gels were synthesized as a negative control to confirm fibril identification
within the collagen gels. Encapsulation of the collagen monomers in acrylamide gel
inhibits the formation of collagen fibrils and thus, is not expected to be stained or produce
birefringence. The gels were prepared by mixing the following components in order: 50µL
of 3.0mg/ml collagen type I monomer solution from bovine skin, 20µL of acrylamide mix
(consisting of 1.5 g of acrylamide powder, 0.04 g of bisacrylamide powder and 5 mL of
water), 5µL Ammonium persulphate (APS) mix (consisting of 0.1 g of APS and 0.9 mL of
Figure 6: 0.15
mg/mL
Turmeric Stain

21
water) and 1µL tetramethylethylenediamine (TEMED). The solution was mixed following
the addition of the APS mixture and again after the addition of TEMED. Mixture of the
solution was carried out by carefully pipetting the solution up and down to prevent the
introduction of bubbles to the solution. 20 µL of the solution was quickly pipetted onto a
glass slide and allowed to polymerize. Acrylamide gels were prepared at a concentration
of 1.97 mg/ml.
2.3 Characterization of Collagen Gels
2.3.1 Second Harmonic Generation Microscopy
The following characterization procedure was completed in a Class 4 laser laboratory and
executed according to Laser Safety Policies and Guidelines. Prior to scanning, samples
were prepared for microscopy by placing a coverslip on top of the gel following gelation
and sealing the slide and coverslip with clear nail polish to keep the gel from drying.
A custom-built nonlinear optical microscope setup, measuring second harmonic
generation intensity, was used in the investigation of collagen gels (Figure 7). The imaging
system has been previously described and is only briefly described here (Purvis et al.,
2019). The excitation source used was a femtosecond (fs) duration pulsed laser (FemtoLux
3, Ekspla) operating at 1030 nanometre (nm) and ~245 fs pulses generated at a repetition
rate of 5 megahertz (MHz). Other key components of the microscope included scanning
mirrors, microscope objectives and, a polarizer and liquid crystal modulator for complete
polarization and linearization of the incoming light beam.

22
Figure 7: Schematic of the nonlinear optical microscope with the laser traversing the x-y
plane. Figure was adapted from Cisek (2012).
Microscope components are as follows: DM: dichroic mirror, M: mirror, FM: flipping mirror, L: optical
lenses, F: optical filter, D: photon counting detector, LP: linear polarizer, LCR: liquid crystal retarder, QWP:
quarter-wave plate, EO: excitation microscope objective, CO: collection microscope objective, LED: light
emitting diode and, DAQ; data acquisition card. The insert on the top left represents the sample plane z-x
and the raster scan pattern of laser scanning. Diagram not drawn to scale.
In the experiments, beam focusing was achieved using an excitation microscope
objective (Zeiss Apochromat 0.8 numerical aperture (NA) air immersion objective) while
signal produced was collected by the collection microscope objective (custom 0.8 NA air
objective) in the transmission direction. The aforementioned wavelength and NA resulted

23
in an axial resolution of approximately 1.5 µm. SHG images were obtained using linearly
polarized light to probe the average orientation of the fibrils. Desired polarizations at the
focus were achieved using liquid crystal rotators. SHG was isolated using a BG 39 filter
(Edmund Optics) and a bandwidth interference filter, (BP 525-25, Edmund Optics) and
detected with a photomultiplier tube (H10682-210, Hamamatsu Photonics K.K.) in photon-
counting mode. Five to seven images were taken for each of three collagen gels per
polymerization temperature and pH.
Image and Data Analysis of SHG images
Prior to analysis, all data was normalized to account for differences in the laser power used
for collection. ImageJ (NIH) software was used in the analysis of images acquired by the
SHG microscope. The mean and standard deviation of signal intensity per pixel were
calculated for each image processed by segmentation which involved finding the maximum
value pixel of each signal which contains no distinguishable collagen fibrils. This
segmentation excludes void regions so that measurements obtained are only of collagen
networks. A noise threshold is set just above this pixel intensity and pixels with signals
below this threshold were excluded from the calculations of mean and standard deviation.
Segmented images containing <50 pixels were excluded from the calculations. A two-
tailed t-test was carried out to test for a significant difference in the fibre intensity within
and among gels of varying temperature and pH. P-values were adjusted using the Holm’s
Sequential Bonferroni Procedure at an alpha level of 0.05. All statistical tests were
performed manually in Excel (Microsoft) using standard methods.

24
2.3.2 Scanning Electron Microscopy (SEM)
Fixation Procedure
The procedure used was modified from Raub et al. (2008). Briefly, collagen gels were
prepared for electron microscopy by fixation and serial dehydration. This procedure
shrinks and dries the gels, as required for SEM, but preserves the microstructural
characteristics produced during polymerization. Following polymerization, collagen gels
were fixed with 4% formaldehyde in PBS for 2h at room temperature. After three 5-minute
washes in PBS and two 5-minute washes in dH₂O, fixed collagen gels were dehydrated in
a graded ethanol/dH₂O series: one 50% v/v, 70% v/v, 95% v/v 10-minute wash and three
100% v/v ethanol 15-minute washes. Following the serial dehydration, samples were
chemically dried with a graded hexamethyldisiloxane (HMDS)/ethanol series: 33% v/v,
50% v/v, 66% v/v and three 100% v/v HMDS washes for 15 minutes each. The last HMDS
wash was allowed to evaporate in a fume hood overnight. Specimens were kept covered
during fixation and drying to prevent contamination of the samples. The gels were cracked
into smaller pieces, mounted on SEM sample stages using carbon tape and sputter coated
with gold to a thickness of 12-15nm using a Bio-Rad JBS-PS-3 Sputter Coater.
Imaging and Data Analysis of SEM images
Samples were imaged in the Electron Microscopy Centre at Saint Mary’s University,
Halifax, Nova Scotia. Images were captured using a TESCAN Mira3 LMU scanning
electron microscope operating at 15kV. Backscattered electrons were collected at
magnifications of 5,000×, 20,000×, 50,000×, 80,000× and 125,000×. SEM images obtained
were analysed using ImageJ (NIH) software.

25
Fibril diameter was measured using the line-drawing function. Diameters were
measured by drawing a line across the width of the fibril and calculating the length of the
line. All fibrils were selected for measurement if they were in focus and did not have
another fibril behind of it. Average fibril diameters were selected to be representative of
the entire image. D-banding periodicity was measured using the profile plot function and
the width of the peak was determined by drawing a line was drawn from centre to centre
of each peak. A two-tailed t-test was carried out to test for a significant difference in the
fibril diameter and D-banding periodicities within and among gels of varying temperature
and pH. P-values were adjusted using the Holm’s Sequential Bonferroni Procedure at an
alpha level of 0.05. All statistical tests were performed manually in Excel (Microsoft) using
standard methods.
2.3.3 Cross-Polarized Light Microscopy
Prior to staining, samples were fixed in 4% formaldehyde in PBS for 2 hours followed by
three 5-minute washes in PBS and two 5-minute washes in dH₂O. The alcoholic extract of
C. longa was used as a cytoplasmic stain. Fixed samples were covered with 20 µL of the
cytoplasmic stain for 5 minutes followed by rinses in dH₂O until the rinse was clear.
Stained gels were viewed and photographed under an Olympus BX41 cross-
polarized microscope at 10× and 40× magnification. Images were captured using a
PixelLINK PL-B623 camera equipped with PixelLINK Capture OEM software operating
on Version 2.3.7.13. For comparison, images were taken in birefringence and non-
birefringence mode under similar conditions and were analysed using ImageJ (NIH)
software. Average intensity was measured for each image. A two-tailed t-test was carried

26
out to test for a significant difference in the birefringence within and among gels of varying
temperature and pH. P-values were adjusted using the Holm’s Sequential Bonferroni
Procedure at an alpha level of 0.05. All statistical tests were performed manually in Excel
(Microsoft) using standard methods.

27
3. Results and Discussion
3.1 Determining the presence of collagen fibrils and fibril density using Cross-
Polarized Microscopy
To validate the protocol developed in the laboratory, this procedure (Materials and
Methods, Section 2.2) was used to determine whether collagen fibrils were being formed
within each gel and to see whether the gels could be structurally differentiated from each
other using readily available polarization techniques.
While the active staining compound remains unclear, the C. longa stain was able to
stain the collagen fibrils of the polymerized gel within 5 minutes. Polymerized collagen
gels appeared a deep orange colour when viewed under light microscopy confirming the
presence of collagen fibril bundles (panels A and B; Figure 8). The control gel of collagen
monomers was void of the deep orange colour verifying that only polymerized collagen
fibrils were being stained by the dye (panel C; Figure 8). Birefringence of the gels (bottom
row; Figure 8) confirmed that collagen fibrils were present in the polymerized gels but not
in the control where fibrils were absent.

28
Figure 8: Photomicrographs of collagen gels showing the staining ability of curcumin
and confirming the formation of collagen fibrils. Representative light microscopy (top
row) and birefringence (bottom row) images of 2.5 mg/mL acellular collagen hydrogels
polymerized at pH 7.4 and at 25°C (A, D) and 37 °C (B, E) and 2.5 mg/mL collagen
monomers encapsulated in acrylamide gel (C, F). Images are 40×. Ten images were used
in intensity quantification and statistical analysis. Red arrows indicated stained collagen
fibril bundles within each image. Scale bars are indicated in the figures.
Collagen molecules are highly-ordered molecules with a parallel orientation and
thus, produce birefringence (Montes et al. 1984). The dye is acidic in nature and expresses
a high affinity for collagen and other basic structures within a cell’s cytoplasm such as red
blood cells (Avwioro et al. 2007; Kumar et al., 2014). The dye reacts with collagen
enhancing the normal birefringence because of the attachment of the dye molecules along
their parallel axes (Montes et al. 1984). The significant difference in signal between the
polymerized gels and the control (p<0.003 for both 25°C and 37°C polymerized gels;
Figure 9) could be explained by the presence of fibrils and their localized concentrations
within specific sections of the gel. This increases the intensity of the stain within that
particular area of the gel. Conversely, the collagen monomers are not polymerized and
A. B. C.
D.
D..
E. F.
29
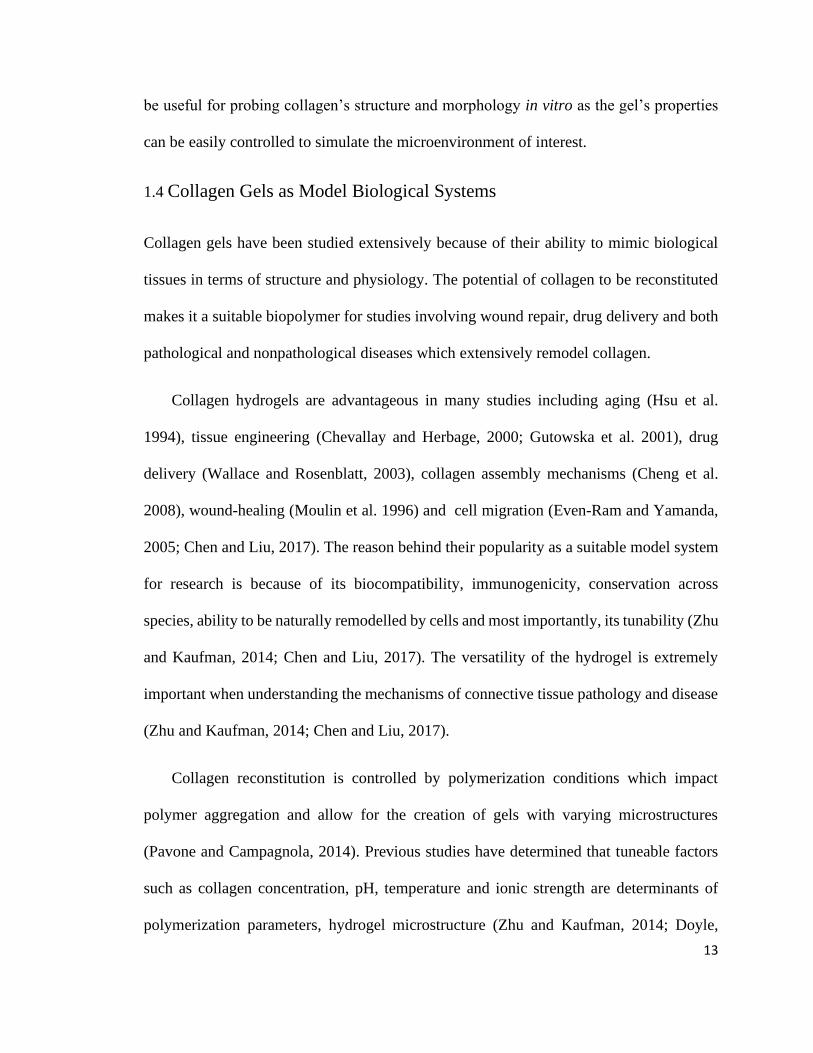
remain dispersed throughout the gel, decreasing the signal intensity. The average
birefringence for each collagen gel suggests that there may have an increased density of
collagen fibrils in collagen gels polymerized at 25°C. While the technique was effective in
differentiating average birefringence in gels polymerized at 25°C and 37°C (p<0.010), this
technique was unable to discriminate specific ultrastructural details of polymerized gels at
varying temperatures and highlighted the need for a more sensitive detection system.
Figure 9: Average collagen fibril density of 2.5 mg/mL acellular collagen hydrogels
and collagen monomers encapsulated in acrylamide gel (control) in arbitrary units
(a.u.) as measured by birefringence. Error bars represent ± one standard deviation. Black
bars shown represent the control prepared at room temperature while striped bars represent
hydrogels polymerized at 25°C and 37°C. Ten images were used in intensity quantification
and statistical analysis. Sample size = 10. A significant difference in average birefringence
was found among treatments for control versus 37°C collagen gel (p<0.003), control versus
25°C collagen gel (p<0.003) and 37°C versus 25°C collagen gels (p<0.010). Symbol (**)
denotes statistically significant difference among polymerization pH and temperature
groups.
0
2
4
6
8
10
12
14
16
18
Control Collagen Gels
Aver
age
Bir
efri
ngen
ce (
a.u.)
Gel Type
37 °C
25 °C
**
** **
Control Collagen Gels

30
3.2 Polymerization temperature and pH effects on gel microstructure
Fibril Morphologies
To determine the effects of polymerization temperature and pH on collagen fibril structure
and morphology, synthesized collagen gels were imaged using SEM and SHG microscopy.
A reproducible protocol (Materials and Methods, Section 2.1) was developed to study the
properties of a large population of collagen type I fibrils within a 3-dimensional matrix.
pH 5.5, 6.5, 7.5 and 8.5 were investigated at temperatures of 25°C (for comparison with
previous literature results) and 37°C (as this range is near physiological temperature).
Different areas of the gel were imaged to provide a representative image of the entire
collagen gel. For analysis, fibril diameter was selected as the parameter of study as fibril
length was difficult to qualify without disrupting the structure of the entangled fibril
network.
Figure 10 shows the collagen gel microstructure as a function of temperature and
pH as visualized by SEM. The gel microstructure and collagen fibril morphology varied
widely depending on the polymerization pH and temperature. The matrix appears
qualitativey tighter at both higher polymerization temperature and pHs (Figure 10). These
results are consistent with previous work carried out by Rosenblatt et al. (1994), and Raub
et al. (2008). Although it is difficult to directly compare the results of each study, due to
difference in methodologies, the general interpretation remains the same: a deviation from
physiological pH (pH 7.4) results in increased rigidity within the gel microstructure. This
effect may be attributed to the increase in electrostatic interactions between charged
residues and resulting in a tighter arrangement of the fibrils and ultimately higher

31
mechanical properties (Rosenblatt et al. 1994; Raub et al. 2008; Achilli and Mantovani,
2010).
Figure 10: Representative SEM images of 2.5 mg/mL acellular collagen hydrogels at
25 °C (A-D) 37 °C (E-H) and at pH 5.5, 6.5, 7.5, and 8.5. Images are 80,000×. Five
images were used in microstructure quantification and statistical analysis. The scale bars
are indicated in the figures.
Collagen gel networks became more homogenous, reticular and uniform in
diameter as the polymerization temperature increased from 25 to 37°C (Figure 10). At
higher temperatures, the gel microstructure possesses less fibril bundling than at lower
temperatures. These results are consistent with previous work carried out by Raub et al.
(2007), Yang et al. (2009), Jansen et al. (2018) and Jones et al. (2014) and can be attributed
to kinetics and hydrodynamic effects which alter the heterogeneity of the microstructure
and cluster potential of the fibrils (Jones et al. 2014). At lower temperatures, there is a
decreased rate of fibril nucleation and thus, a small number of collagen fibrils are able to
grow before being cross-linked. Hydrodynamic effects occur because of the motion of
water within the gel. These effects result in an increased alignment of the fibrils with one
another leading to a heterogenous matrix (Jones et al. 2014). At higher temperatures
A. C. B.
H. G. F. E.
D.

32
however, there is an increased nucleation and growth rate. Thus, the fibrils crosslink before
a significant orientational correlation is achieved resulting in a homogenous matrix with
shorter and thinner fibrils (Jones et al. 2014).
SEM images also revealed a trend of decreasing fibril diameter with increasing
polymerization temperature (Figure 11). This result can be attributed to assembly
properties and polymerization kinetics of collagen. Higher temperatures during
fibrillogenesis affect the final fibril morphology of collagen by strengthening the
electrostatic and hydrophobic interactions and, hydrogen bond forces of collagen
monomers. This in turn enhances fibril precipitation in solution and limits lateral
aggregation to produce thinner fibrils (Raub et al. 2007; Achilli and Mantovani, 2010).
A similar trend of decreasing fibril diameter was also observed with increasing
polymerization pH at 25°C. Data collected at a polymerization temperature of 25°C at pH
5.5 was omitted from analysis as the sample size was too small owing to the lack of fibrils
present in the gel network. A decreased fibril diameter with increased pH at 25°C is
consistent with previous studies by Wood et al. (1960) and Raub et al. (2008) who
demonstrated that smaller fibril diameter is correlated to higher pH values and larger fibril
diameter to lower pH values at 25°C and room temperature respectively. This can be
explained by an extension of the nucleation phase by decreased pH and temperature which
allows for fibril aggregation and the development of thicker fibrils (Sung, 2009). An
increase in polymerization pH has been shown to decrease the net positive charge on each
collagen monomer by deprotonation of the amino acid side chains within the molecule.
Decreasing the positive charge allows for increased hydrogen bonding between the

33
collagen triple helices and increases the melting temperature of the collagen molecule
(Leikin et al. 1995; Morozova and Muthukumar, 2018). This suggests that at lower pH,
where decreased bonding attraction and monomer stability correlates with an extended
nucleation phase and increased fibril diameter, there is lateral association of the fibrils
through increased attractive forces between the fibrils rather than the monomers (Raub et
al. 2008). However, at 37°C, there is an opposite trend where the fibril diameter increases
with increasing polymerization pH contrary to previous findings by Roeder et al. (2002).
This could be attributed to poor execution of the methodology and errors in pipetting
leading to incorrect pH values. No data were collected at a polymerization temperature of
37°C and pH 5.5 as fibrils could not be visualized within the gel using SEM.
Figure 11: Mean diameter of collagen fibrils in nm at various pHs and temperatures.
Error bars represent ± one standard deviation. Black bars shown represent gels polymerized
at 25°C while striped bars represent hydrogels polymerized at 37°C. Twenty fibrils from
five images were used in diameter quantification and statistical analysis. Sample size = 5.
A significant difference (p<0.009) in mean collagen fibril diameter was determined among

34
treatments for pH 6.5, 7.5 and 8.5 for 25°C and 37°C polymerized gels. Significant
difference (p<0.009) was also determined between treatments for pH 6.5 and 8.5 and pH
7.5 and 8.5 for 25°C polymerized gels and pH 6.5, 7.5 and 8.5 for 37°C polymerized gels.
No significant difference was found among treatments for pH 6.5 and 7.5 for 25°C
polymerized gels (p<0.50). Symbols (** and ns) denote a statistically significant difference
and no significant difference among polymerization pH and temperature groups,
respectively.
Fibrils with periodicities similar to characteristic D-banding periodicity were
present in SEM images (Figure 12). Lower pH conditions (pH 5.5 and 6.5) produced gels
with a higher proportion of nonfibrillar collagen as such conditions act as inhibitors of
fibrillogenesis (Harris and Reiber, 2007). The lower the pH, the more the process of
fibrillogenesis is inhibited and a greater amount of nonfibrillar collagen is present within
the gel (panels A and F; Figure 10). This demonstrated that under in vitro conditions,
collagen type I monomers have the ability to form various fibrillar and non-fibrillar
assemblies across a wide pH and temperature range in physiological salt conditions.
Figure 12: SEM images of self-assembled collagen fibrils following polymerization at
25°C (a-c) and 37°C (d-e) showing D-banding periodicities. The insert in the lower right

35
corner of each image shows a magnified view of a single fibril to emphasize the banding
pattern. Images are 80,000×. Three images were used in periodicity quantification and
statistical analysis. The scale bars are indicated in the figures.
D-banding Periodicity
Measurement of the D-banding periodicity of self-assembled in vitro fibrils is vital as it is
believed to play an important role in the mechanical and biological functions of
collagenous matrices as well as in mineralization (Glimcher 1959; Fratzl et al. 2004). The
D-banding periodicity is characteristic of collagen fibrils and distinguishes them
structurally from other fibrils and structures within the matrix (Shoulders and Raines,
2009).
The native-banded fibril is characterized by a D-banding periodicity of 67 nm for
in vivo tissues (Paige et al., 1998; Shoulders and Raines, 2009) and 64 nm for air-dried
samples (Wess and Orgel, 2000). As summarized in Figure 13, the D-banding periodicity
in this study was found to range from 46 to 67 nm for pH 6.5, 7.5 and 8.5 (Appendix, Table
3) which is lower than the literature values reported for dehydrated collagen fibrils (Wess
and Orgel, 2000). No bands were visualized at the following conditions: pH 5.5 at 25°C
and pH 6.5 at 37°C. Holmes et al. (1992), theorized that within the range of physiological
pH and salt content, fibrillogenesis produces polymorphic intermediates (sub-fibrils) in the
form of early unipolar spindle-shaped D-banded collagen type I fibrils which later fuse
together creating the highly-ordered quasi-crystalline collagen fibre structure. Previous
work by Gelman et al. (1979) also indicates the conversion of collagen monomers to an
intermediate form prior to fibril assembly. This suggests that the D-banding periodicities

36
observed outside of the reported value may have occurred because of lateral misalignment
and ionization-dependence of these sub-fibrils during fibrillogenesis (Harris and Reiber,
2007).
Fibrils retained a periodicity most similar to those of native-banded fibrils when
synthesized at a polymerization pH of 8.5 and polymerization temperature of 37°C which
is within the range of physiological polymerization conditions: pH 7.4 and 37°C. Retention
of the native D-banding periodic structure following reconstitution is crucial as it indicates
that the collagen structure being studied is similar to that of in vivo collagen. The presence
of non-banded fibrils under the conditions: pH 5.5 at 25°C and pH 6.5 at 37°C
demonstrated that native banding is subjective under in vitro conditions and may be
dependent upon the procedure used in fibril reconstitution.
Figure 13: Mean D-banding periodicity of collagen fibrils in nm at various pHs and
temperatures. Error bars represent ± one standard deviation. Black bars shown
represent gels polymerized at 25°C while striped bars represent hydrogels polymerized at
37°C. Ten fibrils from three images were used in periodicity quantification and statistical
analysis. Sample size = 10. No significant difference in mean periodicity was determined
among treatments for pH 7.5 (p<1.00) and pH 8.5 (p<0.80) for 25°C and 37°C polymerized

37
gels. There was also no significant difference between treatments for pH 6.5 and 7.5
(p<0.50) and, 6.5 and 8.5 (p<1.00) for 25°C polymerized gels and for pH 7.5 and 8.5
(p<1.00) for 37°C polymerized gels.
3.3 SHG microscopy of collagen gel microstructure
To date, there has not been clinical application of a non-invasive technique to probe
material and organizational properties of the ECM on the cellular scale (Raub et al. 2008;
Pinkert et al. 2019). Alterations to the structures within the ECM and ultimately properties
of the matrix, such as cancer-associated changes, can have a major impact on the macro-
and microscopic biological interactions within the body (Raub et al., 2008). These
alterations may not be easily detectable using methods of detection currently employed in
clinical care. Thus, this study sought to compare the potential of SHG microscopy, a non-
invasive imaging technique, to SEM, an invasive imaging technique, to characterize and
discriminate in vitro acellular collagen gels for possible use of SHG as a diagnostic tool in
the field of histopathology.
Defined microstructural changes were observed between the gels polymerized at
different temperatures and pHs and a constant monomer concentration across experiments.
Previous SEM assessment revealed a polymerization temperature of 25°C produced
dispersed collagenous networks with decreased abundance of thicker fibrils. These fibrils
in turn give rise to brighter SHG images with higher SHG intensity values (panels A-D;
Figure 14). Contrastingly, hydrogels polymerized at 37°C produced densely-packed
collagen meshes containing thinner fibrils at a higher abundance. These fibrils appeared
dimmer in SHG images and possessed lower SHG intensities. These characteristics are
visible in SHG images of the acellular collagen gels (panels E-H; Figure 14).

38
Figure 14: Representative SHG images of 2.5 mg/mL acellular collagen hydrogels at
25 °C (A-D) 37 °C (E-H) and at pH 5.5, 6.5, 7.5, and 8.5. Images are 100 × 70 µm.
Eleven images were used in microstructure quantification and statistical analysis. The scale
bars are indicated in the figures.
Figure 15 shows a substantial decrease in average SHG intensity with increasing
polymerization temperature. Decreasing intensity was also observed with increasing
polymerization pH at 25°C (Figure 12). However, at 37°C, there is an opposite trend where
the average SHG intensity increased with increasing polymerization pH.
A.
H. G.
D. C.
F. E.
B.

39
Figure 15: Average collagen fibril density in counts at varying pH and temperature
conditions as measured by SHG intensity. Error bars represent ± one standard
deviation. Black bars shown represent gels polymerized at 25°C while striped bars
represent hydrogels polymerized at 37°C. Eleven images were used in intensity
quantification and statistical analysis. Sample size = 11. A significant difference in average
intensity (p<0.012) was determined among treatments for pH 5.5, 7.5 and 8.5 for 25°C and
37°C polymerized gels and between treatments for pH 5.5, 6.5, 7.5 and 8.5 for 25°C
polymerized gels and pH 5.5, 7.5 and 8.5 for 37°C polymerized gels. No significant
difference was found among treatments for pH 7.5 and 8.5 for 37°C polymerized gels
(p<0.20). Symbols (* and ns) denote statistically significant difference and no significant
difference among polymerization pH and temperature groups, respectively.
Based on the SEM analysis of the polymerized gels, polymerization pH and
temperature were found to alter the diameter of the collagen fibrils. This plays an important
role in SHG signal transmittance and detection as SHG signals are nonlinearly dependant
on the density or thickness of the material (Raub et al. 2008; Pavone and Campagnola,
2014; Fuentes-Corona et al. 2019). In acellular collagen gels, collagen fibrils are the only
SHG generating component and (Raub et al. 2008; Pavone and Campagnola, 2014). This
suggests that thinner fibrils would give rise to a significant decrease in signal (Fuentes-

40
Corona et al. 2019), as evidenced in samples polymerized at 37°C and at an increased
polymerization pH. Fuentes-Corona et al. (2019) attributes this phenomenon to a decreased
concentration of collagen fibrils within the gel to generate SHG signal. However, this
explanation is only valid provided the overall fibril concentration and distribution remain
unchanged between each sample. Contrastingly, lower polymerization temperatures and
lower polymerization pH would be expected to increase the SHG signal generation within
the sample as both conditions produce fibrils with increased diameters. Additionally, I
speculate that the increased signal observed in gels of lower pHs could be attributed to the
higher proportion of non-fibrillar, sheet-like collagen present in these samples, increasing
the density of the network within the gels. Increased fibril diameter increases properties
of the fibrils favourable for SHG production such as its cross-section and allows for
optimum detection (Pavone and Campagnola, 2014). In relation to the trend of increasing
intensity at a polymerization temperature of 37°C, the SHG intensity results correspond
with the diameters noted in my SEM experiment.
Although my SEM images show a significant difference in diameter of fibrils
synthesized at pH 7.5 and 8.5 at 37°C (Figure 11), the result could not be confirmed by the
intensity measurement of the fibrils using SHG microscopy since thicker fibrils are
expected to produce higher intensities. As the sample is chemically dehydrated for electron
microscopy imaging, values for fibril diameter obtained are expected to differ from
diameters of native-banded fibres in a hydrated state. Deposition of a metal coating may
also affect the thickness of the fibril measured from SEM images, further suggesting that
the measured fibril diameter may not be completely accurate (Jansen et al. 2018). While
no diameter measurements were calculated from the SHG images obtained, the fibril size

41
within a gel can be correlated to the SHG signal detected. A similar explanation could be
given for the lack of statistical difference in the diameter of hand-measured fibrils
synthesized at pH 6.5 and 7.5 at 25°C and the suggestion of fibril size difference based on
the intensity measurement of the fibrils within the gels.
In summary, varying the polymerization pH and temperature of collagen gels
significantly impacts the overall gel microstructure and the morphology of the collagen
fibrils. An increasing pH resulted in thinner collagen fibrils at lower polymerization
temperatures with decreased SHG signal intensities and thicker collagen fibrils at higher
polymerization temperatures with increased SHG signal intensities. Polymerization
temperature and pH were found to have no effect on the D-banding periodicity of the fibrils
and reconstituted fibrils were found to be near previously reported physiological
periodicities (Paige et al. 1998).
The main contribution of this study was the development and testing of a
reproducible hydrogel procedure to probe for changes in collagenous structure using SHG
microscopy. Through this study, non-invasive SHG microscopy was combined with
invasive SEM imaging, to demonstrated the ability to noninvasively probe hydrogel
microstructure and advance the understanding of collagen ultrastructure under conditions
of near physiological temperature and tumour microenvironment pH. These data show that
SHG microscopy may be a useful histopathological technique to assess and discriminate
the structure of collagen within the extracellular matrix of connective tissues affected by
PDAC. Integration of SHG into the field of histopathology may allow for earlier detection
of PDAC because of the technique’s sensitivity to minute structural changes and aid in

42
increasing the prognosis of the disease. Understanding the specific changes which occur in
the extracellular environment that give rise to the cancer-associated collagenous hallmarks
can give insight into the mechanism by which these changes occur. With collagenous
hallmarks relatively similar across cancer types, obtaining knowledge of collagen content,
distribution and macro- and microstructure will give insight into the mechanism and
behaviours of other cancer types as well.

43
4. Future Studies
To further this investigation, the method of synthesis should be retested and adjusted for
more precise measurements of the parameters being tested. Rather than manually adjusting
the pH of the solution via the addition of an acid or base, specific buffers can be selected
with a buffering capacity identical to the pH being tested. This would allow for a more
precise pH by preventing the possibility of not obtaining the desired pH. In addition,
adapting the current polymerization method for use in a humidity-controlled incubator
would negate the need for sealing the sample in a “high-humidity” container, making the
process of preparing samples easier and leaving little to no room for human error in terms
of ensuring that the temperature within the container is the same as the incubation
temperature. This would also decrease the time necessary for sample preparation and could
allow for a larger sample size in future work. The procedure can also be improved by
imaging the same gel using both SEM and SHG microscopy for a more direct comparison
between the two methodologies and their results.
Secondly, future studies should contribute to a further understanding of how the
fibrillar assembly and structure of collagen is affected by changes within its chemical
environment. Studying the structure of collagen is of great importance as it plays a major
role in ECM pathology. In addition to pH and temperature, previous studies have
demonstrated several other chemical conditions which not only play a role in cancer
initiation and proliferation, but also in gel microstructure and, collagen fibril morphology,
alignment and orientation (Achilli and Mantovani, 2010; Lang and Lyubovitsky, 2015).
The tumour microenvironment has been found to play a role in maintaining the flux of

44
sodium and chloride ions to inhibit apoptosis of cancerous cells (Franco et al. 2006; Okada
et al. 2006). These ionic species can alter the solubility and thus, the aggregation of proteins
suspended within a solution (Achilli and Mantovani, 2010). Thus, collagen should be
reconstituted and polymerized in solutions of varying ionic strength to determine their
specific effects on collagen fibril structure, morphology and orientation within the gel
matrix.
Thirdly, this study also provides the framework for understanding how proteins
within the ECM play a role in determining the structure of collagen fibres. Despite collagen
type I being the most studied and the most abundant of the collagen types, many other
collagen types have been identified as key determinants of matrix stability (Shoulders and
Raines, 2009). Karsdal (2016) proposed that fibres within the body are composed of
collagen types I, III and V and other ECM proteins which function to regulate the diameter
of fibrils and network mechanical properties within tissue. Using the procedure developed,
it should be possible to alter the proportion of collagen monomer types within the gel to
achieve a structure more similar to that of native collagen fibrils.
Finally, additional measurements such as the arrangement and orientation of collagen
fibrils should be determined using polarization-dependent SHG microscopy. Then, SHG
can be utilized to its full potential to determine whether the orientation of the fibrils is
altered by specific conditions despite similar measurements within other parameters. The
microstructure of the gel can be probed in its entirety and collagen’s fibril morphology and
distribution can then be compared to in vivo fibril morphologies present within PDAC
histological samples to validate the model system.

45
5. References
Abraham LC, Zuena E, Perez-Ramirez B, Kaplan DL. 2008. Guide to collagen
characterization for biomaterial studies. J Biomed Mat Resear Part B – App Biomater
87B:264-285.
Achilli M, Mantovani D. 2010. Tailoring Mechanical Properties of Collagen-Based
Scaffolds for Vascular Tissue Engineering: The Effect of pH, Temperature and Ionic
Strength on Gelation. Polymers. 2(4): 664-680.
Ajeti V, Ndiarnykh O, Ponik SM, Keely PJ, Eliceiri KW, Campagnola PJ. 2011. Structural
changes in mixed Col I/Col V collagen gels probed by SHG microscopy: implications for
probing stromal alterations in human breast cancer. Biomed Opt Express. 2 (8): 2307-2316.
Alvarez-Garcia V, Tawil Y, Wise HM, Leslie NR. 2019. Mechanisms of PTEN loss in
cancer: It’s all about diversity. Semin Cancer Biol. 59: 66-79.
Anemone A, Consolino L, Arena F, Capozza M, Livo Longo D. 2019. Imaging tumor
acidosis: a survey of available techniques for mapping in vivo tumor pH. Cancer Metastasis
Rev. 38: 25-39.
Avwioro OG, Onwuka SK, Moody JO, Agbedahunsi JM, Oduola T, Ekpo OE, Oladele
AA. 2007. Curcuma longa extract as a histological dye for collagen fibres and red blood
cells. J Anat. 210 (5): 600-603.
Bailey AJ. 1987. Structure, Function and Ageing of the Collagens of the Eye. Eye. 1: 175-
183.
Berman HM, Westbrook J, Feng Z, Gilliland G, Bhat TN, Weissig H, Shindyalov IN,
Bourne PE. 2000. The Protein Data Bank. Nucleic Acids Research. 28:235-242.
Bhowmick NA, Neilson EG, Moses HL. 2004. Stromal fibroblasts in cancer initiation and
progression. Nature 432: 332-337.
Boyd R. 2008. Nonlinear Optics, 3rd ed. Burlington: Academic Press.

46
Bueno JM, Ávila FJ, Artal P. 2016. Second Harmonic Generation Microscopy: A Tool for
Quantitative Analysis of Tissues. In: Stanciu SG, editor. Microscopy and Analysis. InTech.
p2-23.
Bueno JM, Ávila FJ, Artal P. 2017. Comparison of second harmonic microscopy images
of collagen-based ocular tissues with 800 and 1045 nm. Biomed Opt Express. 8(11): 5065-
5074.
Campagnola PJ, Dong CY. 2011. Second harmonic generation microscopy: principles and
applications to disease diagnosis. Laser Photonics Rev. 5(1): 13-26.
Campagnola PJ, Millard AC, Terasaki M, Hoppe PE, Malone CJ, Mohler WA. 2002.
Three-Dimensional High-Resolution Second- Harmonic Generation Imaging of
Endogenous Structural Proteins in Biological Tissues. Biophys J. 81: 493-508.
Canadian Cancer Society’s Advisory Committee on Cancer Statistics. 2017. Canadian
Cancer Statistics 2017 – Special topic: Pancreatic cancer. Canadian Cancer Society.
Chapman JA. 1985. The Banding Pattern of Collagen. In: Bairati A, Garrone R, editors.
Biology of Invertebrate and Lower Vertebrate Collagens. New York: Plenum Press. p. 515-
537.
Chen F, Liu X. 2017. Advancing biomaterials of human origin for tissue engineering. Prog
Polym Sci. 53: 86-168.
Cheng X, Gurkan UA, Dehen CJ, Tate MP, Hillhouse HW, Simpson GJ. 2008. An
electrochemical fabrication for the assembly of anisotropically oriented collagen bundles.
Biomater. 29(22): 3278-3288.
Chevallay B, Herbage D. Collagen-based biomaterials as 3D scaffold for cell cultures:
applications for tissue engineering and gene therapy. Med Biol Eng Comput. 38(2): 211-
218.

47
Cisek R. 2012. Structural Investigation of Biological and Semiconductor Nanostructures
with Nonlinear Multicontrast Microscopy [dissertation]. [Mississauga (ON)]: University
of Toronto.
Chu S, Chen S, Chen G, Tsai T, Chen Y, Lin B, Sun C. 2004. Studies of χ(2)/χ(3) Tensors
in Submicron-Scaled Bio-Tissues by Polarization Harmonics Optical Microscopy. Biophys
J. 86: 3914-3922.
Cisek R, Tokarz D, Steup M, Tetlow IJ, Emes MJ, Hebelstrup KH, Blennow A, Barzda V.
2015. Second harmonic generation microscopy investigation of the crystalline
ultrastructure of three barley starch lines affected by hydration. Biomed Opt Express. 6:
3694-3700.
Cox G. 2011. Biological applications of second harmonic imaging. Biophys Rev. 3: 131.
Cox TR, Erler JT. 2011. Remodeling and homeostasis of the extracellular matrix:
implications for fibrotic diseases and cancer. Dis Model Mech. 4: 165-178.
DeClerk YA. 2012. Desmoplasia: A Response or Niche? Cancer Discov. 2(9): 772-774.
Doyle AD. 2016. Generation of 3D collagen gels with controlled, diverse architectures.
Curr Protoc Cell Biol. 72: 10.20.1-10.20.16.
Ellis H. 2007. Anatomy of the pancreas. Surgery (Oxford). 25: 72-73.
Even-Ram S, Yamanda KM. Cell migration in 3D matrix. Curr Opin Cell Biol. 17(5): 524-
532.
Fang M, Yuan J, Peng C, Li Y. 2014. Collagen as a double-edged sword in tumor
progression. Tumour Biol. 35: 2871-2882.
Franco R, Bortner CD, Cidlowski JA. 2006. Potential roles of electrogenic ion transport
and plasma membrane depolarization in apoptosis. J Membr Biol. 209: 43–58.

48
Frantz C, Stewart KM, Weaver VM. 2010. The extracellular at a glance. J Cell Sci. 123:
4195-4200.
Fratzl P, Gupta HS, Paschalis EP, Roschger P. 2004. Structure and mechanical quality of
the collagen-mineral nano-composite in bone. J Mater Chem. 14(14): 2115-2123.
Fuentes-Corona CG, Licea-Rodriguez J, Younger R, Rangel-Rojo R, Potma EO, Rocha-
Mendoza I. 2019. Second harmonic generation signal from type I collagen fibrils grown in
vitro. Biomed Opt Express. 10(12): 6449-6461.
Gelse K, Pöschl E, Aigner T. 2003. Collagens – structure, function, and biosynthesis. Adv
Drug Deliv Rev. 55: 1531-1546.
Gelman RA, Williams BR, Piez KA. 1979. Collagen Fibril Formation: Evidence for a
Multistep Process. J Biol Chem. 254(1): 180-186.
Glimcher MJ. 1959. Molecular Biology Of Mineralized Tissues With Particular
Reference To Bone. Rev Mod Phys. 31(2): 359-393.
Gutowska A, Jeong B, Jasionowski M. 2001. Injectable gels for tissue engineering. Anat
Rec. 263(4): 342-349.
Harjanto D, Maffei JS, Zaman MH. 2011. Quantitative Analysis of the Effect of Cancer
Invasiveness and Collagen Concentration on 3D Matrix Remodelling. PLoS One. 6:
e24891.
Harris JR, Reiber A. 2007. Influence of Saline and pH on Collagen Type I Fibrillogenesis
in Vitro: Fibril Polymorphism and Colloidal Gold Labelling. J Micron. 38(5): 513-521.
Hermans A, Kieninger C, Koskinen K, Wickberg A, Solano E, Dendooven J, Kauranen M,
Clemmen S, Wegener M, Koos C, Baets R. 2017. On the determination of χ⁽²⁾ in thin films:

49
a comparison of one-beam second-harmonic generation measurement methodologies. Sci
Rep. 7:44581.
Holmes DF, Chapman JA, Prockop DJ, Kadler KE. 1992. Growing tips of type I collagen
fibrils formed in vitro are near-parabolic in shape, implying a reciprocal relationship
between accretion and diameter. Proc Natl Acad Sci U.S.A. 89: 9855–9859.
Hompland T, Erikson A, Lindgren M, de Lange Davies C. 2008. Second-harmonic
generation in collagen as a potential cancer diagnostic parameter. J Biomed Optics. 13:
054050.
Hsu S, Jamieson AM, Blackwell J. 1994. Viscoelastic Studies of Extracellular Matrix
Interactions in a Model Native Collagen Gel System. Biorheology. 31(1): 21-36.
Jansen KA, Licup AJ, Sharma A, Rens R, MacKintosh FC, Koenderink GH. The Role of
Network Architecture in Collagen Mechanics. Biophys J. 114(11): 2665-2678.
Jolly LA, Novitskiy S, Owens P, Massoll N, Cheng N, Fang W, Moses HL, Franco AT.
2016. Fibroblast-mediated collagen remodeling within the tumor microenvironment
facilitates progression of thyroid cancers driven by BrafV600E and Pten loss. Cancer Res.
76:1804–1813.
Jones CAR, Liang L, Lin D, Jiao Y, Sun B. 2014. The spatial-temporal characteristics of
type I collagen-based extracellular matrix. Soft Matter. 10(44): 8855–8863.
Karagiannis GS, Poutahidis T, Erdman SE, Kirsch R, Riddell RH, Diamandis EP. 2012.
Cancer-associated fibroblasts drive the progression of metastasis through both paracrine
and mechanical pressure on cancer tissue. Mol. Cancer Res. 10: 1403–1418.
Karsdal MA, editor. 2016. Biochemistry of Collagens, Laminins and Elastin. United
Kingdom: Elsevier.

50
Kato Y, Ozawa S, Miyamoto C, Maehata Y, Suzuki A, Maeda T, Baba Y. 2013. Acidic
extracellular microenvironment and cancer. Cancer Cell Int. 13: 89.
Kenny TC, Schmidt H, Adelson K, Hoshida Y, Koh AP, Shah N, Mandeli J, Ting J,
Germain D. 2017. Patient-derived interstitial fluids and predisposition to aggressive
sporadic breast cancer through collagen remodeling and inactivation of p53. Clin Cancer
Res. 23: 5446–5459.
Kotova SL, Timashev PS, Guller AE, Shekhter AB, Misurkin PI, Bagratashvili VN,
Solovieva AB. 2015. Collagen Structure Deterioration in the Skin of Patients with Pelvic
Organ Prolapse Determined by Atomic Force Microscopy. Microsc. Microanal. 21(2):
324-333.
Kumar S, Singh NN, Singh A, Singh N, Sinha RK. 2014. Use of Curcuma Longa L. Extract
to Stain Various Tissue Samples for Histological Studies. Ayu. 35(4): 447-451.
Lang X, Lyubovitsky JG. 2015. Structural dependency of collagen fibers on ion types
revealed by in situ second harmonic generation (SHG) imaging method. Anal. Methods.
7(5): 1680-1690.
Leikin S, Parsegian VA, Yang WH, Walrafen GE. 1997. Raman spectral evidence for
hydration forces between collagen triple helices. Proc Natl Acad Sci U.S.A. 94(21): 11312-
11317.
Levental KR, Yu H, Kass L, Lakins JN, Egeblad M, Erler JT, Fong SF, Csiszar K, Giaccia
A, Weninger W, et al. 2009. Matrix crosslinking forces tumor progression by enhancing
integrin signaling. Cell. 139: 891–906.
Lodish H, Berk A, Zipursky SL. 2000. Molecular Cell Biology. 4th ed. New York: W.H.
Freeman.
Mahadevan V. 2019. Anatomy of the pancreas and spleen. Surgery. 37: 297-301.

51
McGuigan A, Kelly P, Turkington RC, Jones C, Coleman HG, McCain RS. 2018.
Pancreatic cancer: A review of clinical diagnosis epidemiology, treatment and outcomes.
World J Gastroenterol. 24(43): 4846-4861.
Mohler W, Millard AC, Campagnola PJ. 2003. Second harmonic generation imaging of
endogenous structural proteins. Methods. 29(1): 97-109.
Montes GS, Cotta-Pereira G, Junqueira LCU. 1987. The Connective Tissue Matrix of the
Vertebrate Peripheral Nervous System. In: Fedoroff S, editor. Advances in Cellular
Neurobiology. Orlando: Academic Press Inc. p. 177-218.
Morozova S, Muthukumar M. 2018. Electrostatic effects in collagen fibril formation. J
Chem Phys 149(16): 163333.
Moulin V, Castilloux G, Jean A, Garrel DR, Auger FA, Germain L. 1996. In vitro models
to study wound healing fibroblasts. Burns. 22(5): 359-362.
Nissen NI, Karsdal M, Williumsen N. 2019. Collagens and Cancer associated fibroblasts
in the reactive stroma and its relation to Cancer biology. J Exp Clin Cancer Res. 38: 115.
Öhlund D, Franklin O, Lundberg E, Lundin C, Sund M. 2013. Type IV collagen stimulates
pancreatic cancer cell proliferation, migration, and inhibits apoptosis through an autocrine
loop. BMC Cancer. 13:154.
Okada Y, Shimizu T, Maeno E, Tanabe S, Wang X, Takahashi N. 2006. Volume-sensitive
chloride channels involved in apoptotic volume decrease and cell death. J Membr
Biol. 209: 21–29.
Paige MF, Rainey JK, Goh MC. 1998. Fibrous Long Spacing Collagen Ultrastructure
Elucidated by Atomic Force Microscopy. Biophys. J. 74: 3211-3216.
Pavone FS, Campagnola PJ. 2014. Second Harmonic Generation Imaging. Florida: Taylor
& Francis.

52
Pinkert MA, Hortensius RA, Ogle BM, Eliceiri KW. 2018. Imaging the Cardiac
Extracellular Matrix. 1098: 21-44.
Poruk KE, Firpo MA, Adler DG, Mulvihill SJ. 2013. Screening for Pancreatic Cancer:
Why, How, and Who? Ann Surg. 257(1): 17-26.
Purvis K, Brittain K, Joseph A, Cisek R, Tokarz D. 2019. Third-order nonlinearoptical
properties of phycobiliproteins from cyanobacteria and red algae. Chem Phys Lett. 731:
136599.
Raub CB, Suresh V, Krasieva T, Lyubovitsky J, Mih JD, Putnam AJ, Tromberg BJ, George
SC. 2007. Noninvasive assessment of collagen gel microstructure and mechanics using
multiphoton microscopy. Biophys J. 92:2212–2222.
Raub CB, Unruh J, Suresh V, Krasieva T, Lindmo T, Gratton E, Tromberg BJ, George SC.
2008. Image Correlation Spectroscopy of Multiphoton Images with Collagen Mechanical
Properties. Biophys J. 94: 2361-2373.
Roeder BA, Kokini K, Sturgis JE, Robinson JP, Voytik-Harbin SL. 2002. Tensile
Mechanical Properties of Three-Dimensional Type I Collagen Extracellular Matrices with
Varied Microstructure. J. Biomed. Eng. 124: 214–222.
Roma-Rodrigues C, Mendes R, Baptista PV, Fernandes AR. 2019. Targeting Tumour
Microenvironment for Cancer Therapy. Int. J. Mol. Sci. 20(4): 840.
Rosenblatt J, Devereux B, Wallace DG. 1994. Injectable Collagen as a pH-Sensitive
Hydrogel. Biomater. 15: 985–995.
Rouède D, Schaub E, Bellanger JJ, Ezan F, Scimeca JC, Baffet G, Tiaho F. 2017.
Determination of extracellular matrix collagen fibril architectures and pathological
remodeling by polarization dependent second harmonic microscopy. Sci Rep. 12197.

53
Shields MA, Ebine K, Sahai V, Kumar K, Siddiqui K, Hwang RF, Grippo PJ, Munshi HG.
2013. Snail cooperates with KrasG12D to promote pancreatic fibrosis. Mol Cancer Res.
11:1078–1087.
Shoulders MD, Raines RT. 2009. Collagen Structure and Stability. Annu Rev Biochem.
78: 929-958.
Sung KE, Su G, Pehlke C, Trier SM, Eliceiri KW, Keely PJ, Friedl A, Beebe DJ. 2009.
Control of 3-dimensional collagen matrix polymerization for reproducible human
mammary fibroblast cell culture in microfluidic devices. Biomater. 30(27):4833–4841.
Tilbury K, Lien C, Chen S, Campagnola PJ. 2014. Differentiation of Col I and Col III
Isoforms in Stromal Models of Ovarian Cancer by Analysis of Second Harmonic
Generation Polarization and Emission Directionality. Biophys J. 106(2): 354-365.
Tilbury K, Campagnola PJ. 2015. Applications of Second-Harmonic Generation Imaging
Microscopy in Ovarian and Breast Cancer. Perspect Medicin Chem. 7: 21-32.
Tokarz D. 2014. Nonlinear Optical Properties of Carotenoid and Chlorophyll
Harmonophores [dissertation]. [Mississauga (ON)]: University of Toronto.
Tokarz D, Cisek R, Joseph A, Golaraei A, Mirsanaye K, Krouglov S, Asa S, Wilson BC,
Barzda V. 2019. Characterization of Pancreatic Cancer Tissue using Multiphoton
Excitation Fluorescence and Polarization-Sensitive Harmonic Generation Microscopy.
Front Oncol. 9: 272.
Vennin C, Chin VT, Warren SC, Lucas MC, Herrmann D, Magenau A, Melenec P, Walters
SN, Del Monte-Nieto G, Conway JR, et al. 2017. Transient tissue priming via ROCK
inhibition uncouples pancreatic cancer progression, sensitivity to chemotherapy, and
metastasis. Sci Transl Med. 9(384): eaai8504.
Walker C, Mojares E, Del Río Hernández A. 2018. Role of extracellular matrix in
development and cancer progression. Int J Mol Sci. 19: 3028.

54
Wallace DG, Rosenblatt J. 2003. Collagen gel systems for sustained delivery and tissue
engineering. Adv Drug Deliv Rev. 55(12): 1631-1649.
Wallis C. 2018. Why Pancreatic Cancer is on the Rise? Sci Am.
Weniger M, Honselmann KC, Liss AS. 2018. The extracellular matrix and pancreatic
cancer: A complex relationship. Cancers (Basel). 10: 316.
Wess TJ, Orgel JP. 2000. Changes in Collagen Structure: Drying, Dehydrothermal
Treatment and Relation to Long Term Deterioration. Thermochimica Acta. 365:119-128.
Williams RM, Zipfel WR, Webb WW. 2005. Interpreting Second-Harmonic Gneration
Images of Collagen I Fibrils. Biophys J. 88: 1377-1386.
Wood GC. 1960. The Formation of Fibrils from Collagen Solutions. A Mechanism of
Collagen-Fibril Formation. Biochem. J. 75: 598–605.
Xu S, Xu H, Wang W, Li S, Li H, Li T, Zhang W, Yu X, Liu L. 2019. The role of collagen
in cancer: from bench to bedside. J Transl Med. 17:1–22.
Yang YL, Leone LM, Kaufman LJ. 2009. Elastic Moduli of Collagen Gels Can Be
Predicted from Two-Dimensional Confocal Microscopy. Biophys J. 97: 2051–2060.
Zhu J, Kaufman LJ. 2014. Collagen I Self- Assembly: Revealing the Developing Structures
that Generate Turbidity. Biophys J. 106: 1822-1831.

55
6. Appendix – Extended Tabular Data
Table 1: Average intensities of collagen monomers and fibrils from birefringence images.
Condition Average Intensity
(a.u.)
Standard
Deviation
(a.u.)
Control Gel 6.51 0.22
37 °C Collagen Gel 10.84 1.94
25 °C Collagen Gel 13.48 2.36
Table 2: Mean diameters of hand-measured collagen fibrils polymerized under varying
polymerization temperatures and pHs calculated from SEM images.
Temperature
(°C) pH
Mean
Diameter
(nm)
Standard
Deviation
(nm)
25 (°C)
5.5 111.29 29.70
6.5 138.27 27.43
7.5 132.88 29.12
8.5 91.55 29.83
37 (°C)
6.5 56.30 8.12
7.5 102.12 9.19
8.5 138.10 28.46
Table 3: Mean D-banding periodicity of collagen fibrils polymerized under varying
polymerization temperatures and pHs calculated from SEM images.
Temperature
(°C) pH
Mean
Periodicity
(nm)
Standard
Deviation
(nm)
25 °C
6.5 54.7 6
7.5 59.4 6
8.5 56.0 9
37 °C 7.5 59.8 4
8.5 61.5 7

56
Table 4: Mean intensity of collagen fibrils polymerized under varying polymerization
temperatures and pHs calculated from segmented from SHG images.
Temperature
(°C) pH
Average
Intensity
(counts)
Standard
Deviation
(counts)
25 (°C)
5.5 269.67 90.98
6.5 189.78 40.94
7.5 48.14 21.56
8.5 63.72 22.31
37 (°C)
5.5 1.35 0.95
6.5 8.95 2.87
7.5 14.12 7.35
8.5 15.24 8.83