assessment of mercury intake from fish meals based on ... · on intervention research in the polish...
TRANSCRIPT
Assessment of Mercury Intake from Fish Meals Basedon Intervention Research in the Polish Subpopulation
Renata Kuras1 & Beata Janasik1& Magdalena Stanislawska1 & Lucyna Kozlowska2 &
Wojciech Wasowicz1
Received: 19 September 2016 /Accepted: 10 January 2017 /Published online: 27 January 2017# The Author(s) 2017. This article is published with open access at Springerlink.com
Abstract The paper’s objective was to estimate weekly Hgintake from fish meals based on intervention research. TotalHg (THg) concentrations in blood and hair samples collectedfrom men (n = 67) from an intervention study as well asmuscular tissues of fresh and after heat-treating fish were de-termined using the thermal decomposition amalgamationatomic absorption spectrometry method (TDA-AAS) usingdirect mercury analyzer (DMA-80). The mean of the estimat-ed weekly intake (EWI) was estimated at 0.62 μg/kg bw/weekin the range 0.36–0.96μg/kg bodyweight (bw) /week throughthe consumption of 4 edible marine fish species every day (for10 days) by the participants from the intervention research inLodz, Poland. The Hg intake in the volunteers in our interven-tion study accounted for 38.6% of the provisional tolerableweekly intake (PTWI) (1.6 μg/kg bw, weekly) value. Theaverage Hg concentration in the analyzed fish ranged from0.018 ± 0.006 mg/kg wet weight (Gadus chalcogrammus) to0.105 ± 0.015 mg/kg wet weight (Macruronus magellanicus).The results for the average consumers were within PTWI ofmethylmercury (MeHg). Moreover, the average concentrationof Hg in the selected fish after heat treatment did not exceedthe maximum permitted concentrations for MeHg(MPCs = 0.5 mg/kg wet weight) in food set by the EuropeanCommission Regulation (EC/1881/2006). Hence, the risk ofadverse effects of MeHg for the participants is substantiallylow.
Keywords Mercury . Environmental exposure . Fishconsumption . PTWI . TDA-AAS
Introduction
Food contamination is an issue that still raises attention.Harmful side effects for human health resulting from the in-take of food contaminated with chemical substances havebeen the most frequently observed ones [1]. One ofneurotoxicants that have received most attention with this re-spect is methylmercury (MeHg). The risk assessment forMeHg is based primarily on the data obtained in the past,i.e., on epidemiological studies (large-scale), which relatedto fish consumption among pregnant/breastfeeding mothers/children [2].
Humans are exposed to organic forms of mercurythrough fish and seafood consumption, in particular toppredatory fish such as swordfish, marlin, king mackerel,tile fish, shark, and tuna. Fish may accumulate MeHg di-rectly from water (first Hg in water is converted by sulfate-reducing bacteria into an organic form) or through consum-ing other organisms (biomagnification of the food chain).Total Hg concentration in fish is often used as a measure ofMeHg exposure, assuming that almost 100% Hg concludedin fish and seafood occurs in MeHg [3]. In the gastrointes-tinal tract, MeHg is absorbed to an extent of about 95%. Itslipophilic properties facilitate a smooth transition betweenthe blood-brain barrier (BBB) as well as placental barrier,which impairs metabolism of the nervous system. Mercurycompounds, both organic and inorganic, are extremely tox-ic due to the high affinity with thiol groups of enzymes andproteins. Ingestion of fish contaminated with MeHg canlead to adverse health outcomes (ataxia, paresthesia, dys-arthria, hearing defects, visual disturbances) [4].
* Renata [email protected]
1 Department of Biological and Environmental Monitoring, NoferInstitute of OccupationalMedicine, 8 Teresy St, 91-348 Lodz, Poland
2 Department of Dietetics, Faculty of Human Nutrition and ConsumerSciences, Warsaw University of Life Sciences, Warsaw, Poland
Biol Trace Elem Res (2017) 179:23–31DOI 10.1007/s12011-017-0939-9

Health risks regarding consumption of Hg-contaminatedfish are subject to regulation introduced by many countriesand government agencies. The European Union CommissionRegulation [5] sets maximum levels (MLs) only for total mer-cury content (THg) for fish and seafood from 0.5–1.0 mg/kgwet weight. In view of the above, the Joint Food andAgriculture Organization of the United Nations and WorldHealth Organization FAO/WHO Expert Committee on FoodAdditives (JECFA) has established provisional tolerableweekly intake (PTWI) for MeHg as the amount of contami-nant (e.g., MeHg), which is not cleared rapidly from the bodyand that can be ingested over a lifetime without appreciablerisk. The PTWI value is calculated for a week due to thebioaccumulation of the contaminants (e.g., toxic elements)in humans.
The PTWI for MeHg of 1.6 μg/kg bw/week corresponds to0.112 mg/week for a person weighing 70 kg. The PTWI forTHg is 4 μg/kg bw/week [6, 7]. The (US) National ResearchCouncil (NRC) established an intake limit of 0.7 μg/kg bw/week, the 2.3-fold lower limit than that of JECFA [4].
The estimated Hg intakes are different between theEuropean countries and depend on the amount and the typeof fish consumed. In Poland, the PTWI value based on theEuropean Food Safety Authority (ESFA) [5, 8] is in line withthe JECFA and concerns Hg and MeHg in food.
Assessment of exposure to MeHg can be carried out on thebasis of measurements of Hg in food (fish and fishery product)or based on the results of biological monitoring of Hg concen-trations in blood (Hg-B) and hair (Hg-H). Hg-B, in particularHg-H, are routinely used as biomarkers to assess MeHg ex-posure [9, 10]. Until recently, to determine mercury content inbiological materials, various methods of digestion-utilizingchemical reagents (strong bases or acids) or in combinationwith microwave mineralization were used [11, 12]. The latestmethod is measurement by means of cold vapor atomic ab-sorption spectrometry (CVAAS) [13] or by inductivelycoupled plasma mass spectrophotometer (ICP-MS) aftermicrowave-assisted acid digestion [14]. However, the sim-plest and most effective method of Hg determination, wheresample preparation or other wet chemistry is not required be-fore the analysis, is the direct mercury analyzer DMA-80 [15,16].
In order to estimate the dietary intake of chemical sub-stances, chemical analysis and appropriate estimationmethods are used. We can choose one of the three variantsof contamination levels: the most probable case (estimation ofsingle or short-period intake, for instance over a week), theaverage case (for a long period), and the extremely highcase—mostly 90th percentile of the distribution of concentra-tions or an average of 10% of the results of the highest value.The last is connected with consuming food from one source,mostly from heavily industrialized areas. In this paper, theauthors chose the first option. Estimation of dietary exposure
toMeHg in fish was based on the assumption that almost 90%of the total Hg that is present in fish meat, fish products, fishoffal, and seafood exists in the form of MeHg [8]. In order toassess the risk of adverse health effects among individualswho consume more fish meals than average, it is necessaryto estimate the intake of heavy metals contaminating this food.
The main objective of this study was to estimate whetherthe PTWI value of MeHg for men in Poland is safe. Theprojected intake values of Hg through human consumptionwere calculated (microgram per kilogram body weight (bw)weekly) and compared with the PTWI value as stipulated bythe JECFA/ESFA. Moreover, this paper examined variationsin Hg concentrations in blood and hair as biomarkers ofMeHgintake correlated with fish consumption as well as Hg levels infish commonly eaten by the Polish subpopulation.
Materials and Method
Study Design and Participants
An intervention study, which was undertaken between Juneand August 2015, involved 71 healthy men from the NoferInstitute of Occupational Medicine (NIOM) in Lodz, Poland.The participants were recruited via the information posted inNIOM and were informed about the aim of the study and ofthe examinations to be performed and then signed informedconsent forms. In order to obtain the basic data needed for theresearch, personal survey and the food frequency question-naire (FFQ) were conducted. The survey included questionsabout age, body mass index (BMI), current smoking status,diet (including intake of fish oil or supplements containingshark cartilage), alcohol, and medical history. Four individualswere rejected from the study due to fish oil and omega-3 fattyacid supplementations. The study men were aged 21–64 yearswith a mean age of 41 years. Their BMI was 26.9 ± 4.3 kg/m2
in the range of 17.8–40.2 kg/m2. The 21 % of the subjectswere current smokers. The 34 % had from one to five dentalamalgam fillings. The FFQ showed that the diet of the studyindividuals was similar. The FFQ provided us with detailsconcerning fish consumption among the individuals.According to the FFQ, 9% of the volunteers never (or almostnever) ate fat fish (e.g., salmon, sardines, herring, mackerel,big carp, eel), 50% ate such fish once a month or more seldom,and 40% several times a month. The lean fish (e.g., pollock,cod, perch, hake, carp, small tuna, pangasius, trout) consump-tion presents as follows: never or almost never—4%, once amonth or less—52%, and several times a month—41%. Noneof the study subjects ate supplements containing shark carti-lage or fish oil. Seventy-six percent of the individuals never oralmost never ate game meat, 20% once a month, or moreseldom.
24 Renata et al.
The types of fish were selected based on the market anal-ysis of fish consumption in Poland (Institute of Agriculturaland Food Economics National Research Institute (IAFE-NRI), data from the year 2014). According to the data of theIAFE-NRI, in Poland, in 2013 and 2014, the biggest increasein fish consumption per one resident in the total consumptionof fish concerned salmon and cod, while the Polish consumersmost frequently ate pollock (up to 25% of the chosen fish). Ofeight initially selected fish, four marine fish species of thefamily Gadiformes with higher concentration of Hg were se-lected. Patagonian (Macruronus magellanicus other namePatagonian grenadier), pollock (Gadus chalcogrammus),cod (Gadus morhua), and coalfish (Pollachius virens) camein a form of frozen filet samples (without skin) from the Polishmarket. The fish species were caught in the zone of the PacificOcean in fishing area FAO 87 (M. magellanicus) and FAO 61(G. chalcogrammus) and in the area north-east Atlantic FAO27 (G. morhua, P. virens).
The intervention research consisted in daily fish consump-tion (frying fish dishes) for 10 days (2 weeks with the excep-tion of Saturdays and Sundays). The volunteers ate on threeconsecutive days M. magellanicus (the first week) and G.morhua (the second week) and on two consecutive days G.chalcogrammus (the first week) and P. virens (the secondweek). During the whole study, all the participants consumedapproximately 1.6 kg of fried fish, which was equivalent ofabout 0.16 ± 0.006 kg of fried fish daily. Study participants atefish in a canteen of the NIOM. Each portion of fish (withoutspices and butter) was weighted before and after frying. Thefish was fried (common frying temperatures 170–190 °C) inrapeseed oil from 5 to 10 min. With the purpose of monitoringHg concentrations in blood and hair, the samples were collect-ed within certain intervals. On the first day (named Btest I^) offish consumption, blood and hair samples were collected andthe FFQ questionnaire was carried out. Then, after 1 week(named Btest II^) and at the end of the second week of fishconsumption (named Btest III^), blood samples were collect-ed. Finally, 1 month after the study (named Btest IV^), bloodand hair samples were collected once again. The study wasapproved by the Ethics Committee of the Nofer Institute ofOccupational Medicine in Lodz, Poland.
Specimen Collection
Blood was collected into a Venosafe tube (free from trace andheavy metals) containing Lithium Heparin as anticoagulantand stored at −20 °C until analysis.
For determination of Hg in hair, about 10 mg of hair sam-ples with 1-cm length was collected. The hair was cut withscissors from the occipital area of the head at the hair root andplaced in a polyethylene bag and stored at room temperatureuntil the analysis. Due to the fact that all the participants weremen, the hair samples were only rinsed with acetone and
deionized water (18-MW). The hair washing procedure is rec-ommended by the International Atomic Energy Agency(IAEA) [17]. We applied no additional washing method as-suming that none of the volunteers used hair sprays, mousses,gels, and oils.
Direct Mercury Analyzer DMA-80
Total mercury concentrations of muscular tissues of fish (freshand after heat treating—frying) as well as hair and blood sam-ples collected from the men were determined on sample boatsusing the thermal decomposition amalgamation atomic ab-sorption spectrometry method (TDA-AAS) (direct wercuryanalyzer DMA-80 by Milestone, Spectro-Lab, Poland). Theworking principle of the instrument is based on the thermaldecomposition, catalytic conversion, amalgamation, andatomic absorption spectrophotometry. The absorption intensi-ty wasmeasured at 253.7 nm. The decomposition products arecarried by continuous flow of pure oxygen through a catalystbed, where interferences are eliminated.
The analytical balance Sartorius Quintix model (Q2241CEU) with internal calibration was used to weigh the hairand fish samples using units of milligrams.
The linear calibration curve in the range 0.5–10.0 ng wasplotted as absolute mass of Hg (nanogram) versus absorptionpeak area. The correlation coefficient r = 0.9998 wasachieved. DL and QL were counted as 3 times (DL 3 s for blank)and 6 times (Q
L6 s for blank) of standard deviation for blank and
were 0.0025 ng and 0.0051 ng, respectively.Accuracy of the method was checked by the regular use of
the certified reference material: DOLT-5 (fish liver, NationalResearch Council of Canada, NRC—CNRC) and standardreference material: NIST 2976 (SRM—Mussel Tissue, TraceElements and Methylmercury, Freeze-dried). To check deter-mination of mercury in hair, we used human hair powderreference material: NCS DC 74337 (Certified ReferenceMaterial, China National Analysis Center for Iron and Steel,China).
Seronorm trace element whole blood reference material(RM) as well as blood samples from the international programof the German External Quality Control (G-EQUAS) wasused for the method development and validation. All the re-sults of the analyzed (certified) reference materials had satis-factory recoveries from 95% (DOLT-5) to 107% (NCS DC73347a).
To prepare standard solutions containing mercury we usedan inorganic mercury standard stock solution (1000 μg Hg/mlin 2% HNO3; JT Baker), hydrochloric acid (36.5–38% HCl;JT Baker), and deionized water (resistivity of 18 MΩcm) intheMilli-Q Integral 3 system (Millipore, Bedford,MA, USA).The blood was collected into Venosafe tube containingLithium Heparin (VF-054SHL).
Assessment of Mercury Intake from Fish Meals 25

Statistical Analysis
Statistical analysis was conducted using Statistica 8.0 sofware(StatSoft Inc., Poland). Significance was established at thelevel of p ≤ 0.05. We tested deviation from the Hardy-Weinberg equilibrium using the chi-square test. The Shapiro-Wilk test was used to determine normality of distribution [18,19].
Results
Mercury in Fish
The average concentration of Hg in muscle tissues of fish ispresented in Table 1. The average Hg concentration in theanalyzed fish ranged from 0.018 ± 0.006 mg/kg wet weightand 0.023 ± 0.006 mg/kg wet weight (G. chalcogrammus) to0.105 ± 0.015 mg/kg wet weight and 0.109 ± 0.015 mg/kg wetweight (M. magellanicus), respectively, in raw and fried fishand decreased (both in a raw and fried state) as follows: M.magellanicus > G. morhua > P. virens > G. chalcogrammus.Fried fish contained slightly higher amount of Hg than rawfish with a mean of 0.058 ± 0.033 mg/kg (median = 0.053 and95th percentile = 0.115) and 0.054 ± 0.034 mg/kg (median0.044 and 95th percentile 0.119), respectively. The differencesbetweenHg level in raw and fried fish species were from 0.4%for M. magellanicus, 0.5% for G. chalcogrammus, 1.1% forG. morhua to 1.4% for P. virens.
Moreover, average concentration of Hg in selected fishafter heat treatment did not exceed the maximum permittedconcentrations (MPCs =0.5 mg/kg) in food set by the com-mission regulation [5].
Blood-Hair Relationship
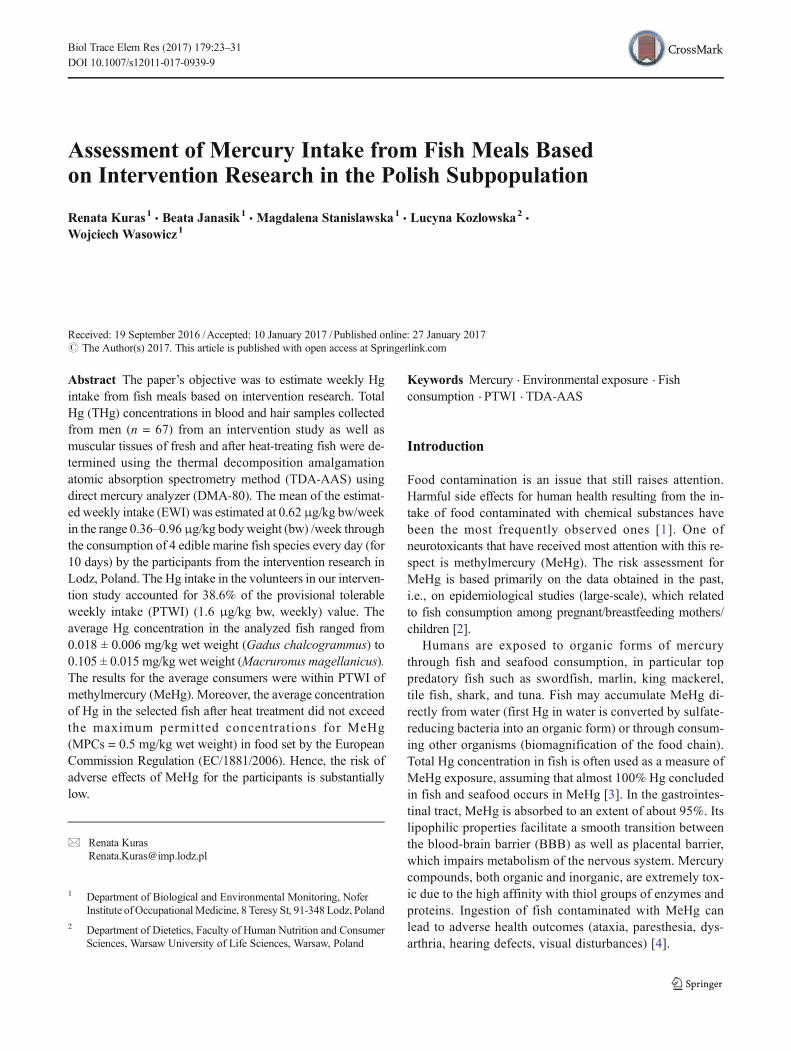
The blood samples were taken before dosing and during thetest, then they were analyzed for mercury concentrations.Mean concentration of Hg in the whole blood (Hg-Bmicrogram per liter) of the volunteers on the first day of fishconsumption was found to be 0.62 ± 0.41 μg/l (NS); after1 week, it was 0.90 ± 0.46 μg/l (p < 0.001); in the end ofthe study, 1.28 ± 0.49 μg/l (p < 0.001), and 1 month afterthe end of the study (test IV), 0.78 ± 0.60 μg/l (p < 0.001).The average increase in the Hg-B concentration was from 0.62to 1.28 μg/l. Distribution of the whole blood total Hg mea-sured in 67 men during the intervention is presented in Fig. 1(the first day and after 10 days of fish consumption).
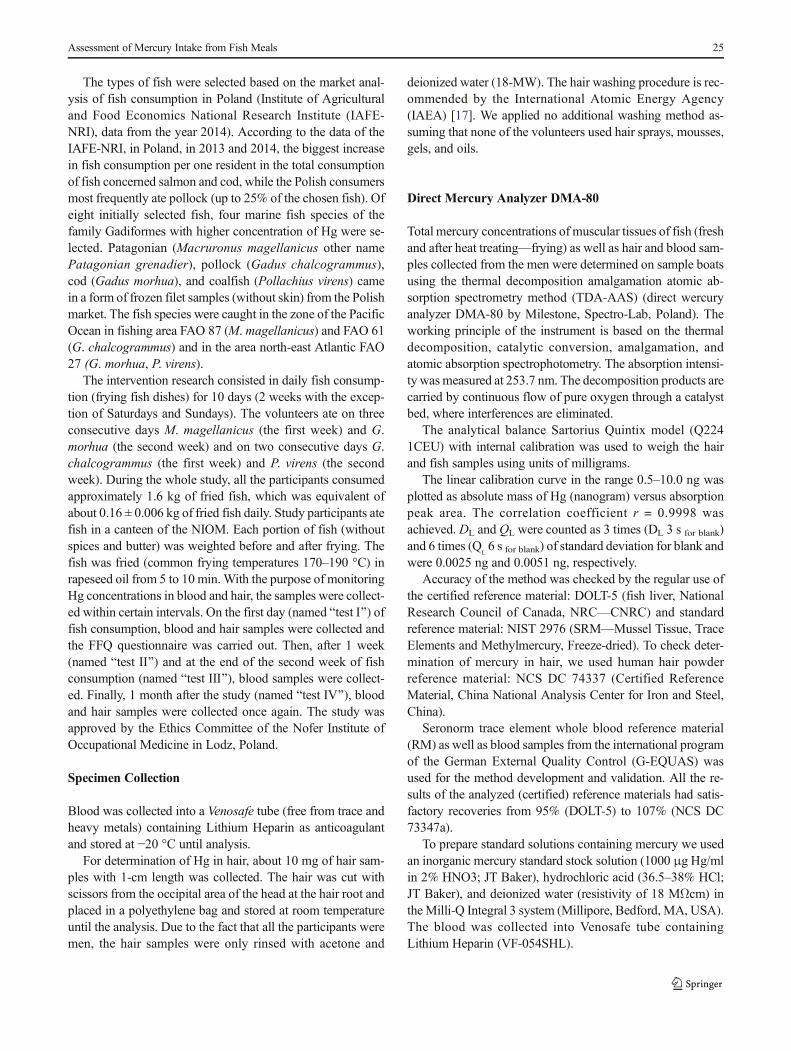
Mean concentration of Hg in hair (Hg-H microgram pergram) of the volunteers on the first day of fish consumptionwas found to be 0.24 ± 0.16 μg/g (NS), and 1 month after theend of the study (test IV), it was 0.29 ± 0.15 μg/g (p < 0.05).Distribution of total Hg in the hair of the study individuals T
able1
Meanandweightexpressed
asarith
meticmean(standarddeviation,SD
),range,median,selected
percentileP9
5(95%
confidence
intervalsCI)concentrations
ofHgin
muscleof
fish
species
(milligram
perkilogram
)andweighto
ffish
(kilo
gram
)(n
=12) Raw
fish
After
heattreatm
ent
Fishspecies
Academicname
MeanHg(SD)
Hgrange
Median
P95
Fishweight(SD
)MeanHg(SD)
Hgrange
Median
P95
Fishweight(SD)
Hoki,Patagonian
Macruronusmagellanicus
0.105(0.015)
0.075–0.130
0.11
0.12
0.175(0.015)
0.109(0.015)
0.052–0.139
0.11
0.13
0.150(0.014)
Pollock
Gadus
chalcogram
mus
0.018(0.006)
0.010–0.028
0.02
0.03
0.166(0.020)
0.023(0.009)
0.009–0.033
0.02
0.03
0.147(0.019)
Cod,saltcod,codfish
Gadus
morhua
0.049(0.006)
0.041–0.060
0.05
0.06
0.189(0.025)
0.060(0.009)
0.049–0.072
0.06
0.07
0.173(0.026)
Coalfish,saith
e,coley,sablefish
Pollachiusvirens
0.041(0.005)
0.027–0.046
0.04
0.05
0.189(0.023)
0.055(0.019)
0.035–0.090
0.05
0.09
0.166(0.021)
26 Renata et al.
during the intervention (the first day and 1 month after the endof the study) is presented in Fig. 2. Hg concentration in thehair depended strictly on the amount of consumed fish and thelevel of their pollution with mercury.
The average Hg hair to Hg blood ratio was 0.23 (medi-an = 0.22; 95th = 0.35; range = 0.069–0.442). Figure 3 pre-sents concentration of mercury in the hair 1 month after theend of the study in relation to blood (Hg-B microgram perliter) collected at the end of the study (on the 10th day of fishconsumption).
Assessment of Mercury Intake from Fish
Taking into account that Hg content was expressed asmicrogram per kilogarm of fried fish samples and
numbers of consumed fish portions, the calculated intakeduring 10 days of fish consumption amounted to 105 μg.The estimated daily intake of Hg in the dietary interven-tion study was 10.5 μg for Hg. The MeHg (microgram perkilogram) intake per kilogram of body weight per weekwas calculated by multiplying the amount of fish ingestedper week (kilogram per week) and Hg concentrations inthe ingested fish (microgram per kilogram) divided bybody weight (kilogram). The estimated weekly intake(EWI) of Hg in our research, which equaled 0.62 μg/kgbw/week (median = 0.62; the range = 0.36–0.96), waswithin the PTWI value.
In the case of a person weighing 70 kg and consuming ameal consisting of 150 g of M. magellanicus and 173 g of G.morhua three times a week, Hg intake was higher for M.
Fig. 1 The distribution of THgconcentration in whole bloodsamples measured in 67 menduring intervention
Fig. 2 The distribution of THgconcentration in hair samplesmeasured in 67 men duringintervention
Assessment of Mercury Intake from Fish Meals 27

magellanicus than for G. morhua (0.70 vs. 0.45 μg/kg bw).Correspondingly, in the case of a meal consisting of 147 g ofG. chalcogrammus and 166 g of P. virens two times a week,Hg intake was higher for P. virens than forG. chalcogrammus(0.26 vs. 0.09 μg/kg bw). In our research project, the estimat-ed weekly intake of Hg amounted to 0.62 μg/kg bw/week(38.6% of the PTWI), which corresponds to 0.04 mg/weekfor a person weighing 70 kg. The Hg intake was evaluatedbased on consumption of 800 g/week. The average mercuryconcentration in raw fish was 0.054 ± 0.034mg/kg and the 90-percentile level of 0.12 mg/kg; thus none of the determinedsamples of fish exceeded the limits established in theEuropean Union for this toxic metal (0.5 mg/kg for Hg).Fried fish contained slightly higher amount of mercury thanraw fish with a mean of Hg 0.058 ± 0.033 mg/kg.
Hg in Relation to Age, Smoking Status, and AmalgamFillings
No significant differences in Hg concentration was foundbetween the smokers and nonsmokers at the beginning ofthe study. Hg-B were found to be 0.48 ± 0.38 μg/l and0.66 ± 0.42 μg/l (NS), respectively. Also, no significantchanges in Hg-B concentration between the people withand without dental amalgam fillings was observed, i.e.,(0.57 ± 0.35 μg/l and 0.63 ± 0.42 μg/l (NS), respectively.There were no statistically significant differences betweenthe smokers and nonsmokers and between the people withand without dental amalgam fillings during the whole du-ration of the intervention study. Moreover, there was nostatistically significant difference between the average ageand Hg-B.
Discussion
In order to evaluate ingestion-related weekly mercury expo-sure in humans, we compared our results with the mentionedPTWI (1.6 μg/kg bw/week) recommended by the JECFA [6].This value was reflected in the individual food exposure.Moreover, the 50th and 95th percentile limits of estimates ofaverage dietary exposure to Hgwere also below the PTWI andamount of 0.62 μg/kg bw/week and 0.80 μg/kg bw/week,respectively. The risk index (percentage of the PTWI)amounts to 38.8% in the range = 22.7–59.8%, and the hazardindex (HI) of fish consumption (the ratio of EWI to PTWI)amounts to 0.39. Despite the results, 32.8% of the volunteersexceeded the intake limit established by the US-NRC (0.7 μg/kg body weight). This intake was estimated taking into ac-count a consumption of 800 g/week.
The tolerable daily intake (TDI) is an estimate of the aver-age quantity of mercury from four selected fish, and itamounts to 10.5 μg Hg. When this TDI value was dividedby the average body weight, the estimated TDI was 0.12 μg/kg of body weight—it was lower than the established by theJECFA value of 0.23 μg/kg of body weight [6]. The value ishigher in the case of groups with high-fish consumption, e.g.,TDI equals 16.3 μg Hg only for M. magellanicus 3 days perweek, which corresponds with 0.19 μg/kg body weight. Theaverage exposure to MeHg in our research project is unlikelyto exceed the recommended value of PTWI; the likelihood ofreaching such a PTWI level increases in the case of consump-tion of fish with higher Hg content. If people ate only M.magellanicus for 1 week (7 days), the EWI would be1.34 μg/kg (84% of PTWI in the range = 49.3–130%).
Differences in Hg levels in fish before and after heat treat-ment (0.054 ± 0.034 mg/kg vs. 0.058 ± 0.033 mg/kg.) may be
Fig. 3 The relationship betweenTHg-H and THg-B in 67 menevaluated by linear regression
28 Renata et al.

a result of dehydration process, and they depend on the spe-cies. Studies of other authors have suggested that differencesconcerning Hg in raw and fried fish may result from fishspecies [20, 21], or even from Hg pre-concentration, forma-tion of complexes involving Hg species, and sulfhydrylgroups present in tissues [22]. Nevertheless, frying selectedfish species in our research project did not reduce Hg contentin fish considerably.
Wojciechowska-Mazurek et al. [23, 24] have shownresults from the framework of monitoring research inPoland where the average mercury contamination in fishwas 0.035 mg/kg and in seafood 0.022 mg/kg and at the90-percentile level, respectively, 0.062 mg/kg and0.040 mg/kg. Mercury intake from fish and fishery prod-ucts for a person of 60 kg was estimated at 3.2 and 5.6%PTWI. Spodniewska et al. [25] have calculated percentageof PTWI taking into consideration the mean concentrationof Hg in fish from lakes of Poland and the data from thePolish Central Statistical Office (2011). The results were3.01% PTWI of Hg and 7.89% PTWI of MeHg.
According to the SCOOP (scientific cooperation on ques-tions relating to food) report task, the estimated intakes ofmercury in Europe varied depending on a country and onthe amount and the type of fish consumed [2, 8, 26]. MeHgintake (assuming that all mercury is methylmercury and that60 kg of body weight is considered for adults) was between<0.1 μg/kg bw/week for the Netherlands, through 0.3 μg/kgbw/week for France, and 1.6μg/kg bw/week for Portugal. Therange of high exposure to THg (the 95th or 97.5th percentileas high percentile of the distribution) was estimated dependingon the country and amount and equaled 0.4 μg/kg bw/weekfor Ireland, 1.8 μg/kg bw/week for Norway, and 2.2 μg/kgbw/week for Greece. The mean weekly consumption of fishand seafood products provided by the mentioned countriesranged from 70 g (the Netherlands), 245 g (France) to 350 g(Portugal); and for high intakes from 497 g (Greece), 525 g(Ireland) to 1925 g (Norway).
For adults (>14 years, n = 1253) in France, the mean con-sumption of fish and fishery food was 285 g/week, whichresults in mean exposure of 0.43 μg MeHg/kg bw/week(median = 0.30 μg/kg bw/week) and at the 97.5thpercentile = 1.78 μg/kg bw/week [27].
The THg intake of the Catalonian population was calculat-ed based on the consumption data of 2158 people andamounted to 0.78 μg/kg bw/week. These results were com-pared with PTWI THg (5 μg/kg of bw) [28]. Among 300students of a middle secondary school in Sesimbra, Portugal[29] with the average number of fish meals consumed by eachperson 4.1 per week, the PTWI value applicable in Portugal(1.6 μg/kg bw) reached the value of 4.5. For the median of theItalian fish and seafood consumers, the EWI for a personweighing 65 kg amounted to 0.88 μg/week; it means 55% ofPTWI (1.6 μg/kg bw) [30].
Tang et al. [31] have estimated exposure to THg andMeHgin secondary school students in Hong Kong (data obtained bymeans of a semi-quantitative food frequency questionnaire)from fish intake at median levels: THg = 0.5–0.6 μg/kg bw/week (10–12% PTWI, average consumer) and 1.6–1.9 μg/kgbw/week (32–38% PTWI, high consumer) and MeHg = 0.4–0.5 μg/kg bw/week (25–31% PTWI, average consumer) and1.2–1.4 μg/kg bw/week (75–88% PTWI, high consumer).Authors compared their results with the PTWI value of THgequals 5 μg/kg bw/week set by the WHO in 1978 [1]. Inanother study from Hong Kong, Chen et al. [32] have shownthat the average fish consumption (including seafood) forwomen in child-bearing age (20–49 years) amounted to450 g/week. The high consumers ate 1500 g of fish and sea-food per week. Their results indicate that the mean exposure toMeHg from the total diet was 0.68μgMeHg/kg bw/week (age20–29 years), 0.78 μg MeHg/kg bw/week (age 30–39 years),and 0.69 μg MeHg/kg bw/week (age 40–49 years). The 95thpercentile was 2.1, 2.5, and 2.4 μg MeHg/kg bw/week, re-spectively. About 11% of those women had a dietary exposureto MeHg, exceeding the PTWI established by the JECFA.
For people from Japan, the world’s top fish and seafoodconsumers, Yaginuma-Sakurai et al. [33] have conducted anintervention study. It took 14 weeks. Twenty-seven volunteers(14 men and 13 women) ate only two species of fish—largepredators with expected high levels of mercury, i.e., bigeyetuna and swordfish. In Japan, the PTWI value, which is safefor adults, amounts to 3.4 μg MeHg/kg bw/week. After theend of that, the observation continued for the next 15 weeks.During the experiment, the hair mercury levels were mea-sured. Japanese people had baseline THg-H level of2.30 ± 1.08 (microgram per gram). Contrary to their volun-teers, our study subjects had baseline THg-H of0.24 ± 0.16 μg/g. The authors compared our results with thePTWI value of THg 3.4 μg/kg bw/week recommended in1973 by the Ministry of Health and Welfare of Japan.
Thapa et al. [34] have calculated MeHg intake (microgramper kilogram bw/week) based on fish consumption (kilogramper week) and Hg concentration in fish from Lake Phewa(Nepal) by different categories of people (n = 170). The min-imum intake ofMeHg (0.05 μg/kg bw/week) was found in thevisitor (others) category, whereas hotel owners had the maxi-mum intake (3.71 μg/kg bw/week). The minimum fish con-sumption for visitors (others) was 0.1 kg/week, and the max-imum fish consumption for hotel owners was 7.5 kg/week.Authors have confirmed that MeHg intake per kilogram bodyweight depended on the species of fish being consumed. Aperson can consume 6.3 kg of tilapia, 3.5 kg ofAfrican catfish,and 2 kg of spiny eel weekly, and still the PTWI established bythe FAO/WHO (1.6 μg/kg body weight) will not be exceeded.However, the same person can consume only 2.7, 1.5, and0.9 kg of the mentioned fish species weekly to not exceedintake limit of 0.7 μg/kg bw/week set by the US-NCR.
Assessment of Mercury Intake from Fish Meals 29
Conclusions
The estimated weekly intake in our research did not exceedthe PTWI value suggested by the JECFA/ESFA for MeHg(1.6 μg/kg bw/week). However, 32.8% of the volunteersexceeded the PTWI values set by the US-NRC (0.7 μg/kgbody weight). Nevertheless, when we took into considerationone species of fish with the highest amount of mercury, i.e.,M.magellanicus, the EWI value exceeded PTWI among 13%individuals. Moreover, the results of average concentrationof Hg in selected fish did not exceed the maximum permittedconcentration (MPCs) for Hg in fish—0.5 mg/kg, establishedby the EU Commission Regulation (EC) [5]. The results indi-cate that the 67 volunteers of the research project would beunlikely to experience major toxicological effects ofmethylmercury.
Acknowledgement The authors thank Justyna Kazmierczak,Malgorzata Kaluza, and Wieslaw Kuszka for their excellence technicalassistance.
Compliance with Ethical Standards
Conflict of Interest The authors declare that they have no conflict ofinterest.
Funding This study was funded by the Ministry of Science and HigherEducation (Grant No. 2013/11/B/NZ7/04934).
Open Access This article is distributed under the terms of the CreativeCommons At t r ibut ion 4 .0 In te rna t ional License (h t tp : / /creativecommons.org/licenses/by/4.0/), which permits unrestricted use,distribution, and reproduction in any medium, provided you give appro-priate credit to the original author(s) and the source, provide a link to theCreative Commons license, and indicate if changes were made.
References
1. WHO (1978) Mercury. In: safety evaluation of certain food addi-tives and contaminants. Twenty-second meeting of the Joint FAO/WHO Expert Committee on Food Additives (JECFA), FoodAdditives Series 13. WHO, Geneva Available on: http://www.inchem.org/documents/jecfa/jecmono/v13je14.htm
2. EFSA (European Food Safety Authority) (2015) Statement on thebenefits of fish/seafood consumption compared to the risks ofmeth-ylmercury in fish/seafood. European Food Safety Authority(EFSA). The EFSA J 13(1):3982 Available on: http://www.efsa.europa.eu/sites/default/files/scientific_output/files/main_documents/3982.pdf
3. EFSA CONTAM Panel (EFSA Panel on Contaminants in the FoodChain) (2012) Scientific opinion on the risk for public health relatedto the presence of mercury and methylmercury in food. EFSA J10(12) :2985 Avai lab le on: h t tp : / /www.efsa .europa .eu/sites/default/files/scientific_output/files/main_documents/2985.pdf
4. NRC (National Research Council) (2000) Committee on the toxi-cological effects of methylmercury. Toxicological effects of meth-ylmercury. National Academy Press, Washington, DC
5. EC (European Commission) (2006) Commission Regulation No1881/2006 of 19 December 2006 setting maximum levels for cer-tain contaminants in foodstuffs (Text with EEA relevance).Available at: http://faolex.fao.org/docs/pdf/eur68134.pdf
6. JECFA (Joint FAO/WHO Expert Committee on Food Additives)(2003) Summary and conclusions of the sixty-first meeting of theJoint FAO/WHO Expert Committee on Food Additives (JECFA),pp. 18–22. Available on http://www.who.int/pcs/jecfa/Summary61.pdf
7. WHO (2004) Safety evaluation of certain food additives and con-taminants WHO Food Additive Series No. 52. Methylmercury(Ad d e n d um ) . Av a i l a b l e o n : h t t p : / /www. i n c h em .org/documents/jecfa/jecmono/v52je23.htm
8. EFSA (European Food Safety Authority) (2004) Opinion of the sci-entific panel on contaminants in the food chain on a request from thecommission related to mercury and methylmercury in food. TheEFSA J. 34, 1–14. Available on: http://www.efsa.europa.eu/sites/default/files/scientific_output/files/main_documents/34.pdf
9. Rojas M, Seijas D, Squiuante G, Pieters MA, Infante S (2007)Mercury in hair as a biomarker of exposure in a coastalVenezuelan population. Investig Clin 48(3):305–315
10. Brodzka R, Trzcinka-Ochocka M (2009) Merkury in hair—an in-dicator of environmental exposure. Polish. Med Pr 60(4):1–12 (inpolish)
11. Farant JP, Brissette D, Moncion L, Bigras L, Chartrand A (1981)Improved cold-vapor atomic absorption technique for themicrodetermination of total and inorganic mercury in biologicalsamples. J Anal Toxicol 5:47–51
12. Harada M, Akagi H, Tsuda T, Kizaki T, Ohno H (1999)Methylmercury level in umbilical cords from patients with congen-ital Minamata disease. Sci Total Environ 234(30):59–62
13. Tahán JE, Granadillo VA, Sánchez JM, Cubillán HS, Romero RA(1993) Mineralization of biological materials prior to determinationof total mercury by cold vapour atomic absorption spectrometry. JAnal At Spectrom 8:1005–1010
14. Afridi HI, Talpur FN, Kazi TG, Brabazon D (2015) Estimation oftoxic elements in the samples of different cigarettes and their effecton the essential elemental status in the biological samples of Irishsmoker rheumatoid arthritis consumers. Environ Monit Assess187(4):157
15. Maggi C, Berducci MT, Bianchi J, Giani M, Campanella L (2009)Methylmercury determination in marine sediment and organismsby direct mercury analyser. Anal Chim Acta 641(1–2):32–36
16. Torres DP, Martins-Teixeira MB, Silva EF, Queiroz HM (2012)Method development for the control determination of mercury inseafood by solid-sampling thermal decomposition amalgamationatomic absorption spectrometry (TDA AAS). Food Addit ContamPart A Chem Anal Control Expo Risk Assess 29(4):625–632
17. Ryabukhin YuS (1978) Activation analysis of hair as an indicator ofcontamination of man by environmental trace element pollutants.International Atomic Energy Agency, Vienna, Austria, IAEA/RL/50, 1–134
18. Shapiro SS, Wilk MB, Chen HJ (1968) A comparative study ofvarious tests for normality. JASA 63:1343–1372
19. Royston JP (1982) An extension of Shapiro and Wilk’s W test fornormality to large samples. J R Stat Soc Series C Appl Stat 31(2):115–124
20. Ouédraogo O,AmyotM (2011) Effects of various cookingmethodsand food components on bioaccessibility of mercury from fish.Environ Research 8:1064–1069
21. Schmidt L, Bizzi CA, Duarte FA, Muller EI, Krupp E, Feldmann J,Flores EMM (2015) Evaluation of Hg species after culinary treat-ments of fish. Food Control 47:413–419
30 Renata et al.
22. Costa Fdo N, Korn MG, Brito GB, Ferlin S, Fostier AH (2016)Preliminary results of mercury levels in raw and cooked seafoodand their public health impact. Food Chem 1:192–837-41
23. Wojciechowska-Mazurek M, Starska K, Brulińska-Ostrowska E,Plewa M, Karłowski K (2008) Monitoring studies of fish, seafoodand their processed products related to the content of elementsnoxious to health. Polish. Bromat Chem Toksykol 41:525–529. 52
24. Wojciechowska-Mazurek M, Starska K, Mania M, Brulińska-Ostrowska E, Biernat U, Karłowski K (2010) Monitoring of con-tamination of foodstuffs with elements noxious to human health,part II. Mineral, waters, soft drinks, fruits, nuts, rice, soybeans, fishand seafood. Polish. Rocz Panstw Zakl Hig 61:27–35
25. Spodniewska A, Barski D (2013) Concentration of some metals inthe muscles of fish from selected lakes of Warmia and Mazuryregion (Poland). ACTAVET BRNO 82:067–071
26. SCOOP report 3.2.11 (2004) Assessment of the dietary exposure toarsenic, cadmium, lead and mercury of the population of the EUMember States. Brussels, Commission of the European Communities:Directorate-General of Health and Consumer Protection. Available at:http://ec.europa.eu/food/food/chemicalsafety/contaminants/scoop_3-2-11_heavy_metals_report_en.pdf
27. Crépet A, Tressou J, Verger P, Leblanc JC (2005) Managementoptions to reduce exposure to methyl mercury through the con-sumption of fish and fishery products by the French population.Regul Toxicol Pharmacol 42(2):179–189
28. Rodellar S, Fontcuberta M, Arqués JF, Calderon J, Ribas Barba L,Serra-Majem LL (2010) Mercury and methylmercury intake
estimation due to seafood products for the Catalonian population(Spain). Food Addit Contam Part A 27(1):29–35
29. Carvalho CM, Matos AI, Mateus ML, Santos AP, Batoreu MC(2008) High-fish consumption and risk prevention: assessment ofexposure tomethylmercury in Portugal. J Toxicol EnvironHealth A71(18):1279–1288
30. Pastorelli AA, Baldini M, Stacchini P, Baldini G, Morelli S,Sagratella E, Zaza S, Ciardullo S (2012) Human exposure to lead,cadmium and mercury through fish and seafood product consump-tion in Italy: a pilot evaluation. Food Addit Contam Part A ChemAnal Control Expo Risk Assess. 29(12):1913–1921
31. Tang AS, Kwong KP, Chung SW, Ho YY, Xiao Y (2009) Dietaryexposure of Hong Kong secondary school students to total mercuryand methylmercury from fish intake. Food Addit Contam Part B2(1):8–14
32. Chen MY, Wong WW, Chung SW, Tran CH, Chan BT, Ho YY,Xiao Y (2014) Quantitative risk-benefit analysis of fish consump-tion for women of child-bearing age in Hong Kong. Food AdditContam Part A 31(1):48–53
33. Yaginuma-Sakurai K, Murata K, Shimada M, Nakai K, KurokawaN, Kameo S, Satoh H (2010) Intervention study on cardiac auto-nomic nervous effects of methylmercury from seafood.Neurotoxicol Teratol 32(2):240–245
34. Thapa DS, Sharma CM, Kang S, Sillanpää M (2014) The risk ofmercury exposure to the people consuming fish from Lake Phewa,Nepal. Int J Environ Res Public Health 11(7):6771–6779
Assessment of Mercury Intake from Fish Meals 31