assessment of mckies stringybark/blackbutt open forest on ... · assessment of mckies...
TRANSCRIPT
www.epa.nsw.gov.au
Environment Protection Authority
Assessment of McKies Stringybark/Blackbutt Open Forest on NSW Crown Forest Estate
Survey, Classification and Mapping Completed for
the NSW Environment Protection Authority

© 2016 State of NSW and Environment Protection Authority
With the exception of photographs, the State of NSW and Environment Protection Authority are pleased to allow this material to be reproduced in whole or in part for educational and non-commercial use, provided the meaning is unchanged and its source, publisher and authorship are acknowledged. Specific permission is required for the reproduction of photographs.
The Environment Protection Authority (EPA) has compiled this report in good faith, exercising all due care and attention. No representation is made about the accuracy, completeness or suitability of the information in this publication for any particular purpose. The EPA shall not be liable for any damage which may occur to any person or organisation taking action or not on the basis of this publication. Readers should seek appropriate advice when applying the information to their specific needs. [where appropriate, e.g. guidelines that are sometimes or regularly updated: This document may be subject to revision without notice and readers should ensure they are using the latest version.]
All content in this publication is owned by the EPA and is protected by Crown Copyright, unless credited otherwise. It is licensed under the Creative Commons Attribution 4.0 International (CC BY 4.0), subject to the exemptions contained in the licence. The legal code for the licence is available at Creative Commons.
The EPA asserts the right to be attributed as author of the original material in the following manner: © State of New South Wales and the Environment Protection Authority 2016.
Published by:
Environment Protection Authority 59 Goulburn Street, Sydney NSW 2000 PO Box A290, Sydney South NSW 1232 Phone: +61 2 9995 5000 (switchboard) Phone: 131 555 (NSW only – environment information and publications requests) Fax: +61 2 9995 5999 TTY users: phone 133 677, then ask for 131 555 Speak and listen users: phone 1300 555 727, then ask for 131 555 Email: [email protected] Website: www.epa.nsw.gov.au
Report pollution and environmental incidents Environment Line: 131 555 (NSW only) or [email protected] See also www.epa.nsw.gov.au
ISBN 978-1-76039-537-7 EPA 2016/0630 October 2016

Contents
1 Overview ........................................................................................................................ 1
2 Introduction .................................................................................................................... 2
2.1 Project rationale ...................................................................................................... 2
2.2 Current determination .............................................................................................. 2
2.3 Initial TEC Reference Panel interpretation ............................................................... 2
2.4 Assessment area .................................................................................................... 3
2.5 Project team ............................................................................................................ 5
3 Methodology ................................................................................................................... 6
3.1 Approach ................................................................................................................. 6
3.2 Existing vegetation data .......................................................................................... 6
3.3 Aerial photograph interpretation .............................................................................. 8
3.4 New survey effort .................................................................................................... 8
3.5 Vegetation classification .......................................................................................... 9
3.6 Existing classifications ........................................................................................... 10
3.7 Indicative distribution map ..................................................................................... 12
3.8 Aerial photograph interpretation ............................................................................ 12
3.9 Operational map .................................................................................................... 13
4 Results ......................................................................................................................... 14
4.1 Vegetation data ..................................................................................................... 14
4.2 Survey effort .......................................................................................................... 16
4.3 Classification analyses .......................................................................................... 16
4.4 Aerial photograph interpretation ............................................................................ 21
4.5 Operational TEC mapping ..................................................................................... 21
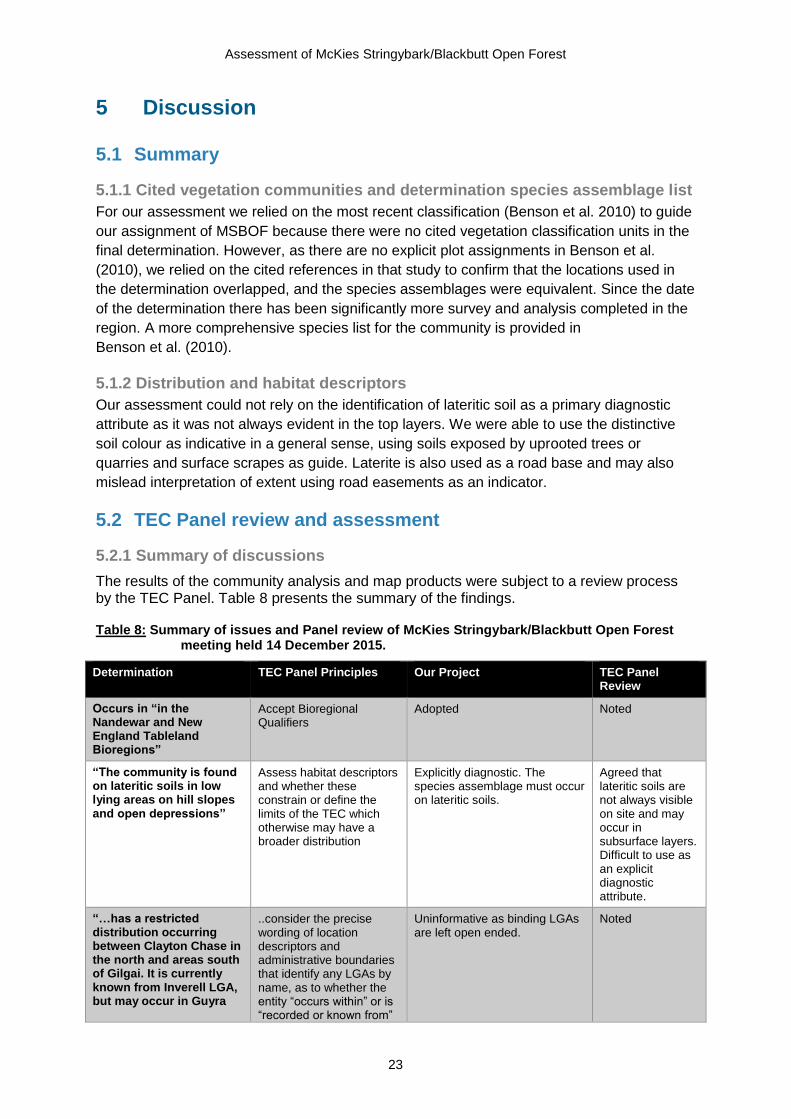
5 Discussion .................................................................................................................... 23
5.1 Summary ............................................................................................................... 23
5.2 TEC Panel review and assessment ....................................................................... 23
5.3 Final state forest-TEC occurrence matrix .............................................................. 24
6 References ................................................................................................................... 27

Assessment of McKies Stringybark/Blackbutt Open Forest
1
1 Overview
This report assesses the distribution of McKies Stringybark/Blackbutt Open Forest, a threatened ecological community (TEC) listed under the NSW Threatened Species Act, 1995, within NSW Crown Forest estate. McKies Stringybark/Blackbutt Open Forest (MSBOF) is associated with lateritic soils found in the Nandewar and New England Bioregions. The characteristic eucalypt species are Eucalyptus mckieana (McKies Stringybark) and Eucalyptus andrewsii (New England Blackbutt). The understorey is characterised by a mix of sclerophyllous shrubs and grasses. We consider whether this assemblage is likely to occur within more than 150,000 hectares of state forests encompassed by the nominated bioregions and the Upper and Lower North East Integrated Forestry Operation Approval (IFOA) regions.
State forests were initially assessed by examining the distribution of Eucalyptus mckieana records extracted from the NSW Bionet and other available systematic plot data characterising regional vegetation patterns. We used the results of a recently completed vegetation mapping in the region (NSW Office of Environment and Heritage 2015) to provide an indicative map of related vegetation communities and considered their distribution within state forests. Three state forests were identified as candidate areas for MSBOF - Mount Topper, New Valley and Torrington State Forests. The latter we excluded because floristic data within the state forest suggested unrelated vegetation communities, and we found no supporting evidence of lateritic substrates within or adjoining the state forest using aerial photograph interpretation or available geology mapping. We considered a fourth, Clive State Forest, as it indicated a strong likelihood of lateritic soil and adjacent E. mckieana records.
Systematic plot data was collected from Mount Topper, New Valley and Clive State Forests in mapped communities related to the TEC, and from within stands of vegetation dominated by the primary eucalypt species described in the final determination. We examined the similarity between these new survey plots and existing plots assigned to a recent classification that is strongly related to the TEC, Plant Community Type (PCT) 523 McKies Stringybark - Western New England Blackbutt - Rough-barked Apple open forest of the New England Tableland Bioregion (Benson et al 2010). On this basis, we identified 4 plots located within Mt Topper State Forest as MSBOF TEC. We mapped the extent using a combination of plot data, aerial photograph interpretation and field traverse using image patterns associated with the dominant eucalypt species and landform. We mapped a total of 201 hectares of MSBOF, although only 101 hectares occurs within the IFOA area. We did not map the TEC within New Valley State Forest although it includes both stands of Eucalyptus mckieana and mapped areas of PCT523 in recent regional mapping. We concluded that these forests were more strongly related to PCT 558 Western New England Blackbutt - stringybark open forest of the Nandewar Bioregion and New England Tableland Bioregion (Benson et al 2010), a community with fewer shared species with the determination assemblage list. In addition there was no evidence of lateritic soils within or proximate to New Valley State Forest which was visible in the field or in aerial photography. We confirmed that MSBOF was present in Clive State Forest but did not map the TEC as it is outside the IFOA assessment area. We identified the likely occurrence of another TEC, White Box-Yellow Box-Blakely’s Red Gum Woodland in the southern parts of Mt Topper State Forest but have deferred mapping of this community until subsequent TEC assessments.

Assessment of McKies Stringybark/Blackbutt Open Forest
2
2 Introduction
2.1 Project rationale
This project was initiated by the NSW Environment Protection Authority (EPA) and Forestry Corporation NSW (FCNSW) as a coordinated approach to resolve long standing issues surrounding the identification, extent and location of priority NSW Threatened Ecological Communities (TECs) that occur on the NSW state forest estate included within eastern Regional Forest Agreements.
2.2 Current determination
McKies Stringybark/Blackbutt Open Forest (MSBOF) in the Nandewar and New England Tableland Bioregions was first gazetted as an Endangered Ecological Community on 9 February 2001. The final determination provides a list of 57 species that characterise the assemblage in Paragraph 1.
Paragraph 3 described the characteristic tree species as Eucalyptus andrewsii, Eucalyptus mckieana and Callitris endlicheri. It also defines the primary habitat as lateritic soils in low lying areas, on hill slopes and open depressions.
Paragraph 4 of the final determination (NSW Scientific Committee 2011) notes that MSBOF has a restricted distribution focused on the Inverell Local Government Area and those adjoining. All are described as included within the Nandewar and New England Bioregions. Paragraph 5 provides example localities in Kings Plain National Park and Severn River Nature Reserve. A vegetation survey report for the former (Hunter 2000) is referenced.
2.3 Initial TEC Reference Panel interpretation
Under the Threatened Species Conservation Act 1995 (TSC Act), TECs are defined by two characteristics: an assemblage of species and a particular location. The TEC Reference Panel (the Panel), agreed that the occurrence of MSBOF is constrained to the IBRA Bioregions stated in the final determination. The Panel agreed that it is a TEC which has been defined primarily from a range of data sources although none other than (Hunter 2000) are referenced. Accordingly, the assemblage of species is interpreted by reference to the characteristic dominant eucalypts and their association with lateritic soils. From the final determination for MSBOF, Table 1 summarises the key determining features of MSBOF and how they have been used in the assessment reported here, based on the interpretation of the features by the Panel.
Table 1: Key features of McKies Stringybark/Blackbutt Open Forest of potential diagnostic value, Numbers in the left-hand column refer to paragraph numbers in the final determination.
Feature Diagnostic value and use for this assessment
3 NSW occurrences fall within Nandewar and New England Tableland bioregions.
Explicitly diagnostic.
3 Occurs on lateritic soils in low lying areas on hill slopes and open depressions
Indicative. The panel noted that the landscape descriptors were not definitive as MSBOF is known from rises and gentle slopes and ‘low lying’ may be a misleading descriptor for elevated tablelands environments.
3 Characteristic species include Eucalyptus andrewsii, E. mckiena and Callitris endlicheri
Indicative, the Panel noted the inclusion of additional eucalypt species in Paragraph 1. The Panel also noted that eucalypts are not diagnostic without reference to edaphic

Assessment of McKies Stringybark/Blackbutt Open Forest
3
factors. Combinations of one or all three stated tree species may be useful indicators.
4 Has a restricted distribution occurring between Clayton Chase in the north and areas south of Gilgai.
Indicative, not used.
1 Characterised by the listed 57 plant species Potentially diagnostic or the sources used to assemble the list are not known and may not characterise the assemblage across its range.
4 Currently known from Inverell LGA but may occur in Guyra and Uralla and possibly other LGAs.
Indicative, not used.
4 Many examples occur on private property although small patches occur in Kings Plain National Park (Hunter 2000) and Severn Nature Reserve.
Potentially diagnostic. The Panel noted that sample data from Hunter (2000) may provide suitable reference sites against which to compare candidate MSBOF located on state forest.
2.4 Assessment area
2.4.1 Location and study area boundaries
Our study area is shown in Map 1. The area includes all of the New England Tablelands Bioregions situated within the boundary of the Upper North East IFOA region. There are no state forests within the IFOA boundary and the Nandewar Bioregion.

Assessment of McKies Stringybark/Blackbutt Open Forest
4
Map 1: Candidate state forests assessed on the New England Tablelands IBRA bioregion.

Assessment of McKies Stringybark/Blackbutt Open Forest
5
2.4.2 State forests subject to assessment
The study area includes Crown Forest estate situated within the Upper North East (UNE) Integrated Forestry Operations Approval (IFOA) region. A total of 37 state forests were included in this assessment (Table 2). State forests excluded from the assessment include those areas defined as Forest Management Zones 5 (Hardwood Plantations) and Zone 6 (Softwood Plantations). Small areas of native forest wholly enclosed or adjoining Forest Management Zone 6 (Softwoods) are also excluded from assessment as they are considered to be outside of the authority of the IFOA.
Table 2: List of assessed state forests relevant to McKies Stringybark-Blackbutt TEC based on inclusion within nominated bioregional and IFOA boundaries. Total areas for each state forest exclude areas zoned FMZ 5 or FMZ 6
State Forest Area (Ha) State Forest Area (Ha)
Ben Halls Gap SF 349.2 Marengo SF 552.7
Bookookoorara SF 861.4 Moogem SF 1,284.1
Boonoo SF 3,953.9 Mount Mitchell SF 1,845.8
Boorook SF 2,528.6 Mount Topper SF 260.5
Brassey SF 745.1 New Valley SF 316.9
Brother SF 5,256.0 Nowendoc SF 2,539.9
Butterleaf SF 1,747.8 Nundle SF 6,554.8
Donnybrook SF 2,892.4 Oakwood SF 3,773.3
Doyles River SF 3,256.3 Paddys Land SF 668.4
Enfield SF 7,911.3 Riamukka SF 10,224.7
Enmore SF 169.4 Spirabo SF 1,716.6
Forest Land SF 7,569.4 Styx River SF 11,290.3
Gibraltar Range SF 1,546.2 Terrible Billy SF 1,089.9
Girard SF 2,412.4 Tomalla SF 639.1
Giro SF 3,843.3 Torrington SF 1,671.8
Glen Elgin SF 683.2 Tuggolo SF 9,152.8
Hyland SF 12.7 Warra SF 886.3
Little Spirabo SF 14.6 Willsons Downfall SF 314.1
Malara SF 560.9 Total 101,096.2
2.5 Project team
This project was completed by the by the Ecology and Classification Team in the OEH Native Vegetation Information Science Branch. It was initiated and funded by the NSW Environment Protection Authority under the oversight of the Director, Forestry Branch.
The project was managed by Daniel Connolly. Ken Turner and Daniel Connolly undertook the floristic analysis of survey plots, and have interpreted the relationships and relatedness between relevant vegetation communities. Owen Maguire undertook API mapping using 3D stereo imagery across Mt Topper State Forest and assessed New Valley and Torrington State Forest for the presence of the TEC. Flora survey plots were completed by Doug Binns, Chris Nadolny and Daniel Connolly.

Assessment of McKies Stringybark/Blackbutt Open Forest
6
3 Methodology
3.1 Approach
Analysis and mapping was guided by the general principles and particular interpretation of the TECs adopted by the TEC Reference Panel, described in Section 2.3. For the purpose of this project, MSBOF is interpreted to be defined primarily by the dominant eucalypt species and a species assemblage associated with lateritic soils. The final determination includes limited information on the source of the species assemblage and it is assumed that the cited studies are the primary reference. A major part of our assessment was to allocate all relevant systematic plot data to more recent vegetation classifications (Benson et al 2010) that were not available at the time of the determination. We used a recent analysis associated with the NSW state-wide vegetation map (OEH 2015), to identify and extract plots referable to the Benson et al classification. We collected new plots in candidate areas for MSBOF on state forest to and used existing plots as a basis for comparison. We mapped the extent of MSBOF using new aerial photograph interpretation and field traverse.
3.2 Existing vegetation data
3.2.1 McKies Stringybark location data
All records of Eucalyptus mckieana were extracted from Bionet (OEH accessed 20/8/2015) and plotted against state forest boundaries using a GIS. Map 2 shows the distribution of the species within our study area.
3.2.2 Systematic VIS plot data
OEH maintains an archive of flora survey data within the Vegetation Information System (VIS) Flora survey module. All plot locations within our study area were extracted and reviewed to identify those that used systematic and comparable survey methods.
3.2.3 Vegetation maps
Vegetation maps that provided coverage across our study area were sourced from the OEH VIS map catalogue. These included coverage of state forests, national parks and reserves and broad regional vegetation maps. The primary dataset amongst these is the recently completed Border-Gwydir (OEH 2015) as part of the NSW State-wide Vegetation Mapping Program. We also reviewed mapping data from adjoining reserves in Single National Park (Clarke, Copeland and Noble 2000) and Tingha Plateau State Conservation Area (Hunter 2011)

Assessment of McKies Stringybark/Blackbutt Open Forest
7
Map 2: Location of Eucalyptus mckieana records and indicative map McKies Stringybark/Blackbutt Open Forest using PCT 523 (OEH 2015).

Assessment of McKies Stringybark/Blackbutt Open Forest
8
3.3 Aerial photograph interpretation
3.3.1 Initial aerial photograph interpretation
State forests identified as possible areas for the presence of MSBOF were initially assessed using aerial photograph interpretation (API). An initial calibration was completed by the interpreter to identify image patterns associated with lateritic soils at localities described in the final determination and elsewhere (Benson et al 2010; Hunter 2000).
An API technician, experienced in interpretation of NSW forest and vegetation types, used recent high resolution (50 centimetre Ground Sample Distance) stereo digital imagery, in a digital 3D geographic information system (GIS) environment, to assess observable patterns in canopy species dominance, understorey characteristics and landform elements. The proximity of distinctive orange-red coloured lateritic soil was a guide to the presence of suitable habitat although was not used as a site based diagnostic. Soil colour is not always visible and is often dependent on some soil surface disturbance such as scrapes, quarries and easements to expose it.
3.3.2 Detailed aerial photograph interpretation
Detailed 3D aerial photograph interpretation was completed on Mt Topper State Forest. The interpreter adopted a viewing scale between 1:1000 and 1:3000 to mark boundaries to infer changes in canopy and/or understorey composition. The interpreter used available substrate maps, floristic data and tracks and trails to assess and review vegetation patterns.
A minimum map polygon size of 0.25 hectares was used to inform the detection and delineation of image patterns. The interpreter derived a digital map of likely vegetation patterns and then completed field traverses to relate field observations to image patterns and adjust boundaries as required.
3.4 New survey effort
3.4.1 Survey stratification and design
New systematic plot surveys aimed to sample all state forests where MSBOF was considered likely to occur. We identified three state forests; Mount Topper, New Valley and Clive as areas that plausibly could include the TEC based on recently completed mapping (OEH 2015), distribution of Eucalyptus mckieana records and classification descriptions for the Nandewar and New England Bioregions (Benson et al 2010). The likelihood of these forests including the TEC is also supported by evidence obtained from surveys of the surrounding reserves (Hunter 2011; Clarke, Copeland & Noble 2000)
We aimed to obtain representative samples of forests associated with identifiable lateritic soils and any stands dominated by or including Eucalyptus mckieana and/or E. andrewsii. We selected a small number of samples from Clive State Forest for reference purposes only. Clive State Forest is not included within the UNE IFOA region, but is nearby and supports lateritic soils. A minimum of five plots was allocated to each of the two state forests and a minimum of two plots was allocated to areas covered by mapping of Plant Community Type 523 McKies Stringybark (OEH 2015).
3.4.2 Survey method
Systematic surveys
Systematic flora survey were conducted in accordance with OEH standard methods (Sivertsen 2009). Preselected sample points were located in the field using a global positioning system (GPS). In the field, plots were assessed for the presence of heavy

Assessment of McKies Stringybark/Blackbutt Open Forest
9
disturbance (such as severe disturbance through clearing or weed infestation) and were either abandoned or moved to an adjoining location in matching vegetation.
Systematic floristic sample plots were fixed to 0.04 hectares in size. The area was marked out using a 20 by 20 metre tape, although in some communities (such as riparian vegetation) a rectangular configuration of the plot (e.g. 10 by 40 metres) was required. Within each sample plot all vascular plant species were recorded and assigned estimates for foliage cover and number of individuals. Raw scores were later converted to a modified 1-8 Braun-Blanquet scale (Poore, 1955) as shown in Table 3.
Table 3: Braun-Blanquet-to-cover abundance conversion table.
Modified Braun-Blanquet 6 point scale
Raw Cover Score Raw Abundance Score
1 (<5% and few) <5% ≤3
2(<5% and many) <5% ≥3
3 (5-25%) ≥5 and <25% any
4 (25%-50%) ≥25% and <50% any
5 (50%-75%) ≥50% and <75% any
6 (75%-100%) ≥75% any
Species that could not be identified in the field were recorded to the nearest possible family or genus and collected for later identification. Species that could not be identified confidently were lodged with the NSW Herbarium for identification. At each plot estimates were made of the height range, projected foliage cover and dominant species of each vegetation stratum recognisable at the plot. Measurements were taken of slope and aspect. Notes on topographic position, geology, soil type and depth were also compiled. Evidence of recent fire, erosion, clearing, grazing, weed invasion or soil disturbance was recorded. The location of the plot was determined using a hand held GPS or a topographic map where a reliable reading could not be taken. Digital photographs were also taken at each plot.
Non-systematic surveys
Non-systematic survey techniques were employed by the survey team to record observations of flora species present in likely habitat. Survey observations were made against a standard proforma which recorded a minimum of three dominant species in each of the upper, middle and ground stratum.
These partial floristic plots were identified as rapid field plots. No fixed assessment area was used and the number of species recorded was subject to time and visibility constraints. Observations were supported by a georeferenced position and a digital photograph. In addition brief descriptions of vegetation composition and pattern were also made intermittently by field crews to identify vegetation patterns of interest. These were retained as free text descriptors attached to a georeferenced point.
3.5 Vegetation classification
3.5.1 Existing vegetation data
A recent review of OEH systematic flora survey data holdings in eastern NSW (OEH in prep) was available for the project. The review identified a subset of data suitable for use in quantitative vegetation classification on the basis that it met a set of predefined criteria, namely that the plot:

Assessment of McKies Stringybark/Blackbutt Open Forest
10
provided location co-ordinates with a stated precision of less than 100 metres in
accuracy
covered a fixed survey search area of approximately 0.04 hectares
supported an inventory of all vascular plants
provided a documented method that assigns a quantitative and/or semi quantitative
measure of the cover and abundance of each species recorded
Data preparation and taxonomic review
All species in the pooled dataset was standardised for analysis using a review completed for all flora survey data compiled for the Eastern NSW Classification (OEH in prep). Nomenclature was standardised to follow Harden (1990, 2002) and updated to reflect currently accepted revisions using the PlantNET Website (Royal Botanic Gardens 2002). The data was amended to:
exclude exotic species
exclude species identified to genus level only
improve consistency in assignment of subspecies or varieties to species.
Cover and abundance score data extracted from the pooled data set was standardised to a six class modified Braun-Blanquet score. The transformation algorithm available within the OEH VIS Flora Survey data analysis module was applied to the analysis dataset.
3.6 Existing classifications
The final determination for MSBOF does not make explicit any reference to individual vegetation communities included in the TEC. The Panel inferred that vegetation survey and classification data completed in Kings Plain and Severn reserves is related to MSBOF as they both sample reserves which are cited in the determination (Hunter 2000). The determination preceded extensive vegetation classification work across the region by Benson et al (2010), however, these same locations are cited in that study as type locations for unit 523 McKies Stringybark - Western New England Blackbutt - Rough-barked Apple open forest of the New England Tableland Bioregion and identify it as equivalent to MSBOF. As the classification work from Benson et al (2010) is now adopted within the OEH corporate vegetation classifications known as Plant Community Types (PCTs), we used this classification as the basis for comparison for any new plots collected for this project, (Table 4).
Table 4: List of Plant Community Types (PCT) allocated to our analysis dataset plots
Seed No
PCT Number
PCT Name Number of Plots
1 504 Black Cypress Pine - Rough-barked Apple - stringybark shrubby open forest of the Nandewar Bioregion and western New England Tableland Bioregion
28
2 508 Blakelys Red Gum - Stringybark - Rough-barked Apple open forest of the Nandewar Bioregion and western New England Tableland Bioregion
20
3 509 Blakelys Red Gum - White Cypress Pine - Rough-barked Apple grassy open forest of drainage lines of the northern Nandewar Bioregion and New England Tableland Bioregion
14
4 510 Blakelys Red Gum - Yellow Box grassy woodland of the New England Tableland Bioregion
16

Assessment of McKies Stringybark/Blackbutt Open Forest
11
Seed No
PCT Number
PCT Name Number of Plots
5 512 Caleys Ironbark - Orange Gum - Black Cypress Pine shrubby open forest on acid volcanics of the northern New England Tableland Bioregion
7
6 519 Heathy shrubland on granitic substrates in the Howell area in the New England Tableland Bioregion
15
7 523 McKies Stringybark - Western New England Blackbutt - Rough-barked Apple open forest of the New England Tableland Bioregion
45
8 537 Orange Gum - Caleys Ironbark - Red Stringybark open forest of the southern Nandewar Bioregion and New England Tableland Bioregion
6
9 538 Rough-barked Apple - Blakelys Red Gum open forest of the Nandewar Bioregion and western New England Tableland Bioregion
10
10 542 Stringybark - Rough-barked Apple - cypress pine shrubby open forest of the eastern Nandewar Bioregion and western New England Tableland Bioregion
34
11 544 Rough-barked Apple - White Cypress Pine - Blakelys Red Gum riparian open forest / woodland of the Nandewar Bioregion and New England Tableland Bioregion
9
12 551 Orange Gum - Caleys Ironbark - stringybark - Tenterfield Woollybutt shrubby open forest of the Horton River area of the Nandewar Bioregion
29
13 558 Western New England Blackbutt - stringybark open forest of the Nandewar Bioregion and New England Tableland Bioregion
10
14 578 Tumbledown Red Gum - Black Cypress Pine - Caleys Ironbark shrubby open forest of the Nandewar Bioregion and western New England Tableland Bioregion
20
15 590 White Box grassy woodland on the Inverell basalts mainly in the Nandewar Bioregion
15
Grand Total 278
3.6.1 Clustering
We conducted an analysis on a subset of 292 plots, which comprised all systematic full-floristic plots in the VIS-FS database that were located within a 50x50 kilometre geographic selection area roughly centred on Tingha. This area includes Clive, New Valley and Mount Topper State Forests, but excludes any sites that had been allocated by recent regional vegetation mapping work (M.Somerville, pers.comm.) to PCTs represented in the selection area by less than five plots, and PCTs clearly unrelated to the MSBOF EEC.
The analysis subset included plots containing or dominated by McKies Stringybark located in all 3 state forests, including 14 new plots surveyed for this project. The other 278 plots had a PCT allocation assigned by recent mapping work, including 45 plots allocated to PCT 523 “McKies Stringybark - Western New England Blackbutt - Rough-barked Apple open forest of the New England Tableland Bioregion” (which has a high degree of floristic overlap with the MSBOF final determination description), and 20 plots allocated to the closely related PCT 508 “Blakelys Red Gum - Stringybark - Rough-barked Apple open forest of the Nandewar Bioregion and western New England Tableland Bioregion”.
Analysis was run using the non-hierarchical clustering routine ALOC within the PATN program (Belbin 1994). Existing allocations of plots to PCTs were used to define 15 ‘seeds’ (group centroids) using a group affinity vector. Relationships between unassigned new plots

Assessment of McKies Stringybark/Blackbutt Open Forest
12
and these group centroids were then examined by running ALOC with the Bray and Curtis association measure, nominating zero iterations (skipping the re-allocation phase), and outputting a table of association values between each plot and the five closest group centroids. Note that these association measures are dissimilarity values of between zero and one, with smaller values indicating increased similarity or ‘closeness’ between a plot and a group centroid. This process provided an assessment of the membership of all state forest plots to PCTs which could be related to the plant assemblage listed in the final determination.
3.6.2 Allocation of standard floristic plots to MSBOF and other communities
The community identified as PCT 523 “McKies Stringybark - Western New England Blackbutt - Rough-barked Apple open forest of the New England Tableland Bioregion” has a floristic composition most similar to the characteristic species assemblage listed in the final determination for MSBOF. We assessed plots as being MSBOF if their association measure with PCT 523 centroid was 0.7 or less, and they matched the qualifying descriptions for that PCT and MSBOF. We chose this threshold on the basis that sites assigned at or below this level would retain fidelity to the original site group than a more relaxed threshold. Alternate thresholds could be applied however we believe that the value chosen gives confidence that plots are strongly related to our groups of interest but are not so conservative as to exclude species assemblages that represent subtle variations based on disturbance, locality or observer.
Plots with an association with PCT 523 centroid of <0.7 but similar association measures with one or more other group centroids were assessed as potentially MSBOF if they shared the dominant eucalypt species defined in the determination; we considered that they could be treated as MSBOF for management purposes, using a precautionary approach to assessment.
3.7 Indicative distribution map
We adopted map unit PCT523 McKies Stringybark - Western New England Blackbutt - Rough-barked Apple open forest of the New England Tableland Bioregion (OEH 2015) as our indicative map of MSBOF across our study area. We considered that the map was constructed from all currently available floristic data using equivalent modelling methods adopted in our project to derive indicative distribution maps for other TECs. The distribution of PCT523 is shown in Map 2.
3.8 Aerial photograph interpretation
We aimed to map the patterns in canopy composition and understorey across Mount Topper state forest outside of softwood forest management zones. An API technician, experienced in interpretation of NSW forest and vegetation types, used recent high resolution (50 centimetre GSD) stereo digital imagery in a digital 3D GIS environment. Interpreters adopted a viewing scale between 1:1000 and 1:3000 to mark boundaries to infer changes in canopy and/or understorey composition. A minimum map polygon size of 0.25 hectares was used to inform the detection and delineation of image patterns. Interpreters were supplied with a range of environmental variables to accompany interpretation including existing vegetation community maps, substrate maps, roads and trails and tenure boundaries. All relevant georeferenced floristic data held in OEH databases was extracted and supplied to aid interpretation. Floristic data was supplemented by interpreter field traverse using an iterative process to boost interpretation confidence by relating field observations to image patterns. A set of classes were assigned to describe recurring patterns of species composition. Three categories of understorey were adopted and described as either grass dominant, shrub/grass or dry shrubs.

Assessment of McKies Stringybark/Blackbutt Open Forest
13
3.9 Operational map
We used the API line work in combination with floristic plot data (both full and partial floristic plots) and field notes, to develop an operational map using the following procedure:
For each polygon code (as defined by unique combinations of canopy composition and understorey characteristics), we assessed the extent of plot sampling and the proportion of plots which we had assigned to MSBOF. For codes which had been sampled but for which all plots had been assigned to communities other than MSBOF, we excluded all polygons with that code from the MSBOF map if the API description was consistent with the API type not being MSBOF
For unsampled polygon codes, we considered the API description in relation to our interpretation of the determination, sampling in other codes with similar canopy composition and location of individual polygons in relation to landscape features and composition of adjacent polygons, to make a subjective judgement whether polygons were likely to belong to MSBOF. We did this assessment by individual polygons for those with matching canopy composition.
We believe that this procedure provides a precautionary operational map of MSBOF.

Assessment of McKies Stringybark/Blackbutt Open Forest
14
4 Results
4.1 Vegetation data
4.1.1 McKies Stringybark locality data
We identified 115 records of Eucalyptus mckieana within our study area. A further 48 records were identified from adjoining areas outside the UNE IFOA boundary but inside the nominated bioregions. Three state forests; New Valley, Mt Topper and Torrington were proximate to known locations of the species, although no records were located within IFOA portions of the identified state forests.
4.1.2 Vegetation mapping data
The following PCTs have been mapped by OEH (2015) in each of our assessable forests, (Table 5).
Table 5. PCTs mapped in assessable forests
State Forest PCT Number
PCT Name Hectares
Clive 504 Black Cypress Pine - Rough-barked Apple - stringybark shrubby open forest of the Nandewar Bioregion and western New England Tableland Bioregion
2.1
523 McKies Stringybark - Western New England Blackbutt - Rough-barked Apple open forest of the New England Tableland Bioregion
753.1
538 Rough-barked Apple - Blakely's Red Gum open forest of the Nandewar Bioregion and western New England Tableland Bioregion
7.9
Total 763.1
Mt Topper
504 Black Cypress Pine - Rough-barked Apple - stringybark shrubby open forest of the Nandewar Bioregion and western New England Tableland Bioregion
72.0
519 Heathy shrubland on granitic substrates in the Howell area in the New England Tableland Bioregion
0.7
523 McKies Stringybark - Western New England Blackbutt - Rough-barked Apple open forest of the New England Tableland Bioregion
595.2
Total 667.9
New Valley
523 McKies Stringybark - Western New England Blackbutt - Rough-barked Apple open forest of the New England Tableland Bioregion
18.8
538 Rough-barked Apple - Blakely's Red Gum open forest of the Nandewar Bioregion and western New England Tableland Bioregion
149.1

Assessment of McKies Stringybark/Blackbutt Open Forest
15
State Forest PCT Number
PCT Name Hectares
558 Western New England Blackbutt - stringybark open forest of the Nandewar Bioregion and New England Tableland Bioregion
250.9
574 Tea-tree riparian shrubland / heathland wetland on drainage areas of Nandewar Bioregion and New England Tableland Bioregion
17.0
582 Sedgeland fens wetland of impeded drainage of the Nandewar Bioregion and New England Tableland Bioregion
5.0
607 Montane bogs on the western fall of the New England Tableland Bioregion
3.5
632 Narrow-leaved Black Peppermint open forest mainly on acid volcanics in the western New England Tableland Bioregion
5.6
Total 449.7
Torrington
514 Black Cypress Pine - Rough-barked Apple - Round-leaved Gum shrubby riparian forest in the Torrington area of the New England Tableland Bioregion
422.2
535 Orange Gum - Black Cypress Pine heathy woodland on outcropping granite in the Torrington area of the New England Tableland Bioregion
4.7
538 Rough-barked Apple - Blakely's Red Gum open forest of the Nandewar Bioregion and western New England Tableland Bioregion
41.1
545 Round-leaved Gum - Broad-leaved Stringybark grassy forest on metasediments in the Torrington area of the New England Tableland Bioregion
269.6
557 Western New England Blackbutt - Round-leaved Gum - Stringybark shrubby open forest in the Torrington area of the New England Tableland Bioregion
720.3
558 Western New England Blackbutt - stringybark open forest of the Nandewar Bioregion and New England Tableland Bioregion
5.6
585 Western New England Blackbutt - Orange Gum - Black Cypress Pine shrubby woodland in the Torrington area of the New England Tableland Bioregion
671.4
609 Black Cypress Pine - Caley's Ironbark - Tumbledown Red Gum shrubby woodland on Mole Granite of the Torrington area of the New England Tableland Bioregion
0.1
Total 2134.9

Assessment of McKies Stringybark/Blackbutt Open Forest
16
4.2 Survey effort
We completed 14 new systematic plots across our target state forests including five in New Valley, seven in Mount Topper and two in Clive State Forest. We collected an additional 55 rapid field observations of canopy species to support API mapping in Mt Topper State Forest. These are shown in Map 4.
4.3 Classification analyses
4.3.1 Relationships to existing classifications and TEC assignment
Table 6 summarises the results from our analysis. We assigned six plots as PCT523 (Grp7, equivalent to MSBOF, based on membership thresholds less than 0.7). Four were located within Mt Topper State Forest and two were just outside the IFOA area in the adjoining Clive State Forest. Several plots in both forests also shared strong association with PCT508 (grp 2), a forest dominated by Eucalyptus blakelyii with an associated grassy understorey. This PCT is referable to another TEC; White Box-Yellow Box-Blakely’s Red Gum Woodland. It is most extensive in the southern parts of Mt Topper State Forest. Several sites suggest transitional vegetation between PCT 523 and 504 and we assigned to either based on canopy species dominance.
We did not assign any plots to PCT523 in New Valley State Forest. Strongest memberships were obtained with PCT558 and PCT504 both dry shrubby forests associated granitic substrates. We excluded sample IND05G4C in Mt Topper State Forest from any PCT as it was transitional across five groups. We did not assign it to MSBOF because it was located on a rocky granitic rise occupying a transition between a grassy Eucalyptus blakelyii forest (PCT502/Grp2) and Tumbledown Red Gum - Black Cypress Pine - Caleys Ironbark shrubby open forest (PC578/grp14).
Table 6: Summary of analysis results showing five most strongly related PCTs (G1-5) against each plot sampled by our project. For example G1 identifies the most similar PCT number and G5 less similar. The association measure (distance from group centroid) is shown in adjoining column and is a number between zero and one where the lower the number the stronger the association to the listed PCT.
State Forest Site No G1 G1dist G2 G2dist G3 G3dist G4 G4dist G5 G5dist
Clive CliveSF001 523 0.68 508 0.694 509 0.709 538 0.713 578 0.735
Clive CliveSF002 538 0.674 523 0.679 508 0.695 509 0.702 558 0.712
Mt Topper IND01G7C 508 0.68 523 0.694 538 0.708 510 0.714 542 0.719
Mt Topper IND02G7C 523 0.67 558 0.688 538 0.692 508 0.697 509 0.718
Mt Topper IND03G7M 508 0.687 523 0.705 538 0.719 510 0.752 542 0.753
Mt Topper IND04G7L 509 0.631 508 0.735 538 0.736 544 0.763 510 0.777
Mt Topper IND05G4C 508 0.649 523 0.658 578 0.68 509 0.689 538 0.694
Mt Topper MtTopSF001 523 0.688 538 0.719 508 0.729 510 0.75 544 0.75
New Valley NVSF001 509 0.728 558 0.743 523 0.824 551 0.828 542 0.862
New Valley NVSF002 558 0.781 510 0.79 509 0.801 538 0.803 508 0.823
New Valley NVSF003 558 0.717 523 0.73 538 0.743 510 0.77 508 0.777
New Valley NVSF004 558 0.659 509 0.728 523 0.773 508 0.802 512 0.811
New Valley NVSF005 558 0.669 509 0.707 523 0.749 538 0.765 508 0.78
Mt Topper TNG01G7U 509 0.62 558 0.644 523 0.731 538 0.745 508 0.77

Assessment of McKies Stringybark/Blackbutt Open Forest
17
Photo 1. Eucalyptus mckieana and E.andrewsii dominate this stand of MSBOF in Mt Topper State Forest at our reference site IND02G7C. The distinctive red coloured lateritic soils were exposed adjacent to this site by an uprooted tree. We assigned this site to the TEC with high confidence because it was closely related to PCT523 and supported the characteristic eucalypts of the TEC and lateritic soils.

Assessment of McKies Stringybark/Blackbutt Open Forest
18
Photo 2: We found Eucalyptus mckieana and Angophora floribunda common near the northern boundary of Mount Topper State Forest (IND01G7C). We assigned these forests to MSBOF TEC although here the forest supports a more abundant and diverse cover of grasses. Our analysis suggested that the site is likely to be transitional with another PCT 508, a classification unit related to the White Box-Red Gum Yellow-Box TEC.
Photo 3. Near the southern boundary of Mt Topper we sampled a grassy woodland dominated by Eucalyptus blakelyii (IND04G7L) which is strongly related to PCT509 and likely to be included within the White Box-Red Gum-Yellow-Box TEC.

Assessment of McKies Stringybark/Blackbutt Open Forest
19
Map 3: Distribution of new and existing full-floristic survey plots.

Assessment of McKies Stringybark/Blackbutt Open Forest
20
Map 4: Distribution of full-floristic plots and rapid field observations points in Mount Topper and New Valley State Forests

Assessment of McKies Stringybark/Blackbutt Open Forest
21
4.4 Aerial photograph interpretation
A total of 374 hectares of forest was mapped using aerial photograph interpretation to identify structural and floristic attributes of the vegetation cover. Eleven mapped classes (Table 7) describing patterns in eucalypt cover and understorey characteristics were identified and were allocated either a grassy, shrub grass or shrubby understorey attribute.
Table 7: API map class description
Overstorey Composition Ha
Callitris endlicheri, Angophora floribunda 5.9
Callitris endlicheri 12.8
Cleared 7.6
Eucalyptus andrewsii +/- E.mckieana 41.2
Eucalyptus andrewsii+/-Angophora floribunda, E.macrohyncha, , E.subtilor 68.8
Eucalyptus blakelyii, Angophora floribunda +/-E.macrohyncha 117.4
Eucalyptus blakelyii, Angophora floribunda, Eucalyptus mckieana 2.8
Eucalyptus caleyi, E.prava, C.endlicheri 5.3
Eucalyptus mckieana, E.andreswsii, A.floribunda 100.3
Eucalyptus nova-anglica+/-E.blakelyii 1.2
Eucalyptus prava, +/-E.macrohyncha, , E.subtilor 10.8
Grand Total 374
4.5 Operational TEC mapping
After integrating information from API results (including checking against existing maps), plot data and environmental features, using the method described in Section 3.9 we mapped 201.5 hectares of McKies Stringybark/Blackbutt Open Forest in Mt Topper State Forest (Map 5). However only 50% of this area (101 hectares) occurs within that part of the forest within the UNE IFOA boundary.

Assessment of McKies Stringybark/Blackbutt Open Forest
22
Map 5: Mapped areas of McKies Stringybark/Blackbutt Open Forest in Mt Topper State Forest
Assessment of McKies Stringybark/Blackbutt Open Forest
23
5 Discussion
5.1 Summary
5.1.1 Cited vegetation communities and determination species assemblage list
For our assessment we relied on the most recent classification (Benson et al. 2010) to guide
our assignment of MSBOF because there were no cited vegetation classification units in the
final determination. However, as there are no explicit plot assignments in Benson et al.
(2010), we relied on the cited references in that study to confirm that the locations used in
the determination overlapped, and the species assemblages were equivalent. Since the date
of the determination there has been significantly more survey and analysis completed in the
region. A more comprehensive species list for the community is provided in
Benson et al. (2010).
5.1.2 Distribution and habitat descriptors
Our assessment could not rely on the identification of lateritic soil as a primary diagnostic
attribute as it was not always evident in the top layers. We were able to use the distinctive
soil colour as indicative in a general sense, using soils exposed by uprooted trees or
quarries and surface scrapes as guide. Laterite is also used as a road base and may also
mislead interpretation of extent using road easements as an indicator.
5.2 TEC Panel review and assessment
5.2.1 Summary of discussions
The results of the community analysis and map products were subject to a review process by the TEC Panel. Table 8 presents the summary of the findings.
Table 8: Summary of issues and Panel review of McKies Stringybark/Blackbutt Open Forest meeting held 14 December 2015.
Determination TEC Panel Principles Our Project TEC Panel Review
Occurs in “in the Nandewar and New England Tableland Bioregions”
Accept Bioregional Qualifiers
Adopted Noted
“The community is found on lateritic soils in low lying areas on hill slopes and open depressions”
Assess habitat descriptors and whether these constrain or define the limits of the TEC which otherwise may have a broader distribution
Explicitly diagnostic. The species assemblage must occur on lateritic soils.
Agreed that lateritic soils are not always visible on site and may occur in subsurface layers. Difficult to use as an explicit diagnostic attribute.
“…has a restricted distribution occurring between Clayton Chase in the north and areas south of Gilgai. It is currently known from Inverell LGA, but may occur in Guyra
..consider the precise wording of location descriptors and administrative boundaries that identify any LGAs by name, as to whether the entity “occurs within” or is “recorded or known from”
Uninformative as binding LGAs are left open ended.
Noted
Assessment of McKies Stringybark/Blackbutt Open Forest
24
Determination TEC Panel Principles Our Project TEC Panel Review
and Uralla and possibly other LGAs”
or has qualifiers that indicate it “may be known from elsewhere in bioregion”;
“Characteristic tree species include Eucalyptus andrewsii, E. mckieana and Callitris endlicheri”
..assess statements regarding the characteristics of the floristic composition;
We were guided by the presence of the characteristic tree species described in the determination only where we could demonstrate relationships with the overall species assemblage in the determination. It is uncertain as to whether all the species stated here need to always be present. The species assemblage list includes other eucalypt species “Angophora floribunda, Eucalyptus banksii, E.crebra, E. melliodora, E. stannicola”.
Agreed
Characterised by the list of plant species
…be guided by the species lists presented in the determination
57 plant species present.
“Small patches occur in Kings Plains National Park (J.T. Hunter 2000,) and on the boundary of Severn River Nature Reserve.
Assess references to existing vegetation classification sources in the determination.
Implicit that the McKies Stringybark map unit in the stated reference is the TEC. Other location data associated withSevern Nature Reserve is ambiguous.
Noted that the PCT classifications based on Benson et al. (2010) are the most relevant and recent classification units to the TEC.
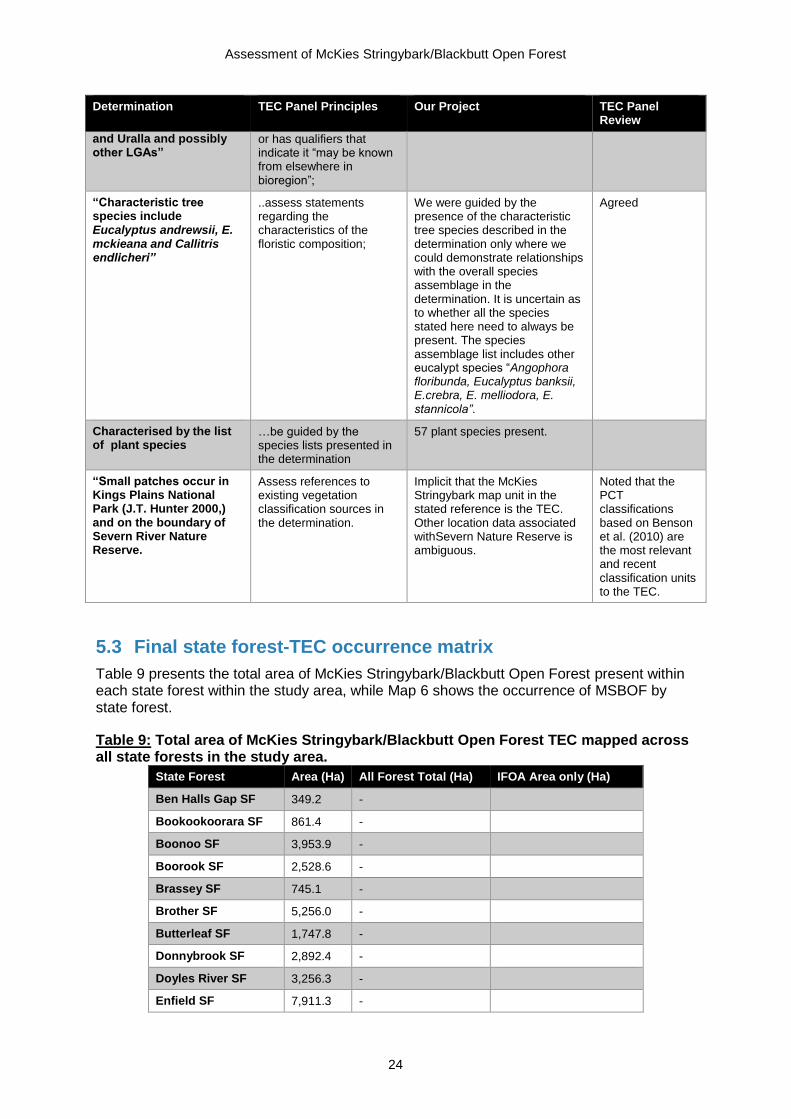
5.3 Final state forest-TEC occurrence matrix
Table 9 presents the total area of McKies Stringybark/Blackbutt Open Forest present within each state forest within the study area, while Map 6 shows the occurrence of MSBOF by state forest.
Table 9: Total area of McKies Stringybark/Blackbutt Open Forest TEC mapped across all state forests in the study area.
State Forest Area (Ha) All Forest Total (Ha) IFOA Area only (Ha)
Ben Halls Gap SF 349.2 -
Bookookoorara SF 861.4 -
Boonoo SF 3,953.9 -
Boorook SF 2,528.6 -
Brassey SF 745.1 -
Brother SF 5,256.0 -
Butterleaf SF 1,747.8 -
Donnybrook SF 2,892.4 -
Doyles River SF 3,256.3 -
Enfield SF 7,911.3 -

Assessment of McKies Stringybark/Blackbutt Open Forest
25
State Forest Area (Ha) All Forest Total (Ha) IFOA Area only (Ha)
Enmore SF 169.4 -
Forest Land SF 7,569.4 -
Gibraltar Range SF 1,546.2 -
Girard SF 2,412.4 -
Giro SF 3,843.3 -
Glen Elgin SF 683.2 -
Hyland SF 12.7 -
Little Spirabo SF 14.6 -
Malara SF 560.9 -
Marengo SF 552.7 -
Moogem SF 1,284.1 -
Mount Mitchell SF 1,845.8 -
Mount Topper SF 260.5 201.5 101
New Valley SF 316.9 -
Nowendoc SF 2,539.9 -
Nundle SF 6,554.8 -
Oakwood SF 3,773.3 -
Paddys Land SF 668.4 -
Riamukka SF 10,224.7 -
Spirabo SF 1,716.6 -
Styx River SF 11,290.3 -
Terrible Billy SF 1,089.9 -
Tomalla SF 639.1 -
Torrington SF 1,671.8 -
Tuggolo SF 9,152.8 -
Warra SF 886.3 -
Willsons Downfall SF 314.1 -
Total 101,096.2 201.5 101

Assessment of McKies Stringybark/Blackbutt Open Forest
26
Map 6: Occurrence of McKies Stringybark/Blackbutt Open Forest by state forest

Assessment of McKies Stringybark/Blackbutt Open Forest
27
6 References
Belbin, L. (1994). PATN: Pattern Analysis Package. CSIRO Division of Wildlife and Ecology, Canberra
Benson J.S., Richards P.G., Waller S. and Allen C.B. (2010). New South Wales vegetation classification and assessment: Part 3 Plant communities of the NSW Brigalow Belt South, Nandewar and west New England Bioregions and update of NSW Western Plains and South-western Slopes plant communities, Version 3 of the NSWVCA database. Cunninghamia 11(4), pp. 457-579.
Clarke, P.J., Copeland L.M. and Noble, N.E. (2000) The vegetation and plant species of Single National Park. Unpublished report prepared for the Glen Innes district of the NSW National Parks & Wildlife Service
Harden, G. J. (1990). The Flora of New South Wales. Volume 3-4. New South Wales University Press, Kensington.
Harden, G. J. (2002). The Flora of New South Wales. Volume 1-2 (Revised Edition). New South Wales University Press, Kensington.
Hunter, J.T. (2011). Vegetation and Floristics of Tingha Plateau State Conservation Area. A report to the Parks and Wildlife Service, Office of Environment and Heritage.
Hunter J.T. (2000). Vegetation and Floristics of Kings Plain National Park. A report to the New South Wales National Parks and Wildlife Service, Office of Environment and Heritage.
NSW Scientific Committee. (2011). McKies Stringybark/Blackbutt Open Forest in the Nandewar and New England Tableland Bioregions. Endangered ecological community determination. NSW Scientific Committee, Hurstville.
OEH. (2015). BRG-Namoi Regional Native Vegetation Mapping. Technical Notes, NSW Office of Environment and Heritage, Sydney.
OEH. (in prep (this should be the date of the draft manuscript/dataset). Native Vegetation Classification for Eastern NSW. Manuscript in preparation, NSW Office of Environment and Heritage, Hurstville.
Poore, M. E. D. (1955). The use of phytosociological methods in ecological investigations: II. Practical issues involved in an attempt to apply the Braun-Blanquet system. The Journal of Ecology, 245-269, pp.245-269.
Royal Botanic Gardens. (2002). PlantNET - The plant information network system of the Royal Botanic Gardens, Sydney (Version 1.4). First accessed 2/10/14 from http://plantnet.rbgsyd.gov.au
Sivertsen, D. (2009). Native Vegetation Interim Type Standard, Department of Environment, Climate Change and Water NSW, Sydney