assessment of influence of process safety culture on
TRANSCRIPT
_____________________________________________________________________________________________________ *Corresponding author: E-mail: [email protected];
Journal of Scientific Research & Reports 27(6): 72-83, 2021; Article no.JSRR.70721 ISSN: 2320-0227
Assessment of Influence of Process Safety Culture on Employee Attitude towards Violations in Selected
Petroleum Companies, in Niger-Delta
Akaninyene Edet Ekong1*, John N. Ugbebor1 and Bara K. Brown1
1Centre for Occupational Health Safety Environment, Institute of Petroleum Studies, University of Port
Harcourt, Nigeria.
Authors’ contributions
This work was carried out in collaboration among all authors. All authors read and approved the final
manuscript.
Article Information
DOI: 10.9734/JSRR/2021/v27i630403 Editor(s):
(1) Professor Cheng-Fu Yang, National University of Kaohsiung, China. Reviewers:
(1) S M Towhidur Rahman, Khulna University, Bangladesh. (2) Navdha Natvarlal Soni, L J University, India.
Complete Peer review History: https://www.sdiarticle4.com/review-history/70721
Received 02 May 2021 Accepted 09 July 2021
Published 10 July 2021
ABSTRACT
The study examined Influence of Process Safety Culture on Employee Attitude towards violations in Selected Petroleum Companies, Niger-Delta. A descriptive cross-sectional oilfields based study. Study utilized non-probability sampling method combining purposive, convenience and quota sampling techniques. Purposive sampling is centred on the intent or purpose of the study. The research was a descriptive cross-sectional study, the population was made up of a sample size of one thousand workers of the processing unit of ten selected International Oil Companies (IOCs) and Local Oil Companies (LOCs) selected by convenience sample techniques. The study adopted Regression analysis for testing and modelling the research hypothesis. Before carrying out regression analysis, multicollinearity was checked to know if it is good fit for regression analysis on SPSS IBM 20 version. Outcome of the test shows that; regression analysis was acceptable because the Variance Inflation Factor (VIF) of the checked multicollinearity was 1.000 which means there was no awkward multicollinearity. This study adopted the 95% confidence level and 0.05 significance level. The study discovered that process safety culture influences employees’ attitudes toward violations in Oil and Gas industries with positive coefficient of standardized coefficient(β) of 0.397 and p-value 0.000 less than the significance level 0.05 and t-statistics being 12.354. It is
Original Research Article
Edet et al.; JSRR, 27(6): 72-83, 2021; Article no.JSRR.70721
73
recommended that ways to motivate employees to adopt the safety habit should be adopted and may be done using the carrot and stick method propounded by Abraham Maslow. Management must learn to choose the most suitable approach to motivate employees to abide by the safety expectations of their organisation. Awards can be given at the end of every quarter to the most safety conscious employee or acts of recognition or even monetary rewards. For employees who do not obey safety rules when positively motivated, penalties, fines, punishment.
Keywords: Process safety culture; employee attitudes towards violation and petroleum industry.
1. INTRODUCTION Accident do not happen; they are caused Oyet [1]. Incidents are not caused by ‘unusual events’, rather they are caused by an ‘unusual combination of usual events’. In oil and gas related incidents, human error owing to wrong perception of process safety culture contributes over 70% of accidents [2]. Process safety culture is a subset of the process safety management (PSM) under the umbrella employee participation in the fourteen (14) process safety elements as enacted by the Occupational Safety and Health Administration (OSHA) in the Code of Federal Regulations (CFR) Chapter 29, Section 1910.119 with the purpose of preventing or minimizing the significant effect of catastrophic discharges of toxic, reactive, flammable, or explosive chemicals from an enclosed process that deal with any of the 137 highly hazardous chemicals (CCPS, 2007 and Kwon, 2006 cited in CSB, 2019). Interestingly it does not emphasis merely on safety attitudes it is a leading indicator of process safety management performance. Additionally, a process safety culture which is assessed as excellent gives the uppermost importance to safety [3]. Most recent definitions of process safety have focused more on the human beliefs, perspectives and behaviours in an organization [4]. Previous study also approves that a process safety culture raises risk management and mitigative approaches that is established on an increased employees’ commitment to and knowledge of safety in an organization. The organization need to understand that human factor can be stimulated by management system failures; even though, there is zero tolerance for wilful violations of process safety standards, rules, or procedures. In order to achieve the goal of improving process safety human factor (process safety culture) must be improved upon before an incident occur; this means that every error in the area of (Attention and Motivation, Fitness for duty, staffing issues, Task design, and Communication issues) which is connected to
human factor are the main causes of accidents [5,1]. The petroleum industry has experienced astounding process safety failures’ most of are linked to employee and managements’ attitudes; example of such is the Tesoro Anacortes Refinery Fatal Explosion and Fire accident in 2010 claimed Seven(7) lives which prior to workers had noted thirty-one(31) near misses which the management paid less or no attention to them, these near misses were ascribed to lots of factors, which includes operators being obligated to execute several outside jobs and a repeated rotation of the field and control room operators, post the event recommendation was handed out to the Tesoro Anacortes Refinery to implement a refinery-wide safety culture improvement program [5] (Reese and Taylor, 2012; CSB, 2019), report from the incidence shows that the deadly explosion and fire was entirely avoidable as a result Tesoro Petroleum was cited for Thirty-nine(39) wilful violations as well as five serious violations of state workplace and safety health regulation and were fined approximately 2.4million dollars, and they and the former owner of the refinery-Shell oil were made to pay Thirty-nine(39) million dollar settlement for wrongful death as filed by the families of deceased employees, Tesoro was named as one of the top Hundred (100) toxic air polluter in United States, the Environmental Protection Agency (EPA) sued Tesoro Petroleum for not testing its product for harmful pollutants, and paid a fine of 1.1million dollars as a result of the suit by the EPA (McClary, 2011 & de Place, 2014). On this backdrop, the study examines the influence of process safety culture on employee’s attitudes in the selected petroleum industries in Nigeria.
1.1 Study Hypothesis
Alternate Hypothesis (H1): Perceived process safety culture has influences employees’ attitudes toward violations in Oil and gas industries.
The postulated hypothesis was based on the postulated theory as seen in the below diagram.

Edet et al.; JSRR, 27(6): 72-83, 2021; Article no.JSRR.70721
74
Fig. 1. Study postulated theory
2. LITERATURE REVIEW The system adopted by an organisation which shows the manner in which people act and think can be referred to as culture. Culture influences what is acceptable and what is not acceptable [6]. Process safety culture does not focus solely on safety attitudes; rather, it is a positive indicator of safety management performance. Furthermore, a process safety culture that is rated as excellent assigns the highest priority to safety (Cooper, 2000). Cakit, Olak, Murata, Karwowski, Alrehalli and Marek [7], carried out a research that offered various consequences for evaluating the perceived safety culture in Japan’s petrochemical industry. They discovered that perceived safety culture significantly affects personnel safety motivation. They also discovered that the perceived safety culture has significant impact on the development of personnel safety behaviours. The findings show the need for leaders of organisation to reduce the attitude of employee which is not safe by creating better safety procedures daily at work. Management systems was thus advised to determine features of organisation which can directly or indirectly impact attitude that is unsafe at work. Safety attitude reflects employees’ beliefs and emotions concerning safety policies, procedures, and practices (Burke, Sarpy, Tesluk & Smith-Crowe, 2010). To date, many different scales have been developed to measure safety attitudes, and the structural dimensions of safety attitude can vary greatly across industries [8]. Cox [9] proposed a structure of safety attitude based on five dimensions, namely, the effectiveness of arrangements for safety, individual responsibility, personal scepticism, the safety of
the work environment, and personal immunity [10]. Bad attitudes spread, which is why we need to address the issue quickly. Bad attitudes destroy employee morale and cause organizational disturbances. Negative attitudes could be due to personal problems. For example, an employee might be having trouble at home that influences his/her behaviour at work. The first step in turning around this potentially harmful, but common, management dilemma is to early articulate to the employees that their attitude and inability to positively contribute to safety in their department are performance hindrances equal to not performing primary job responsibilities. They affect the department's bottom line and overall effectiveness in ways that are harder to measure, but nonetheless drag the department down. Dodoo [11] carried out a study to examine the contributory factors to workers’ unsafe attitude. After examining 70 empirical study in occupational safety and health research, and thereafter clustered into eight job domains namely: construction, healthcare, informal sector enterprises, manufacturing, mining, energy, agriculture, and multidimensional context. They observed that lack of sufficient knowledge on safety and health, violation of safety rules, work pressure, stress and lack of utilisation of protective equipment were the major elements affecting unsafe behaviours. 2.1 Safety Culture and Employees’
Attitude Various definitions of safety culture tend to place emphasis on the way and manner employees behaves or think as safety culture. Conversely, other research has tended to quintessence on the way and manner

Edet et al.; JSRR, 27(6): 72-83, 2021; Article no.JSRR.70721
75
individuals think that is, beliefs, perceptions, attitudes about aspects of safety, by measures of safety climate, instead of their real behaviour [12]. According to Guldenmund [13], safety culture are facets of organisation’s culture that have effects on the employee attitudes and behaviour in connection with reducing or increasing risk. Flin, Mearns, O’Connor, & Bryden, [14] opined that safety culture is distinguished from the employees’ attitudes and perceptions and cannot be identified as safety climate. Lee and Harrison [12] suggested that in order to expansively examine safety culture, procedures such as peer reviews, audit and performance indicator measures must be adopted, though this is seldom done. Alrehaili [15] assesses safety culture among personnel in governmental construction sites, Saudi Arabia, tested adopting bootstrapping statistical tools to see if ‘safety culture has a significant influence on workers’ attitude toward violations in construction sites’. It was discovered that a negative statistical total (direct and indirect) effect existed between safety culture (exogenous variable) and workers’ attitude towards violations (endogenous variable) i.e. (β= -0.31, p<0.001). Which indicates that the construction workers have positive and clear attentiveness about safety culture and are less probable to have an attitude towards safety violations. The findings of a study on evaluation of perceived safety culture in petrochemical companies in Japan shows that petrochemical workers awareness concerning the safety culture was established to have direct effect on their own attitude toward safety violations [7].
3. STUDY AREA There are approximately 606 oilfields which comprises of 355 onshore and 251 offshore assets in the Niger-Delta region. The region criss-crosses the South-South, South-Western and South-Eastern geopolitical regions consisting of nine states - Akwa Ibom, Bayelsa, Delta, Edo, Cross River, Imo, Rivers, and Ondo states of Nigeria. The region covers a surface area of 112,000square kilometers, a household of about 3000 groups with a total population in excess of 31 million persons (Greyl, Ojo, Williams, Certoma, Greco, Ogbara, & Ohwojeheri, 2013). Niger Delta region is located geographically at coordinate 4o49’60” N and 6o0’ 0” E. With about 70,000Km2 landmass of wetland, the region is regarded as the largest wetland region in Nigeria and Africa and only third in the world. Niger Delta host a large deposits and exploitations of oil and gas in the Country, and these resources provides at least Ninety-five percent (95%) of Nigeria foreign exchange incomes [16]. The region environment consists of four (4) ecological areas, which is, coastal barrier islands; freshwater swamps; mangrove swamp forests and lowland rainforest [17]. Lots of persons in the Niger Delta region rely on services provided by the ecological unit for their continued existence. Occupational structures of the individuals are mostly farming, fishing, traditional mangrove exploitation, raffia/oil palm etc. Fig. 2 shows the Map of the Niger Delta region of Nigeria consisting of nine States with different categories of oil well.
Fig. 2. Map of the Niger Delta region of Nigeria showing the nine States and categories of oil
well

Edet et al.; JSRR, 27(6): 72-83, 2021; Article no.JSRR.70721
76
4. MATERIALS AND METHODS This Research was a descriptive cross-sectional oilfields based study. Descriptive design is used to recognize and acquire data and facts on characteristic of a specific issue like public, group or individuals (McNabb, 2010). Regarding study population, this study considered only the field production / process plant operations workers of the Local/National and International Oil Companies with more emphasis on those who work at the sensitive (process plant) area of the selected companies. These are the selected IOC’s and LOC’s in the Niger-Delta region that forms the Population of the study: workers of the processing unit of ExxonMobil, Total Exploration & Production, Shell Petroleum Development Company, Agip Oil Company, Savannah Energy Plc, Network Exploration & Production, Frontier Oil, Aieteo Eastern Exploration & Production Company, Universal Energy Resources Ltd and Nigeria National Petroleum Corporation (NNPC). This Study utilized non-probability sampling method combining purposive, convenience and quota sampling techniques. Purposive sampling is centred on the intent or purpose of the study [18]. Therefore, selection of the elements in the population for the study should was hinged on the knowledge and characteristics that is suitable for the study. The process operations workers or workers who work in various section of the oil and gas plants are suitable for the study, this is because their daily routine is processing crude oil to the point of delivery which proves that they have the knowhow on the associated risk prevalent in the work and they know what is obtainable with regard to perceived process safety culture in process safety management procedure for their section in their respective industry. On this premise, this study selected one thousand (1000) process operations workers in the selected Local Oil Companies (LOC’s) and International Oil Companies (IOC’S) across the Niger-Delta region by means of convenience sampling technique. In quota sampling, the sample is drawn from a population with same characteristics and selection based on equal proportion. Decision for selection is mostly on some pre-set standard [19]. The selected Local and International Oil Companies possess same characteristics with regards to processes required for Oil Exploration and production, this put their process operations workers at the same risk. Because the study compared the process safety culture of the Local and
International Oil Companies the selection was based on 50-50%. The data gotten from the survey fulfill the criterion of primary data; in summary, this study utilized the outcomes from the field survey (both hardcopy questionnaires and google form) as the primary data. However, sourced data such as journals, e-book, newspapers e.t.c., from the internet on related topic forms the study secondary data. The data is qualitative in its’ actual state; qualitative because it is non-numerical, but was converted to quantitative through coding the variable on Statistical Package for Social Sciences (SPSS) for easy analysis. The instrument used was an initially Pre-tested well-structured adopted and adapted self-administered questionnaire, designed in order to achieve the objective of this study. The Questionnaire consists of Three (3) Sections and contains Twenty-five (25) questions which also includes the Socio-demographic data. The other sections apart from section A (Socio-demographic data) comprised questions with responses which were measured on a five-point Likert scale which ranged from “1 = strongly disagree” to “5 = strongly agree” i.e. 1 is S.D, 2 is D, 3 is N, 4 is A, and 5 is SA. Cronbach alpha coefficient from the reliability test carried out on the pre-test data shows an overall outcome 0.872, which can be considered very strong since it is not far from 1.0 regarded as the strongest reliability scale. This is a strong indication that the instrument is devoid of error and Researcher’s bias. a total completion rate of 81.6% was gotten. This is considered excellent completion rate (Boughab, Hassane, & Roukia, 2014). The Eight hundred and sixteen (816) data retrieved from the survey (both online through google form and in person via hardcopy) were coded on Spreadsheet Package for Social Science (SPSS) IBM 20 version. The socio-demographic characteristics of the respondents were gotten using the SPSS and by means of Microsoft Excel sheet 2016, figures (percentages and frequencies) from the results of SPSS were graphically presented with both bar and pie charts.
5. RESULTS AND DATA ANALYSIS 5.1 Socio Demographic Data of
Respondents
The study socio demographic characteristics is presented in this section. Fig. 3 shows the respondents data for gender. Fig. 4 presents the distribution of respondent age group.

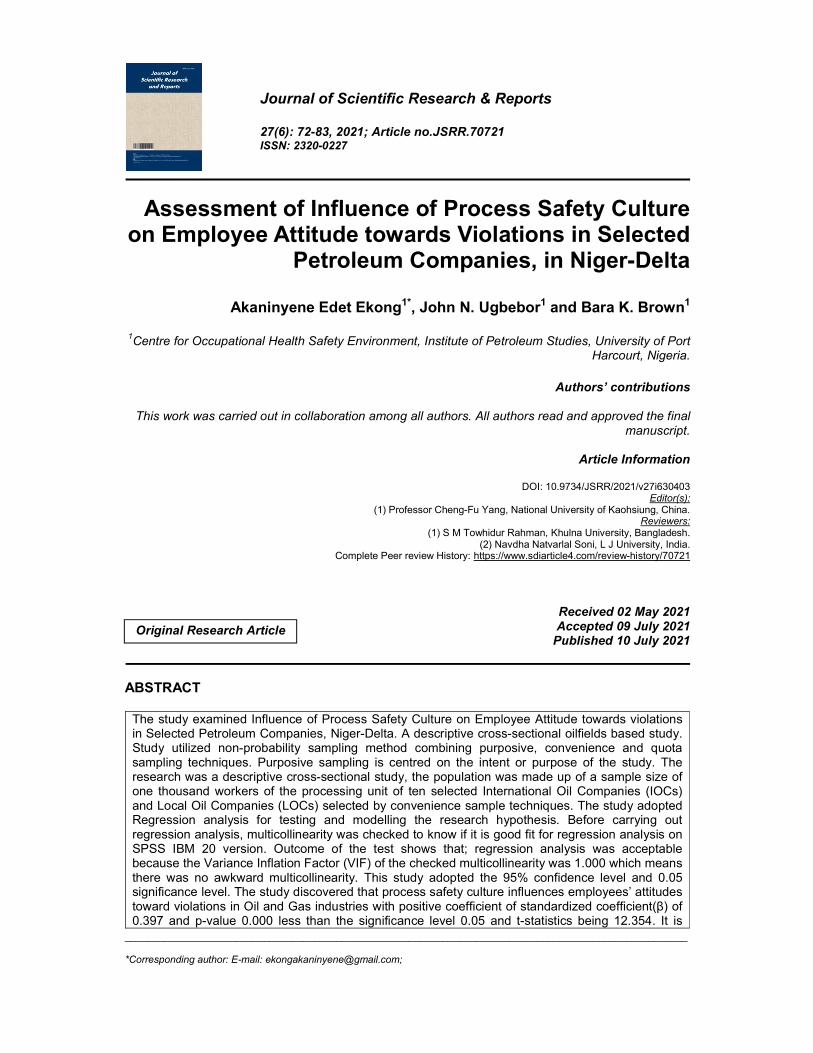
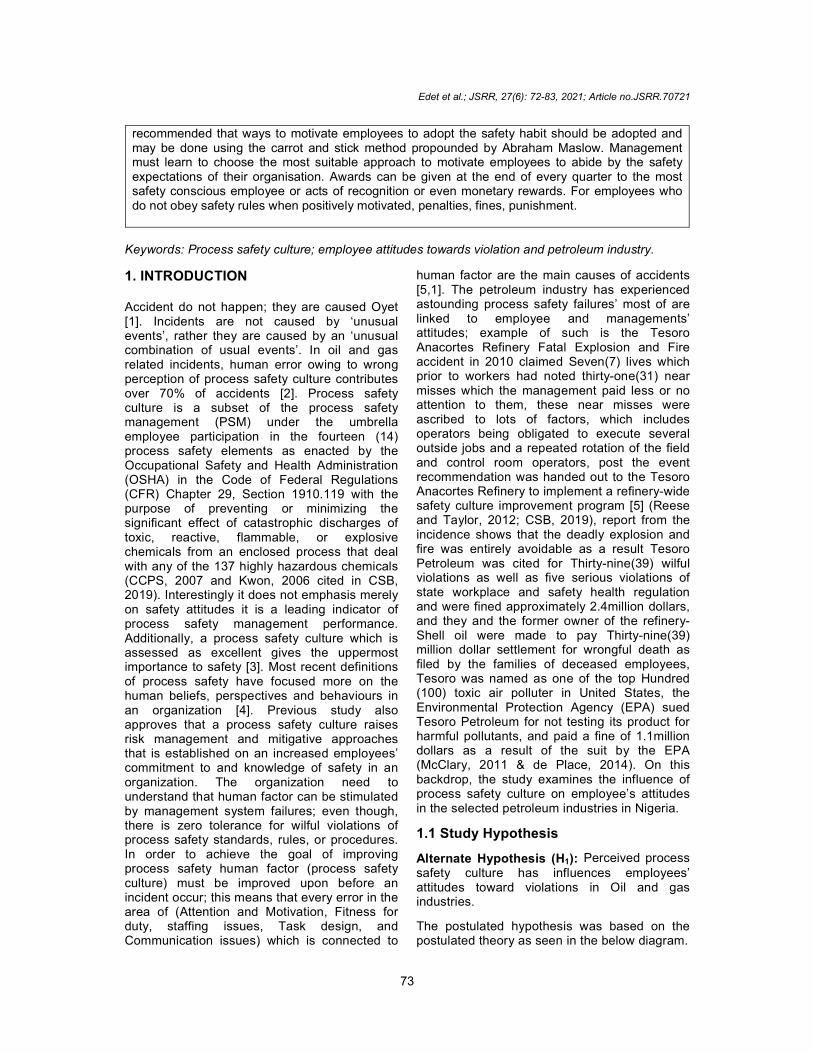
Meanwhile, Fig. 5, shows the distribution of Cadre of respondents. Fig. 6 presents the distribution of the respondents’ classification of Company. Lastly, Fig. 7 shows the respondents of years of experience. Fig. 3 above reveals the gender of respondents. As seen in the table, majority of the respondents were male at 70.3% and only 29.7% were female. Fig. 4 reveals the age distribution of respondents. Respondents aged 25
Fig. 4. Distribution of
Edet et al.; JSRR, 27(6): 72-83, 2021; Article no.
77
shows the distribution of 6 presents the
distribution of the respondents’ classification of 7 shows the respondents
3 above reveals the gender of respondents. , majority of the
respondents were male at 70.3% and only
4 reveals the age distribution of respondents. Respondents aged 25-34 were
9.9%, respondents aged 35-44 were 55.3%, respondents aged 45-54 were 25.0%, respondents aged 55-64 were 9.8% and respondents aged 64 and above were 0%. This indicates that majority of the respondents were between ages 35-44 (55.3%). Fig. 5 reveals respondents’ cadre. Respondents who were junior staff are 20%, junior management/supervisor were 55management were 25%. This indicate that majority of respondents are junior management/supervisor.
Fig. 3. Gender distribution
Distribution of age group of respondents
Fig. 5. Respondents’ cadre
Article no.JSRR.70721
44 were 55.3%, 54 were 25.0%,
64 were 9.8% and respondents aged 64 and above were 0%. This indicates that majority of the respondents were
5 reveals respondents’ cadre. Respondents who were junior staff are 20%, junior management/supervisor were 55% and senior management were 25%. This indicate that majority of respondents are junior
Fig
Fig. 7. Distribution of Respondents’ years of work
Table 1. Responses on process safety culture
Source: Researcher’s online survey, 2020. Note: SA is Strongly Agree, A is Agree, D is Disagree, SD is strongly Disagree, and N is Neutral. F represents Frequency respondents, while
Questions
Total Number Respondents (N) = 816. Percentage My company is very serious about safety My company clearly states that safety is vital My company has clear goals and targets for safety My company is interested in workers’ views on safety The safety committee does a good job on safety We get sufficient information from management on safety matters When you break a safety rule, you will be treated equally If you raise a safety concern, someone follows up very quickly The workforce are regularly happy with management’s decisions on safety Safety workers generally do a good job The safety program is well managed in this company We have good safety standards in this company Safety training and drills in this company is of high quality
Edet et al.; JSRR, 27(6): 72-83, 2021; Article no.
78
Fig. 6. Classification of Company.
Distribution of Respondents’ years of work experience
Responses on process safety culture (PSC)
Source: Researcher’s online survey, 2020. Note: SA is Strongly Agree, A is Agree, D is Disagree, SD is F represents Frequency respondents, while (%) represent percentage of
respondents
SA F (%)
A F (%)
D F (%)
SD F (%)
N) = 816. Percentage (%) = 100. 340(41.7) 269(32.9) 85(10.4) 105(12.9)
352(43.1) 314(38.5) 67(8.2) 77(9.4)
369(45.2) 283(34.7) 44(5.4) 88(10.8)
123(15.1) 492(60.3) 85(10.4) 76(9.3)
257(31.5) 369(45.2) 85(10.4) 63(7.7)
245(30.0) 328(40.2) 123(15.1) 101(12.4)
80(9.8) 162(19.9) 205(25.1) 123(15.1)
126(15.4) 445(54.5) 98(12.0) 107(13.2)
80(9.8) 226(27.7) 200(24.5) 105(12.9)
121(14.8) 615(75.4) 40(4.9) 29(3.5)
60(7.4) 492(60.3) 144(17.4) 83(10.4)
161(19.7) 492(60.3) 82(10.0) 41(5.0)
205(25.1) 369(45.2) 122(15.0) 119(14.6)
Article no.JSRR.70721
Source: Researcher’s online survey, 2020. Note: SA is Strongly Agree, A is Agree, D is Disagree, SD is %) represent percentage of
N F (%)
12.9) 17(2.1)
6(0.8)
32(3.9)
45(4.9)
42(5.2)
12.4) 19(2.3)
15.1) 246(30.1)
13.2) 40(4.9)
12.9) 205(25.1)
11(1.4)
37(4.5)
40(4.9)
14.6) 1(0.1)

Edet et al.; JSRR, 27(6): 72-83, 2021; Article no.JSRR.70721
79
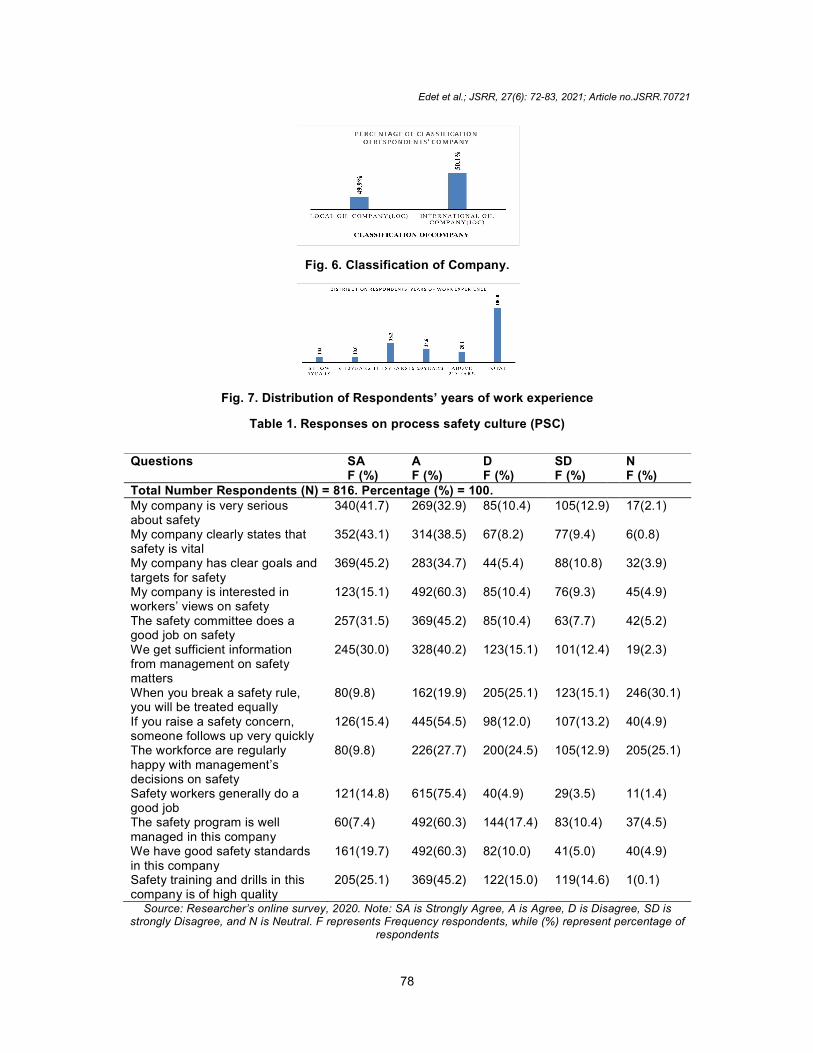
Fig. 6 above reveals the classification of company studied. 49.9% of respondents were the staff local oil company (LOC) and 50.1% of respondents were staff of International Oil Company (IOC). Fig. 7 above reveals the years of work experience of respondents. 10% of respondents had below 5years of work experience, another 10% had between 6-10 years’ work experience, 35.2% of respondents had 11-15 years of work experience, 24.6% had 16-20 years of work experience and 20.1% of respondents had above 21 years work experience. This is an indication that majority of respondents had between 11-15 years of work experience are 35.2%. Table 1 above examines process safety culture (PSC). In response to whether respondents company is serious about safety, it was discovered that majority of respondents 340 (41.7%) strongly agreed, 269(32.9%) agreed while 105(12.9%), 85(10.4) strongly disagreed and disagreed respectively; 17(2.1%) respondents were neutral. 352(43.1%) and 314(38.5%) respondents strongly agreed and agreed that their company clearly states that safety is vital while 77(9.4%). Majority respondents 369(45.2%) and 314(38.5%) agreed that their company has clear goals and target for safety while 88(10.8%) strongly disagreed. 492(60.3%) respondents agreed that their company is interested in workers’ views on safety while 76(9.3%) respondents strongly disagreed. Majority of respondents 346(42.4), 242(29.7) agreed and strongly agreed that they can trust their supervisor and 205(25.1%) and 20(2.4%) disagreed and strongly disagreed. Most respondents 369(45.2%) agreed that their safety committee does a good job on safety while 63(7.7%) strongly disagreed and 42(5.2%) were neutral. 328(40.2%) agreed that they get sufficient information from management on safety matter while 101(12.4%) respondents strongly disagreed. 246(30.1%) agreed that when they break safety rule, they are treated equally as others while 80(9.8%) respondents strongly agreed. 451(55.2%) respondents agreed that their supervisor listens to their ideas on safety while 111(13.6%) strongly disagreed. 445(54.5%) respondents agreed that if they raise a safety concern, someone follows up immediately while 98(12%) disagreed and 40(4.9%) respondents were neutral. In response to whether their workforce is regularly
happy with management’s decision on safety, most respondents 200(24.5%), 105(12.9%) disagreed and strongly disagreed while 80(9.8%) strongly agreed. Majority of respondents 615(75.4%) agreed that safety workers generally do a good job while 29(3.5%) respondents strongly disagreed. Most respondents 492(60.3%) agreed that the safety program is well managed in their company while 83(10.4%) respondents strongly disagreed. In response to whether there are good safety standards in respondents’ company, 492(60.3%) respondents agreed that they have good safety standard while 40(4.9%) respondents were neutral and 41(5.0%) respondents strongly disagreed. 369(45.2%) agreed and 205(25.1%) strongly agreed that safety training and drills in their company is of high quality while 119(14.6%) respondents strongly disagreed. Table 2 examine employees’ attitude (EA). In response to whether work safety rules offer a safer work environment, majority of respondents 318(38.9) strongly agreed while 77(9.6 respondents strongly disagreed and 82(10) respondents were neutral. Majority of respondents 406(49.7) agreed that they place using safety equipment as essential, 63(7.7) disagreed and 15(1.8) respondents were neutral. 428(52.5) respondents agreed that they alert their co-workers who act different to work safety rules, 23(3.1) disagreed and 6 respondents were neutral. 451(55.3) respondent agreed that if co-workers do not take any warning, they notify their manager about unsafe work, 44(5.4) respondents strongly agreed and 140(17.2) respondents were neutral. 292(35.8) respondents and 244(29.9) respondents agreed and strongly agreed that they make effort to follow work safety rules even if their performance is reduced, 81(9.9) respondents strongly disagreed and 80(9.8) respondents were neutral. Majority of respondents, 205(25.1) and 205(25.1) disagreed and strongly disagreed that It is not less likely to have an accident in a work where there are no work safety rules while 164(20.1) and 160(19.6) respondents strongly agreed and agreed, 80(10) respondents were neutral. 574 (70.3) respondents strongly agreed that Work safety rules are significant and essential to prevent accidents at my work while 19(2.3) respondents disagreed and 3(0.5) respondents were neutral.

Edet et al.; JSRR, 27(6): 72-83, 2021; Article no.JSRR.70721
80
Table 2. Responses on the employees attitude (EA)
Questions SA F (%)
A F (%)
D F (%)
SD F (%)
N F (%)
Total Number Respondents (N) = 816. Percentage (%) = 100. Work safety rules offer a safer work environment
284(34.8) 318(38.9) 55(6.7) 77(9.6) 82(10.0)
I place using safety equipment as essential
240(29.4) 406(49.7) 63(7.7) 93(11.4) 15(1.8)
I alert my co-workers who act different to work safety rules
319(39.1) 428(52.5) 23(3.1) 40(4.9) 6(0.7)
If my co-workers do not take any warning, I notify my manager about unsafe work
120(14.7) 451(55.3) 61(7.4) 44(5.4) 140(17.2)
I make effort to follow work safety rules, even if they reduce my performance
244(29.9) 292(35.8) 119(14.6) 81(9.9) 80(9.8)
It is not less likely to have an accident in a work where there are no work safety rules
164(20.1) 160(19.6) 205(25.1) 205(25.1) 82(10.0)
Work safety rules are significant and essential to prevent accidents at my work
574(70.3) 179(21.9) 19(2.3) 41(5.0) 3(0.5)
Source: Researcher’s online survey, 2020. Note: SA is Strongly Agree, A is Agree, D is Disagree, SD is strongly Disagree, and N is Neutral. F represents Frequency respondents, while (%) represent percentage of
respondents
5.2 Data Analysis For the hypothesis to testing and theoretical modelling, this study adopted Regression analysis. According to Garson [20] regression Analysis is utilized for modelling value of dependent scale variable based on its connection with one or more independent variables (predictors). Before going on to use regression analysis, multicollinearity analysis was important to verify it suitability by means of checking Variance Inflations Factors (VIF). SPSS IBM 20 version was utilized to compute the variance inflation factor (VIF) for all of the non-endogenous variables in the group of data. According to Hair, Hult, Ringle, & Sarstedt (2016), when all computed VIFs are not higher
than Five (5) they are considered acceptable. A common thumb rule is that awkward Multicollinearity may be in existence when the coefficient of VIF is higher than 5.0 (Byrne, 2016). Good enough all the computed VIFs (See Table 3) in this study are lesser than 5 making regression analysis is acceptable statistical tool for testing the hypothesis because the VIF of the checked multicollinearity which was 1.000 and is statistically perfect for a regression analysis to be used. In order to carry out the regression analysis the study adopted the 95% confidence level and 0.05 significance level. Hypothesis remarks were made not only on the ground p-value alone, but on other important factors such as standardized coefficient (β), and t-statistics.
Fig. 8. The postulated theoretical model with standardized pathway coefficients

Edet et al.; JSRR, 27(6): 72-83, 2021; Article no.JSRR.70721
81
Table 3. Hypothesis (H1) test outcome Coefficients
a
Model Unstandardized Coefficients
Standardized Coefficients
t Sig. Collinearity Statistics
B Std. Error Beta Tolerance VIF 1 (Constant) -.252 .363 -.694 .488
PSC_1 1.177 .095 .397 12.354 .000 1.000 1.000 a. Dependent Variable: EA
The Fig. 8 and Table 3 shows the tested hypothesis and reveals the impact of the various variables examined in the study. Assessment of ‘ process safety culture has influence on employees’ attitudes toward violations in Oil and gas industries’ revealed a positive coefficient of standardized coefficient(β) of 0.397. Whereas, p-value and t-statistic were 0.000 and 12.354 respectively. The p-value of 0.00 being less than 0.05 significant level, positive coefficient and positive t-statistic is an indication the ‘perceived process safety culture does influence the employee attitude towards violation.
6. DISCUSSION OF FINDINGS The result of the tested hypothesis 'process safety culture influences employees’ attitudes toward violations in Oil and gas industries’ showed that process safety culture has a significant positive effects on employees’ attitudes toward violations in Oil and gas industries. This finding is in line with the findings of a study on evaluation of safety culture in petrochemical companies in Japan which revealed that petrochemical workers’ awareness concerning the safety culture has a direct effect on employees’ attitude toward safety violations [7]. The finding of this study also agrees with Alrehaili [15] who discovered that safety culture has a significant influence on workers’ attitude toward violations in construction site. There is no safety culture without the absolute knowledge and permission of the management of an organisation. An organisation with an existing safety culture ensures that these cultures are implemented and imbibed into the consciousness of their employees. Often times the punishment attached to deviating from this culture drives defaulter away from defaulting. In a situation where management design and implement the right process safety culture,
employees’ attitude toward violation of safety laws in the oil and gas industry in Nigeria will be right thus improving safety. Regardless of the sector, we can say that perceived process safety culture influences employees’ attitudes toward violations.
7. CONCLUSION The study examined Process Safety Culture perception in the process safety management of selected International Oil Companies (IOCs) and Local Oil Companies (LOCs) in Niger Delta and also to identify safety culture development opportunities and potential safety performance improvements. The study discovered that perceived process safety culture influences employees’ attitudes toward violations in Oil and gas industries.
8. RECOMMENDATIONS
Ways to motivate employees to adopt the safety habit should be adopted and may be done using the carrot and stick method propounded by Abraham Maslow. Management must learn to choose the most suitable approach to motivate employees in their organisation to abide by the safety culture. If the carrot method works better with their employees, management must learn to reward workers for applying safety in all their activities at work. Awards can be given at the end of every quarter to the most safety conscious employee or acts of recognition or even monetary rewards.
For employees who do not obey safety rules when positively motivated, penalties, fines, punishment (and even termination of appointment depending on how often they violate safety laws) should be meted out to them to help curb their poor attitude toward violation.

Edet et al.; JSRR, 27(6): 72-83, 2021; Article no.JSRR.70721
82
CONSENT As per international standard or university standard, Participants’ written consent has been collected and preserved by the author(s).
DISCLAIMER The products used for this research are commonly and predominantly used products in our area of research and country. There is absolutely no conflict of interest between the authors and producers of the products because we do not intend to use these products as an avenue for any litigation but for the advancement of knowledge. Also, the research was not funded by the producing company rather it was funded by personal efforts of the authors.
COMPETING INTERESTS Authors have declared that no competing interests exist.
REFERENCES 1. Oyet G. Human Errors in process safety
management. “A case study of Oando Marketing PLC Apapa PMS Tank 5 Explosion Incident”. Resource Material for M.Sc. lecture in Centre of Occupational Health Safety and Environment, Uniport; 2018.
2. Alkhldi M, Pathirage C, Kulatunga U. The role of human error in accidents within oil and gas industry in Bahrain. School of the built environment, University of Salford, Salford, M5 4WT, UK; 2017.
3. Pordanjani TR, Ebrahimi AM. Safety motivation and work pressure as predictors of occupational accidents in the petrochemical industry. Health Scope. 2015;4(4).
4. Goncalves FA, Waterson P. Maturity models and safety culture: A critical review. Safety Science. 2018;105:192–211.
5. DuPont Sustainable Solutions, Lack of Internal Alignment and Commitment of Resources to Manage Risk Threaten Corporate Business Performance. 2019;1-2.
Available:https://www.dupont.com/content/dam/dupont/products-andservices/consulting-services-and
process-technologies-redesign/consultingservices-and-process-technologies landing/documents/Global%20ORM%20 Report-20.10.17%20FINAL.pdf
6. Wasileski R. An introduction to risk based process safety. Solutions for managing hazards and risk. BakerRisk. 1984-2014; 2017.
7. Cakit E, Olak A, Murata A, Karwowski W, Alrehalli O, Marek T. Assessment of the perceived safety culture in the petrochemical industry in japan: A cross sectional study. Plosone journal; 2019.
8. Ram T, Chand K. Effect of drivers’ risk perception and perception of driving tasks on road safety attitude. Transp. Res. Part. F-Traffic Psychol. Behav. 2016;42:162–176.
9. Cox S, Cox T. The structure of employee attitudes to safety: A European example. Work Stress. 1991;5:93–106.
10. Haerkens M, Leeuwen W, Sexton JB, Pickkers P, Hoeven JG. Validation of the dutch language version of the safety attitudes questionnaire (SAQ-NL). BMC Health Serv. 2016;16:8.
11. Dodoo A. Factors leading to unsafe behaviour in the twenty first century work place: A review. Management review quarterly; 2019.
12. Lee T, Harrison K. Assessing safety culture in nuclear power stations. Safety Science. 2000;30:61-97.
13. Guldenmund FW. The nature of safety culture: A review of theory and research. Safety Science. 2000;34(1-3):215-257.
14. Flin R, Mearns K, O’Connor P, Bryden R. Measuring safety climate: Identifying the common features. Safety Science. 2000;34(1-3):177-193.
15. Alrehaili Omar. Assessing safety culture among personnel in governmental construction sites at Saudi Arabia: A quantitative study approach Electronic Theses and Dissertations, 2004-2019. 2016;5261.
Available:https://stars.library.ucf.edu/etd/5261
16. Oviasuyi PO, Uwadiae J. The dilemma of Niger-delta region as oil producing states of Nigeria. Journal of Peace, Conflict and Development; 2010.
17. Kamalu OJ, Nwokocha CC. Land resource inventory and ecological

Edet et al.; JSRR, 27(6): 72-83, 2021; Article no.JSRR.70721
83
vulnerability: Assessment of onne area in Rivers State, Nigeria. Research Journal of Environmental and Earth Sciences. 2011;3(5):438-447.
18. Ben-Shlomo Y, Brookes S, Hickman M. Lecture notes: Epidemiology, evidence-based medicine and public health (6th ed.), Wiley-Blackwell, Oxford; 2013.
19. Warmbrod JR. Conducting, interpreting, and reporting quantitative research. Research Pre-Session, New Orleans, Louisiana; 2001.
20. Garson GD. Partial least squares: Regression and structural equation models. Asheboro, NC: Statistical Associates Publishers; 2016.
_______________________________________________________________________________ © 2021 Edet et al.; This is an Open Access article distributed under the terms of the Creative Commons Attribution License (http://creativecommons.org/licenses/by/4.0), which permits unrestricted use, distribution, and reproduction in any medium, provided the original work is properly cited.
Peer-review history: The peer review history for this paper can be accessed here:
https://www.sdiarticle4.com/review-history/70721