assessment of hydrokinetic energy resources in alaska rivers
TRANSCRIPT

Assessment of Hydrokinetic Energy Resources in Alaska Rivers
Preliminary results from 17 sites on the Yukon and Kuskokwim Rivers
Tom Ravens, Nyree McDonald, Garrett Yager, Taylor Harper, Erin Eggleston, Aaron Butterer, Jenny Mills,
Daniel King, Michael UlmgrenUniversity of Alaska Anchorage
Funded by Alaska Energy Authority

What is hydrokinetic energy and hydrokinetic devices?
• Under water windmills
• Water velocity (Kinetic energy) turns turbine blades and spins a generator producing electricity
• Power/area = (Cp) 0.5 density x velocity3
• Devices can be placed in rivers or tidal inlets without significantly impacting the water course
• Distinct from conventional hydropower where damming is required

Photos courtesy of UEK Corporation
Eagle Hydrokinetic Turbine Project
TurbineUEK® System
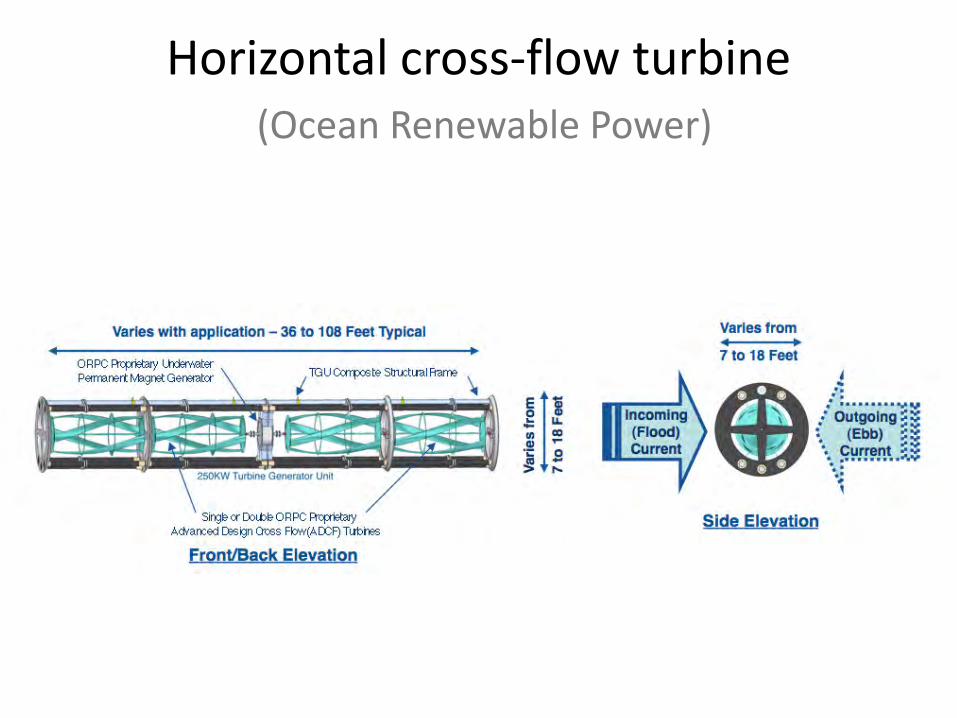
Horizontal cross-flow turbine(Ocean Renewable Power)
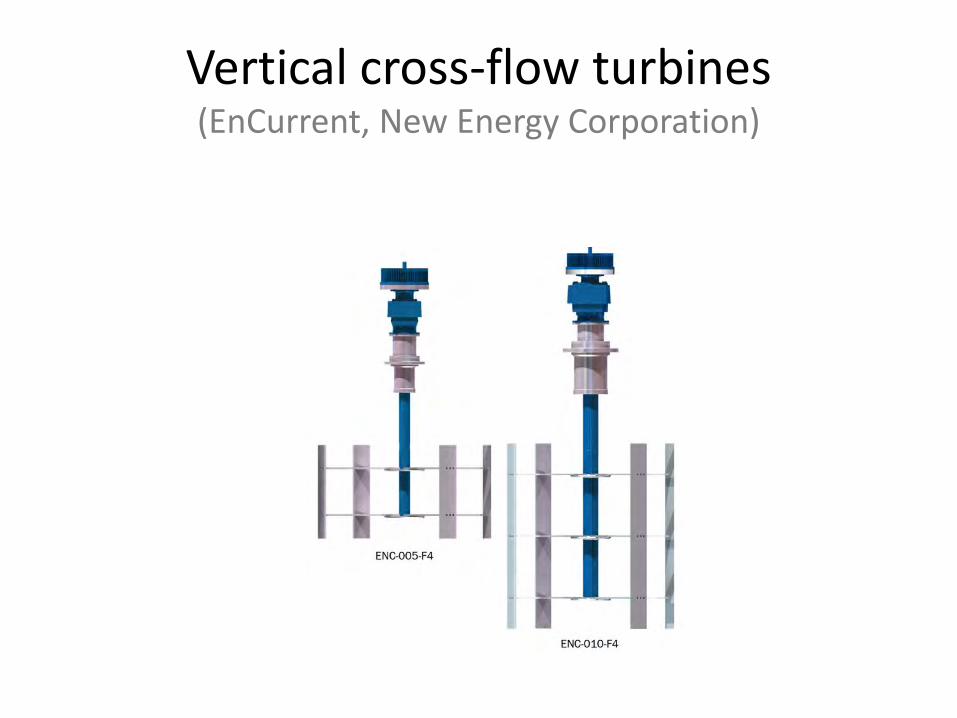
Vertical cross-flow turbines (EnCurrent, New Energy Corporation)

Paddle wheel hydrokinetic device (Don Eller, Tanana)

Project Goals and Objectives
Step 1: measure discharge, velocity, topography, bathymetry, and water level at each site.
Step 2: Determine discharge as a function of time (using water level data, and hydraulic/hydrologic models).
Step 3: Determine velocity as a function of space and time (using discharge data and models).
Step 4: Assess hydrokinetic energy potential at the 24 sites.
Overall goal: Assess hydrokinetic energy potentialat 24 Alaska sites

Sites for hydrokinetic assessment on the Yukon and Kuskokwim Rivers

Pilot Station survey transects
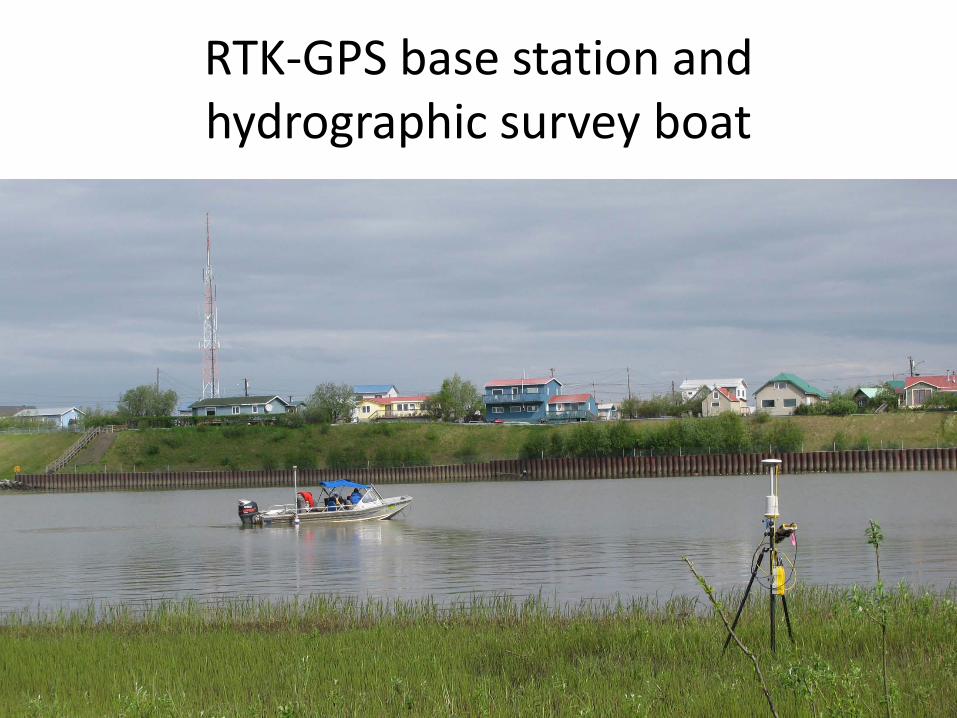
RTK-GPS base station and hydrographic survey boat

Data collection and navigation on board

Topographic survey crew surveyed shallow water and river banks


Velocity measured in Pilot Station

Velocity as a fnc. of depth

Example water level datafrom St. Mary’s
12.5
13
13.5
14
14.5
15
7/26/2009 8/15/2009 9/4/2009 9/24/2009 10/14/2009 11/3/2009
date
Depth[m]

How to use data to determine Q(t) or V(t)?
h1. 2. h
t
3.Q
h
4. Q
t

0
1000
2000
3000
4000
5000
6000
7000
8000
9000
10000
Dis
char
ge, m
^3/s
Date and Time
Yukon Discharge Summary
Moutain Village
St. Mary's
Grayling
Kaltag
Nulato
Koyukuk
Galena
Stevens Village
Galena (upstream)
Stevens Village (USGS, far upstream)
St. Mary’s (downstream)

0
500
1000
1500
2000
2500
Dis
char
ge, m
^3/s
Date and Time
Kuskokwim Discharge Summary
Aniak
Chuathbaluk
Napaimiut

HEC-RAS model of water level and velocity (Pilot Station, July-Aug/2009)

Preliminary power density estimate for Pilot Station
0
50
100
150
200
250
300
350
400
450
500
0
0.2
0.4
0.6
0.8
1
1.2
1.4
1.6
7/6/09 7/26/09 8/15/09 9/4/09 9/24/09 10/14/09 11/3/09
Pow
er p
er a
rea
(W/s
q. m
)
velo
city
(m/s
)
date
velocity (m/s)
power per area (W/sq m)

0
0.5
1
1.5
2
2.5
3
3.5
4
4.5
0 2 4 6 8 10 12
Velo
city
(m/s
)
Project Site
Peak Velocity on Yukon River Galena
threshold
Mountain Village
Peak velocity at various sites along the Yukon River

Peak velocity at various sites along the Kuskokwim
0.0
0.5
1.0
1.5
2.0
2.5
3.0
3.5
4.0
4.5
0 1 2 3 4 5 6
Velo
city
(m/s
)
Project Site
NapaimuteLower Kalskag

River slope on Yukon River
0
0.00001
0.00002
0.00003
0.00004
0.00005
0.00006
0.00007
0.00008
0.00009
0.0001
0 2 4 6 8 10 12
Rive
r slo
pe (m
/m)
Project site (Yukon River)
Galena
Mountain Village

River slope on Kuskokwim River
0
0.00005
0.0001
0.00015
0.0002
0.00025
0.0003
0.00035
0.0004
0.00045
0.0005
0 1 2 3 4 5 6
Rive
r slo
pe (m
/m)
Project site (Kuskokwim River)
Napaimute
Lower Kalskag
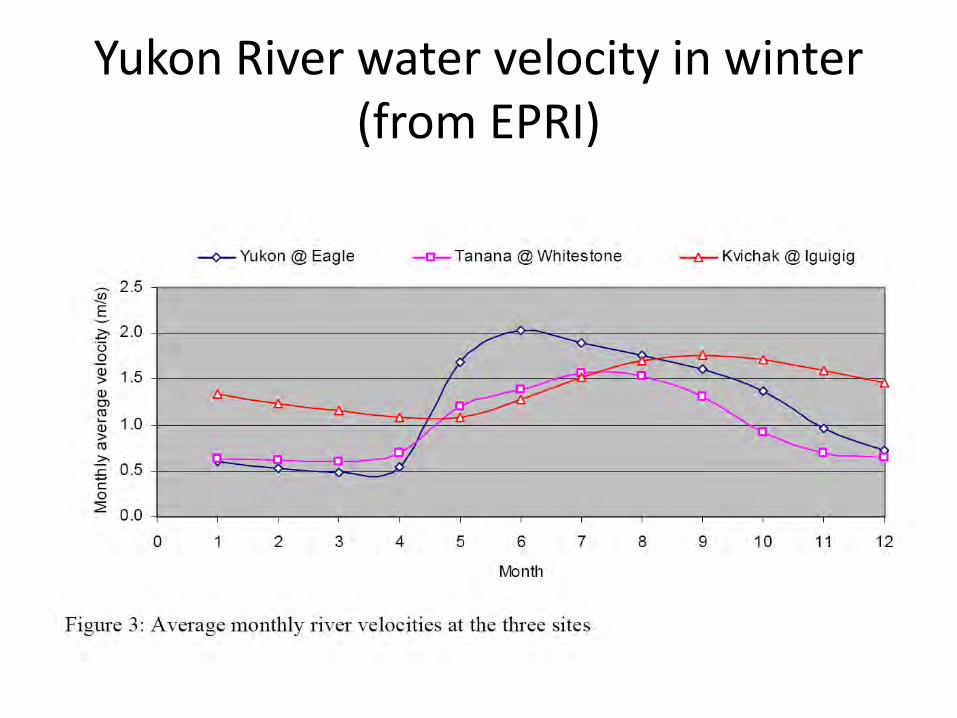
Yukon River water velocity in winter (from EPRI)
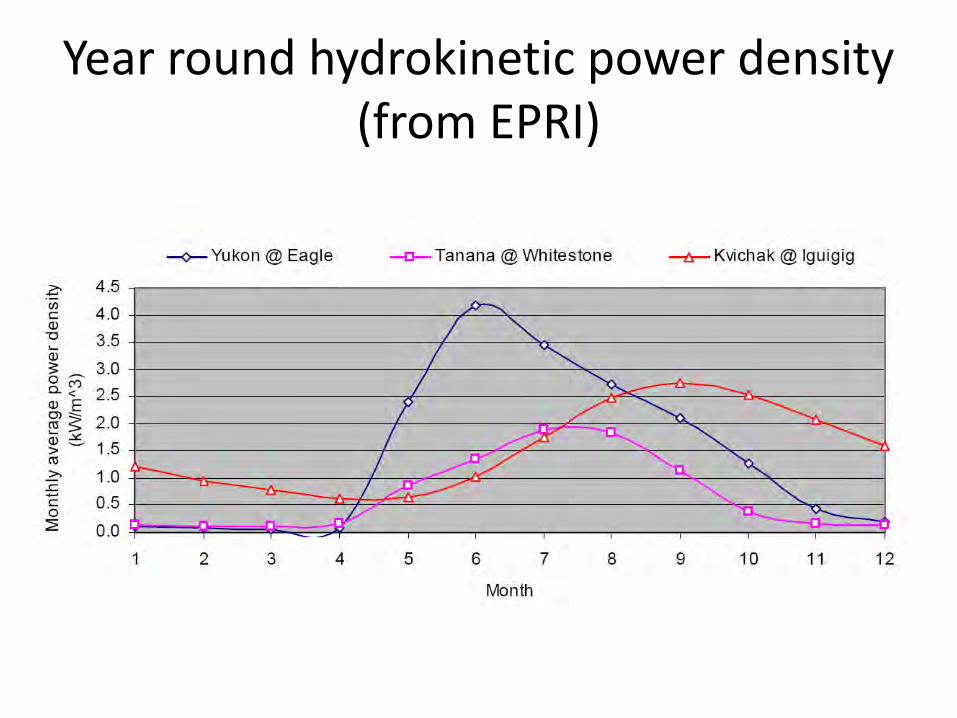
Year round hydrokinetic power density (from EPRI)

Future work?

2010 Hydro Kinetic Feasibility Sites
Upper YukonTanana
Stevens VillageBeaver
Fort YukonCircle
Tanana River
TokTanacross
Copper River
SlanaChistochina
Chitina
SusitinaRiver
TalkeetnaSutton/Chickaloon
Upper Kuskokwim
Crooked CreekRed DevilSleetmute
Stony RiverMcGrath
Teller

Hydrokinetic assessment of USA(DOE-funded with EPRI and UAF)

Hydrokinetic Energy Environmental Impacts
• On fish
• On marine mammals
• On water level
• On sediment transport

Questions?

Peak and average velocity on Yukon River
0
0.5
1
1.5
2
2.5
3
3.5
4
4.5
0 2 4 6 8 10 12
Velo
city
(m/s
)
Project Site

Summary Data