assessment of haloacetic acids in drinking water in bizerte, tunisia
TRANSCRIPT
Bechir HammamiSihem Ben HessinMohamed BahriMohamed Ridha Driss
Faculté des Sciences de Bizerte, Unitéde recherche Chimie AnalytiqueAppliquée, Université de Carthage,Zarzouna, Tunisia
Research Article
Assessment of Haloacetic Acids in Drinking Waterin Bizerte, Tunisia
An investigation into the occurrence of haloacetic acids (HAAs) was conducted during aperiod of winter and summer seasons of the years 2008–2009 on the drinking water ofBizerte with variable conditions of water quality, pH, water temperature, total organiccarbon, and bromide concentrations. The concentrations of HAAs were determined by afast headspace solid-phase microextraction GC method, which consists of liquid–liquidextraction, evaporation to dryness of extraction solvent then derivatization of the HAAsto their methyl haloacetates with sulfuric acid and methanol, followed by headspacesolid-phase microextraction with GC and electron capture detection. The results of theanalyses show the presence of HAAs in all chlorinatedwater samples. Themost prevalentHAAs were trichloroacetic acid (TCAA), dichloroacetic acid (DCAA), and monochloro-acetic acid (MCAA) due to the low concentrations of bromide in the water treatmentplant, while other HAAs were detected at low concentrations. The annual meansconcentrations of TCAA, DCAA and, MCAA varied from 3.9 to 26.25mg L�1, from 2.76 to23.19mg L�1, and from 6.65 to 34.07mg L�1, respectively. Seasonal variations in HAAswere mainly linked with changes in water temperature and variations of organicprecursors, with HAA occurrence at its highest in summer. In all samples theconcentrations of HAAs were lower than the maximum level set by the World HealthOrganization except for MCAA at the network extremity. Finally, a statisticallysignificant (p< 0.05) regression analysis was used to examine the correlation of HAA5
with respect to some water quality parameters. Strong correlations between (totalorganic carbon, water temperature and chlorine dose) with HAA5 were observed.
Keywords: Chlorination; Disinfection by-product; Water quality
Received: February 4, 2013; revised: July 2, 2013; accepted: July 14, 2013
DOI: 10.1002/clen.201300094
1 IntroductionChlorination is commonly used in the treatment of natural water forthe production of drinking water in Tunisia. Chlorine is one of themost widely used disinfectants, it is very effective for the deactivationof pathogenic microorganisms and it can be easily applied andcontrolled [1]. It is fairly persistent and relatively cheap [2]. Althoughresearch in the early 1970s showed that chlorine used both as anoxidant or disinfectant can interacts with natural organic matter
(NOM) present in drinking water supplies to form compounds knownas disinfectant by products (DBPs) [2, 3]. The main factors affecting
DBPs formation are pH, contact time, temperature, seasons,concentration of NOM which is generally measured as total organiccarbon (TOC) and UV absorption at 254nm (UV254) and theconcentration of chlorine and residual chlorine and concentrationof bromide [4–6]. The most common DBPs formed by chlorinedisinfection are trihalometanes (THMs) that constitute the majorfraction of volatile DBPs, and haloacetic acids (HAAs) which representthe major fraction of non-volatile DBPs [7, 8]. They are formed whenchlorine reacts with bromide (Br�) and NOM in source waters [9, 10].The presence of bromide ions in natural waters qualitatively affectsthe formation of DBP. Bromide ion is oxidized by chlorine tohypobromus acid or hypobromus ion, which reacts with residualchlorine and NOM to form brominated and mixed chloro–bromoderivatives, DBPs [11]. Thus, in water rich with bromide, brominatedspecies are the major species of DBPs formed during chlorination[12, 13]. The fraction of HAAs includes monochloro-, dichloro-, andtrichloroacetic acid (MCAA, DCAA, and TCAA); monobromo-,dibromo-, and tribromoacetic acids (MBAA, DBAA, TBAA) andbromochloro-, bromodichloro-, and dibromochloro acetic acids(BCAA, BDCAA, and DBCAA). Humans are more exposed to HAAsthan to THMs because they are less volatile than THMs (bp:�180°C vs.�60°C, respectively). Therefore a large number of epidemiologicalstudies have shown an association between the consumption of
Correspondence: Prof. M. R. Driss, Unité de recherche Chimie AnalytiqueAppliquée, 05/UR/12-03, Université de Carthage, Faculté des Sciences deBizerte, 7021 Zarzouna, TunisiaE-mail: [email protected]
Abbreviations: BCAA, bromochloroacetic acid; DBAA, dibromoacetic acid;DBP, disinfectant by product; DCAA, dichloroacetic acid; GC-ECD, gaschromatograph with electron capture detector; HAA, haloacetic acid; HS-SPME, headspace solid-phase microextraction; MBAA, monobromoaceticacid; MCAA, monochloroacetic acid;MCL, maximum contamination level;NOM, natural organic matter; TBAA, tribromoacetic acid; TCAA,trichloroacetic acid; THM, trihalometane; TOC, total organic carbon; USEPA, US Environmental Protection Agency; UV254, UV absorption at 254nm;WHO, World Health Organization; WTP, water treatment plant
1052
© 2013 WILEY-VCH Verlag GmbH & Co. KGaA, Weinheim www.clean-journal.com Clean – Soil, Air, Water 2014, 42 (8), 1052–1059
chlorinated drinking water, or exposure to it, and bladder, colon, andrectal cancer [14, 15]. Also, toxicology studies have shown HAAs andother DBPs to be carcinogenic or to cause adverse reproductiveor development effects in laboratory animals [14, 16]. The USEnvironmental Protection Agency (US EPA) [17] have set a maximumcontamination level (MCL) of 60mg L�1 for HAA5 (MCAA, DCAA, TCAA,MBAA, and DBAA), and the World Health Organization (WHO) haveestablished guideline values for MCAA, DCAA and TCAA at 20, 50,and 200mg L�1, respectively, in finished drinking water, though asprovisional [18]. Bromate has been besides considered by both theWHO and the US EPA as a probable carcinogen, even at very lowmg L�1 level [19, 20]. Therefore, the WHO favors a limit of 25mg L�1
bromate in drinking water [21]. The US EPA has established a MCLof 10mg L�1 for bromate in finished drinking water [20].Several studies were carried out in different places of the world,
to evaluate the distribution and determinations of HAAs. It wasconfirmed that the levels of HAAs in chlorinated waters differaccording to the disinfection process and chemicals which are:water source, pH, temperature, concentration of residual chlorine,residence time, reaction time, humic, and fulvic content, TOC andbromide concentration (Br�) [22–25]. HAAs levels are commonlymuch greater when surface water sources are used compared toground water source [26].Actually, a literary survey indicated that no studies focused on the
investigation of the existence, the occurrence and the formation ofHAAs in Tunisia and particularly in Bizerte’s water distributionsystems, as well as the best technique to control them. Previously areported work has focused on the occurrence of volatile DBPs (THMs)levels in Bizerte’s drinking water [27]. In return this survey includesthe determination of non-volatile DBPs (HAAs).The overall aim of the proposed survey was to provide the
knowledge and understanding of the occurrence and formation ofHAA compounds within Bizerte’s drinking water during a period of
summer and winter of two successive years (2008, 2009). The purposealso attempts to highlight the effects of seasonal variations of HAAsin the finished water of the water treatment plant (WTP) of Bizerteand to determine whether values exceed the maximum levelsrecommended by the US EPA and the WHO. Some regression analysiswas carried out in turn to estimate HAAs formation from a set ofparameters.The results of this paper will be useful in the future management
of the WTPs of Bizerte and will also be important for futureregulations in Tunisia.
2 Materials and methods
2.1 Standards and chemicals
Seven HAAs (MCAA, DCAA, TCAA, MBAA, DBAA, TBAA, and BCAA)were obtained from Fluka (Buchs, Switzerland) with purity>98%. Thesolvent methanol of residue analysis grade and sulfuric acid weresupplied by Fisher Scientific (Loughborough, UK), whereas anhydroussodium sulfate and methyl tert-butyl ether of residue analysis gradewere obtained from Fluka. Laboratory grade water was from Milli-Qwater purification system (Millipore, Bedford, MA). A manual solid-phase microextraction holder (no. 5-7304) fitted with 100mmpolydimethylsiloxane fiber is supplied by Supelco. The HAAsindividual aqueous standard solutions of 1000mgL�1 were preparedby weight in Milli-Q water. Themixtures aqueous standards solutionswere prepared weekly or daily, depending on their concentrations
before analysis and used for calibration and quantification studies.All solutions were stored in the dark at 4°C and warmed to ambienttemperature before use.
2.2 Sample preparation
Tap water (40mL) was placed in a 100mL flask, then the followingreagents were added: 2mL of concentrated sulfuric acid (so thatpH< 0.5), 15 g of anhydrous sodium sulfate and 3mL of methyl tert-butyl ether. The vial was sealed, vortex mixed for 5min and allowedto stand for 2min. Then, 2mL of the extract were transferred into3-mL screw-capped septum vial and evaporated to dryness under agentle stream of nitrogen (99.99% pure). After evaporation to dryness(4min), 0.1 g of anhydrous sodium sulfate, 30mL of concentratedsulfuric acid and 50mL of methanol were added to the dried vial,which was sealed with the septum. The solution was mixed withmagnetic agitator and the HAAs were derivatized at 55°C for 10min.After cooling, the vial was placed in a thermostatic bath at 25°C andthe 100-mmpolydimethylsiloxane fiber was exposed to the headspaceduring 10min to extract the haloacetic methyl esters. Finally, thecorresponding haloacetates were desorbed after 2min in the injectorport of the gas chromatograph (Agilent 6890) at 250°C.
2.3 Determination of HAAs
Concentrations were determined by an Agilent 6890 gas chromato-graph system equipped with a 63Ni electron capture detector(GC-ECD) operated by HP Chemstation software. The analytical
column purchased from Supelco (Bellefonte, PA, USA) was SPB-1701,coated with 14% cyanopropyl-phenyl, 86% dimethylpolysiloxane(30m� 0.32mm id, 0.25mm film thickness). The temperature ofthe injector and the detector were respectively 250 and 300°C, whilethe oven’s temperature was programmed as 40°C for 2min, thenincreased to 120°C at 5°Cmin�1 and then to 250°C at 25°Cmin�1 for10min. Heliumwas used as carrier gas with a flow rate 1.5mLmin�1.The injector was operated in the splitless mode. Nitrogen wasutilized as a make-up gas at 60mLmin�1.
2.4 Bromide determination
Bromide concentrations were measured using ion chromatography(Metrohm 792 Basic IC) fitted with an (Metrohm 6.2828.100, 150mm)column and an eluent composition of (1.28mM NaHCO3/0.48mMNa2CO3). Injection loop volume was 50mL. Bromide ions werequantified by conductivity and standards calibrations curves whichwere routinely run with standard concentrations of 10, 25, 100, and250mg L�1. The method detection limit was 2mg L�1.
2.5 TOC measurement
The TOC measurements were conducted with a Shimadzu TOC-5000equipped with a Pt catalyst (Shimadzu, Kyoto, Japan) according tothe combustion IR method as described in the standard methodsof 5310 B [28].
2.6 Description of treatment plant and samplinglocations
Bizerte WTP accepts water from a dam situated at 2 km which isfed by a watershed and sends water to approximately 500 000inhabitants, treating 103mLday�1 (Fig. 1). The treatment processinvolves coagulation, flocculation followed by decantation, sand
Assessment of Haloacetic Acids in Drinking Water 1053
© 2013 WILEY-VCH Verlag GmbH & Co. KGaA, Weinheim www.clean-journal.com Clean – Soil, Air, Water 2014, 42 (8), 1052–1059
filtration and chlorination. Chlorine was adopted as a disinfectantduring the experimental period and there were two chlorine-addingpoints, namely before coagulation and before entering clear watertank. Bizerte’s WTP supplies an exclusive distribution pipe networkand details of process and sampling points are given in Tab. 1.
2.7 Sample collection
To investigate the occurrence of HAAs within the distribution systemof Bizerte’s WTP, an eight months sampling program was undertaken during winter (December and February), summer (June andAugust) of 2008–2009. Representative points were selected forSample collection monthly: the raw water, after sand filtrationand from the finished water reservoir at Bizerte’s WTP as well asfrom seven representative points of the distribution system (Tab. 1).Sixty-eight samples were used in this study.
Water samples were collected using a 200-mL amber glass bottleswith PTFE-faced septa and propylene screw caps. Ammoniumchlorine (NH4Cl) as dechlorinating agent was added to the sampleto produce a concentration of 100mgL�1, headed for stop furtherchlorination by-products formation. All samples were transported tothe laboratory, transferred to a refrigerator at 4°C away from lightand analyzed within two days from being collected.
2.8 Statistical analysis
A statistical treatment of the obtained results was performed withSPSS software (SPSS 9.0 for Windows, SPSS). Pearson correlation was
used to examine the strength of associations between HAA levels andoperational parameters (pH, TOC, temperature chlorine dose, andbromide concentrations). Statistical significance was accepted atp< 0.05.
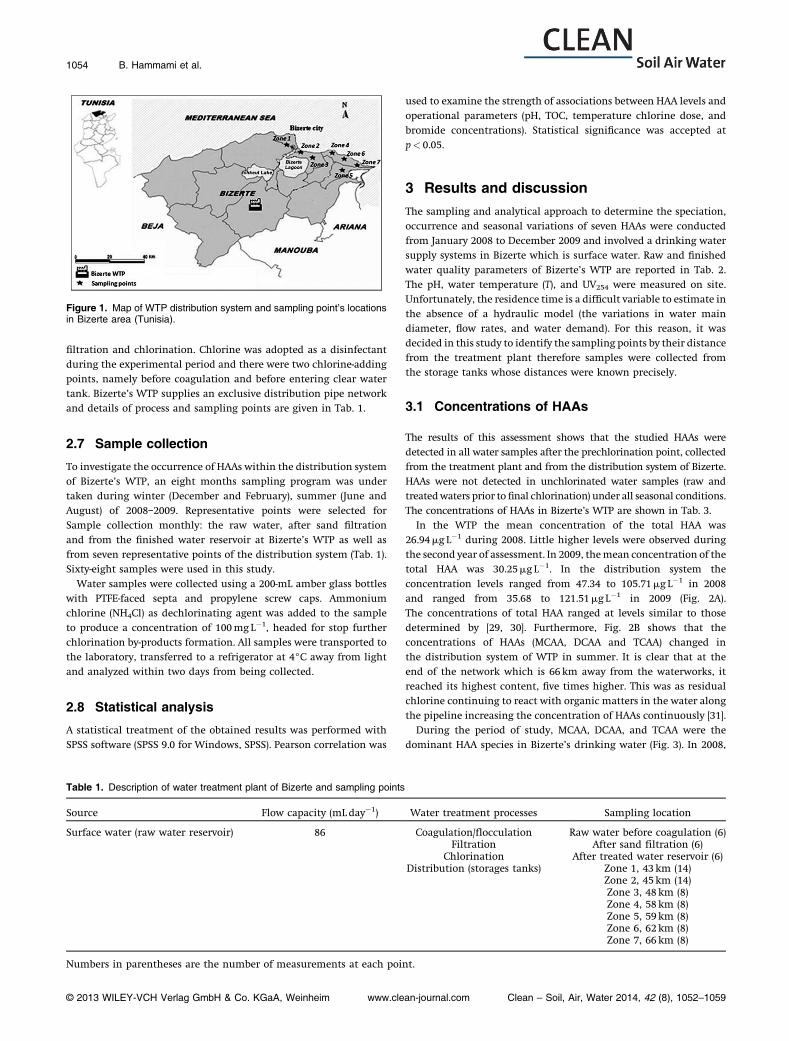
3 Results and discussionThe sampling and analytical approach to determine the speciation,occurrence and seasonal variations of seven HAAs were conductedfrom January 2008 to December 2009 and involved a drinking watersupply systems in Bizerte which is surface water. Raw and finishedwater quality parameters of Bizerte’s WTP are reported in Tab. 2.The pH, water temperature (T), and UV254 were measured on site.Unfortunately, the residence time is a difficult variable to estimate inthe absence of a hydraulic model (the variations in water maindiameter, flow rates, and water demand). For this reason, it wasdecided in this study to identify the sampling points by their distancefrom the treatment plant therefore samples were collected fromthe storage tanks whose distances were known precisely.
3.1 Concentrations of HAAs
The results of this assessment shows that the studied HAAs weredetected in all water samples after the prechlorination point, collectedfrom the treatment plant and from the distribution system of Bizerte.HAAs were not detected in unchlorinated water samples (raw andtreatedwaters prior to final chlorination) under all seasonal conditions.The concentrations of HAAs in Bizerte’s WTP are shown in Tab. 3.In the WTP the mean concentration of the total HAA was
26.94mg L�1 during 2008. Little higher levels were observed duringthe second year of assessment. In 2009, themean concentration of thetotal HAA was 30.25mg L�1. In the distribution system the
concentration levels ranged from 47.34 to 105.71mg L�1 in 2008and ranged from 35.68 to 121.51mg L�1 in 2009 (Fig. 2A).The concentrations of total HAA ranged at levels similar to thosedetermined by [29, 30]. Furthermore, Fig. 2B shows that theconcentrations of HAAs (MCAA, DCAA and TCAA) changed inthe distribution system of WTP in summer. It is clear that at theend of the network which is 66 km away from the waterworks, itreached its highest content, five times higher. This was as residualchlorine continuing to react with organic matters in the water alongthe pipeline increasing the concentration of HAAs continuously [31].During the period of study, MCAA, DCAA, and TCAA were the
dominant HAA species in Bizerte’s drinking water (Fig. 3). In 2008,
Figure 1. Map of WTP distribution system and sampling point’s locationsin Bizerte area (Tunisia).
Table 1. Description of water treatment plant of Bizerte and sampling points
Source Flow capacity (mLday�1) Water treatment processes Sampling location
Surface water (raw water reservoir) 86 Coagulation/flocculation Raw water before coagulation (6)Filtration After sand filtration (6)
Chlorination After treated water reservoir (6)Distribution (storages tanks) Zone 1, 43 km (14)
Zone 2, 45 km (14)Zone 3, 48 km (8)Zone 4, 58 km (8)Zone 5, 59 km (8)Zone 6, 62 km (8)Zone 7, 66 km (8)
Numbers in parentheses are the number of measurements at each point.
1054 B. Hammami et al.
© 2013 WILEY-VCH Verlag GmbH & Co. KGaA, Weinheim www.clean-journal.com Clean – Soil, Air, Water 2014, 42 (8), 1052–1059
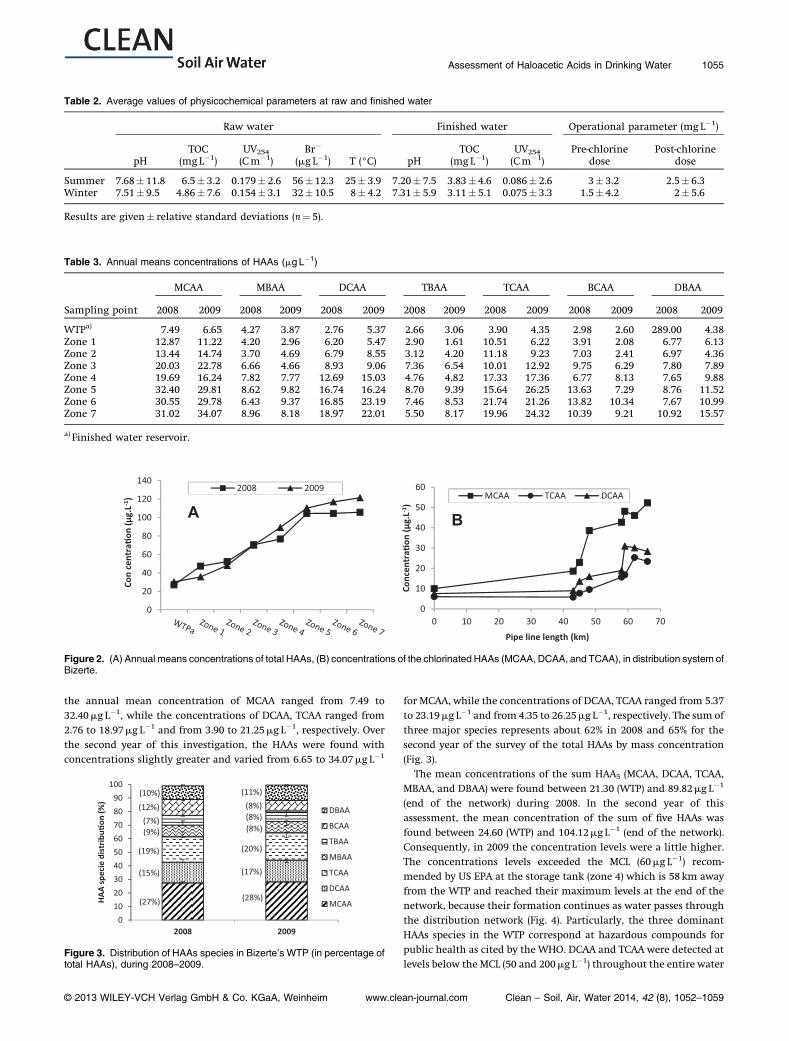
the annual mean concentration of MCAA ranged from 7.49 to32.40mg L�1, while the concentrations of DCAA, TCAA ranged from2.76 to 18.97mg L�1 and from 3.90 to 21.25mg L�1, respectively. Overthe second year of this investigation, the HAAs were found withconcentrations slightly greater and varied from 6.65 to 34.07mg L�1
for MCAA, while the concentrations of DCAA, TCAA ranged from 5.37to 23.19mg L�1 and from 4.35 to 26.25mg L�1, respectively. The sum ofthree major species represents about 62% in 2008 and 65% for thesecond year of the survey of the total HAAs by mass concentration(Fig. 3).The mean concentrations of the sum HAA5 (MCAA, DCAA, TCAA,
MBAA, and DBAA) were found between 21.30 (WTP) and 89.82mg L�1
(end of the network) during 2008. In the second year of thisassessment, the mean concentration of the sum of five HAAs wasfound between 24.60 (WTP) and 104.12mg L�1 (end of the network).Consequently, in 2009 the concentration levels were a little higher.The concentrations levels exceeded the MCL (60mg L�1) recom-mended by US EPA at the storage tank (zone 4) which is 58 km awayfrom the WTP and reached their maximum levels at the end of thenetwork, because their formation continues as water passes throughthe distribution network (Fig. 4). Particularly, the three dominantHAAs species in the WTP correspond at hazardous compounds forpublic health as cited by the WHO. DCAA and TCAA were detected atlevels below the MCL (50 and 200mg L�1) throughout the entire water
Table 2. Average values of physicochemical parameters at raw and finished water
Raw water Finished water Operational parameter (mgL�1)
pHTOC
(mg L�1)UV254(Cm�1)
Br�
(mg L�1) T (°C) pHTOC
(mg L�1)UV254(Cm�1)
Pre-chlorinedose
Post-chlorinedose
Summer 7.68� 11.8 6.5� 3.2 0.179� 2.6 56� 12.3 25� 3.9 7.20� 7.5 3.83� 4.6 0.086� 2.6 3� 3.2 2.5� 6.3Winter 7.51� 9.5 4.86� 7.6 0.154� 3.1 32� 10.5 8� 4.2 7.31� 5.9 3.11� 5.1 0.075� 3.3 1.5� 4.2 2� 5.6
Results are given� relative standard deviations (n¼ 5).
Table 3. Annual means concentrations of HAAs (mg L�1)
Sampling point
MCAA MBAA DCAA TBAA TCAA BCAA DBAA
2008 2009 2008 2009 2008 2009 2008 2009 2008 2009 2008 2009 2008 2009
WTPa) 7.49 6.65 4.27 3.87 2.76 5.37 2.66 3.06 3.90 4.35 2.98 2.60 289.00 4.38Zone 1 12.87 11.22 4.20 2.96 6.20 5.47 2.90 1.61 10.51 6.22 3.91 2.08 6.77 6.13Zone 2 13.44 14.74 3.70 4.69 6.79 8.55 3.12 4.20 11.18 9.23 7.03 2.41 6.97 4.36Zone 3 20.03 22.78 6.66 4.66 8.93 9.06 7.36 6.54 10.01 12.92 9.75 6.29 7.80 7.89Zone 4 19.69 16.24 7.82 7.77 12.69 15.03 4.76 4.82 17.33 17.36 6.77 8.13 7.65 9.88Zone 5 32.40 29.81 8.62 9.82 16.74 16.24 8.70 9.39 15.64 26.25 13.63 7.29 8.76 11.52Zone 6 30.55 29.78 6.43 9.37 16.85 23.19 7.46 8.53 21.74 21.26 13.82 10.34 7.67 10.99Zone 7 31.02 34.07 8.96 8.18 18.97 22.01 5.50 8.17 19.96 24.32 10.39 9.21 10.92 15.57
a) Finished water reservoir.
A B
0
20
40
60
80
100
120
140
Con
cent
ra�o
n (µ
g.L-1
)
2008 2009
0
10
20
30
40
50
60
0 10 20 30 40 50 60 70
Conc
entr
a�on
(µg.
L-1)
Pipe line length (km)
MCAA TCAA DCAA
Figure 2. (A) Annual means concentrations of total HAAs, (B) concentrations of the chlorinated HAAs (MCAA, DCAA, and TCAA), in distribution system ofBizerte.
(27%) (28%)
(15%) (17%)
(19%) (20%)
(9%) (8%)(7%) (8%)
(12%) (8%)(10%) (11%)
0102030405060708090
100
2008 2009
HAA
spec
ie d
istr
ibu�
on (%
)
DBAA
BCAA
TBAA
MBAA
TCAA
DCAA
MCAA
Figure 3. Distribution of HAAs species in Bizerte’s WTP (in percentage oftotal HAAs), during 2008–2009.
Assessment of Haloacetic Acids in Drinking Water 1055
© 2013 WILEY-VCH Verlag GmbH & Co. KGaA, Weinheim www.clean-journal.com Clean – Soil, Air, Water 2014, 42 (8), 1052–1059
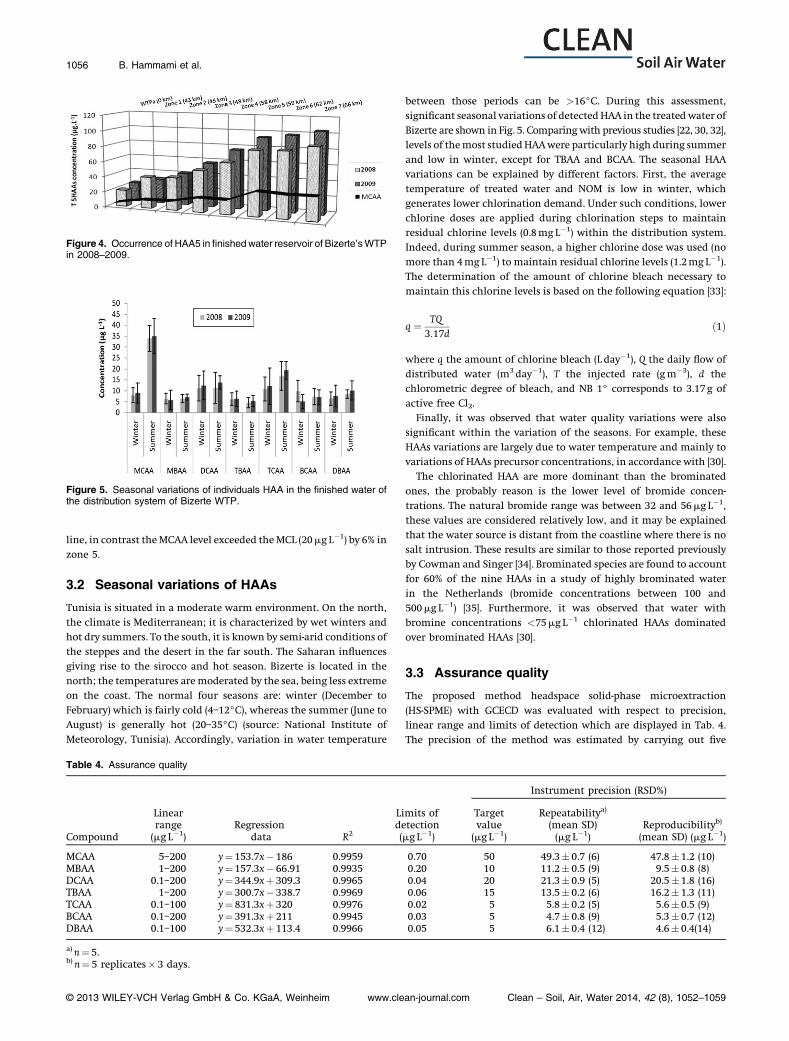
line, in contrast theMCAA level exceeded theMCL (20mg L�1) by 6% inzone 5.
3.2 Seasonal variations of HAAs
Tunisia is situated in a moderate warm environment. On the north,the climate is Mediterranean; it is characterized by wet winters andhot dry summers. To the south, it is known by semi-arid conditions ofthe steppes and the desert in the far south. The Saharan influencesgiving rise to the sirocco and hot season. Bizerte is located in thenorth; the temperatures aremoderated by the sea, being less extremeon the coast. The normal four seasons are: winter (December toFebruary) which is fairly cold (4–12°C), whereas the summer (June toAugust) is generally hot (20–35°C) (source: National Institute ofMeteorology, Tunisia). Accordingly, variation in water temperature
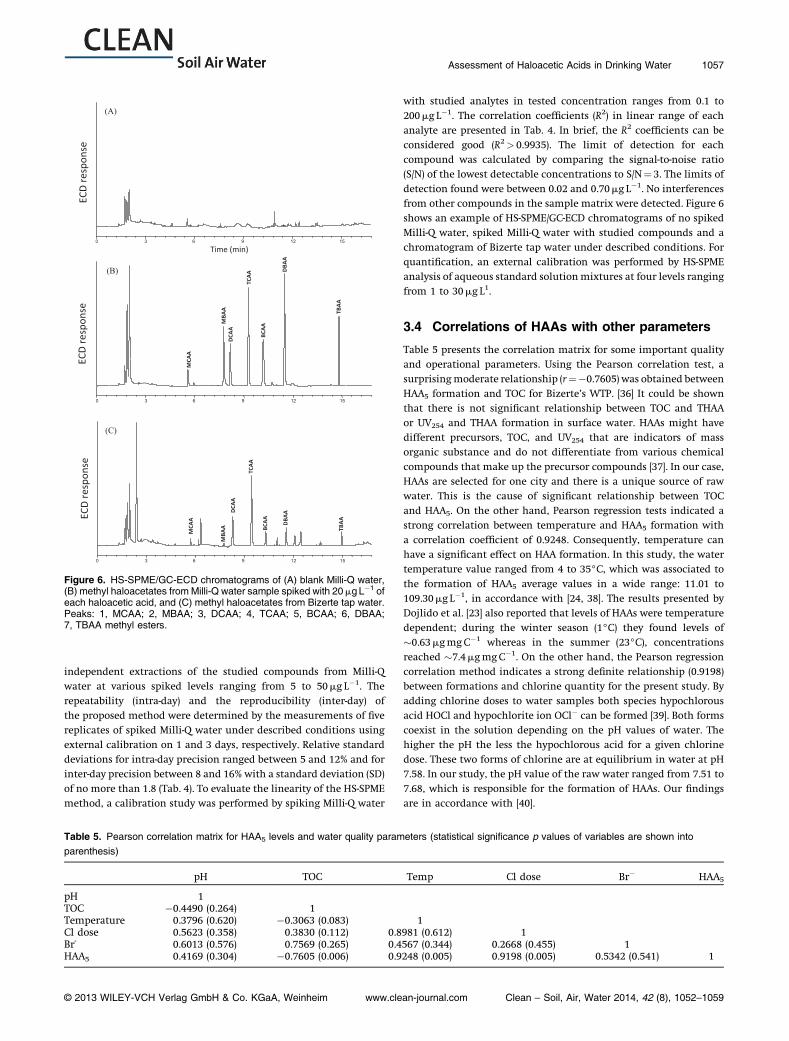
between those periods can be >16°C. During this assessment,significant seasonal variations of detectedHAA in the treated water ofBizerte are shown in Fig. 5. Comparingwith previous studies [22, 30, 32],levels of themost studiedHAAwere particularly high during summerand low in winter, except for TBAA and BCAA. The seasonal HAAvariations can be explained by different factors. First, the averagetemperature of treated water and NOM is low in winter, whichgenerates lower chlorination demand. Under such conditions, lowerchlorine doses are applied during chlorination steps to maintainresidual chlorine levels (0.8mg L�1) within the distribution system.Indeed, during summer season, a higher chlorine dose was used (nomore than 4mg L�1) to maintain residual chlorine levels (1.2mg L�1).The determination of the amount of chlorine bleach necessary tomaintain this chlorine levels is based on the following equation [33]:
q ¼ TQ3:17d
ð1Þ
where q the amount of chlorine bleach (L day�1), Q the daily flow ofdistributed water (m3 day�1), T the injected rate (gm�3), d thechlorometric degree of bleach, and NB 1° corresponds to 3.17 g ofactive free Cl2.Finally, it was observed that water quality variations were also
significant within the variation of the seasons. For example, theseHAAs variations are largely due to water temperature and mainly tovariations of HAAs precursor concentrations, in accordance with [30].The chlorinated HAA are more dominant than the brominated
ones, the probably reason is the lower level of bromide concen-trations. The natural bromide range was between 32 and 56mg L�1,these values are considered relatively low, and it may be explainedthat the water source is distant from the coastline where there is nosalt intrusion. These results are similar to those reported previouslyby Cowman and Singer [34]. Brominated species are found to accountfor 60% of the nine HAAs in a study of highly brominated waterin the Netherlands (bromide concentrations between 100 and500mg L�1) [35]. Furthermore, it was observed that water withbromine concentrations <75mg L�1 chlorinated HAAs dominatedover brominated HAAs [30].
3.3 Assurance quality
The proposed method headspace solid-phase microextraction
(HS-SPME) with GCECD was evaluated with respect to precision,linear range and limits of detection which are displayed in Tab. 4.The precision of the method was estimated by carrying out five
Figure 4. Occurrence of HAA5 in finished water reservoir of Bizerte’sWTPin 2008–2009.
Figure 5. Seasonal variations of individuals HAA in the finished water ofthe distribution system of Bizerte WTP.
Table 4. Assurance quality
Compound
Linearrange(mg L�1)
Regressiondata R2
Limits ofdetection(mg L�1)
Instrument precision (RSD%)
Targetvalue(mg L�1)
Repeatabilitya)
(mean SD)(mg L�1)
Reproducibilityb)
(mean SD) (mg L�1)
MCAA 5–200 y¼ 153.7x� 186 0.9959 0.70 50 49.3� 0.7 (6) 47.8� 1.2 (10)MBAA 1–200 y¼ 157.3x� 66.91 0.9935 0.20 10 11.2� 0.5 (9) 9.5� 0.8 (8)DCAA 0.1–200 y¼ 344.9xþ 309.3 0.9965 0.04 20 21.3� 0.9 (5) 20.5� 1.8 (16)TBAA 1–200 y¼ 300.7x� 338.7 0.9969 0.06 15 13.5� 0.2 (6) 16.2� 1.3 (11)TCAA 0.1–100 y¼ 831.3xþ 320 0.9976 0.02 5 5.8� 0.2 (5) 5.6� 0.5 (9)BCAA 0.1–200 y¼ 391.3xþ 211 0.9945 0.03 5 4.7� 0.8 (9) 5.3� 0.7 (12)DBAA 0.1–100 y¼ 532.3xþ 113.4 0.9966 0.05 5 6.1� 0.4 (12) 4.6� 0.4(14)
a) n¼ 5.b) n¼ 5 replicates� 3 days.
1056 B. Hammami et al.
© 2013 WILEY-VCH Verlag GmbH & Co. KGaA, Weinheim www.clean-journal.com Clean – Soil, Air, Water 2014, 42 (8), 1052–1059
independent extractions of the studied compounds from Milli-Qwater at various spiked levels ranging from 5 to 50mg L�1. Therepeatability (intra-day) and the reproducibility (inter-day) ofthe proposed method were determined by the measurements of fivereplicates of spiked Milli-Q water under described conditions usingexternal calibration on 1 and 3 days, respectively. Relative standarddeviations for intra-day precision ranged between 5 and 12% and forinter-day precision between 8 and 16% with a standard deviation (SD)of no more than 1.8 (Tab. 4). To evaluate the linearity of the HS-SPMEmethod, a calibration study was performed by spiking Milli-Q water
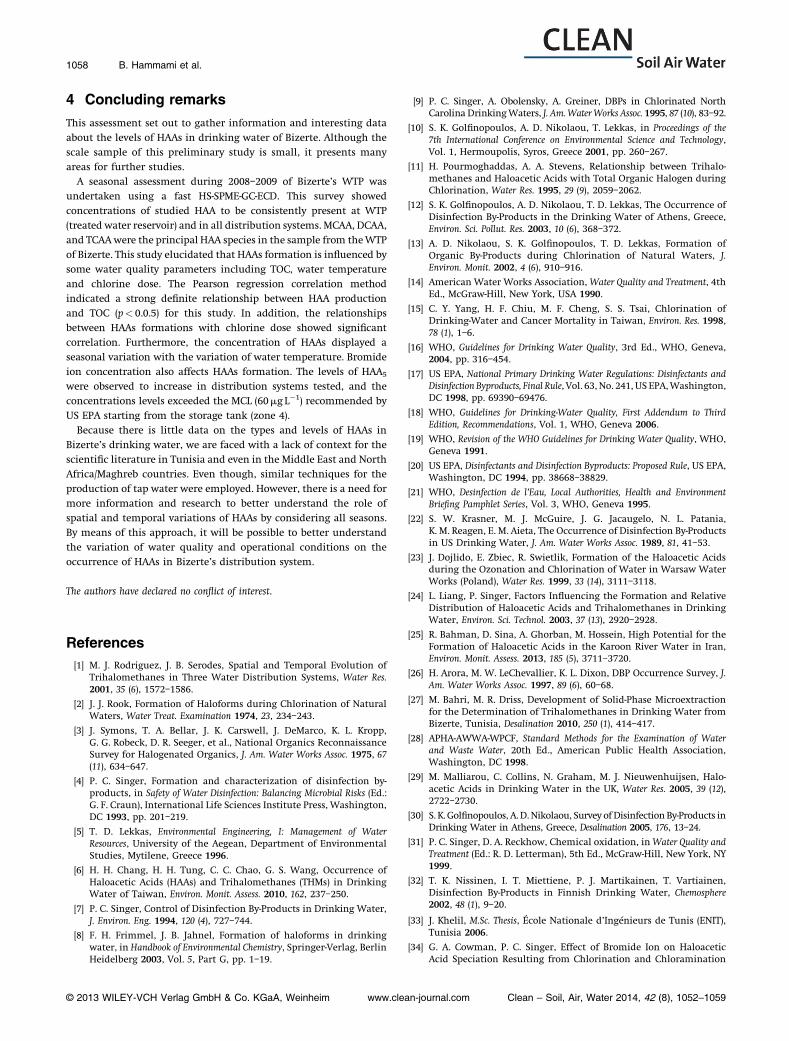
with studied analytes in tested concentration ranges from 0.1 to200mg L�1. The correlation coefficients (R2) in linear range of eachanalyte are presented in Tab. 4. In brief, the R2 coefficients can beconsidered good (R2> 0.9935). The limit of detection for eachcompound was calculated by comparing the signal-to-noise ratio(S/N) of the lowest detectable concentrations to S/N¼ 3. The limits ofdetection found were between 0.02 and 0.70mg L�1. No interferencesfrom other compounds in the sample matrix were detected. Figure 6shows an example of HS-SPME/GC-ECD chromatograms of no spikedMilli-Q water, spiked Milli-Q water with studied compounds and achromatogram of Bizerte tap water under described conditions. Forquantification, an external calibration was performed by HS-SPMEanalysis of aqueous standard solutionmixtures at four levels rangingfrom 1 to 30mg L1.
3.4 Correlations of HAAs with other parameters
Table 5 presents the correlation matrix for some important qualityand operational parameters. Using the Pearson correlation test, asurprisingmoderate relationship (r¼�0.7605) was obtained betweenHAA5 formation and TOC for Bizerte’s WTP. [36] It could be shownthat there is not significant relationship between TOC and THAAor UV254 and THAA formation in surface water. HAAs might havedifferent precursors, TOC, and UV254 that are indicators of massorganic substance and do not differentiate from various chemicalcompounds that make up the precursor compounds [37]. In our case,HAAs are selected for one city and there is a unique source of rawwater. This is the cause of significant relationship between TOCand HAA5. On the other hand, Pearson regression tests indicated astrong correlation between temperature and HAA5 formation witha correlation coefficient of 0.9248. Consequently, temperature canhave a significant effect on HAA formation. In this study, the watertemperature value ranged from 4 to 35°C, which was associated to
the formation of HAA5 average values in a wide range: 11.01 to109.30mg L�1, in accordance with [24, 38]. The results presented byDojlido et al. [23] also reported that levels of HAAs were temperaturedependent; during the winter season (1°C) they found levels of�0.63mgmgC�1 whereas in the summer (23°C), concentrationsreached �7.4mgmgC�1. On the other hand, the Pearson regressioncorrelation method indicates a strong definite relationship (0.9198)between formations and chlorine quantity for the present study. Byadding chlorine doses to water samples both species hypochlorousacid HOCl and hypochlorite ion OCl� can be formed [39]. Both formscoexist in the solution depending on the pH values of water. Thehigher the pH the less the hypochlorous acid for a given chlorinedose. These two forms of chlorine are at equilibrium in water at pH7.58. In our study, the pH value of the raw water ranged from 7.51 to7.68, which is responsible for the formation of HAAs. Our findingsare in accordance with [40].
(A)
Time (min)0 3 6 9 12 15
ECD
resp
onse
(B)
ECD
resp
onse
0 3 6 9 12 15
MCA
A
MBA
A D
CAA
TCAA
BCAA
DBA
A
TBAA
ECD
resp
onse
(C)
0 3 6 9 12 15
MCA
A
MBA
A
DCA
A
TCAA
BCAA
DBA
A
TBAA
Figure 6. HS-SPME/GC-ECD chromatograms of (A) blank Milli-Q water,(B) methyl haloacetates from Milli-Q water sample spiked with 20mg L�1 ofeach haloacetic acid, and (C) methyl haloacetates from Bizerte tap water.Peaks: 1, MCAA; 2, MBAA; 3, DCAA; 4, TCAA; 5, BCAA; 6, DBAA;7, TBAA methyl esters.
Table 5. Pearson correlation matrix for HAA5 levels and water quality parameters (statistical significance p values of variables are shown intoparenthesis)
pH TOC Temp Cl dose Br� HAA5
pH 1TOC �0.4490 (0.264) 1Temperature 0.3796 (0.620) �0.3063 (0.083) 1Cl dose 0.5623 (0.358) 0.3830 (0.112) 0.8981 (0.612) 1Br- 0.6013 (0.576) 0.7569 (0.265) 0.4567 (0.344) 0.2668 (0.455) 1HAA5 0.4169 (0.304) �0.7605 (0.006) 0.9248 (0.005) 0.9198 (0.005) 0.5342 (0.541) 1
Assessment of Haloacetic Acids in Drinking Water 1057
© 2013 WILEY-VCH Verlag GmbH & Co. KGaA, Weinheim www.clean-journal.com Clean – Soil, Air, Water 2014, 42 (8), 1052–1059
4 Concluding remarksThis assessment set out to gather information and interesting dataabout the levels of HAAs in drinking water of Bizerte. Although thescale sample of this preliminary study is small, it presents manyareas for further studies.A seasonal assessment during 2008–2009 of Bizerte’s WTP was
undertaken using a fast HS-SPME-GC-ECD. This survey showedconcentrations of studied HAA to be consistently present at WTP(treated water reservoir) and in all distribution systems. MCAA, DCAA,and TCAAwere the principal HAA species in the sample from theWTPof Bizerte. This study elucidated that HAAs formation is influenced bysome water quality parameters including TOC, water temperatureand chlorine dose. The Pearson regression correlation methodindicated a strong definite relationship between HAA productionand TOC (p< 0.0.5) for this study. In addition, the relationshipsbetween HAAs formations with chlorine dose showed significantcorrelation. Furthermore, the concentration of HAAs displayed aseasonal variation with the variation of water temperature. Bromideion concentration also affects HAAs formation. The levels of HAA5
were observed to increase in distribution systems tested, and theconcentrations levels exceeded the MCL (60mg L�1) recommended byUS EPA starting from the storage tank (zone 4).Because there is little data on the types and levels of HAAs in
Bizerte’s drinking water, we are faced with a lack of context for thescientific literature in Tunisia and even in the Middle East and NorthAfrica/Maghreb countries. Even though, similar techniques for theproduction of tap water were employed. However, there is a need formore information and research to better understand the role ofspatial and temporal variations of HAAs by considering all seasons.By means of this approach, it will be possible to better understandthe variation of water quality and operational conditions on theoccurrence of HAAs in Bizerte’s distribution system.
The authors have declared no conflict of interest.
References[1] M. J. Rodriguez, J. B. Serodes, Spatial and Temporal Evolution of
Trihalomethanes in Three Water Distribution Systems, Water Res.2001, 35 (6), 1572–1586.
[2] J. J. Rook, Formation of Haloforms during Chlorination of NaturalWaters, Water Treat. Examination 1974, 23, 234–243.
[3] J. Symons, T. A. Bellar, J. K. Carswell, J. DeMarco, K. L. Kropp,G. G. Robeck, D. R. Seeger, et al., National Organics ReconnaissanceSurvey for Halogenated Organics, J. Am. Water Works Assoc. 1975, 67(11), 634–647.
[4] P. C. Singer, Formation and characterization of disinfection by-products, in Safety of Water Disinfection: Balancing Microbial Risks (Ed.:G. F. Craun), International Life Sciences Institute Press, Washington,DC 1993, pp. 201–219.
[5] T. D. Lekkas, Environmental Engineering, I: Management of WaterResources, University of the Aegean, Department of EnvironmentalStudies, Mytilene, Greece 1996.
[6] H. H. Chang, H. H. Tung, C. C. Chao, G. S. Wang, Occurrence ofHaloacetic Acids (HAAs) and Trihalomethanes (THMs) in DrinkingWater of Taiwan, Environ. Monit. Assess. 2010, 162, 237–250.
[7] P. C. Singer, Control of Disinfection By-Products in Drinking Water,J. Environ. Eng. 1994, 120 (4), 727–744.
[8] F. H. Frimmel, J. B. Jahnel, Formation of haloforms in drinkingwater, in Handbook of Environmental Chemistry, Springer-Verlag, BerlinHeidelberg 2003, Vol. 5, Part G, pp. 1–19.
[9] P. C. Singer, A. Obolensky, A. Greiner, DBPs in Chlorinated NorthCarolina DrinkingWaters, J. Am. Water Works Assoc. 1995, 87 (10), 83–92.
[10] S. K. Golfinopoulos, A. D. Nikolaou, T. Lekkas, in Proceedings of the7th International Conference on Environmental Science and Technology,Vol. 1, Hermoupolis, Syros, Greece 2001, pp. 260–267.
[11] H. Pourmoghaddas, A. A. Stevens, Relationship between Trihalo-methanes and Haloacetic Acids with Total Organic Halogen duringChlorination, Water Res. 1995, 29 (9), 2059–2062.
[12] S. K. Golfinopoulos, A. D. Nikolaou, T. D. Lekkas, The Occurrence ofDisinfection By-Products in the Drinking Water of Athens, Greece,Environ. Sci. Pollut. Res. 2003, 10 (6), 368–372.
[13] A. D. Nikolaou, S. K. Golfinopoulos, T. D. Lekkas, Formation ofOrganic By-Products during Chlorination of Natural Waters, J.Environ. Monit. 2002, 4 (6), 910–916.
[14] American Water Works Association, Water Quality and Treatment, 4thEd., McGraw-Hill, New York, USA 1990.
[15] C. Y. Yang, H. F. Chiu, M. F. Cheng, S. S. Tsai, Chlorination ofDrinking-Water and Cancer Mortality in Taiwan, Environ. Res. 1998,78 (1), 1–6.
[16] WHO, Guidelines for Drinking Water Quality, 3rd Ed., WHO, Geneva,2004, pp. 316–454.
[17] US EPA, National Primary Drinking Water Regulations: Disinfectants andDisinfection Byproducts, Final Rule, Vol. 63, No. 241, US EPA,Washington,DC 1998, pp. 69390–69476.
[18] WHO, Guidelines for Drinking-Water Quality, First Addendum to ThirdEdition, Recommendations, Vol. 1, WHO, Geneva 2006.
[19] WHO, Revision of the WHO Guidelines for Drinking Water Quality, WHO,Geneva 1991.
[20] US EPA, Disinfectants and Disinfection Byproducts: Proposed Rule, US EPA,Washington, DC 1994, pp. 38668–38829.
[21] WHO, Desinfection de l’Eau, Local Authorities, Health and EnvironmentBriefing Pamphlet Series, Vol. 3, WHO, Geneva 1995.
[22] S. W. Krasner, M. J. McGuire, J. G. Jacaugelo, N. L. Patania,K. M. Reagen, E. M. Aieta, The Occurrence of Disinfection By-Productsin US Drinking Water, J. Am. Water Works Assoc. 1989, 81, 41–53.
[23] J. Dojlido, E. Zbiec, R. Swietlik, Formation of the Haloacetic Acidsduring the Ozonation and Chlorination of Water in Warsaw WaterWorks (Poland), Water Res. 1999, 33 (14), 3111–3118.
[24] L. Liang, P. Singer, Factors Influencing the Formation and RelativeDistribution of Haloacetic Acids and Trihalomethanes in DrinkingWater, Environ. Sci. Technol. 2003, 37 (13), 2920–2928.
[25] R. Bahman, D. Sina, A. Ghorban, M. Hossein, High Potential for theFormation of Haloacetic Acids in the Karoon River Water in Iran,Environ. Monit. Assess. 2013, 185 (5), 3711–3720.
[26] H. Arora, M. W. LeChevallier, K. L. Dixon, DBP Occurrence Survey, J.Am. Water Works Assoc. 1997, 89 (6), 60–68.
[27] M. Bahri, M. R. Driss, Development of Solid-Phase Microextractionfor the Determination of Trihalomethanes in Drinking Water fromBizerte, Tunisia, Desalination 2010, 250 (1), 414–417.
[28] APHA-AWWA-WPCF, Standard Methods for the Examination of Waterand Waste Water, 20th Ed., American Public Health Association,Washington, DC 1998.
[29] M. Malliarou, C. Collins, N. Graham, M. J. Nieuwenhuijsen, Halo-acetic Acids in Drinking Water in the UK, Water Res. 2005, 39 (12),2722–2730.
[30] S. K. Golfinopoulos, A. D. Nikolaou, Survey of Disinfection By-Products inDrinking Water in Athens, Greece, Desalination 2005, 176, 13–24.
[31] P. C. Singer, D. A. Reckhow, Chemical oxidation, inWater Quality andTreatment (Ed.: R. D. Letterman), 5th Ed., McGraw-Hill, New York, NY1999.
[32] T. K. Nissinen, I. T. Miettiene, P. J. Martikainen, T. Vartiainen,Disinfection By-Products in Finnish Drinking Water, Chemosphere2002, 48 (1), 9–20.
[33] J. Khelil, M.Sc. Thesis, École Nationale d’Ingénieurs de Tunis (ENIT),Tunisia 2006.
[34] G. A. Cowman, P. C. Singer, Effect of Bromide Ion on HaloaceticAcid Speciation Resulting from Chlorination and Chloramination
1058 B. Hammami et al.
© 2013 WILEY-VCH Verlag GmbH & Co. KGaA, Weinheim www.clean-journal.com Clean – Soil, Air, Water 2014, 42 (8), 1052–1059
of Aquatic Humic Substances, Environ. Sci. Technol. 1996, 30 (1),16–24.
[35] R. J. B. Peters, C. Erkelens, E. W. B. De Leer, L. De Galan, The Analysisof Halogenated Acids in Dutch Drinking Water, Water Res. 1991,25 (4), 473–477.
[36] D. A. Reckhow, P. C. Singer, R. L. Malcolm, Chlorination of HumicMaterails: Byproduct Formation and Chemical Interpretations,Environ. Sci. Technol. 1990, 24 (11), 1655–1664.
[37] US EPA, Controlling Disinfection By-products and Microbial Contaminantsin Drinking Water, EPA-600-R-01-110, United States EnvironmentalProtection Agency, Washington, DC 2001.
[38] M. P. Abdullah, C. H. Yew, M. S. B. Ramli, Formation, Modelingand Validation of Trihalomethanes (THM) in Malaysian DrinkingWater: A Case Study in the Districts of Tampin, Negeri Sembilan andSabak Bernam, Selangor, Malaysia, Water Res. 2003, 37 (19), 4637–4644.
[39] G. C. White, Handbook of Chlorination and Alternative Disinfections, 3rdEd., Van Nostrand Reinhold, New York 1992.
[40] S. W. Krasner, Chemistry of disinfection by-product formation, inFormation and Control of Disinfection By-Product in Drinking Water (Ed.:P. C. Singer), American Water Works Association, Denver, CO 1999,27pp.
Assessment of Haloacetic Acids in Drinking Water 1059
© 2013 WILEY-VCH Verlag GmbH & Co. KGaA, Weinheim www.clean-journal.com Clean – Soil, Air, Water 2014, 42 (8), 1052–1059