assessment of genetic diversity on - withanomics thesis/msc thesis/msc 2008... · assessment of...
TRANSCRIPT

25
Assessment of Genetic diversity on
Withania somnifera using Random Amplified
Polymorphic DNA (RAPD) Analysis
By
D.VIJAYALAKSHMI
(06PBT22)
A Thesis Submitted to the Avinashilingam University for Women,
Coimbatore- 641043.
In partial fulfillment of the requirement for the degree of
MASTER OF SCIENCE IN BIOTECHNOLOGY
May 2008

26
Assessment of Genetic diversity on
Withania somnifera using Random Amplified
Polymorphic DNA (RAPD) Analysis
By
D.VIJAYALAKSHMI
(06PBT22)
A Thesis Submitted to the Avinashilingam University for Women,
Coimbatore- 641043.
In partial fulfillment of the requirement for the degree of
MASTER OF SCIENCE IN BIOTECHNOLOGY
May 2008

27
ACKNOWLEDGEMENT
28
ACKNOWLEDGEMENT
First of all, I thank God almighty for the blessings showered
upon me to complete my project work completely.
I convey my deep sense of gratitude to Dr. T.K. Shunmugnantham,
Chancellor, Avinashilingam University for Women, Coimbatore, for providing
me with the opportunity to carry out the study in this Institution.
I express my sincere thanks to Dr. Saroja Prabhakaran, Vice-
Chancellor, Dr.Gowri Ramakrishnan, Registrar, Avinashilingam University
for Women, Coimbatore, for the support and timely help extended during the
course of the research work.
I owe my sincere thanks to Dr. R.Parvatham, Dean, Faculty of
Science, Professor and Head of the Department of Biochemistry,
Biotechnology and Bioinformatics, Avinashilingam University for Women,
Coimbatore, for her moral support, motivation and encouragement given
throughout the study period.
My deep-felt thanks to Dr. K.Kalaiselvi, Lecturer, Department of
Biochemistry, Biotechnology and Bioinformatics, Avinashilingam University
for Women, Coimbatore, for her guidance rendered at every stage of
dissertation, dynamic guidance, valuable suggestions, kind advice, untiring
help, meticulous efforts and enduring support throughout the work.

29
I wish to express my gratitude thanks to the all staff members of the
Department of Biochemistry, Biotechnology and Bioinformatics,
Avinashilingam University for Women, Coimbatore, for their superior help.
I express my special thanks to Dr. Senthil.N of Tamil Nadu
Agricultural University, Coimbatore, for his timely help rendered during the
completion of the thesis.
I express my profound gratitude and thanks to Dr. D.Thangamani,
scientist-C, Institute of Forest Genetics and Tree Breeding, Coimbatore, for her
patient guidance, constructive criticisms, inspiring and kind advice, constant
support and meticulous care and deep concern in the completion of this study.
I wish to express my heart-felt thanks to Mr.Rajesh kumar,
Ms.S.Vijaya devi and my friends for their support rendered throughout the
study.
Finally, I am short of words to express my thanks to my family who are
with me in all my endeavors.

30
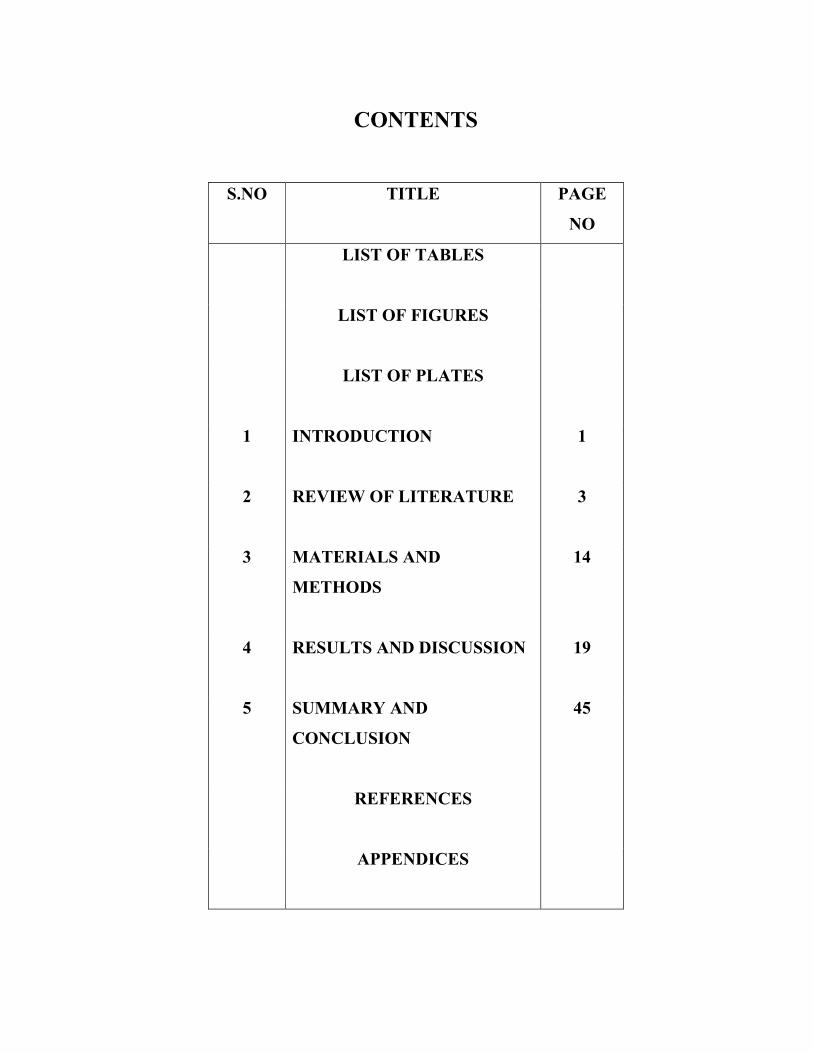
CONTENTS
31
CONTENTS
PAGE
NO
TITLE S.NO
LIST OF TABLES
LIST OF FIGURES
LIST OF PLATES
1 INTRODUCTION
1
3 REVIEW OF LITERATURE
2
14 MATERIALS AND
METHODS
3
19 RESULTS AND DISCUSSION
4
45 SUMMARY AND
CONCLUSION
5
REFERENCES
APPENDICES

32
LIST OF TABLES
TABLE
NO
TITLE PAGE
NO
3.1 Withania somnifera used in the study
15
4.1 Morphological traits for the four varieties
of Withania somnifera
23
4.2 Descriptive statistics of quantitative traits
24
4.3 DNA ratios
27
4.4 Data matrix
34
4.5 Polymorphism in Withania somnifera using
nine RAPD markers
37
4.6 Dissimilarity index computed for the
morphological traits
40
4.7 Cluster based on morphological traits
Dendrogram
40
4.8 Similarity index computed for the RAPD
data
42
4.9 Cluster analysis based on RAPD markers
Dendrogram
42

33
LIST OF FIGURES
FIGURE
NO
TITLE PAGE
NO
4.1 Morphological characters of Withania
somnifera used in the study
26
4.2 DNA quantification
28
4.3 RAPD profile using Primer OPO 13
29
4.4 RAPD profile using Primer OPR 13
30
4.5 RAPD profile using Primer OPO 20
30
4.6 RAPD profile using Primer OPO 08
31
4.7 RAPD profile using Primer OPO 09
31
4.8 RAPD profile using Primer OPO 10
32
4.9 RAPD profile using Primer OPB 04
32
4.10 RAPD profile using Primer OPE 04
33
4.11 RAPD profile using Primer OPM 02
33
4.12 Dendrogram of Withania somnifera
genotypes based on the Morphological
characters
41
4.13 Dendrogram of Withania somnifera
genotypes based on the RAPD Markers
43

34
LIST OF PLATES
Page
No
Title Plate No
22 Withania somnifera plants used in the study
4.1

35
INTRODUCTION
36
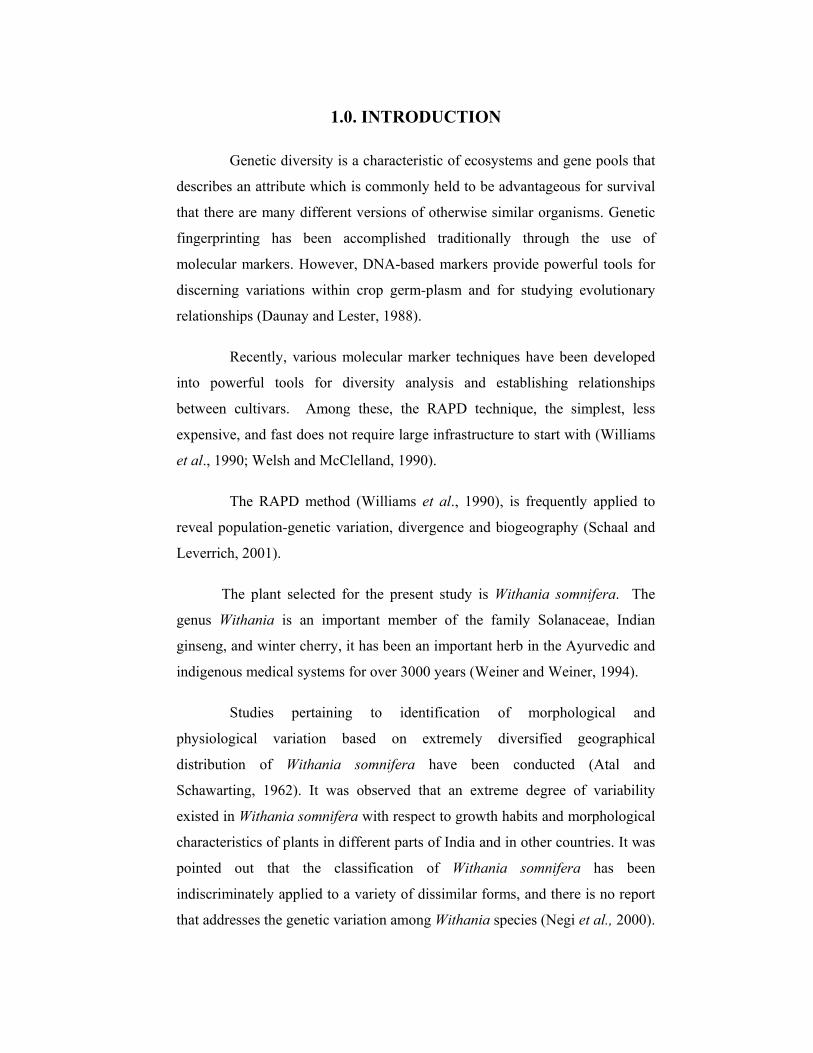
1.0. INTRODUCTION
Genetic diversity is a characteristic of ecosystems and gene pools that
describes an attribute which is commonly held to be advantageous for survival
that there are many different versions of otherwise similar organisms. Genetic
fingerprinting has been accomplished traditionally through the use of
molecular markers. However, DNA-based markers provide powerful tools for
discerning variations within crop germ-plasm and for studying evolutionary
relationships (Daunay and Lester, 1988).
Recently, various molecular marker techniques have been developed
into powerful tools for diversity analysis and establishing relationships
between cultivars. Among these, the RAPD technique, the simplest, less
expensive, and fast does not require large infrastructure to start with (Williams
et al., 1990; Welsh and McClelland, 1990).
The RAPD method (Williams et al., 1990), is frequently applied to
reveal population-genetic variation, divergence and biogeography (Schaal and
Leverrich, 2001).
The plant selected for the present study is Withania somnifera. The
genus Withania is an important member of the family Solanaceae, Indian
ginseng, and winter cherry, it has been an important herb in the Ayurvedic and
indigenous medical systems for over 3000 years (Weiner and Weiner, 1994).
Studies pertaining to identification of morphological and
physiological variation based on extremely diversified geographical
distribution of Withania somnifera have been conducted (Atal and
Schawarting, 1962). It was observed that an extreme degree of variability
existed in Withania somnifera with respect to growth habits and morphological
characteristics of plants in different parts of India and in other countries. It was
pointed out that the classification of Withania somnifera has been
indiscriminately applied to a variety of dissimilar forms, and there is no report
that addresses the genetic variation among Withania species (Negi et al., 2000).

37
Indian genetic resources (wild and cultivated) exhibit a lot of
morphological and phytochemical variability which remains largely
undocumented. Five morphotypes exhibiting morphological variability have
been reported (Atal et al., 1975). Earlier studies on genetic divergence among
the accessions were restricted to Central India (Mishra et al., 1998).
In the present study, a systemic attempt has been made to understand
the nature and the extent of variability at molecular level in
Withania somnifera. The genetic variation among different somnifera plants
which grows naturally in different parts of India has been assessed by RAPD
marker analysis. Based on this data, the diversity among Withania somnifera
species is estimated.
The main objectives of the present study are,
• To study the morphological variation among Withania collection.
• To analyze the RAPD variation among Withania collection.

38
REVIEW OF LITERATURE
39
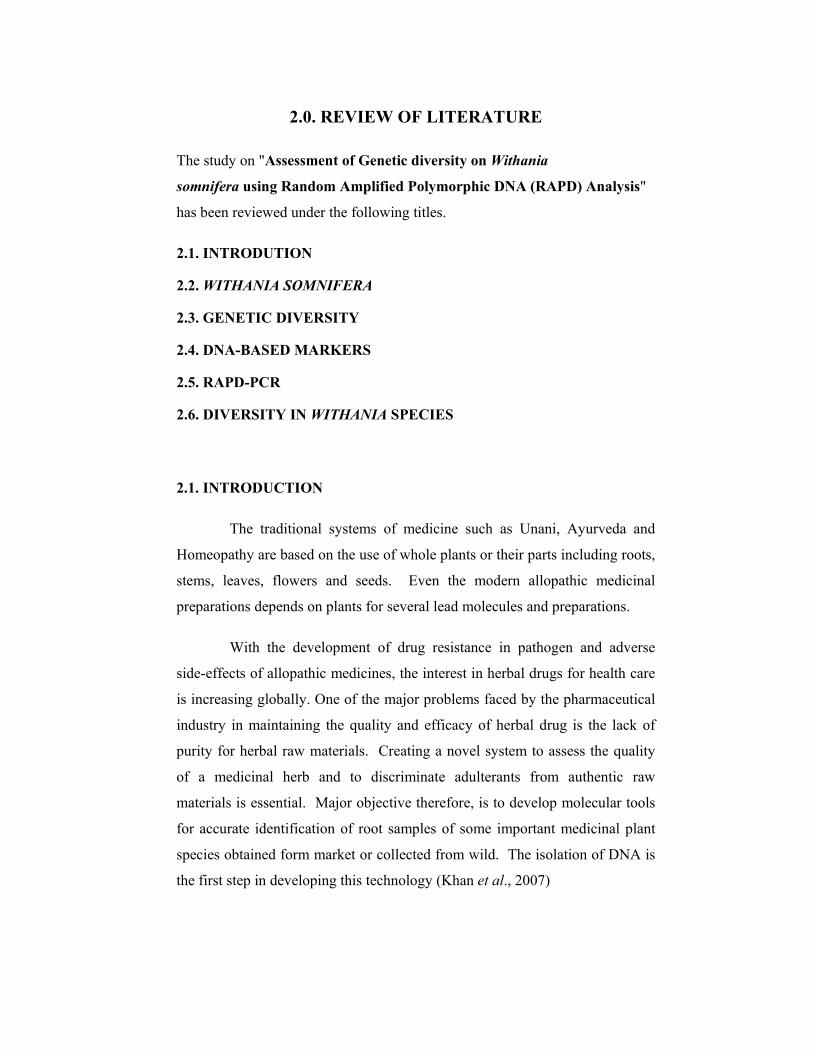
2.0. REVIEW OF LITERATURE
The study on "Assessment of Genetic diversity on Withania
somnifera using Random Amplified Polymorphic DNA (RAPD) Analysis"
has been reviewed under the following titles.
2.1. INTRODUTION
2.2. WITHANIA SOMNIFERA
2.3. GENETIC DIVERSITY
2.4. DNA-BASED MARKERS
2.5. RAPD-PCR
2.6. DIVERSITY IN WITHANIA SPECIES
2.1. INTRODUCTION
The traditional systems of medicine such as Unani, Ayurveda and
Homeopathy are based on the use of whole plants or their parts including roots,
stems, leaves, flowers and seeds. Even the modern allopathic medicinal
preparations depends on plants for several lead molecules and preparations.
With the development of drug resistance in pathogen and adverse
side-effects of allopathic medicines, the interest in herbal drugs for health care
is increasing globally. One of the major problems faced by the pharmaceutical
industry in maintaining the quality and efficacy of herbal drug is the lack of
purity for herbal raw materials. Creating a novel system to assess the quality
of a medicinal herb and to discriminate adulterants from authentic raw
materials is essential. Major objective therefore, is to develop molecular tools
for accurate identification of root samples of some important medicinal plant
species obtained form market or collected from wild. The isolation of DNA is
the first step in developing this technology (Khan et al., 2007)

40
With the increasing use of DNA fingerprinting in plants and its
potential use in herbal drug industry, the preparation of good quality and
quantity DNA has become major concern. The extraction from tissue needs to
be simple, rapid, efficient and inexpensive when many samples are used, such
as in population studies, molecular breeding and screening of raw herbal drug
materials. Several methods for extracting plant DNA from different plant parts
including roots have been developed (Dellaporta et al., 1983; Keim et al.,
1988; Doyle and Doyle et al., 1990; Khanuja et al.,1999; Kumar et al., 2003).
2.2. WITHANIA SOMNIFERA
BOTANICAL NAME : Withania somnifera
COMMON NAME : Ashwagandha
TAMIL NAME : Amukran
Classification
Kingdom - Plantae
Division - Angiosperma
Class - Dicotyledoneae
Order - Tubiflorae
Family - Solanaceae
Genus - Withania
Species - somnifera
Botanical description
An erect branching under shrub reaching about 150cm in height,
leaves ovate up to 10cm long, densely hairy beneath and sparsely above,
flowers greenish or yellow in axillary fascicles, bisexual, pedicerl long, fruits
globule berries which are orange coloured when mature, enclosed in a
persistant calyx. The fleshy roots when dry are cylindrical gradually tapering
down with the brownish white surface and pure white inside when broken.
41
Traditional uses
Withania somnifera popularly, known as “Ashwagandha” is one of the
major herbal components of geriatric tonics mentioned in Indian system of
medicine. It improves learning ability and memory capacity. The traditional
use of “Ashwagandha” was to increase energy, youthful, vigor, endurance,
strength, health nurture the time elements of the body, increase vital fluids,
muscle fat, blood, weakness, loose teeth, thirst, impotency and muscle tension.
It helps invigorate the body by rejuvenating the reproductive organs, just as a
true is invigorated by feeding the roots (Vaidyaratnam,1994).
It has generated a lot of scientific interest in recent years. Roots of
this plant are used in several indigenous drug preparations. The plant is
attributed with curative property against a number of disease including cancer
(Devi,1996).
2.3. GENETIC DIVERSITY
An essential factor for a species to survive against environmental
pressure is the availability of a pool of genetic diversity and in the absence of
that extinction would appear inevitable (Frankel, 1983). Determining, how
much genetic diversity exists in a species and explaining this diversity in terms
of its origin, organization and maintenance are thus of fundamental
significance in the application of genetic principles to conservation. Moreover,
while assessing genetic diversity it is essential to have quantitative measure of
the hierarchy of organisms as genes, population, etc. This is often based on
characterization of amount and distribution of genetic diversity in the
hierarchy, i.e., the population genetic structure, which is the most fundamental
piece of information for species that require genetic management.
It has been well documented that geographical conditions affect the
active constituents of the medicinal plant and hence their activity profile.
(Oleszek et al., 2002.) Many researches have studied geographical variation at
the genetic level. Estimates of genetic diversity are also important in designing

42
crop improvement programmes for management of germ-plasm and evolving
conservation strategies. RAPD-based molecular markers have been found to
be useful in differentiating different accessions of Taxus wallichaiana,
Azadiracta indica,, Juniperus communis L, Andrographis paniculata collected
from different geographical regions (Joshi et al., 2004).
Genetic diversity within population is considered to be of great
importance for possible adaptation to environmental changes and consequently
for long term survival of a species (Hanski and Ovaskainen, 2000). The loss of
genetic variation in a population leads to increasing number of homozygous
individuals fitness (Ellstrand and Elam, 1999). Thus the quantification of
genetic variation is currently regarded as a primary goal in conservation efforts
and accounts for the current utilization of genetic information in conservation
(Abdel et al., 2005).
Preliminary study of genetic diversity of the existing population is
required for the purpose of conservation and reintroduction of rare and
endangered species. In recent years, the method of polymerase chain reaction
with random primers (RAPD) is widely applied for specific, population, and
individual identification of organisms with undetermined DNA nucleotide
sequences (Shin, et al., 1998; Ma, et al., 1998; Oganisyan et al., 1996,
Gustaine, et al., 1999). By this method, intervarietal and interlinear
polymorphism was established in ginseng cultivated in Korea and the genetic
distances were determined between natural and cultivated population of
P. quinquefolis (Schluter et al., 2002).
The spatial distribution of genetic diversity could yield clues to resolve these
uncertainties. Introduction events are often associated with a population
bottleneck, which should reduce genetic diversity. The short time elapsed
since introduction should not have been sufficient for mutation to counter such
reduction in diversity. The diversity in an area of introduction should thus be a
subset of initial diversity (Diallo et al., 2007).

43
The most important role of conservation is to preserve the genetic variation and
evolutionary process in viable population of ecologically and commercially
viable varieties/genotypes in order to prevent potential extinction (Palai et al.,
2007).
2.4. DNA – BASED MARKERS
In recent years, DNA based molecular markers have been used for cultivar
identification and assessment of the genetic relationships between germplasm
in many plant species providing information about the genetic relationships
between individuals and species, and contributing on evolutionary and
ecological studies (Gepts, 1993; Weishing et al., 1995; Hillis et al., 1996).
With the advent of molecular markers, new generations of markers
have been introduced over the last two decades, which has revolutionized the
entire scenario of biological sciences. DNA-based molecular markers have
acted as versatile tools and have found their own position in various fields like
taxonomy, physiology, embryology, genetic engineering etc., they are no
longer looked upon as simple DNA fingerprinting markers in variability studies
or as mere forensic tools. The discovery of PCR was a landmark in this effort
and proved to be a unique process that brought about a new class of DNA
profiling markers. These DNA markers offer several advantages over
traditional phenotypic markers, as they provide data that can be analyzed
objectively (Joshi et al., 1999).
Properties desirable for ideal DNA markers are highly polymorphic
nature, co dominant inheritance, and frequent occurrence in genome, selective
neutral behavior, easy access (availability), easy and fast assay, high
reproducibility and easy exchange of data between laboratories (Joshi et al.,
1999).
Molecular markers have provided a powerful new tool for breeders to
search for new sources of variation and to investigate genetic factors
controlling quantitatively inherited traits. The molecular approach for

44
identification of plant varieties/genotypes seems to be more effective than
traditional morphological markers because it allows direct access to the
hereditary material and makes it possible to understand the relationships
between plants (Williams, et al., 1990, Paterson, et al., 1991).
The conservation of plant population and species is mostly concerned
with the number of genetic individuals present in population in order to assess
factors such as genetic drift, inbreeding depression and lack of mates in self-
compatible species (Barrett and Kohn, 1991). The breeders need to be able to
estimate the degree of relatedness between the existing materials. Germplasm
characterization and evolutionary process in viable population are important
links between the conservation and utilization of plant resources.
Conventionally, morphological characters like growth habit, leaf type, floral
morphology and fruit characters have been used to define the plant name.
Molecular techniques help researchers not only to identify the genotypes, but
also in assessing exploiting the genetic variability through molecular markers
(Whitkus et al., 1994).
AFLP (Amplified Fragment Length Polymorphism) technique was
introduced as a reliable and reproducible marker system (Vos et al. 1995). It
was preferred over other DNA-based markers mainly because of its high
multiple ratio and non requirement of prior sequence information (Breyne et
al., 1997). Another advantage of AFLP markers is its wide genome coverage
(Ellis et al. 1997; Zhu et al. 1998).
2.5. RAPD-PCR
Several PCR-based markers have been used to provide information on
genetic variation in plant species (Jones et al., 1997). A more recently
employed approach in plant systematic and population biology is RAPD
markers, a PCR-based technique. Although, earlier studies (Pan et al.,
1983,1995; Zhang et al., 1983; Li et al., 1987; Sheh and Su, 1987; Su and
Sheh, 1990; Cheng et al.,1993) have reported some results of research on
chemical, cytological, pollen morphological, ecological, geographical and
45
karyotypic characters of the species; neither the genetic diversity nor the
divergence were clear. The purpose of the present study is to assess genetic
diversity and divergence within and among population of the species using
RAPD markers and to compare the results with those obtained from allozymes.
Another important aim is to provide genetic data and a theoretical basis for
production of the species.
RAPD markers are based on the amplification of unknown DNA
sequences using single, short, random oligonucleotide primers, therefore,
RAPD polymorphism is the reflection of variation of the whole genomic DNA,
and would be a better parameter to measure the pattern of genetic diversity of
the rare and endangered plants (Jayaram and Prasad, 2008).
DNA fingerprinting techniques such as random amplified
polymorphic DNA (RAPD) (Williams et al., 1990) permit the identification of
taxa and the determination of phylogenetic relationships and intraspecific
diversity at a molecular genetic level. The use of such techniques for
germplasm characterization facilitates the conservation and utilization of plant
genetic resources, permitting the identification of unique accessions or sources
of genetically diverse germplasm. The ability of this method to distinguish
between taxa also has useful implication in botanical quality analysis.
PCR- based molecular markers have been widely used in many plant
species for identification, phylogenetic analysis, population studies and genetic
linkage mapping (Williams et al., 1990). The RAPD markers can also be used
in the study of the genetic variability of species or natural population
(Lashermes et al., 1993, Wilkie et al., 1993) and in the identification of
genotypes (Wilde et al., 1992, Koller et al., 1993, Wolff and Peters-Van Run
1993). For efficient conservation and management, the genetic compositions
of the species in different geographic locations need to be assessed. Due to
technical simplicity and speed, RAPD methodology has been used for diversity
analysis in many red listed plants (Li et al., 2002; Fu, et al., 2003, Padmalatha
and Prasad, 2006 a, b; 2007).

46
Studies pertaining to identification of morphological and
physiological variation based on extremely diversified geographical
distribution of Withania somnifera have been conducted by Atal and
Schawarting (1962). It was observed that an extreme degree of variability
existed in Withania somnifera with respect to growth habits and morphological
characteristics of plants in different parts of India and in other countries. It was
pointed out that the classification of Withania somnifera has been in
discriminately applied to a variety of dissimilar forms, and there is no report
that addresses the genetic variation among Withania species(Negi et al.,2000).
The problem encountered in the isolation and purification of DNA
specially from MAPS include degradation of DNA due to endonucleases, co-
isolation of highly viscous polysaccharides, inhibitor compounds like
polyphenols and other secondary metabolites which directly or indirectly
interfere with the enzymatic reactions. Moreover, the contaminating RNA that
precipitates along with DNA causes many problems including suppression of
PCR amplification (Pikkart and Villeponteau,1993), interfere with DNA
amplification involving random primers e.g.RAPD analysis and improper
priming of DNA templates during thermal cycle sequencing (Padmalatha and
Prasad, 2005).
The use of molecular techniques in genetic diversity studies supported
by the finding that evolutionary forces such as natural selection and genetic
drift produce divergent phylogenetic branching which can be recognized
because the molecular sequences on which they are based share a common
ancestor (Singh et al., 2006).
Total genomic DNAs were extracted from several populations of pine
species and amplified. RAPD markers was high sufficient in distinguishing
each of the species. Genetic relationships among eight pine species were
analyzed. The degree of band sharing was used to evaluate genetic distance
between species to construct a phylogenetic tree (Nkongolo et al., 2001).

47
2.6. DIVERSITY IN WITHANIA SPECIES
AFLP markers were employed to assess genetic variation among 35
genotypes of W. somnifera (Kashmiri and Nagori genotypes) and five
genotypes of W. coagulans (Negi et al., 2006). High percentage of
polymorphism was revealed among W. somnifera genotypes. Twenty-five
Withania genotypes were analyzed with the AFLP and SAMPL assay. Young,
unexpanded leaves were collected and lyophilized before
DNA extraction. All DNA extractions were done using the modified
CTAB procedure (Weishing et al., 1995). The AFLP procedure was performed
following the protocol developed by Vos et al., (1995) with minor
modifications (Das et al., 1999). All reagents required for AFLP analysis were
obtained from Life Technologies Inc, USA. SAMPL analysis was performed
using the procedure described by Singh et al. (2002).
AFLP analysis of the Withania species was performed. Seven primer
combinations were employed. All the primer combinations generated
amplification products in the size range of 50 to 400 bp. A typical AFLP
profile generated by employing the primer combination EACC and MCAG.
Both monomorphic and polymorphic bands were amplified with this primer
combination. Only unambiguous bands were analyzed. A total of 79 bands
were scored with this primer combination, of which 80% was polymorphic.
SAMPL assay was standardized for the Withania species by testing six
SAMPL primers in conjunction with several MseI primers. Stuttering of bands
was obtained with many primer combinations. Seven MseI primers were
utilized in combination with two SAMPL primers for analysis of genetic
diversity within the 25 Withania genotypes. This primer combination yielded a
total of 52 bands, of which 79% was polymorphic (Negi et al., 2006).
PCR and RFLP were used in order to authenticate Panax ginseng C.A.
Meyer (Korean ginseng) in different vegetable forms of ginseng commercial
products and to differentiate it from other Panax species and from some of
their adulterants. Useful amounts of DNA were extracted from the entire

48
considered sample. PCR amplification was made using 18df/28ccr primers.
For a total of 486 determinations (19 samples, 3 repetitions, 3 extraction
protocols, following PCR and restriction with 3 endonucleases), the molecular
analysis confirmed the presence of Panax species in 12 out of 19 samples
tested. (Serrone et al., 2006).
Molecular methods have been used to unequivocally allow the
authentication to genus Panax at species level and the results were not affected
by the nature. Compared with other methods that detect genome-wise
polymorphism simultaneously, such RAPD (Shaw and But, 1995), AP-PCR
and AFLP, the method applied, based on PCR followed by RFLP, is more
reliable for large scale screening of commercial products, is rapid and the
results are easily readable. The PCR amplification was performed on all
ginseng DNA samples using oligonucleotide primes 18df/28ccr (Serrone et al.,
2006).
At regional research laboratory, Jammu, a total of 10 selected 10 mer
primers (Operon Technologies) were used for PCR amplification in 20
accessions of W.somnifera for developing a RAPD profile. The amplification
products were separated according to their size by standardized horizontal
electrophoresis in 1.5% Agarose gels and stained with ethidium bromide. PCR
amplification was repeated twice to ensure the reproducibility of the DNA
profile with each of the primers analyzed.
AFLP markers to assess the genetic variation among 35 individuals of
W. somnifera and 5 individuals of W. coagulans, which is xerophytic in nature
and grows naturally in Baluchistan was carried out two distinct morphological
types of W. somnifera, namely Kashmiri and Nagori were identified and
employed AFLP markers to analyze the genetic variation among W. somnifera
individuals. Based on the AFLP data, an attempt has been made to estimate the
genetic similarity and identify genetic relationships within and between
Withania species (Negi et al., 2000).
49
Six phenotypic characters and three withanolide markers were assessed
in 25 accessions of Withania somnifera collected from different states of India
for studying genetic variability. The variability ranges observed at phenotypic
and chemotypic levels were polymorphic. Based on D2 values and PCA
(Principal Component Analysis) of phenotypic traits like plant height, no. of
branches/plant, no. of seeds/berry, root length, root diameter and root yield,
these 25 accessions were grouped in five clusters. The relative contribution of
each character towards genetic divergence was worked out (Kumar et al.,
2007).

50
MATERIALS AND METHODS

51
3. MATERIALS AND METHODS
In the present study on “Assessment of Genetic diversity on Withania
somnifera using Random Amplified Polymorphic DNA (RAPD) Analysis”
was employed to find out the phylogenetic relationship within the Withania
somnifera from different regions. The experimental procedures discussed
under the following heading.
3.1 SAMPLE PREPARATION
3.1.1 COLLECTION OF PLANT MATERIAL
3.2 BIOMETRIC OBSERVATIONS
3.3 DNA ISOLATION
3.4 QUALITY ASSESSMENT
3.5 FINGER PRINTING OF WITHANIA SOMNIFERA COLLECTION
USING RAPD MARKERS
3.5.1 PCR AMPLIFICATION
3.6 DATA ANALYSIS
3.6.1 DATA SCORING
3.6.2 CLUSTER ANALYSIS

52
3.1. SAMPLE PREPARATION
3.1.1. COLLECTION OF PLANT MATERIAL
The four varieties of W.somnifera collected from the different geographical
area were raised in the green house of Avinashilingam University during 2007-
2008.
Table.3.1. Withania somnifera used in the study
S.NO PARTS ORIGIN
1 Leaves Coimbatore (local)
2 Leaves Jowahar
3 Leaves Nagori
4 Leaves Poshita
3.2. BIOMETRIC OBSERVATIONS
Four varieties of Withania somnifera collected from different places of
India were planted in pots. The plants of same age were taken and the data
recorded for eleven morphometric traits: plant height, number of
branches/plant, number of leaves/plant, number of lateral roots, leaf area, seed
colour, seed coat colour, seed weight, root length(cm), shoot length(cm), dry
matter content, thousand seed weight, seed colour, and seed coat colour.
3.3. DNA ISOLATION
The fresh leaf sample was used and DNA was isolated following protocol
using CTAB (Doyle and Doyle, 1987) with some modifications. The protocol
standardized for DNA extraction from Withania somnifera is given below:
Fresh leaves of Withania somnifera were cut into pieces of
approximately 1mm size with sterile blade. The pre-chilled mortar and pestle

53
was used to grind the samples (200mg) with liquid Nitrogen. The frozen
powder was transferred in 1 mL of the extraction buffer (pH 8) into an
eppendorf tube. The extraction buffer and frozen powder were mixed well and
incubated at temperature 65˚ for 1 hour. After incubation the mixture was
cooled at room temperature and thereafter, equal volume of the mixture of
chloroform: isoamylalcohol (24:1) was added.
The mixture was centrifuged at 10,000rpm for 10min at 25˚C. The aqueous
phase was transferred to a fresh tube and treated with 10µl RNase (10mg/ml)
for 1 hour at 37˚C. It was thereafter centrifuged at 10,000 rpm for 10 min. The
aqueous phase was taken and 0.6 volumes of isopropanol added and stored at -
20˚C over night. Precipitated DNA was centrifuged at 10,000rpm for 20min.
Supernatant was decanted carefully and pellet washed with 70% ethanol. The
pellet was dried at 37˚C for 12min and dissolved in 30µl of 1XTE buffer.
3.4. QUALITY ASSESSMENT
DNA quantification and assessment of purity
The DNA yield per g fresh leaves was determined using a UV-VIS
spectrophotometer at 260nm and 280nm. The purity of DNA was determined
by calculating the ratio of absorbance at 260nm to at 280nm.
The concentration and purity of DNA was also determined by analyzing
the samples on 0.8% agarose gel. The known concentration of lambda DNA
(25, 50 and 100ng) was loaded along with the sample and visual quantification
was done based on the comparative intensities of the bands under UV
fluorescence. Quantification by visual comparison of the intensities of known
DNA concentration is a standard method of DNA quantification superior to
UV absorption method, as the purity of DNA can be assessed visually. The
presence of degraded DNA can be visualized only in agarose gels.

54
3.5. FINGER PRINTING OF WITHANIA SOMNIFERA COLLECTION
USING RAPD MARKERS
3.5.1. PCR AMPLIFICATION
Good quality DNA isolated from fresh leaves of Withania somnifera
was equalized for concentration and used for RAPD analysis using random
primers.
Thirty three random decamer primers (Operon Technologies, Inc.,
USA) were screened on template DNA from four cultivars as to identify those
giving good and scorable amplification products.
Thirty three oligonuclotide primers were finally selected for RAPD
analysis. Each reaction mixture (15µl) for PCR amplification consisted of 10X
Taq buffer, 10mM MgCl2, Taq polymerase, 2.5mM dNTPs, 0.5µM decamer
primer (Operon Technologies, Inc., USA) and approximately 50ng genomic
DNA template. The Thermocycler was programmed for an initial denaturation
step of 3 min at 94°C, followed by 30 cycles of 45 second at 94°C, annealing
step of 1min at 37°C, extension was carried out at 72°C for 1min and final
extension at 72°C for 7min and a hold temperature of 4°C at the end. PCR
products were loaded onto 2% agarose gel and stained with ethidium bromide.
Gels with amplified fragments were visualized and photographed under UV
light using Alpha Digidoc.
3.5. SOFTWARE ANALYSIS
3.5.1. DATA ANALYSIS
Data Scoring
Clearly resolved, unambiguous polymorphic bands were scored visually
for their presence or absence with each primer. The scores were obtained in
the form of a matrix with ‘1’ and ‘0’, which indicate the presence and absence
of bands in each genotype respectively.
55
3.5.2. CLUSTER ANALYSIS
The binary data scored was used to construct a dendrogram. The genetic
associations between varieties were evaluated by calculating the Dice
Similarity coefficient for Pair-wise comparisons based on the proportions of
shared bands produced by the primers (Nei and Li, 1972). Similarity matrix
was generated using the NTSYS-pc software, version 2.02 (Rohlf, 1998). The
similarity coefficients were used for cluster analysis and dendrogram was
constructed by the Unweighed Pair-Group Method for Arithmetic average
(UPGMA) (Sneath and Sokal, 1973).

56
RESULTS AND DISCUSSION

57
4.0. RESULTS AND DISCUSSION
The present study entitled "Assessment of Genetic diversity on Withania
somnifera using Random Amplified Polymorphic DNA (RAPD) Analysis" was
aimed to assess the genetic variation among Withania somnifera collections. The
results of the study are resented and discussed under the following headings.
4.1. DIVERSITY ANALYSIS ON MORPHOLOGICAL
CHARACTERISTICS
4.1.1. Quantitative trait variability
4.1.2. Qualitative trait variability
4.1.3. Descriptive statistics
4.2. QUALITY ASSESSMENT
4.3. GENETIC DIVERSITY ANALYSIS USING RAPD MARKERS
4.4. CLUSTER ANALYSIS BASED ON MORPHOLOGICAL TRAITS
4.5. CLUSTER ANALYSIS BASED ON RAPD MARKERS
4.6. COMPARISON OF DISSIMILARITY MATRIX DERIVED FROM
MORPHOLOGICAL AND RAPD MARKER DATA
58
4.1. DIVERSITY ANALYSIS ON MORPHOLOGICAL TRAITS
The four varieties of W.somnifera collected from the different geographical
area were raised in the green house of Avinashilingam University during Rabi
– 2007- 2008 season. Therefore, observed variation could be largely genetic.
The evaluation of W.somnifera germplasm showed a large variation in the
quantitative (Table 4.1).
4.1.1. Quantitative trait variability
The mean values of 11 morphological traits for 4 varieties of Withania somnifera
are presented in table 4.1.
Plant height
The plant height ranged from 18.6cm (Poshita) to 21.7cm (Coimbatore). The
general mean of the variety was 20.95 and two varieties exceed the general
mean (Table 4.1).
Root length
The root length ranged from 4.7cm (Coimbatore) to 10cm (Nagori). The
general mean of the variety was 6.57 and one variety (Nagori) exceed the
general mean (Table 4.1).
Shoot length
The shoot length ranged from 13cm (Nagori) to 17cm (Coimbatore).
The general mean of the variety was 14.37 and one variety (Coimbatore)
exceed the general mean (Table 4.1).
Number of branches per plant:
The Jawahar variety had minimum 9 branches and Coimbatore had maximum
13 branches. The general mean of variety was 11 numbers and two varieties
exceed the general mean (Table 4.1).

59
Number of leaves per plant
The numbers of the leaves was lowest for Jawahar (10) and the highest
for Coimbatore (17). The general mean of variety was 13 numbers and two
varieties exceed the general mean (Table 4.1).
Leaf area
The Poshita had minimum leaf area (5.98cm2) and Jawahar had maximum leaf
area (11.2 cm2). The general mean of variety was 8.02 and two varieties
exceed the general mean (Table 4.1).
Number of lateral roots
The number of lateral root ranged from 2 (Nagori) to 6 (Coimbatore). The
general mean of the variety was 4 and one variety (Coimbatore) exceed the
general mean (Table 4.1).
Dry matter content
The total dry matter content was lowest for Coimbatore (0.22) and
highest for Poshita (0.25). The general mean of the variety was 0.235 and two
varieties exceed the general mean (Table 4.1).
Thousand Seed weight (g)
It ranged from 1.8 (Jawahar) to 2.0 (Poshita and Nagori), the two genotypes
Poshita and Nagori expressed significantly highest seed weight (Table 4.1).

60
Plate 4. 1 Withania somnifera plants used in the study

61
Table 4.1 Morphological Traits for the Four Varieties of
Withania Somnifera
MORPHOLOGICAL
TRAITS
COIMBATORE
(local)
JAWAHAR
NAGORI POSHITA
Plant height (cm) 21.7 20.5 23 18.6
Root length (cm) 4.7 6.5 10 5.1
Shoot length (cm) 17 14 13 13.5
No. of Branches 13 9 12 10
No. of Leaves 17 10 14 11
Leaf Area 6.4 11.2 8.5 5.98
No. of Lateral roots 6 4 2 4
Dry matter content 0.22 0.24 0.23 0.25
Thousand seed weight
1.9 1.8 2.0 2.0
Seed colour
1 2 3 2
Seed coat colour
1 2 1 1
Legend for table 4.1
QUALITATIVE
TRAITS
NUMBER NAME

62
Table 4.2 Descriptive statistics of quantitative traits
Seed colour 1
2
3
Yellowish orange
Light brown
Yellowish brown
Seed coat colour 1
2
Orange red
Orange
Plant
height
(cm)
Root
length
(cm)
Shoot
length
(cm)
No. of
Branches
No. of
Leaves
Leaf
Area
No. of
Lateral
roots
Dry
matter
content
Seed
weight/1000
Mean 20.95 6.57 14.37 11 13 8.02 4 0.23 1.92
Standard
Error
0.93 1.2 0.89 0.91 1.58 1.19 0.81 0.01 0.04
Standard
Deviation
1.87 2.41 1.79 1.82 3.16 2.38 1.63 0.01 0.09
Sample
Variance
3.50 5.8 3.22 3.33 10 5.7 2.66 0.0001 0.009
Range 4.4 5.3 4 4 7 5.22 4 0.03 0.2
Minimum 18.6 4.7 13 9 10 5.98 2 0.22 1.8
Maximum 23 10 17 13 17 11.2 6 0.25 2
63
4.1.2. Qualitative traits
All the four varieties of the Withania somnifera were evaluated for two
qualitative traits and are presented in table 4.1. The genotypes of Withania
exhibited significant degree of genetic variation for the traits were observed.
In the case of seed colour two varieties were found to possess light brown
colour and remaining were found to possess yellowish orange and yellowish
brown. Likewise, three varieties of Withania found to possess orange red
colour seed coat and one variety found to possess orange colour seed coat.
A graphical representation of morphological variation among Withania
in figure 4.2.The highest variation for plant height was observed for Nagori and
Poshita. For the root length, maximum variation was observed between Nagori
and Coimbatore as compared to other varieties. The variation in shoot length
character between Coimbatore and Nagori was high as compared to other
varieties. Variation between Coimbatore and Jawahar was relatively high for
total number of branches and number of leaves as compared to other varieties.
For leaf area highest variation was observed between Jawahar and Nagori. For
lateral roots variation was shown between Coimbatore and Nagori as compared
to other varieties. For seed colour variation was shown between Nagori and
Coimbatore as compared to other varieties.
4.1.4. Descriptive statistics
The data recorded on nine quantitative characters were subjected to descriptive
statistics of quantitative traits such as mean, and measure of dispersion (Range,

64
0
5
10
15
20
25
Plant height Root length Shoot length Number of
branches
Number of
leaves
Leaf area Number of
lateral roots
Dry matter
content
Seed weight Seed colour Seed coat
colour
Fig. 4.1 Morphological traits for four varieties of Withania somnifera
Coimbatore Jawahar Nagori Poshita
variance, standard deviation, standard error and coefficient of variation). The
descriptive statistics of the quantitative traits is presented in table 4.2.
Mean
Among all the characters the highest mean value was recorded by plant height
(20.95) and the least value by total dry matter content (0.23).
Range
The highest range was exhibited by number of leaves (7) and the least value by
total dry matter content (0.03).
Variance
The maximum value of variance was shown by number of leaves (10) and the
least value by total dry matter content (0.0001).
65
4.2. DNA ISOLATION
The extraction of DNA carried out as described in experimental procedure was
found to be satisfactory. DNA recovery varied widely with varying of leaves.
DNA obtained from recently matured leaves was high quality. Amplifiable
DNA was isolated from 200mg of leaf sample using 1ml of 2% extraction
buffer, 4% PVP, this resulted in good quality, high molecular weight DNA.
4.3. QUALITY ASSESSMENT
DNA quantification and assessment of purity
DNA samples were quantified in spectrophotometer at 260nm.The A 260/280
ratio ranged from 1.62 to 1.7. A ratio less than 1.8 indicates high purity DNA.
Presence of proteins or RNA might give a value >1.8 (Sambrook et al., 1989).
The use of pooled samples has been proved efficient in genetic variation
studies. Total DNA isolation from fresh leaves and dried powders of fruits of
E. officinalis, T. belerica, and T. chebula was carried out and the isolated DNA
had normal spectra in which the A 260/280 ratios were 1.7 indicates insignificant
levels of contaminating proteins and polysaccharides (Warude et al., 2003).
Table 4.3 DNA RATIOS
280nm 260nm SAMPLE
0.140 0.240 Coimbatore
0.109 0.174 Jawahar
0.420 0.720 Nagori
0.200 0.324 Poshita

66
The total DNA isolated from fresh leaves of Withania somnifera was
quantified by means of agarose gel electrophoresis (0.8%).Fig 4.2 shows W1
and W4 have quantity of DNA compared to W2 and W3 comparable to 100ng
and 25ng of standard DNA respectively.
Fig. 4.2 DNA quantification of Withania somnifera samples
4.4. GENETIC DIVERSITY ANALYSIS USING MOLECULAR
MARKER
In the present study, four varieties were evaluated for genetic diversity using
RAPD markers.
4.4.1. RAPD Analysis
All the thirty three RAPD markers that were employed in the present study to
detect the genetic relationship within the Withania genotypes fail to generate
amplification product. Instead 9 RAPD primers i.e., OPO 13, OPR13, OPO20,
W1 W2 W3 W4
λ1 - 25ng DNA W1 - Coimbatore (local)
λ2 - 50ng DNA W2 - Jawahar
λ3 - 100ng DNA W3 - Nagori
W4 - Poshita
λ1 λ2 λ3 W1 W2 W3 W4

67
OPO09, OPO08, OPO10, OPB04, OPE09, OPM02 were found to be resulted
with amplification products.
Analysis of four varieties of Withania somnifera revealed 74.37% of
polymorphism as presented in Table 4.5. A total of 67 bands were scored for
the nine RAPD primers out of which 57 bands are polymorphic with number of
bands ranging from 3 to 11, corresponding to an average of 7.4 bands per
primer. Percentage of polymorphic bands ranged from 60 to 87.5%. The
primer with maximum number of polymorphic bands is OPO 20 (11alleles)
and minimum with OPO 13, OPO 09 and OPE 09 (3 allele). The dendrogram
was drawn, based on the Genetic Distance from RAPD data.
The average percentage of polymorphisms i.e., 74.37% was found to be
relatively higher when compared to the other endangered species, stating that it
should be able to adapt to the environmental variations.
Fig. 4.3 RAPD profile using primer OPO 13
OPO 13 1300bp
OPO 13 800bp
1Kb ladder W1 W2 W3 W4
68
Fig. 4.4 RAPD profile using primer OPR 13
Fig. 4.5 RAPD profile using primer OPO 20
OPO 20 500bp
1Kb ladder W1 W2 W3 W4
OPO 20 700bp
OPR 13 1000bp
OPR 13 900bp
1Kb ladder W1 W2 W3 W4

69
Fig. 4.6 RAPD profile using primer OPO 08
Fig. 4.7 RAPD profile using primer OPO 09
1Kb ladder W1 W2 W3 W4
OPO 08 1000bp
OPO 08 700bp
1Kb ladder W1 W2 W3 W4
OPO 09 1500bp
OPO 09 900bp

70
Fig. 4.8 RAPD profile using primer OPO 10
Fig. 4.9 RAPD profile using primer OPB 04
1Kb ladder W1 W2 W3 W4
OPO 10 1000bp
OPO 10 700bp
OPB 04 190bp
1Kb Ladder W1 W2 W3 W4

71
Fig. 4.10 RAPD profile using primer OPE 09
Fig. 4.11 RAPD profile using primer OPM 02
1Kb ladder W1 W2 W3 W4
OPE 09 100bp
1Kb ladder W1 W2 W3 W4
OPM 02 140

72
Table 4.4 Data Matrix
OPO 13 W1 W2 W3 W4
OPO 13 1 1 1 1
OPO 13 1 0 1 1
OPO 13 1 1 1 1
OPO 13 0 1 0 0
OPO 13 1 1 0 0
OPR 13 1 1 0 1
OPR 13 1 0 0 0
OPR 13 1 1 1 1
OPR 13 1 0 1 1
OPR 13 1 1 0 0
OPR 13 0 0 1 1
OPR 13 1 1 1 1
OPR 13 1 1 1 1
OPR 13 1 1 1 0
OPO 20 1 0 0 1
OPO 20 1 1 0 0
OPO 20 1 1 0 1
OPO 20 1 1 1 1
OPO 20 0 0 0 1
OPO 20 0 1 0 0
OPO 20 1 0 0 1
OPO 20 0 1 0 0
OPO 20 1 0 1 1

73
OPO 20 1 0 0 0
OPO 20 1 1 1 1
OPO 20 1 1 0 1
OPO 20 1 1 0 1
OPO 08 1 1 1 1
OPO 08 0 0 1 0
OPO 08 1 1 0 1
OPO 08 1 1 0 0
OPO 08 1 1 1 1
OPO 08 1 1 0 0
OPO 08 1 1 0 0
OPO 08 0 0 1 0
OPO 08 0 1 0 0
OPO 09 1 1 0 0
OPO 09 1 1 1 1
OPO 09 0 0 1 1
OPO 09 1 0 1 1
OPO 10 0 0 0 1
OPO 10 1 1 0 0
OPO 10 1 1 1 1
OPO 10 0 0 1 0
OPO 10 1 1 0 0
OPB 04 1 1 1 1
OPB 04 0 0 1 1
OPB 04 0 1 1 0
OPB 04 0 0 1 0
OPB 04 1 1 0 0

74
OPB 04 0 1 0 0
OPB 04 0 1 1 1
OPB 04 0 1 1 1
OPE 09 0 1 1 1
OPE 09 0 1 1 1
OPE 09 0 1 1 0
OPE 09 1 1 1 1
OPE 09 1 1 1 1
OPM 02 1 1 1 1
OPM 02 1 1 1 1
OPM 02 1 1 1 0
OPM 02 1 0 0 0
OPM 02 1 1 1 0
OPM 02 1 1 1 0
OPM 02 1 0 1 0
OPM 02 1 0 1 0
OPM 02 0 0 1 0
Table 4.5 Polymorphism in Withania Somnifera Using nine
RAPD Markers
Polymorphism
(%)
No. Of
Polymorphic
Bands
No. Of
Bands 5' To 3' Code S.No
60.00 3 5 GTCAGACTCC OPO 13 1
66.66 6 9 GGACAACGAG OPR 13 2
84.62 11 13 ACACACGCTG OPO 20 3
75
77.77 7 9 CCTCCAGTGT OPO 08 4
75.00 3 4 TCCCACGCAA OPO 09 5
80.00 4 5 TCAGAGCGCC OPO 10 6
87.50 7 8 GGACTGGAGT OPB 04 7
60.00 3 5 CCAAGCTTCC OPE 09 8
77.77 7 9 ACAACGCCTC OPM 02 9
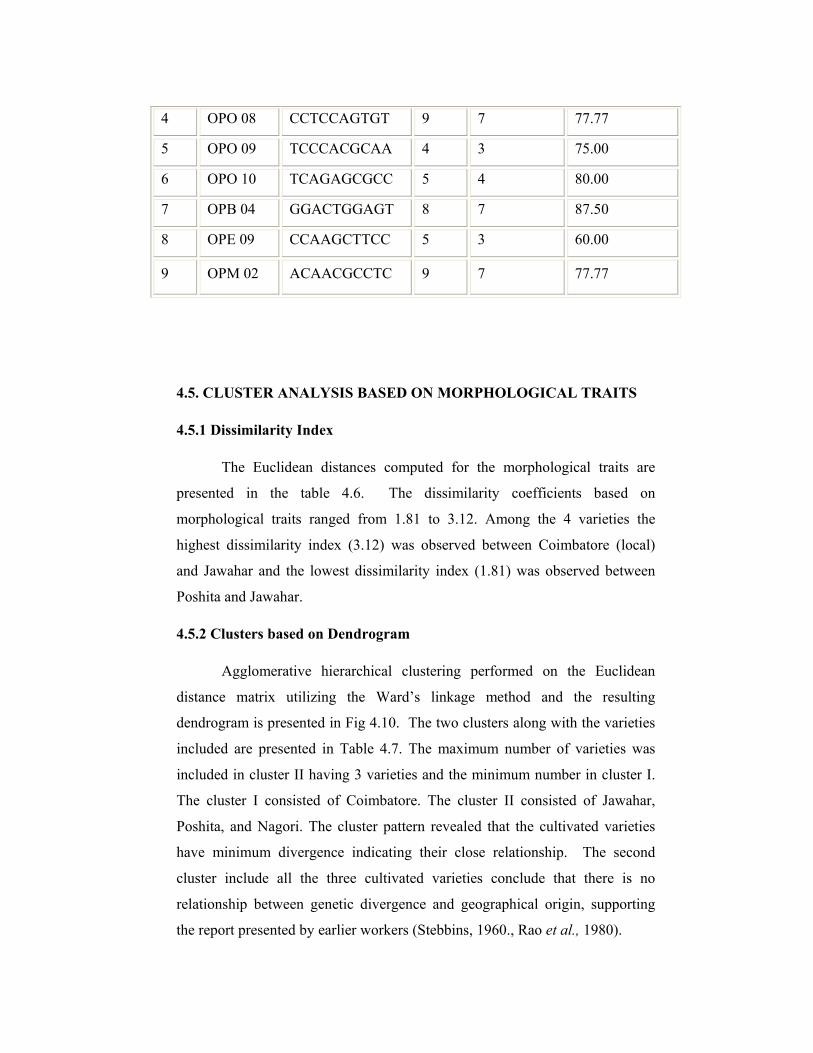
4.5. CLUSTER ANALYSIS BASED ON MORPHOLOGICAL TRAITS
4.5.1 Dissimilarity Index
The Euclidean distances computed for the morphological traits are
presented in the table 4.6. The dissimilarity coefficients based on
morphological traits ranged from 1.81 to 3.12. Among the 4 varieties the
highest dissimilarity index (3.12) was observed between Coimbatore (local)
and Jawahar and the lowest dissimilarity index (1.81) was observed between
Poshita and Jawahar.
4.5.2 Clusters based on Dendrogram
Agglomerative hierarchical clustering performed on the Euclidean
distance matrix utilizing the Ward’s linkage method and the resulting
dendrogram is presented in Fig 4.10. The two clusters along with the varieties
included are presented in Table 4.7. The maximum number of varieties was
included in cluster II having 3 varieties and the minimum number in cluster I.
The cluster I consisted of Coimbatore. The cluster II consisted of Jawahar,
Poshita, and Nagori. The cluster pattern revealed that the cultivated varieties
have minimum divergence indicating their close relationship. The second
cluster include all the three cultivated varieties conclude that there is no
relationship between genetic divergence and geographical origin, supporting
the report presented by earlier workers (Stebbins, 1960., Rao et al., 1980).

76
4.6. CLUSTER ANALYSIS BASED ON RAPD MARKER
4.6.1 Similarity Index
The binary data from the polymorphic primers were used for computing
Jaccard’s similarity indices. The similarity index values obtained for each pair
wise comparison among the 4 varieties and presented in the Table. 4.8. The
similarity coefficients based on 9 RAPD markers ranged from 0.43 to 0.61.
Among the 4 varieties the highest similarity index (0.61) was observed
between Coimbatore and Jawahar and the lowest similarity index (0.43) was
observed between Nagori Vs Coimbatore and Nagori Vs Jawahar.
4.6.2 Clusters based on Dendrogram
The similarity values obtained for each pair wise comparison of 9
RAPD markers among the 4 Withania somnifera varieties were used to
construct dendrogram based on Jaccard’s coefficient and the results are
presented in Fig. 4.11. The 4 varieties formed 2 clusters at nearly 61%
similarity levels. The cluster I consisted of Coimbatore and Jawahar. The
cluster II consisted of Nagori and Poshita. There is a nearly close similarity of
61% between Coimbatore and Jawahar which clearly depict that genetically
they are more or less similar and might share a few genetic traits amongst
others. It can be inferred that Nagori and Poshita exhibited a genetic similarity
of 55% showing less similarity among them.
In the banding pattern of Withania somnifera in primer OPO 13, Fig 4.3
Coimbatore and Jawahar varieties showed the allele OPO 13 800 was present
and was not found in other two varieties Nagori and Poshita.Likewise, in
primer OPR 13900 W3 and W4 (Nagori and Poshita) were showing higher
variation at 900bps which were not found in other two varieties (Coimbatore
and Jawahar). Also, in the primer OPO 20, the W2 (Jawahar) was showing
higher variation at OPO 13 700bp which were not found in other varieties from
other species up to OPO 13 200bp.

77
The banding pattern of the plant in primer OPO 08, the W2 (Jawahar) was
showing higher variation at OPO 08 700 allele was not amplified in other
varieties. And also, in primer OPO 09, the W2 (Jawahar) was showing higher
variation at OPO 09 1500 which was not amplified in other varieties. In the
primer OPO 10, the W2 (Jawahar) was showing higher variation at OPO 10 700
which was not found in other three varieties.
The percentage of polymorphism was found to be 49.61% for eight
varieties of O.indicum stated that the genetic difference among the varieties is
due to the result of biotic or climatic and biotic factors (Jayaram and Prasad,
2008). They also show that the species genetic diversity among this O.
indicum by itself is low, but relatively higher when compared to other
endangered species and it should be able to adapt to the environmental
variation.
Table 4.6 Dissimilarity index computed for the morphological
traits
POSHITA NAGORI JAWAHAR COIMBATORE
0 COIMBATORE
0 3.12 JAWAHAR
0 2.29 2.7 NAGORI
0 2.29 1.81 2.56 POSHITA
Table 4.7 Clusters Based On Morphological Traits Dendrogram
CLUSTER
NO.
NO. OF
VARIETIES
LIST OF VARIETIES
INCLUDED
I 1 Coimbatore
II 3 Nagori, Poshita and Jawahar
78
Fig 4.12 Dendrogram of withania somnifera genotypes based
Morphological traits
Similarity Coefficient
2.09 2.38 2.66 2.95 3.23
COIMBATORE
JAWAHAR
POSHITA
NAGORI
Table 4.8 Similarity index computed for the RAPD markers
COIMBATORE JAWAHAR NAGORI POSHITA
COIMBATORE 1
JAWAHAR 0.61 1
NAGORI 0.43 0.43 1
POSHITA 0.49 0.44 0.55 1

79
Table 4.9 Custer analysis based on RAPD markers
Dendrogram
CLUSTER
NO.
NO. OF
VARIETIES
LIST OF VARIETIES
INCLUDED
I 2 Coimbatore, Jawahar
II 2 Nagori, Poshita
Fig 4.13 Dendrogram of withania somnifera genotypes based on
the RAPD markers
Coefficient
0.45 0.49 0.53 0.57 0.61
Coimbatore
Jawahar
Nagori
Poshita
80
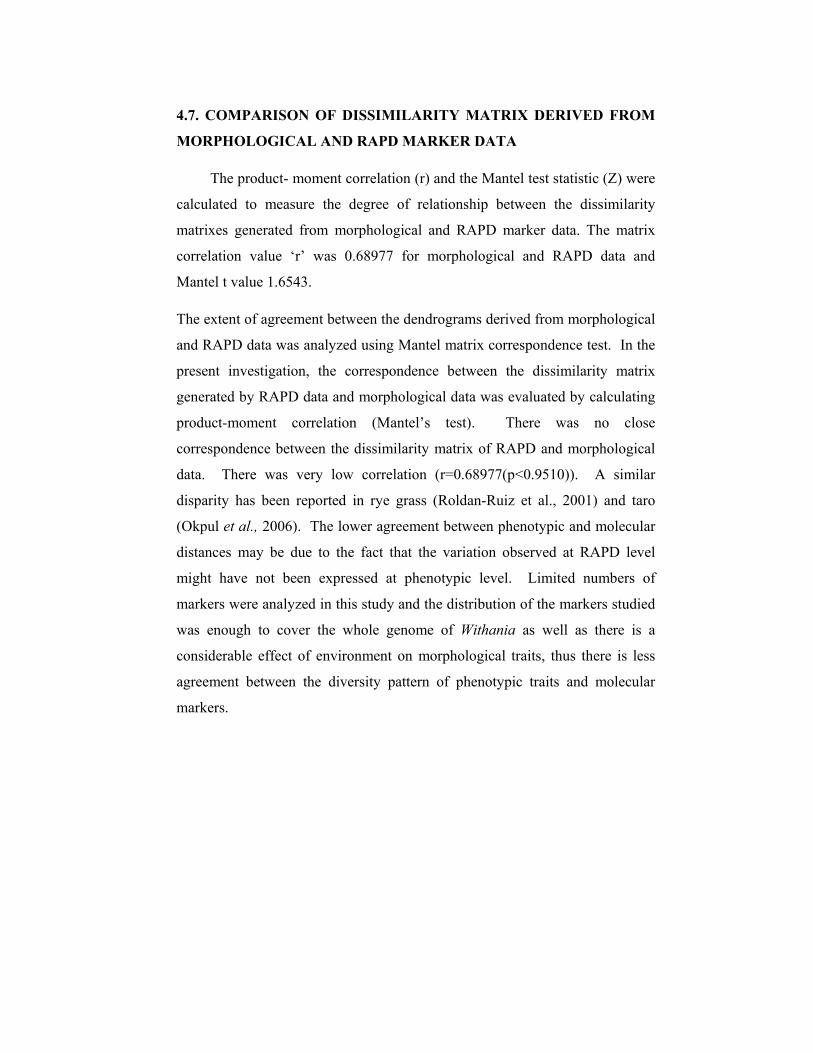
4.7. COMPARISON OF DISSIMILARITY MATRIX DERIVED FROM
MORPHOLOGICAL AND RAPD MARKER DATA
The product- moment correlation (r) and the Mantel test statistic (Z) were
calculated to measure the degree of relationship between the dissimilarity
matrixes generated from morphological and RAPD marker data. The matrix
correlation value ‘r’ was 0.68977 for morphological and RAPD data and
Mantel t value 1.6543.
The extent of agreement between the dendrograms derived from morphological
and RAPD data was analyzed using Mantel matrix correspondence test. In the
present investigation, the correspondence between the dissimilarity matrix
generated by RAPD data and morphological data was evaluated by calculating
product-moment correlation (Mantel’s test). There was no close
correspondence between the dissimilarity matrix of RAPD and morphological
data. There was very low correlation (r=0.68977(p<0.9510)). A similar
disparity has been reported in rye grass (Roldan-Ruiz et al., 2001) and taro
(Okpul et al., 2006). The lower agreement between phenotypic and molecular
distances may be due to the fact that the variation observed at RAPD level
might have not been expressed at phenotypic level. Limited numbers of
markers were analyzed in this study and the distribution of the markers studied
was enough to cover the whole genome of Withania as well as there is a
considerable effect of environment on morphological traits, thus there is less
agreement between the diversity pattern of phenotypic traits and molecular
markers.

81
SUMMARY AND CONCLUSION

82
5.0. SUMMARY AND CONCLUSION
Genetic diversity is essential for the continued progress in breeding as well
as adaptation to future environmental challenges. Assessment of genetic
diversity and identification of superior genotypes are important prerequisites
for a successful crop improvement program. Genetic diversity in crop plants
can be measured using various tools such as morphological, biochemical and
DNA based markers. The present study was conducted with an objective to
assess the genetic diversity and marker association study among four Withania
somnifera varieties using morphological as well as RAPD markers.
1. A wide range of variation was noticed for nine quantitative and two
qualitative traits and this indicated the existence of morphological
diversity in the selected varieties.
2. Four varieties were grouped into two clusters based on morphological
traits using PCA and hierarchical cluster analysis.
3. Genetic diversity was assessed using a set of nine primers. RAPD
primers used in this study produced 57 percentage of polymorphism.
4. Dendrogram was constructed using Jaccard's similarity coefficient and
the selected varieties were grouped into two clusters based on RAPD
markers.
5. Mantel statistics indicated the lack of correspondence r=0.68977
between the dissimilarity matrices of RAPD and morphological data.
6. Significant geographical patterns of variation were found in this work.
7. The clustering pattern of varieties also indicates that there was a wide
genetic diversity between the different Withania somnifera varieties.

83
REFERENCES
84
REFERENCES
Abdel, M., A.L., Assaeed, A. and Al-Abdallatif. (2005). Application of RAPD
technique for the conservation of an isolated population Capparis deciduas.
Alex.J. Agric. Res. 51:171-177.
Atal, C.K. and Schwarting, A.E. (1962). Intraspecific variability in Withania
Somnifera. I.A preliminary survey, Lyodia. 25:78-88.
Barret, S.C.H. and Kohn, J.R. (1991). Genetic and evolutionary consequences of
small population size in plants. Implications for conservation. Oxford
University Press, New York. 3-30.
Breyne, P., Boerjan, W., Gerats, T., Van Montagu, M., and Van Gysel, A. (1997).
Application of AFLPTM
in plant breeding. Molecular Biology and Genetics,
Belg. J. Bot. 129(2):107-117.
Cheng, K.T., Chang, H.C., Su, C.H. and Hsu, F.L. (1997). Identification of dried
rhizomes of Coptis species using random amplified polymorphic DNA. Bot.
Bull. Acad. Sin.38:241-244.
Devi, P.U., Sharada, A.C. and Soloman, E.E. (1996). Withania somnifera Dunal
(Ashwagandha) Potential plant source of promising drug for cancer
chemotherapy and radiosensitization. Indian Journal Expt. Biol.34:927-932.
Das, S., Rajagopal, J., Bhatia, S., Srivastava, P.S. and Lakshmi-kumaran, M.
(1999). Assessment of genetic variation within Brassica campestris cultivars
using amplified fragment length polymorphism and random amplification of
polymorphic DNA markers. J. Bio Sci. 24:433-440.
Daunay, M.C. and Lester, R.N. (1988). The usefulness of taxonomy for solanaceae
breeders, with special reference to the genus solanum and to Solanum
melongena L. (egg plant). Capsicum Newslett. 7:70-79.
Dellaporta, S.L, wood, J. and Hicks, J.B. (1983). A plant DNA minipreparation:
version II, Plant Mol Biol. Rep. 1:19-21.

85
Diallo, O.B., Helene, I., Joly., Mckey, D., Mc key, H.M. and Chevallier, H.M.
(2007). Genetic diversity of Tamairndus indica populations, Any clues on the
origin from its current distribution?. Afrincan Journal of Biotechnology. 6 (7):
853-860.
Doyle, J.J. and Doyle, J.L. (1990). Isolation of plant DNA from fresh tissue. Focus.
12:13-15.
Ellstrand, N.C. and Elam, D.R. (1993). Population genetic consequences of small
population size, implication for plant conservation. Annual review of Ecology
and Systematics. 24:217-243.
Frankel, O.H. (1974). Genetic conservation, an evolutionary responsibility.
Genetics, 78:53-65.
Fu, R.Z., Wang, J., Zhang, Y,B., Wang, Z.T., But P.P.H., Li, N. and Shaw, P.C.
(1999). Differentition of medicinal Codomopsos specis from adulterants by
polymerase chain reaction-restriction fragment length polymorphism. Planta
med. 65:648-650.
Gepts, P. (1993). The use of molecular and biochemical markers in crop evolution
studies. Evol. Biol. 27:51-94.
Gustine, D.L. and Huff, D.R. (1999). Genetic variation within and among white
clover population from managed permanent Pastures of the Northeastern
USA,Crop Sci. 39:524-530.
Hanski, I. and Ovaskainen, O. (2000). The meta population capacity of fragmented
landscape. Nature. 404:755-758.
Hillis, D.M., Mabl, B.K., Morit, Z.C., Mable, B.K (eds). (1996). Application of
Molecular systematic, the state of the field and a look to the future. Sinauer
Ass.Inc,Sunderland MA, 515-544.
Jaccard, P. (1908). Narvelles recherche's sur la distributic florale. Bull. Soe.
Vaudoise Sci.Nat. 44:223-270.
86
Jayaram, K and Prasad M.N.V. (2008). Genetic diversity in Oroxylum indicum (L.)
Vent. (Bignoniaceae), a vulnerable medicinal plant by random amplified
polymorphic DNA marker. African journal of Biotechnology. 7:254-262.
Jones, C.J., Edwards, K.J., Castaglione, S., Winfield, M.O., Sala, F., Van de wiel,
C., Bredemeijer, G., Vosman, B., Matthes, M., Daly, A., Bretscneider, R.,
Bettini, P., Buiatti, M., Maeti, E., Elalcevschi, A., Marmiroli, N., Aet, R.,
Volckae., G., Rueda, J., Linacero, R., Vazquez, A., and karp, A. (1997).
Reproducibility testing of RAPD, AFLP and SSR markers in plants by a
network of European Laboratories. Mol. Breed. 3:381-390.
Joshi, K., Chavan, Warude, D and Patwardhan, B. (2004). Molecular markers in
herbal drug technology. Current Science. 87:159-164.
Joshi, P.S., Prabhakar, K., Ranjekar and Vidya S. Gupta. (2000). Molecular
markers in plant genome analysis. Current Science. 50:140-146.
Kaul, M.K., Kumar, A. and Sharma, A. (2005). Reproductive biology of Withania
somnifera (L.) Dunal. Current Science. (8 and 9):1375-1377.
Keim, P., Olson Tc. and Shoemarker, R.C. (1988). A rapid part for isolating
soybean DNA. Soyben Genet News. 15:150-132.
Khan, S.M., Quareshi, I., Alam, K.T. and M.Z. Abdin, (2007). African Journal of
Biotechnology. 6 (3):175-178.
Khanuja, S.P.S., Shasany, A.K., Darokar, M.P., Kumar, S. (1999). Rapid isolation
of DNA from dry and fresh samples of plants producing large amount of
secondary metabolites and essential oils. Plant Mol. Biol. Reptr. 17:1-7.
Koller, B., Lehmann, A., Mcdermott, J.M. and Gessler,C. (1993). Identification of
apple cultivars using RADP markers. Theor.Appl.Genes. 85:901-904.
Kumar, A., Pushpangadan, P., Mehrotra, S. (2003). Extraction of high molecular
weight DNA from dry root tissue of Berberis lycicum suitable for RAPD, Plant.
Mol. Biol. Rep 21:309a-309d.

87
Lashermes, P.H., Cros, J., Marmey, P.H. and Charries,A. (1993). Use of Random
Amplified Polymorphic DNA markers to analyze genetic variability and
relationship of coffee species. Crop Revolution Genetic Resource 40:91-99.
Li, Q., Xu, Z. and He, T. (2002). Ex situ genetic conservation of endangered Vatica
guangxiensis (Dipterocarpaceae) in China. Biol. Conser. 106:151-156.
Ma, X., Wang, X., Xiao, P., and Hong, D. (1998). A study on germplasm of
Panax ginseng and its DNA fingerprinting, Advances in Ginseng Research
Proc.7th Int. symp. On Ginseng, Huon Heh, Kang Ju Choi, and Young Choong
Kim, Eds, Seoul, Korea. 89-90.
Mishra, L.C., Singh, B.B. and Simon, D. (2000). Scientific basis for the therapeutic
use of Withania somnifera: A review-Ashwaghandha. Alternative Med.Rev.
5:334-346.
Negi, M.S., Singh, A. and Kumaran, L.N. (2000). Genetic variation and
relationship among and within withania species as revealed by AFLP markers.
Genome. 43: 975-980.
Nei, M. and Li, W.H. (1979). Mathematical modes for studying genetic variation in
terms of restriction endonucleases. Proc. Natl. Acad. Sci., USA. 76:5269-5273.
Nkongolo, L., Deverno. and Michael, P. (2003). Genetic validation and
characterization of RAPD markers differentiating black and red spruces,
molecular certification of spruce trees and hybrids. Plant Systematics and
Evolution. 236:151-163.
Oganisyan, A.S., Kochieva, E.Z. and Ryskon, A.P. (1996). Fingerprinting of potato
species and cultivars by the RAPD-PCR method. Genetika (Moscow),
32:3,448.
Okpul, T., Singh, D., Wagih, M.E. and Hunter, D. (2002). Genetic resource of taro
(Colocasia esculenta L.) shoot in papua new guinea, a review, PNG Journal of
Agriculture, Forestry and Fisheries. 45, (1 & 2): 33-45.
Padmalatha, K. and Prasad M.N.V. (2006). Optimization of DNA isolation and
PCR Protocol for RAPD analysis of selected medicinal and aromatic plants of

88
conservation concern from peninsular India, African journal of Biotechnology.
5(3):230-234.
Palai, K.S. and Rout,R.G. (2007). Identification and genetic variation among and
varieties if ginger by using random amplified polymorphic DNA markers. Plant
BT.24:417-420.
Pan, Z.H., Wu, Z.J. and Liu, X.T. (1995). On karyotypes and geographical
distribution of endemic genera in Umbelliferae from China. J. Plant Resources
Environ. 4:1-8.
Paterson, A.H., Tankslay, S.D. and Sorrei, M.F. (1991). DNA markers in plant
improvement, Adv. Agronomy. 96: 39-90.
Pikkart, M.J. and Villeponteau B. (1993). Suppression of PCR amplification by
high levels of RNA. Biotechniques 14:24-25.
Rohlf, F.J. (1993). NTSYS - PC Numerical taxonomy and multivaries analysis
system, version 1.70. Exeter software, Setau ket, New York.68:69-79.
Rolden Ruiz, I., Van Eucoijk, F.A., Gilliland, T.J., Dubreuil, P., Dillmann, C.,
Lallemand, J., De Loose, M., Baril, C.P. (2001). A comparative study of
molecular and morphological methods of describing relationship between
perennial ryegrass. ( Lolium perenne L.) varieties. Theor. Appl. Genes.
103:1138-1150.
Sambrook, J., Fritsch, E. and Maniatis, T. (1989). Molecular Cloning: A laboratory
manual. II Edition. Cold Spring Harbor Laboratory Press, New York,
USA.1822
Schaal, B.A. and Leverrich, W.J. (2001). Plant Population biology and systematics.
Taxon. 50:357-373.
Schluter, C. and Punja, Z.K. (2002). Genetic diversity among natural and cultivated
field population and seed lots of American Ginseng (Panax Quinquefolicus L.)
in Canada. Int.J.Plant Sci.163:427-439.
Seithe, A. and Anderson, G.J. (1982). Hair Morphology and the relationships of
species in Solanum sect. Basarthun. Plant. Sits, Evol.139:229-256.

89
Serrone, D.P., Attorri, L., Gallinella, B., Gallo, R.F., Federici, E. and Plaazzino, G.
(2006). Molecular identification of Panax ginseng C.A. Meyer in Ginseng
Commercial Product, Natural Product Communications, 1&12:1137-1140.
Singh, A., Negi, M.S., Rajagopal, J., Bhatia, S., Tomar, O., Srivastava, P.S. and
Lakshmi kumaran, M. (1999). Assessment of genetic diversity in Azadirachta
indica using AFLP markers. Theor. Appl. Genes. 99:1-2, 272-279.
Singh, A.K., Singh, M., Singh, A.K., Singh, R., Kumar, S. and Kalloo, G. (2006).
Genetic diversity within the genus Solanum (Solanaceae) as revealed by RAPD
markers. Current Science. 90: 5.
Shaw, P.C. and But, P. P.H. (1995). Authentication of Panax species and their
adulterants by random- primed polymerase chain reaction. Plenta Medica.
61:466-469.
Sheh, M.L. and Su, P. (1987). The floristic analysis of endemic genera in Chinese
Umbellifferae. In S.A. He (ed.), Bulletin of the Nanjing Botaincal Garden
Mem. Sun Yat Sen. Jiangsu Sci. and Tech. Press, Nanjing. 33-36.
Shin, C.S., Park, S.Y., Jo, J.S. and Lin, Y.P.C. (1998). Classification of the
Ginseng by using RAPD analysis and the markers for identification of Korean
Ginseng, Advances in Ginseng Research Proc.7th Int. symp. on Ginseng, Huon
Heh, Kang Ju Choi, and Young Choong Kim,Eds,Seoul, Korea. 126-127.
Sneath, P.H.A. and Sokal R.R. (1973). Freeman, San Francisco. The principle and
practice of numerical classification. W.H. Freeman and Co. San Francisco.573.
Su, P. and Sheh, M.C. (1990). Study on pollen morphology of endemic genera in
Chinse umbellifferal. In. S.R.led., Bulletin of the Nanjing Botanical Garden
Mem. Sun yet sen Jiangsu, Sci. and Tech. Press, Nanjing. 33-36.
Vaidyaratnam, P.S., Variers. (1994). Indian Medicinal plants accomplished of 500 Species,
(Warrier, P.K., Nambiar, V.P.K., Ramankutty Eds), by Orient Longman Publication,
Hyderabad, 2:52-55
Vos, P. et al. (1995). A new technique for DNA fingerprinting, Nucleic Acids Res., 23:4407-
4414.
90
Warude, D. (2003). DNA isolation from fresh and dry plant samples with highly acidic tissue
extracts. Plant Mol.Biol. 21:467-487.
Weiner, M.A. and Weiner, J. (1994). Ashwagandha (India ginseng), In. Herbs that Heal.
Quantum Books, Mill Valley, CA: 70–72.
Weishing, K., Nybom, H., Wolff., K. and Meyer, W. (1995). DNA isolation and purification,
In DNA fingerprinting in Plants and Fungi, CRC Press, Boca Raton, Florida. 44-59.
Welsh, J. and Mc Clellard, M. (1990). Fingerprinting genomes using PCR with arbitrary
primers. Nucleic Acids Res., 18:7212-7218.
Whitkus, R., Doebley, J. and Wendel, J.F. (1994). Nuclear DNA markers in systematic and
evolution. 116-141.
Wilde, J. Waugh,R. and Powell,W. (1992). Genetic fingerprinting of
Theobrona dones using RAPD(lap) markers. Theor, Appl, Genet, 85:871-877.
Williams, J.G.K., Kubelik, A.R., Livak, K.J., Rafalsk, J.A. and Tingey, S.V. (1990). DNA
polymorphisms Amplified by arbitrary primers are useful as genetic markers. Nucleic
Acids Res. 18:6531-6535.
Wilkie, S.F., Inaac, P.G. and Slater R.J. (1993). Random Amplified Polymorphic DNA
(RAPD) markers for genetic analysis in Allium. Theor.Appl.Genet 86:497-504.
Wolff, K. and Petus-Van Run J. (1993). Rapid detection of genetic variability in
Chrysenthemam (Dendranthema grandifolra Tzvellev.) using random primers. Heredity,
71:335-341.
Zhang, Z.H., Wu, Z.J. and Liu, X.T. (1991). Conservation and Study of Endangered Plant.
Chinese Environment Science Press. Beijing, 187-188.
Zhu, J., Galc, M.D., Quarric, S., Jackson, M.T. and Bryan, G.J. (1998). AFLP markers for the
study of rice biodiversity. Theor.Appl.Genet. 96:602-611

91
APPENDICES
92
APPENDIX I
• Extraction buffer /CTAB buffer
2% CTAB
100 mM Tris HCl pH 8
20 mM EDTA disodium salt
1.4M NaCl
4 % PVP
β-Mercaptoethanol – 2µl
• ‘WET ‘ Chloroform :
Chloroform: Isoamyl alcohol (24:1)
• RNAse:
10mg/ml was prepared, kept in water bath for 15 min and then
stored at -20°C.
• Wash buffer:
10mM Ammonium acetate
76% Ethanol.
• TE Buffer:
10mM Tris Hcl pH 7.4
1mM EDTA (disodium salt)
• 5X TBE:
53.9 g Tris base
27.6 g Boric acid
9.3 g EDTA
93
APPENDIX II
DNA ELECTROPHORESIS IN AGAROSE GEL ELECTROPHORESIS
(Maniatis et al., 1982)
DNA can be checked for size, intactness, homogeneity and purity by this
technique.
Principle
Agarose forms a gel by hydrogen bonding and the gel pore size depends
on the agarose concentration. The DNA molecules are separated by
electrophoresis on the basis of their size, shape and magnitude of net charge on
the molecules. The dye ethidium bromide intercalates between the bases of
RNA and DNA and fluorescence orange when irradiated with UV light. Low
concentration agarose gels with large pore permit fractionation of high
molecular weight molecules and vice versa.
TBE Buffer:
Tris Borate buffer (TBE) – 1X
0.9 M Tris HCl
0.025M EDTA (disodium salt)
0.9M Boric acid
Agarose:
Agarose - 0.8 % w/v in TBE 1X
Tracking dye:
10mM Tris HCl (pH 7.6)
0.03% Bromophenol blue
0.03% Xylene cyanol FF

94
60mM EDTA
60% Glycerol
Ethidium Bromide (0.1mg/ml)
PROCEDURE
• The agarose gel is prepared by dissolving 2.0g in 100ml of 1X TBE
buffer and was kept in oven until it is completely dissolved (3 min).
• When the temperature was around 60˚C, 50µl of EtBr was added
to the solution and mixed well.
• The gel was poured to the cleaned and sealed gel template
arranged with the suitable comb. Air bubbles were removed if
formed. The gel was allowed to polymerize.
• The gel along with the template and seal removed was placed in
the electrophoresis tank which was previously filled with 1X TBE
buffer.
• About 3µl of the genomic DNA with 2µl of loading dye was
loaded into the wells.
• Hind III digest/ λ DNA marker is added to the lane parallel to the
unknown samples. The bands observed can be compared to those
of the unknown in order to determine their size. The distance a
band travels is approximately inversely proportional to the
logarithm of the size of the molecule.
• The gel was allowed to run at 5V/cm for 45 min. It was then
documented under UV Transilluminator.

95

96