assessment of food supply under water scarcity …
TRANSCRIPT
JORDAN CASE STUDY
ASSESSMENT OF FOOD SUPPLY UNDER WATER SCARCITY CONDITIONS IN THE NEAR EAST AND NORTH AFRICA REGION APPLYING THE FOOD SUPPLY COST CURVE APPROACH


Food and Agriculture Organization of the United NationsCairo, 2018
Author
National Multidisciplinary Team Jordan
ASSESSMENT OF FOOD SUPPLY UNDER WATER SCARCITY CONDITIONS IN THE NEAR EAST AND NORTH AFRICA REGIONAPPLYING THE FOOD SUPPLY COST CURVE APPROACH
JORDAN CASE STUDY

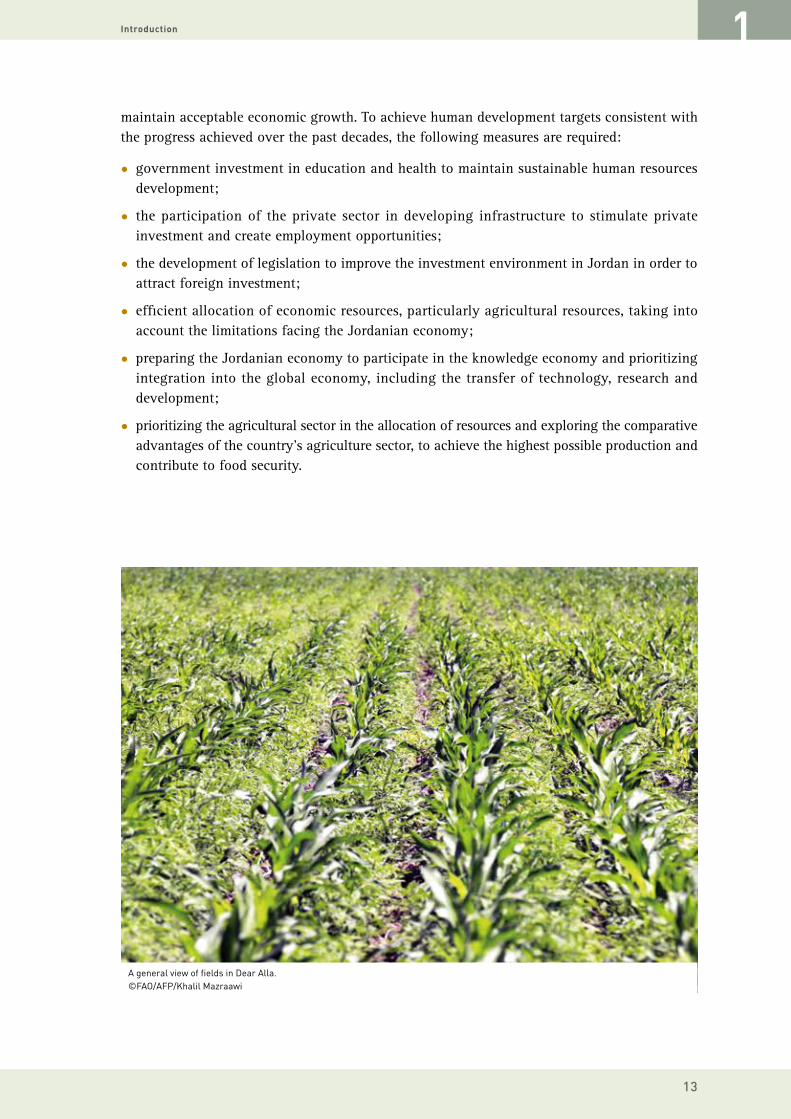
Cover and back cover photosA general view of fields in Dear Alla, 50 kilometers west of Amman, part of the integrated pest management project in the countries of the Near East.
©FAO/Khalil Mazraawi
FAO. 2018. Assessment of Food Supply under Water Scarcity Conditions in the Near East and North Africa region- Jordan case study. Rome. 144 pp.
License: CC BY-NC-SA 3.0 IGO.
The designations employed and the presentation of material in this information product do not imply the expression of any opinion whatsoever on the part of the Food and Agriculture Organization of the United Nations (FAO) concerning the legal or development status of any country, territory, city or area or of its authorities, or concerning the delimitation of its frontiers or boundaries. The mention of specific companies or products of manufacturers, whether or not these have been patented, does not imply that these have been endorsed or recommended by FAO in preference to others of a similar nature that are not mentioned.
The views expressed in this information product are those of the author(s) and do not necessarily reflect the views or policies of FAO.
ISBN 978-92-5-130872-1
© FAO, 2018
Some rights reserved. This work is made available under the Creative Commons Attribution-NonCommercial-ShareAlike 3.0 IGO licence (CC BY-NC-SA 3.0 IGO; https://creativecommons.org/licenses/by-nc-sa/3.0/igo).
Under the terms of this licence, this work may be copied, redistributed and adapted for non-commercial purposes, provided that the work is appropriately cited. In any use of this work, there should be no suggestion that FAO endorses any specific organization, products or services. The use of the FAO logo is not permitted. If the work is adapted, then it must be licensed under the same or equivalent Creative Commons license. If a translation of this work is created, it must include the following disclaimer along with the required citation: “This translation was not created by the Food and Agriculture Organization of the United Nations (FAO). FAO is not responsible for the content or accuracy of this translation. The original [Language] edition shall be the authoritative edition.
Any mediation relating to disputes arising under the licence shall be conducted in accordance with the Arbitration Rules of the United Nations Commission on International Trade Law (UNCITRAL) as at present in force.
Third-party materials. Users wishing to reuse material from this work that is attributed to a third party, such as tables, figures or images, are responsible for determining whether permission is needed for that reuse and for obtaining permission from the copyright holder. The risk of claims resulting from infringement of any third-party-owned component in the work rests solely with the user.
Sales, rights and licensing. FAO information products are available on the FAO website (www.fao.org/publications) and can be purchased through [email protected]. Requests for commercial use should be submitted via: www.fao.org/contact-us/licence-request. Queries regarding rights and licensing should be submitted to: [email protected].
Required citation: Author (corporate or personal). Year of publication. Publication title. [Series.] Place of publication, Publisher (if different to author). Number of pages (total including preliminary pages). Licence: CC BY-NC-SA 3.0 IGO.
The designations employed and the presentation of material in this information product do not imply the expression of any opinion whatsoever on the part of the Food and Agriculture Organization of the United Nations (FAO) concerning the legal or development status of any country, territory, city or area or of its authorities, or concerning the delimitation of its frontiers or boundaries. The mention of specific companies or products of manufacturers, whether or not these have been patented, does not imply that these have been endorsed or recommended by FAO in preference to others of a similar nature that are not mentioned. The views expressed in this information product are those of the author(s) and do not necessarily reflect the views or policies of FAO. ISBN 978-92-5-130872-1 © FAO, 2018
Some rights reserved. This work is made available under the Creative Commons Attribution-NonCommercial-ShareAlike 3.0 IGO licence (CC BY-NC-SA 3.0 IGO; https://creativecommons.org/licenses/by-nc-sa/3.0/igo). Under the terms of this licence, this work may be copied, redistributed and adapted for non-commercial purposes, provided that the work is appropriately cited. In any use of this work, there should be no suggestion that FAO endorses any specific organization, products or services. The use of the FAO logo is not permitted. If the work is adapted, then it must be licensed under the same or equivalent Creative Commons license. If a translation of this work is created, it must include the following disclaimer along with the required citation: “This translation was not created by the Food and Agriculture Organization of the United Nations (FAO). FAO is not responsible for the content or accuracy of this translation. The original [Language] edition shall be the authoritative edition. Any mediation relating to disputes arising under the licence shall be conducted in accordance with the Arbitration Rules of the United Nations Commission on International Trade Law (UNCITRAL) as at present in force. Third-party materials. Users wishing to reuse material from this work that is attributed to a third party, such as tables, figures or images, are responsible for determining whether permission is needed for that reuse and for obtaining permission from the copyright holder. The risk of claims resulting from infringement of any third-party-owned component in the work rests solely with the user. Sales, rights and licensing. FAO information products are available on the FAO website (www.fao.org/publications) and can be purchased through [email protected]. Requests for commercial use should be submitted via: www.fao.org/contact-us/licence-request. Queries regarding rights and licensing should be submitted to: [email protected].
iiiiii
CONTENTS
Foreword ..................................................................................................................................................... ixAcknowledgements ....................................................................................................................................xiAbbreviations and acronyms .................................................................................................................... xiiExecutive summary .................................................................................................................................. xiii
1. Introduction ...........................................................................................................................................1
1.1 Geography of Jordan .....................................................................................................................1
1.2 Climate ...........................................................................................................................................3
1.3 Land use in Jordan ........................................................................................................................5
1.4 Urban encroachment on agricultural lands ...............................................................................7
1.5 Population and human development ..........................................................................................71.6 Econony of Jordan .........................................................................................................................9
1.7 Recommendations ......................................................................................................................12
2. Water accounting in Jordan ...............................................................................................................15
2.1 Introduction .................................................................................................................................15
2.2 Water demand .............................................................................................................................15
2.3 Water supply ................................................................................................................................18
2.4 Water resources ..........................................................................................................................192.4.1. Groundwater .......................................................................................................................192.4.2. Surface water ......................................................................................................................202.4.3. Wastewater .........................................................................................................................22
2.5 Water policies and legislation ....................................................................................................232.5.1. Irrigated agriculture policy .................................................................................................242.5.2. Maximum efficiency of water use in irrigation ...................................................................252.5.3. Water management for irrigated agriculture.....................................................................252.5.4. Improvements to irrigated agriculture ...............................................................................262.5.5. Institutional support for irrigated agriculture ....................................................................272.5.6. Water management ............................................................................................................282.5.7. Institutional reform .............................................................................................................29
2.6 Irrigation water ...........................................................................................................................30
2.7 Wastewater reuse in agriculture ...............................................................................................31
2.8 Water harvesting in Badia ..........................................................................................................33
2.9 Recommendations ......................................................................................................................34
3. Agriculture and food gap ....................................................................................................................37
3.1 Introduction .................................................................................................................................37
3.2 Farming systems ........................................................................................................................37
3.3 Cropping pattern .........................................................................................................................39
3.4 Agricultural production ..............................................................................................................41
3.5 Cereal production .......................................................................................................................43
3.6 Vegetable area and production ..................................................................................................47
3.7 Fruit production...........................................................................................................................50

ASSESSMENT OF FOOD SUPPLY UNDER WATER SCARCITY CONDITIONS IN THE NENA REGION APPLYING THE FOOD SUPPLY COST CURVE (FSCC) APPROACH
iv
3.8 The most important crops grown in Jordan .............................................................................553.8.1. The most important crops in terms of production area .....................................................553.8.2. The most important crops in terms of production .............................................................563.8.3. Most important crops in terms of yield ..............................................................................57
3.9 Livestock ......................................................................................................................................573.9.1. Number of livestock............................................................................................................573.9.2. Animal production ..............................................................................................................59
3.10 Future of agriculture...................................................................................................................60
3.11 SWOT analysis .............................................................................................................................623.11.1. Analysis of the internal environment ..............................................................................623.11.2. Analysis of the external environment .............................................................................64
3.12 Climate change and agriculture in Jordan ...............................................................................66
3.13 Food Gap ......................................................................................................................................693.13.1. Food Needs ......................................................................................................................693.13.2 Food self-sufficiency .......................................................................................................703.13.3. Food Gap ..........................................................................................................................71
3.14 Recommendations ......................................................................................................................73
4. Food supply cost curve .......................................................................................................................77
4.1 Food production and consumption ............................................................................................77
4.2 Effect of Syrian crisis on food consumption .............................................................................79
4.3 Food security ...............................................................................................................................80
4.4 Government policy ......................................................................................................................83
4.5 Value of water in the agricultural sector ..................................................................................86
4.6 Irrigation development in Jordan ..............................................................................................86
4.7 Irrigation water used for agricultural crops .............................................................................87
4.8 Value of water for field crops .....................................................................................................884.8.1. Water use for field crop irrigation ......................................................................................884.8.2. Value of water in field crops ...............................................................................................89
4.9 Value of water for winter vegetables .........................................................................................914.9.1. Water use for irrigation of winter vegetables .....................................................................914.9.2. Value of water for winter vegetables ..................................................................................92
4.10 Value of water for summer vegetables .....................................................................................944.10.1. Water use for summer vegetable irrigation ....................................................................944.10.2. Value of water for summer vegetables ...........................................................................95
4.11 Value of water for fruit production ............................................................................................974.11.1. Water use for fruit tree irrigation ....................................................................................974.11.2. Value of water for fruits ..................................................................................................98
4.12 Opportunities to increase food supply ....................................................................................1004.12.1. Increasing production of olives in rain-fed areas ........................................................1014.12.2. Increase in production of potatoes in the highlands.....................................................104
4.13 Food Supply Cost Curve ............................................................................................................111
4.14 Recommendations ....................................................................................................................113
5. Conclusions and recommendations ...............................................................................................115
5.1 Conclusions ...............................................................................................................................115
5.2 Recommendations ....................................................................................................................115
6. References .........................................................................................................................................117

v
7. Annex ...................................................................................................................................................119
7.1 Annex Irrigated and non-irrigated area under winter vegetable cultivation, 2012 ....................119
7.2 Annex Irrigated and non-irrigated area under summer vegetable cultivation, 2012 ................120
7.3 Annex Irrigated and non-irrigated area under fruit tree cultivation, 2012 .................................121
7.4 Annex Irrigated and non-irrigated area under field crop cultivation, 2012 ................................122
7.5 Annex Area cultivated and production, 2012 .................................................................................122
7.6 Annex Food Gap and SSR, 2010, 2011 and 2012 ............................................................................124
7.7 Annex Mean maximum air temperature (°C), 1960-2013 ............................................................125
7.8 Annex Mean minimum air temperature (°C), 1960-2013 .............................................................126
7.9 Annex Total amount of rainfall (mm), 1960-2013 ..........................................................................127

ASSESSMENT OF FOOD SUPPLY UNDER WATER SCARCITY CONDITIONS IN THE NENA REGION APPLYING THE FOOD SUPPLY COST CURVE (FSCC) APPROACH
vi
TABLES
1.1 Distribution of Jordan’s surface area ........................................................................................ 11.2 Ratio of total surface area to agricultural land area by year .................................................... 31.3 Rainfall depth and distribution over Jordan's zones ................................................................ 31.4 Basic statistics and population ................................................................................................. 81.5 Human development indicators ................................................................................................ 91.6 Gross domestic product by economic activity at current prices relative share (%) ............... 112.1 Evolution of water resources and demand in MCM/Y ............................................................. 172.2 Groundwater basins ................................................................................................................ 202.3 Wastewater treatment plants in Jordan, 2014 ........................................................................ 232.4 Rain-fed and irrigated agricultural areas in Jordan ............................................................... 262.5 Water consumption for irrigation in Jordan ............................................................................ 302.6 Number of water harvesting structures in Badia and their capacity (MCM) .......................... 333.1 Type of holding by area and number ....................................................................................... 373.2 Type of cultivated holding by area and number ...................................................................... 393.3 Type of holding by number and animal head .......................................................................... 393.4 Cultivated area by type of cultivation, 1971 to 2013 ................................................................ 403.5 Cropping pattern by area and production, 2013 ...................................................................... 423.6 Average total area of field crops and of cultivated land and the ratio, 1971–2013 ................. 433.7 Field crops by cultivated area, 2013 ........................................................................................ 463.8 Average total area of vegeproduction and total cultivated land, 1971 to 2013 ....................... 473.9 Area, yield and production of vegetables in Jordan, 2013 ...................................................... 503.10 Average area of fruit cultivation and total cultivated land, 1971–2013 ................................... 513.11 Fruit production by area, yield and amount, 2013 ................................................................... 543.12 Average livestock numbers, 1971 to 2013 ............................................................................... 583.13 Livestock production in amount and value, 2013 .................................................................... 603.14 Food needs, 2012 ..................................................................................................................... 703.15 Production, consumption and SSR by food type, 2012 ............................................................ 703.16 Food gap in terms of quantity and ratio, 2012 ......................................................................... 724.1 Annual average food consumption and growth rate (tons and %) .......................................... 784.2 Annual average food consumption and growth rate since the start of the Syrian
crisis (tons and %) ................................................................................................................... 804.3 Food imports versus local production ..................................................................................... 814.4 Food imports versus local production, with the Syrian crisis ................................................. 814.5 Production and SSR of food types, 2009 vs. 2012 .................................................................... 824.6 Irrigated area by tree crops, field crops and vegecrops (ha) and their variations,
1994 and 2013 .......................................................................................................................... 854.7 Area and production of field crops by type of agriculture, 2013 ............................................. 864.8 Cropped area and production by crop type, 2013 .................................................................... 874.9 Area and water use in irrigated crops, 2013 ........................................................................... 884.10 Area and water use in irrigated field crops, 2013 ................................................................... 894.11 Computed water values (USD/m3) for field crops in different regions in Jordan, 2013 .......... 904.12 Area and water use for irrigated winter vegetables, 2013 ...................................................... 914.13 Water values (USD/m3) for winter vegetables, 2013 ............................................................... 92

vii
4.14 Area and water use for irrigated summer vegetables, 2013 .................................................. 954.15 Water values (USD/m3) for summer vegetables, 2013 ............................................................ 964.16 Areas and water use for irrigated fruit trees, 2013 ................................................................ 984.17 Water values (USD/m3) for fruits, 2013 ................................................................................... 994.18 Capital cost for olive cultivation in the highlands ................................................................. 1024.19 Variable costs for olive cultivation in the highlands.............................................................. 1034.20 Costs and returns for olive cultivation in the highlands ....................................................... 1034.21 Weighted olive prices in local markets ................................................................................. 1044.22 Capital costs for potato production in the highlands ............................................................ 1054.23 Variable costs for olive and potato production in the highlands ........................................... 1064.24 Costs and returns for olive and potato cultivation in the highlands ..................................... 1064.25 Weighted potato prices in local markets ............................................................................... 1074.26 Capital costs for the cultivation of citrus fruits and onions .................................................. 1084.27 Variable costs for the cultivation of citrus fruits and onions ................................................ 1094.28 Indicator analysis of costs and returns for the cultivation of citrus fruits and onions ......... 1104.29 Weighted citrus fruit and onion prices in local markets ....................................................... 110

ASSESSMENT OF FOOD SUPPLY UNDER WATER SCARCITY CONDITIONS IN THE NENA REGION APPLYING THE FOOD SUPPLY COST CURVE (FSCC) APPROACH
viii
FIGURES
1.1 Map of Jordan by governorate ................................................................................................. 181.2 Annual rainfall map of Jordan ................................................................................................. 201.3 Exising land use in Jordan ...................................................................................................... 222.1 Location of refugees in Jordan ................................................................................................ 332.2 Sources of surface water and dams in Jordan ........................................................................ 382.3 Irrigation water demand, use and deficit ................................................................................ 503.1 Composition of surface area of Jordan ................................................................................... 573.2 Agricultural change patterns, 1971 to 2013 ............................................................................ 603.3 Prevailing agricultural pattern, 1971 to 2013 ......................................................................... 603.4 Production of agricultural crops, 2012 ................................................................................... 613.5 Average area of field crops, 1971 to 2013 ............................................................................... 623.6 Field crops by area, 2013 ......................................................................................................... 633.7 Field crops by production, 2013 .............................................................................................. 633.8 Average area of vegetables, 1971 to 2013 ............................................................................... 653.9 Area of vegetable production, 2013 ......................................................................................... 653.10 Average production of vegetables, 2013 ................................................................................. 663.11 Area of fruit production, 1971 to 2013 ..................................................................................... 683.12 Average area of fruit production, 2013 .................................................................................... 693.13 Average production of fruits, 2013 .......................................................................................... 693.14 Main crops by area, 2013 ......................................................................................................... 713.15 Main crops by production, 2013 ............................................................................................... 713.16 Average yield of the most important crops, 2013 (ton/ha) ...................................................... 723.17 Livestock by type, 1971 to 2013 ............................................................................................... 733.18 Livestock by type, 2013 ............................................................................................................ 743.19 Total amount of rainfall (mm), 1960 to 2013 ........................................................................... 843.20 Mean, minimum and maximum air temperature by season, 1960 to 2013 (°C) ..................... 843.21 Food needs, 2012 (1 000 tons and %) ...................................................................................... 863.22 Production, consumption and SSR by food type, 2012 (1 000 tons and %) ............................. 873.23 Food gap, 2012 (1 000 tons and %) .......................................................................................... 944.1 SSR, 2009 and 2012 ................................................................................................................. 974.2 Irrigated area, 1994 and 2012 (ha) ........................................................................................ 1004.3 Water values in the highlands and JV for field crops, 2013 .................................................. 1054.4 Water values in the highlands and Jordan Valley for winter vegetables, 2013 ..................... 1084.5 Water values in the highlands and Jordan Valley for summer vegetables, 2013 ................. 1114.6 Water values for fruit trees, 2013 .......................................................................................... 1144.7 Food gap in Jordan, 2013 ....................................................................................................... 1264.8 Irrigation water use and water irrigation consumption in Jordan, 2013 .............................. 1274.9 Effect of three scenarios on the food gap ............................................................................. 1284.10 Effect of three scenarios on irrigation water use and on irrigation water consumption ..... 129
ix
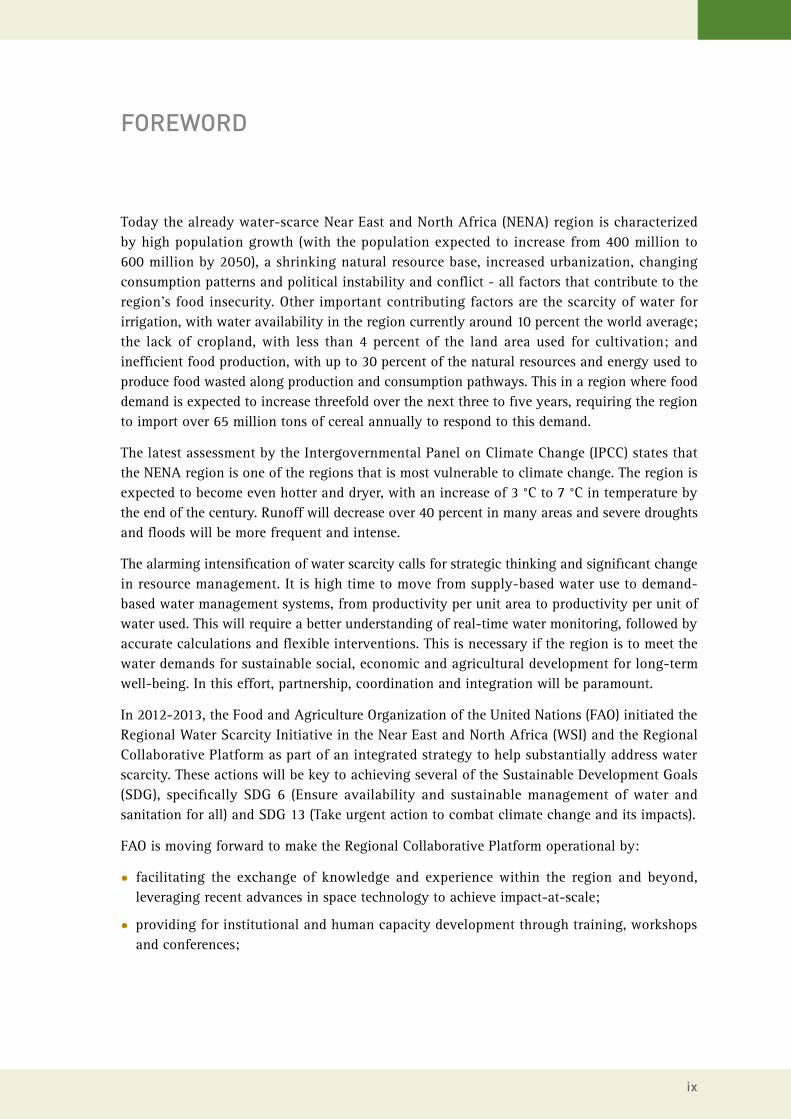
FOREWORD
Today the already water-scarce Near East and North Africa (NENA) region is characterized by high population growth (with the population expected to increase from 400 million to 600 million by 2050), a shrinking natural resource base, increased urbanization, changing consumption patterns and political instability and conflict - all factors that contribute to the region’s food insecurity. Other important contributing factors are the scarcity of water for irrigation, with water availability in the region currently around 10 percent the world average; the lack of cropland, with less than 4 percent of the land area used for cultivation; and inefficient food production, with up to 30 percent of the natural resources and energy used to produce food wasted along production and consumption pathways. This in a region where food demand is expected to increase threefold over the next three to five years, requiring the region to import over 65 million tons of cereal annually to respond to this demand.
The latest assessment by the Intergovernmental Panel on Climate Change (IPCC) states that the NENA region is one of the regions that is most vulnerable to climate change. The region is expected to become even hotter and dryer, with an increase of 3 °C to 7 °C in temperature by the end of the century. Runoff will decrease over 40 percent in many areas and severe droughts and floods will be more frequent and intense.
The alarming intensification of water scarcity calls for strategic thinking and significant change in resource management. It is high time to move from supply-based water use to demand-based water management systems, from productivity per unit area to productivity per unit of water used. This will require a better understanding of real-time water monitoring, followed by accurate calculations and flexible interventions. This is necessary if the region is to meet the water demands for sustainable social, economic and agricultural development for long-term well-being. In this effort, partnership, coordination and integration will be paramount.
In 2012-2013, the Food and Agriculture Organization of the United Nations (FAO) initiated the Regional Water Scarcity Initiative in the Near East and North Africa (WSI) and the Regional Collaborative Platform as part of an integrated strategy to help substantially address water scarcity. These actions will be key to achieving several of the Sustainable Development Goals (SDG), specifically SDG 6 (Ensure availability and sustainable management of water and sanitation for all) and SDG 13 (Take urgent action to combat climate change and its impacts).
FAO is moving forward to make the Regional Collaborative Platform operational by:
• facilitating the exchange of knowledge and experience within the region and beyond, leveraging recent advances in space technology to achieve impact-at-scale;
• providing for institutional and human capacity development through training, workshops and conferences;

ASSESSMENT OF FOOD SUPPLY UNDER WATER SCARCITY CONDITIONS IN THE NENA REGION APPLYING THE FOOD SUPPLY COST CURVE (FSCC) APPROACH
x
• supporting the Initiative’s focal countries in agricultural water planning, including water accounting, water consumption, water productivity and climate change and drought management, in order to increase the coping capacity of people facing water scarcity and climate change impacts.
FAO and its WSI partners, including Egypt, Jordan, Morocco, Tunisia and Oman as pilot countries, are identifying the needed changes. The WSI created a national multidisciplinary team (NMDT) in Jordan, which carried out analyses in agriculture and food gaps, rapid water accounting and food supply cost curve – a milestone for the WSI. This report on Jordan draws from these analyses and focuses on three major aspects of agriculture: policy, institutions and agricultural performance.
The FAO Regional Office for Near East and North Africa (FAO RNE) and its partners, in collaboration with Member Countries, will continue provide support to deal with the region’s challenges; to reinforce the institutional and human capacities needed to address agricultural, water and climate change issues and their impact on food security and livelihoods; and to establish a mechanism for promoting needed collaboration and partnerships.
Abdessalam Ould AhmedAssistant Director General Regional Representative for the Near East and North AfricaFAO RNE

xi
ACKNOWLEDGEMENTS
This report was prepared within the framework of the FAO Regional Water Scarcity Initiative in the Near East and North Africa (WSI), with the participation of the Government of the Hashemite Kingdom of Jordan through the Ministry of Agriculture. The report focuses on three major areas related to agriculture - policy, institutions and agricultural performance - utilizing the food supply cost curve approach.
The WSI successfully formed a national multidisciplinary team (NMDT) in Jordan with representatives from the Ministry of Agriculture, the Ministry of Water Resources and Irrigation, the Ministry of Environment, the Directorate of Statistics, the Jordan Valley Authority, the National Center for Agricultural Research and Extension and the Jordan Valley Authority, in addition to the FAO technical team, Pasquale Steduto, Fawzi Karajeh and Faycel Chenini. The FAO RNE support team, including Elodie Perrat and Heba Fahmy, also assisted in the preparation of the report.
The authors wish to express their appreciation to His Excellency Mr. Akef Al Zoubi, Minister of Agriculture of Jordan; His Excellency Mr. Radi Al Trawneh, Secretary General of the Ministry of Agriculture of Jordan; and to the members of the National Multidisciplinary Team: Jamal Albatsh, General Secretary Assistant for Plant Production of the Ministry of Agriculture; Adnan Alsous, Director of Water Harvesting of the Jordan Valley Authority; Ra’id Bani Hani, from the Ministry of the Environment; Ayman Al-Hadid, Director of the Department of Water Harvesting of the Jordan Valley Authority; Fuad Irteimeh, Director of the Agricultural Statistics Department of the Directorate of Statistics; Mahmoud Al-Oran, General Director of the Jordan Farmers’ Union; Mahmood Al-Rabi, Director of Studies and Policies of the Ministry of Agriculture; Muna Saba, Supervisor and Drought Monitoring Unit of the National Center for Agricultural Research and Extension; Suliman Sawalha, Director of the Department of Land and Irrigation of the Ministry of Agriculture and Ali Subah, General Secretary Assistant of the Ministry of Water and Irrigation.
Dr. Akef Al ZoubiH.E. The Minister of Agricultural of Jordan
Dr. Radi Al TarawnehH.E. The Secretary General of the Minister of
Agricultural of Jordan
ASSESSMENT OF FOOD SUPPLY UNDER WATER SCARCITY CONDITIONS IN THE NENA REGION APPLYING THE FOOD SUPPLY COST CURVE (FSCC) APPROACH
xii
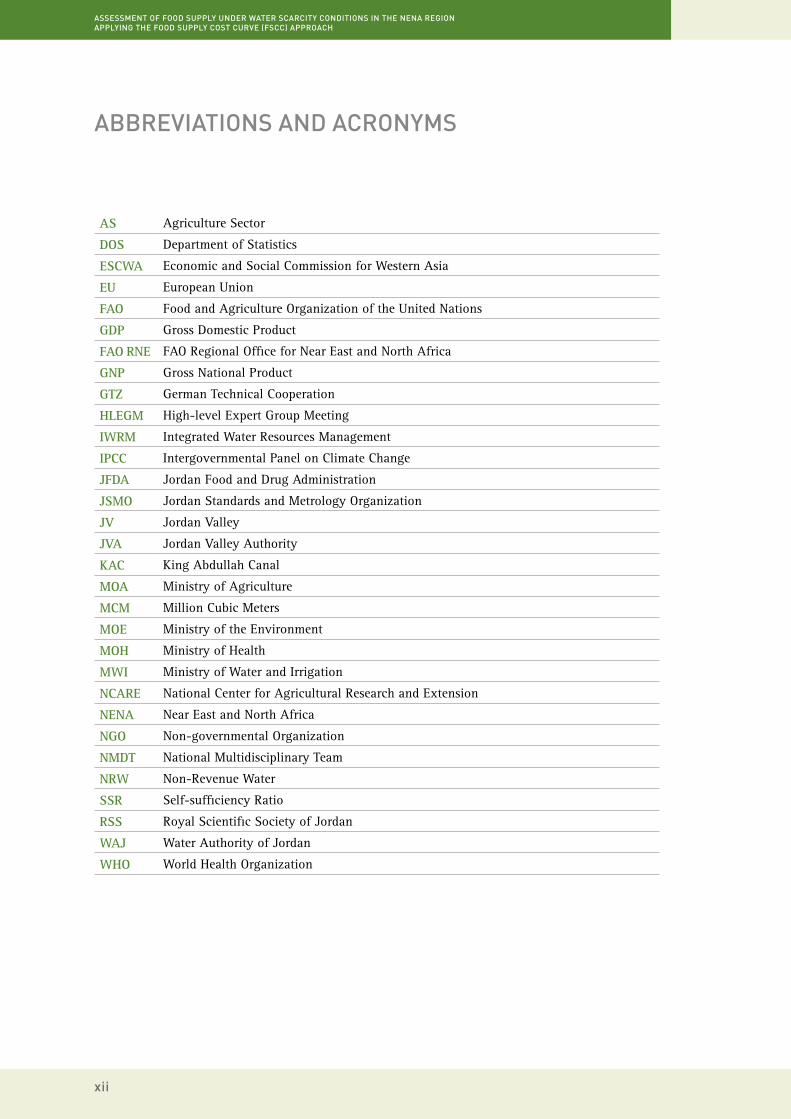
ABBREVIATIONS AND ACRONYMS
AS Agriculture Sector
DOS Department of Statistics
ESCWA Economic and Social Commission for Western Asia
EU European Union
FAO Food and Agriculture Organization of the United Nations
GDP Gross Domestic Product
FAO RNE FAO Regional Office for Near East and North Africa
GNP Gross National Product
GTZ German Technical Cooperation
HLEGM High-level Expert Group Meeting
IWRM Integrated Water Resources Management
IPCC Intergovernmental Panel on Climate Change
JFDA Jordan Food and Drug Administration
JSMO Jordan Standards and Metrology Organization
JV Jordan Valley
JVA Jordan Valley Authority
KAC King Abdullah Canal
MOA Ministry of Agriculture
MCM Million Cubic Meters
MOE Ministry of the Environment
MOH Ministry of Health
MWI Ministry of Water and Irrigation
NCARE National Center for Agricultural Research and Extension
NENA Near East and North Africa
NGO Non-governmental Organization
NMDT National Multidisciplinary Team
NRW Non-Revenue Water
SSR Self-sufficiency Ratio
RSS Royal Scientific Society of Jordan
WAJ Water Authority of Jordan
WHO World Health Organization
xiii
EXECUTIVE SUMMARY
The FAO Regional Water Scarcity Initiative in the Near East and North Africa (WSI) was created in 2013. The initiative focuses on the water sector priorities of the Member Countries and is based on the principles of country ownership, participation and partnership. The initiative supports the countries in coping with one of their most important challenges: How to secure food supply under water scarcity conditions while ensuring sustainable socio-economic development.
Within this initiative, FAO is dedicating considerable effort and implementing activities to support Member Countries in enhancing policies, governance and best practices related to the sustainable allocation of scarce water resources, water productivity, water efficiency and water auditing and is providing optimal tools for strategic planning.
FAO commissioned the production of concise country reports (case studies) to assess food supply under water scarcity conditions in the region, applying the food supply cost curve approach in the focus countries: Egypt, Morocco, Jordan, Tunisia and Oman.
This report assesses the situation in Jordan, where demographic growth, the tendency to increase food self-sufficiency, urban expansion, increasing energy demand, overall socio-economic development, climate change and the considerable degradation of water quality are key factors driving the increasing water scarcity. The report analyses three major aspects of agriculture: food gap, rapid water accounting and food supply cost curve.
The gap analysis highlights the negatives effects of natural resource scarcity on the Jordanian economy. There is a limited amount of land available to support the expansion of different economic activities, including agriculture, industry, services and activities in other economic sectors. Agricultural area in particular comprises only 2.8 percent of the country’s total surface area. Water is also limited, with current use for various purposes at 850 million m3 (MCM) (135 m3 per capita per year) – a level indicating absolute water scarcity.
Despite these challenges, efforts are being made to strengthen Jordan’s economy. For instance, the country is focusing more on human resource development. However, the current global financial crisis and political instability in the NENA region require further efforts in order to maintain acceptable levels of economic growth. Greater government investment in both education and health would help maintain stable human resources development. It is also necessary for the government to encourage private sector investment, which may require legislation to improve the investment environment in particular and the Jordanian economy in general.
The agriculture sector in Jordan consumes the majority of the annual water supply (approximately 51 percent), with most of the demand being supplied from groundwater resources due to over abstraction both from legal and illegal agricultural wells. Jordan must strategically plan the allocation of water resources and must review water, food security and energy strategies to ensure that they are aligned with the imperatives of: (i) setting sustainable limits of water consumption and (ii) making the best use of each drop of water.
ASSESSMENT OF FOOD SUPPLY UNDER WATER SCARCITY CONDITIONS IN THE NENA REGION APPLYING THE FOOD SUPPLY COST CURVE (FSCC) APPROACH
xiv
The recurrent influxes of refugees impose further stress on the country’s water resources. To tackle this critical situation, the country must maximize the use of unconventional water resources such as treated wastewater for agricultural purposes and desalinized brackish water. In addition, water networks must be rehabilitated to minimize water loss.
Under the current circumstances, Jordan cannot produce enough grain to cover its domestic demand. Due to the reduced agricultural area, domestic production covers only 6 percent of its demand. Therefore, agricultural policies must focus on expanding agriculture on slope lands in rain-fed areas. This will increase food production, especially olive production.
On the other hand, Jordan produces great quantities of fruits and vegetables in irrigated land areas of the Jordan Valley and in the highlands. Marketing the surplus fruits and vegetables can provide the means to meet the needs for other food products and thus improve food security in the country and reduce the food supply/demand gap.
Agricultural policies, which can contribute to increasing food production in Jordan, should address the following:
• the limited availability of land for cultivation;
• the limited availability of water for agriculture, balancing water for food production and for other economic sectors.
The Food Supply Cost Curve (FSCC) tool was applied for the Jordanian context. The FSCC is a supply curve used to select economically viable investment options in food production on the basis of an implicit cost-benefit analysis. The food policies suggested by the results of the FSCC will address Jordan’s food gap and enhance food security for the local population by:
• increasing olive production in rain-fed agriculture;
• increasing potato production in the highlands;
• increasing onion production in the Jordan Valley.
A number of actions that can be taken to increase food supply and achieve sufficiency in water use in Jordan. These will require agricultural policies that:
• improve agricultural practices for rain-fed olive farms to increase productivity and food production;
• replace fruit tree cultivation with vegetable cultivation, especially in irrigated areas of the highlands and the Jordan Valley, to leverage the higher yields of vegetables crops compared to fruit trees.
The limited water available for agriculture in Jordan reflects the difficulty in balancing water for food production and for other economic sectors. While water is important for food production, water is also needed for other sectors that are important for economic development and job creation. Thus, water use efficiency is the key entry point to identifying the right balance between the water needs of the different sectors.

xv
General view of the greenhouses in the Jordan Valley.©FAO/Marco Longari
Water harvesting in Jordan.©FAO/Faycel Chenini

ASSESSMENT OF FOOD SUPPLY UNDER WATER SCARCITY CONDITIONS IN THE NENA REGION APPLYING THE FOOD SUPPLY COST CURVE APPROACH
xvi
Reforestation with pines.©FAO/Roberto Faidutti
An example of urban animal husbandry showing goats grazing on the citadel in the centre of Amman.©FAO/Jon Spaull

1
Introduction
1.1 Geography of Jordan
Jordan is situated on the southeastern coast of the Mediterranean, between 29° and 33° north latitude and between 36° and 39° east longitude. The country borders Syria to the north, Iraq to the east, Saudi Arabia to the south, and the occupied territories and Israel to the west. Jordan’s total area is approximately 89 318 square kilometres (km2). Its land area (88 778 km2) represents 99.4 percent of the total area, while the remaining 540 km2 represent inland water, mainly the Dead Sea.
Table 1.1 Distribution of Jordan’s surface area
Indicator Area (km2) % of total land area
Land Area 88 778 99.4
Highlands 550 0.6
Plains 10000 11.2
RiftValley 8228 9.2
Badia(semi-desert) 70000 78.4
Territorialwaters 540 0.6
DeadSea 446 0.5
AqabaGulf 94 0.1
Total area 89 318 100.00
HighestpointinJordan:UmDamiMountain(metersabovesealevel) 1854
LowestpointinJordan:DeadSea(metresbelowsealevel) -416
Source: Ministry of Agriculture, Department of Irrigation and Land
Jordan’s land area comprises the following physiographic regions:
• Semi-desert (the Badia): This region is located in the east of the country and covers 70 000 km2, representing 78.4 percent of Jordan’s total land area.
• Plains: This region is considered the most important part of Jordan. It is located in the western side of the country and includes the rain-fed agricultural land where crops, such as wheat and barley, are produced. The plains region measures 10 000 km2 and represents 11.2 percent of the country’s total area.
• Rift Valley: This area includes the farmland in western Jordan, with considerable agricultural production, especially vegetables. The area measures 8 228 km2 and represents 9.2 percent of Jordan’s total land area. The lowest point in the rift valley is the Dead Sea, situated at 416 metres below sea level.
1

ASSESSMENT OF FOOD SUPPLY UNDER WATER SCARCITY CONDITIONS IN THE NENA REGION APPLYING THE FOOD SUPPLY COST CURVE APPROACH
2
• Highlands: This region includes rain-fed agricultural land in western Jordan where fruits and olives are produced. The area measures 550 km2 and represents 0.6 percent of Jordan’s total land area. The tallest peak, Um Dami Mountain, reaches 1 845 metres above sea level.
• Territorial waters: This includes the Dead Sea and the Aqaba Gulf, with a total area of 540 km2, 0.6 percent of Jordan’s total land area.
Figure 1.1 Map of Jordan by governorate
In Jordan, agricultural land accounts for just 10 percent of the total land area. The cultivated area in 2013 of 260 000 hectares (ha) represented 2.9 percent of Jordan’s total land area and 29 percent of the agricultural arable land. Most cultivated land is heavily dependent on
Source: Ministry of the Interior

3
Introduction
rain, denoting high levels of water scarcity, and agricultural production is fluctuates with the seasons. Thus, agricultural production is considerably volatile and the country relies heavily on agricultural imports, especially cereals, despite the fact that Jordan exports some of its own agricultural production. The majority of Jordan’s agricultural output (over 60 percent) is grown in the Jordan Valley, below sea level, where the temperate climate year round is ideal for producing vegetables and fruits. Food is also produced in the country’s highlands - mostly cereals and field crops, and to a lesser extent, seasonal fruits and vegetables. Agricultural production in the semi-arid eastern regions is very limited and its contribution to overall domestic production is generally low.
Table 1.2 Ratio of total surface area to agricultural land area by year
Land 1995 2000 2005 2010 2012 2013
Agriculturallandarea(thousandha) 887.8 887.8 887.8 887.8 887.8 887.8
Cultivatedarea(thousandha) 263.6 235.4 247.5 259.4 246.3 260.9
Cultivatedarea,asa%oftotallandarea 3 2.7 2.8 2.9 2.8 2.9
Cultivatedarea,asa%ofagriculturallandarea 30 27 28 29 28 29
Source: Ministry of Agriculture, Department of Irrigation and Land
1.2 Climate
Jordan is on the eastern margin of the Mediterranean climate zone (eastern Mediterranean climate) with long, dry, hot summers; rainy winters; and relatively dry spring and autumn seasons. More than 93 percent of the country receives less than 200 mm of precipitation annually, which increases from east to west and from south to north. The northwest corner of the country has the highest annual rainfall, at 600 mm, as shown in Figure 1.2.
Average temperatures show a reverse pattern. They increase rapidly from the dissected plateau to the very low ground level, increase gradually from the dissected plateau to the eastern margins of the eastern desert, and decrease gradually from north to south, in line with increasing altitude. Table 1.3 below shows the average rainfall in each of Jordan’s agro-climatic zones, as well as the respective land areas in km2, their share of the total surface area, the weighted average rainfall, and the average volume of rainfall in million cubic metres per year (MCM/yr).
Table 1.3 Rainfall depth and distribution over Jordan’s zones
Land Rainfall(mm)
Area(km2)
Area(%)
Average weighted rainfall
(mm/yr)
Rainfall volume(MCM)
Desert < 100 633849 71.5 53.05 3414
Arid 100–200 19914 22.3 147.00 2947
Marginal 200–300 1965 2.2 250.24 513
Semi-arid 300–500 2947 3.3 393.22 1160
Humid > 500 625 0.7 650.00 390
Total 89 300 100.0 1 493.51 8 424
Source: Ministry of Agriculture, Department of Irrigation and Land

ASSESSMENT OF FOOD SUPPLY UNDER WATER SCARCITY CONDITIONS IN THE NENA REGION APPLYING THE FOOD SUPPLY COST CURVE APPROACH
4
The potential annual evaporation in Jordan varies from a minimum of 1 900 mm in the northwest to more than 4 400 mm in the south and in the east. About 70 percent of the annual evaporation occurs during the dry season, from May to October. These rates are up to 80 times the average amounts of precipitation. Annual evapotranspiration in the desert reaches 2 427 mm for Ma’an and 2 325 mm for Rweishid in the northeast of the country. In the highlands, annual evapotranspiration ranges from 1 485 mm in Rabba to 1 343 mm in Shoubak. Throughout the country, the highest levels of evapotranspiration occur during July and the lowest occur during January. The drainage system in Jordan consists of two major flows. The first drains rainfall and runs towards the eastern desert depressions in the arid region. Most of this rainfall evaporates. The second runs westward to the Jordan Rift Valley, where it ultimately ends up in the Dead Sea. The most important basin in terms of usable water is the Dead Sea Basin, which drains areas located in Syria, Lebanon, Israel and Palestine.
Recent information indicates that Jordan was subject to several climatic changes during the Quaternary, the last episode of which still prevails. These climate variations led to unfavorable conditions for plant growth and the loss of plant cover, resulting in a desertification process that poses a real threat to Jordan’s agricultural lands.
Figure 1.2 Annual rainfall map of Jordan
< 50 mm
50 – 100 mm
100 – 150 mm
150 – 200 mm
200 – 250 mm
250 – 300 mm
300 – 350 mm
350 – 400 mm
400 – 450 mm
450 – 500 mm
500 – 550 mm
550 – 600 mm
> 600 mm
Dead Sea
Legend
Precipitation (NWMP)
0 100 km
Source: Ministry of Agriculture, Department of Irrigation and Land, 2012

5
Introduction
Jordan’s water constraint is the main obstacle to agricultural development. The country’s total renewable fresh water resources amount to an average of 750 MCM per year, around 68 percent of which is used for irrigation. Agricultural development in the country is concentrated in the rainfed areas of the highlands and in irrigated land areas in the Jordan Valley. There are also irrigated agricultural areas in the highlands and, despite the highlands covering only 2 percent of the country’s total surface area, 54 percent of the total water supply is used to irrigate these areas. Jordan consists mainly of a plateau between 700 and 1 200 meters. The irrigated areas are located in the Jordan Valley (33 000 ha), and in the plateau (44 000 ha). In addition, 400 000 ha are suitable for dry land farming, although only half of this potential area is used due to the insecurity associated with erratic rainfall and other seasonal variations. Irrigated agriculture, however, provides most of the agricultural production in Jordan and offers the highest percentage of agricultural jobs and other support services.
The combination of scarce resources, an expanding population and a harsh geography makes Jordan one of the most water-scarce countries in the world. In 2007, water utilization for different purposes reached 850 MCM amounting to 135 m3 per capita per year, considerably below poverty level (500 m3/year). In 2008, the population reached 5.87 million people, with an annual growth rate of 2.2 percent (expected to slow to 1.9 percent by 2022). With the growth of immigration, Jordan has no choice but to utilize any available land and water resources to meet the increased food demand. Due to the huge imbalance in the ‘population–water resources equation’, Jordan is adding treated wastewater effluent to its existing water resources for use in irrigation. The government realizes that in order to protect its groundwater aquifers, it must explore new water resources to support Jordan’s development and to strengthen and increase the economy’s self-reliance. Finally, climate change scenarios predict a further decline in the availability of water.
1.3 Land use in Jordan
Agriculture in Jordan dates back 3 000 years, and various ancient settlements have been discovered that had large areas of reclaimed and utilized land. Many Roman terraces, cisterns and reservoirs still exist in areas around old settlements. In the Madaba, a plains area south of Amman, there is a sophisticated system of water harvesting and storage, which was abandoned long ago. On the margins of the steppe zone, remnants of forest cover and olive presses testify to a past with more humid conditions than those of today.
ASSESSMENT OF FOOD SUPPLY UNDER WATER SCARCITY CONDITIONS IN THE NENA REGION APPLYING THE FOOD SUPPLY COST CURVE APPROACH
6
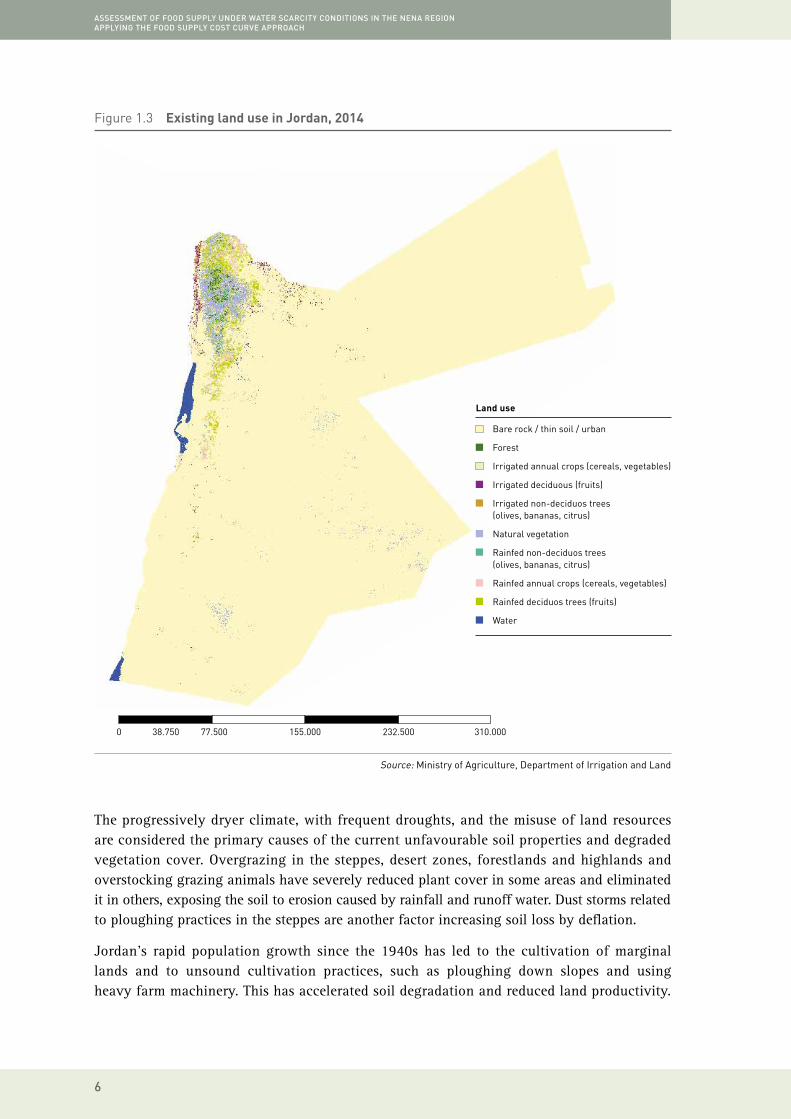
Figure 1.3 Existing land use in Jordan, 2014
The progressively dryer climate, with frequent droughts, and the misuse of land resources are considered the primary causes of the current unfavourable soil properties and degraded vegetation cover. Overgrazing in the steppes, desert zones, forestlands and highlands and overstocking grazing animals have severely reduced plant cover in some areas and eliminated it in others, exposing the soil to erosion caused by rainfall and runoff water. Dust storms related to ploughing practices in the steppes are another factor increasing soil loss by deflation.
Jordan’s rapid population growth since the 1940s has led to the cultivation of marginal lands and to unsound cultivation practices, such as ploughing down slopes and using heavy farm machinery. This has accelerated soil degradation and reduced land productivity.
Source: Ministry of Agriculture, Department of Irrigation and Land
0 38.750 77.500 155.000 232.500 310.000
Bare rock / thin soil / urban
Forest
Irrigated annual crops (cereals, vegetables)
Irrigated deciduous (fruits)
Irrigated non-deciduos trees (olives, bananas, citrus)
Natural vegetation
Rainfed non-deciduos trees (olives, bananas, citrus)
Rainfed annual crops (cereals, vegetables)
Rainfed deciduos trees (fruits)
Water
Land use
7
Introduction
Urban expansion is steadily extending into good quality agricultural land in the higher rain-fed areas of the Jordanian highlands, reducing the traditional agricultural land where food crops, such as wheat and barley, can be produced. At the same time, arable farming has expanded into more marginal farming areas of the steppe. This too destroys the natural vegetation cover and, too often, leads to crop failure.
Pumping aquifer waters for irrigation has been increasing, without serious attempts to improve the recharge of these aquifers. (This could be done by implementing water harvesting methods similar to those which apparently were successful in the past.) Whilst irrigation has made crop production possible in many areas, limited attention has been paid to the long-term effects of fertilizers and pesticides on water quality. Any deterioration of the water quality could markedly degrade the land. Studies are now commencing in southern Jordan that will look closely into the whole issue of water supply. Finally, certain desert irrigation schemes are experiencing fairly serious salinity and sodicity problems, due to unfavourable soil and drainage conditions. Desertification and abandonment of these lands is slowly increasing.
1.4 Urban encroachment on agricultural lands
During the last three decades, building and construction has expanded horizontally at the expense of agricultural lands. This is partially due to the municipal law regulating the use of land (Law No. 6 of 2007) and to the absence of a definite land use map in Jordan. In this vacuum, the borders of cities and local villages have expanded and land sales have prospered. As a result, 88 200 ha of agricultural land have been lost to urbanization, posing a serious threat to the agriculture sector. Furthermore, Department of Land and Survey records indicate that requests have been made to allocate another 169 000 ha of agricultural land to urban centres (cities and villages), in addition to the area already occupied by about 115 urban centres, estimated at 23 3000 ha. All this land is located within the best agricultural regions, which receive annual average rainfall of over 350 mm. Amman, for example, had a total area in 1956 of 550 ha. By 1981, this had increased to 18 000 ha, and by 1992, the total area of Greater Amman was 63 000 ha. Moreover, expanding road networks in the country also encroach on agricultural land. Major secondary roads (2 396 km2) and village roads (1 525 km2) extend over 1 606 km2, with the total length of roads in the Kingdom stretching about 5 527 km.
Furthermore, the urban expansion has led to the abandonment of agriculture and to the trading and sale of lands. Arbitrary urban expansion has also led to the establishment of communities that lack proper sanitary conditions, with improper underground water use and inappropriate waste handling that pollutes surface and undergroundwater resources and causes serious negative environmental effects.
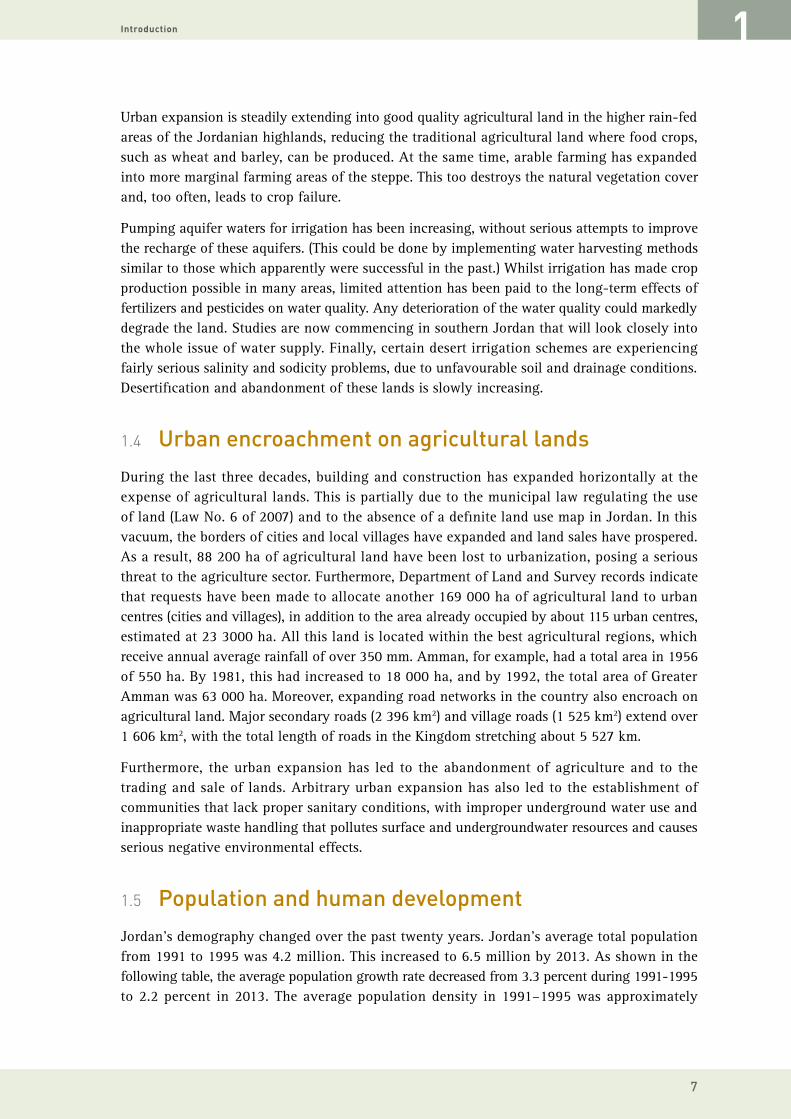
1.5 Population and human development
Jordan’s demography changed over the past twenty years. Jordan’s average total population from 1991 to 1995 was 4.2 million. This increased to 6.5 million by 2013. As shown in the following table, the average population growth rate decreased from 3.3 percent during 1991-1995 to 2.2 percent in 2013. The average population density in 1991–1995 was approximately

ASSESSMENT OF FOOD SUPPLY UNDER WATER SCARCITY CONDITIONS IN THE NENA REGION APPLYING THE FOOD SUPPLY COST CURVE APPROACH
8
47.5 people per km2, increasing to 73.5 in 2013. Table 1.4 shows a decline in the share of rural population from 21.6 percent between 1991 and 1995 to 17.4 percent in 2013, indicating a process of rural-urban migration throughout Jordan. The share of the economically active population (ages 15-64) increased from 36.1 percent in 1995 to 37.1 percent in 2013, increasing Jordan’s total workforce from 1.1 million in 1995 to 1.7 million in 2013. Two percent of the labour force in 2013 worked in the agriculture sector and 9.9 percent in the industrial sector. At the same time, the economically inactive population (under 15 years of age and over 65) decreased from 49.2 percent of the total population in 1995 to 40.6 percent in 2013.
Table 1.4 Basic statistics and population
Land and population 1991–1995 1996–2000 2001–2005 2006–2010 2012 2013
Totalpopulation(thousand) 4195.0 4797.0 5473.0 6113.0 6388.0 6530.0
Populationgrowthrate(%) 3.25 2.45 2.3 2.2 2.2 2.2
Urbanpopulation*(%) 78.4 79.8 82.2 82.5 82.6 82.6
Ruralpopulation(%) 21.6 20.2 18.8 17.5 17.4 17.4
Totalhouseholds(thousand) – 827.1 1013.5 1132.0 1173.2 1194.3
Populationdensity(personsperkm2) 47.5 54.4 61.3 68.1 71.2 73.5
Economicallyactivepopulation(%) 36.1 36.2 34.6 39.3 38 37.1
Peopleemployedinagriculture(%) – 4.9 3.4 2.0 2.0 2.0
Peopleemployedinmanufacturing(%) – 21.8 20.7 10.4 9.7 9.9
*Urban includes localities with a population of 5 000 or more, as defined in the 2004 census.
Source: Department of Statistics, World Bank Database
Jordan also witnessed significant economic development during the period 1995–2013, with economic growth rates, using current prices, of 3.8 percent in 2000, 10.3 percent in 2005, and 8.6 percent in 2013, and growth rates at constant prices during the same period of 4.2 percent in 2000, 7.2 percent in 2005, and 2.8 percent in 2013. As a result, the average per capita GDP rose from USD 1 562 in 1995 to USD 5 106 in 2013. The inflation rate during the same period was 0.7 percent in 2000, 5 percent in 2010, and 5.6 percent in 2013. Economic development also improved human development indicators, including an increase in average life expectancy from 70.9 to 74.4 years; a decrease in under-five mortality (per 1 000 live births) from 31.1 in 1995 to 21 in 2013; a drop in infant mortality (per 1 000 live births) from 26.3 in 1995 to 17 in 2013, and a drop in the crude death rate (per 1 000 inhabitants) from 11 in 1995 to 5.6 in 2013.
Other indicators also improved during this period. Illiteracy fell from 8.9 percent in 2005 to 6.8 percent in 2013. Infrastructure development improved access to basic services, with drinking water reaching 96.7 percent of the population via the national network, electricity reaching 99.9 percent of the population, and sanitation reaching 59.7 percent of the population. Furthermore, the proportion of women in the labour force rose from 13.2 percent in 1995 to 18.1 percent in 2012, and the percentage of women in the employed population rose from 8.6 percent to 15.6 percent during the same period. Women’s participation in political life, particularly in ministries and in the Jordanian parliament, also increased during this period.

9
Introduction
Table 1.5 Human development indicators
Indicator 1995 2000 2005 2010 2012 2013
Totalpopulation(thousand) 4264 4857 5473.0 6113.0 6388 6530
Populationgrowthrate(%) 3.25 2.45 2.3 2.2 2.2 2.2
Populationunder15yearsofage(%) 46.2 39.4 37.3 37.3 37.3 37.3
Populationaged15-64years(%) 50.5 57.5 59.4 59.5 59.4 59.4
Populationolderthan65 3.0 3.1 3.2 3.4 3.3 3.3
GDPgrowthrate(currentprices)(%) 8.2 3.8 10.3 9.6 7.3 8.6
GDPgrowthrate(constantprices)(%) 6.2 4.2 7.2 3.1 2.7 2.8
GDPpercapita(USD) 1562 1679 2329 4335 4857 5106
Inflationrate(%) 2.2 0.7 3.5 5.0 4.7 5.6
Lifeexpectancyatbirth(years) 70.9 71.9 72.6 73 74.4 74.4
Under-fivemortalityrate(per1000livebirths) 31.7 27.7 23.7 20.3 19.1 21
Crudedeathrate(per1000population) 11 7 7 7 7 5.8
Infantmortalityrate(per1000livebirths) 26.3 23.2 20.1 17.3 17 17
Illiteracyproportion,15+years(%) – – 8.9 7.0 6.8 6.8
Refinedeconomicactivityrate(%) 38 38.8 38.3 39.5 38 37.1
Femalesasa%oftotallabourforce,aged15+ 13.2 14.3 14.7 18.0 18.1 13.2
Femalesasa%oftotalemployedpeople,aged15+ 8.6 9.8 9.0 12.1 12.1 15.6
Unemploymentrate(%) 15.8 13.7 14.8 12.5 12.2 12.6
Employmentinagriculture(%oftotalemployment) – 4.9 3.4 2.0 2.0 2.0
Source: Department of Statistics, World Bank Database
1.6 Economy of Jordan
The Jordanian economy has gone through several cycles over the past decades. The first economic plan was implemented during the period 1976–1981. During this period, the country achieved economic prosperity, with an average annual GDP growth rate at current prices of about 20.7 percent and a GDP growth rate at constant prices of about 14.4 percent. This prosperity was brought about by several factors, including: higher oil prices on the world market, resulting in financial surpluses for oil producing countries such as Jordan and increased spending on development projects; increased demand for labour in the Arab Gulf States, with remittances from Jordanians working abroad contributing to higher income and spending in the country; and a rise in the demand for Jordanian exports.

ASSESSMENT OF FOOD SUPPLY UNDER WATER SCARCITY CONDITIONS IN THE NENA REGION APPLYING THE FOOD SUPPLY COST CURVE APPROACH
10
From 1982 to 1988, the Jordanian economy slowed, with the average annual GDP at current prices decreasing by 7.3 percent in 1982 and by 2.2 percent in 1988. This was the natural consequence of the global recession, which affected the Jordanian economy at the end of the recession. In addition increasing the public deficit and balance-of-payments, foreign exchange reserves dropped, which worsened the country’s external debt. This put intense pressure on the exchange rate of the Jordanian dinar, which fell from USD 2.95 in 1982 to USD 1.73 in 1989. This phase coincided with the implementation of the second five-year development plan (1981–1985), and the third five-year development plan (1986–1990).
Following the severe financial and economic crisis in late 1988, with the resulting dinar exchange rate crisis and the rise in the country’s foreign debt, Jordan entered a stage of economic reform lasting from 1989 to 1998. In April 1989, Jordan began implementing a structural reform programme covering the period 1989 to 1993. The programme, however, was implemented for only 15 months because of the Gulf War. Jordan resumed internal negotiations on a new structural reform programme covering the period 1992–1998 to address its foreign debt crisis, restore the internal and external financial balance, and correct imbalances accumulated over the previous years. Although the macro-economic indicators during this phase reflect the success of the reform efforts and of the national macroeconomic policy (based on the containment of fiscal deficits and the application of structural reforms), unemployment and poverty rates remained relatively high and per capita income grew only modestly.
During the beginning of the political transition period (1999–2001), Jordan’s main objectives were to raise the rate of real growth, while keeping a lid on inflation, maintaining foreign reserves, and reducing outstanding debt, in addition to reducing poverty and unemployment. Around the end of the political transition period, in June 2002, Jordan adopted another programme to reform economic policies and to continue privatization, while creating an economic environment favourable to further engaging with other Arab countries and the world economy. The programme also aimed to strengthen foreign exchange reserves and reduce external debt. The programme concluded in June 2004 and was followed by an economic and social development plan for the period 2004–2006, which focused primarily on overall financial stability, the stability of the dinar, and price stability, while activating partnerships between the public and private sectors. By promoting the role of the private sector as a major participant in economic development, Jordan hoped to improve the national economy and the quality and standard of living, while reducing poverty and unemployment. With this plan, Jordan’s economy grew an estimated 9.0 percent at current prices and 6.3 percent at fixed prices. Most recently, a national strategy for long-term social, economic, and democratic transformation was established as the national agenda for the period 2006–2017.
The economic indicators presented in the following table show the evolution of the Jordanian economy through 2013, growing to a GDP of USD 33.8 billion and a GNP of USD 30.5 billion. The contribution of the industrial sector to the GDP increased from 13 percent in 1995 to 17 percent in 2013. Government services contributions also increased during the same period from 16 percent to 20 percent. The business and finance sector contribution declined from 18 percent in 1995 to 17.6 percent in 2013, while the contribution of the transport, communications and storage sectors maintained a stable 12 percent growth rate during the period 1995–2013. The contribution of wholesale and retail trade, hotels and restaurants was
STUDY ON SMALL-SCALE FAMILY FARMING

11
Introduction
around 9 percent, while the construction sector decreased from 6 percent to 4 percent in 2013, and the agriculture sector decreased from 4 percent in 1995 to 3 percent in 2013.
The data from Jordan’s Department of Statistics indicates a decrease in job creation from 70 356 jobs in 2007 to 48 068 in 2012. Of the jobs created in 2012, 16 171 (33 percent) were in the public sector, 30 756 (64 percent) were in the private sector, 826 (1.7 percent) were in the informal sector and 315 (0.7 percent) were with international organizations.
Table 1.6 Gross domestic product by economic activity at current prices - relative share (%)
Economic Activity 1995 2000 2005 2010 2011 2012 2013
GNPatcurrentmarketprices(USD) 6494 8573 12943 26409 28742 33349 30636
GDPatcurrentmarketprices(USD) 6659 8472 12606 26500 28922 31025 33689
Share of economic sectors in GDP (%)
Agriculture,forestryandfishing 0.04 0.02 0.03 0.03 0.03 0.028 0.03
Miningandquarrying 0.03 0.03 0.03 0.03 0.04 0.03 0.024
Manufacturing 0.13 0.13 0.16 0.17 0.17 0.165 0.17
Electricityandwater 0.02 0.02 0.02 0.02 0.02 0.022 0.022
Construction 0.06 0.03 0.04 0.05 0.04 0.043 0.044
Wholesale&retailtrade,restaurants&hotels 0.09 0.10 0.09 0.09 0.09 0.094 0.096
Transport,storage&communications 0.12 0.14 0.14 0.12 0.12 0.12 0.121
Finance,insurance,realestate&businessservices 0.18 0.18 0.20 0.17 0.17 0.175 0.176
Producersofgovernmentservices 0.16 0.17 0.16 0.20 0.20 0.204 0.202
Otherservices 0.02 0.03 0.02 0.00 0.00 0.043 0.043
Source: Department of Statistics
The long-term economic plan (the National Agenda) aimed to provide a decent life for Jordan’s population, create jobs and increase the role of the private sector. To achieve these objectives, the government adopted the following policy agenda:
• develop legislation governing economic and political life, broadening the base of political participation and eliminating all forms of discrimination against women;
• develop human resources by rehabilitating the workforce, expanding vocational training programmes and supporting employment;
• reform the higher education system to meet the requirements of the labour markets:
• expand infrastructure investments through private sector participation;
• strengthen and modernize the industrial base of the national economy and develop labour-intensive industries and export services to reduce structural unemployment;
• support transformation towards a knowledge economy and increase global competitiveness.

ASSESSMENT OF FOOD SUPPLY UNDER WATER SCARCITY CONDITIONS IN THE NENA REGION APPLYING THE FOOD SUPPLY COST CURVE APPROACH
12
To achieve the aims of the policy agenda, the government has set the following economic indicators:
• increase average real GDP growth rate from 5 percent in 2004 to 7 percent in 2017;
• increase capital investments as a percentage of GDP from 12 percent in 2004 to 24 percent in 2017;
• increase foreign direct forms of investment as a proportion of GDP from 27 percent in 2004 to 40 percent 2017;
• increase the contribution of small and medium-sized enterprises to the GDP from 27 percent in 2004 to 40 percent by 2017;
• reduce the unemployment rate from 12.5 percent in 2004 to 6.8 percent in 2017;
• increase the percentage of women in the workforce from 12.5 percent in 2004 to 20 percent 2017;
• increase the relative ranking in control of corruption (The World Bank’s Worldwide Governance Indicators) from 69 percent in 2004 to 90 percent in 2017;
• increase total health expenditure per capita from USD 187 in 2004 to USD 450 in 2017;
• reduce the poverty rate from 14.2 percent in 2004 to 10 percent in 2017;
• increase the percentage of poor people who have completed secondary education from 11.4 percent in 2004 to 25 percent in 2017;
• increase enrolment in pre-school education from 35 percent in 2004 to 60 percent in 2017;
• increase enrolment in vocational education from 55 percent in 2004 to 82 percent in 2017;
• increase enrolment in higher education from 35 percent in 2004 to 50 percent by 2017;
• increase spending on scientific research as a percentage of GDP from 0.34 percent in 2004 to 1.5 percent in 2017;
• increase the number of patent applications from 246 in 2004 to 5 000 in 2017.
1.7 Recommendations
The analysis provided in this chapter highlights how Jordan’s economy is hindered by its scarcity of natural resource. This is most apparent in the limited availability of land to support the expansion of different economic activities, including agriculture, industry, services and others. The desert in Jordan covers about 87 percent of the total land area and the agricultural area comprises only 2.8 percent of the country’s total surface area, a key problem in achieving self-sufficiency in strategic crops, such as wheat and barley. Furthermore, production of these strategic crops is mostly dependent on rain, which fluctuates greatly from one year to the next.
Despite the challenges associated with the scarcity of resources, Jordan has focused on human resource development and the growth of its GDP in order to achieve acceptable levels of human development. Nevertheless, the global economic crisis, and especially the financial crises and political instability in the Middle East, make it that much harder for Jordan to
13
Introduction
maintain acceptable economic growth. To achieve human development targets consistent with the progress achieved over the past decades, the following measures are required:
• government investment in education and health to maintain sustainable human resources development;
• the participation of the private sector in developing infrastructure to stimulate private investment and create employment opportunities;
• the development of legislation to improve the investment environment in Jordan in order to attract foreign investment;
• efficient allocation of economic resources, particularly agricultural resources, taking into account the limitations facing the Jordanian economy;
• preparing the Jordanian economy to participate in the knowledge economy and prioritizing integration into the global economy, including the transfer of technology, research and development;
• prioritizing the agricultural sector in the allocation of resources and exploring the comparative advantages of the country’s agriculture sector, to achieve the highest possible production and contribute to food security.
A general view of fields in Dear Alla.©FAO/AFP/Khalil Mazraawi

ASSESSMENT OF FOOD SUPPLY UNDER WATER SCARCITY CONDITIONS IN THE NENA REGION APPLYING THE FOOD SUPPLY COST CURVE APPROACH
14
A worker tends greenhouse plants as part of an integrated pest management project in the countries of the Near East in Dear Alla. ©FAO/Khalil Mazraawi
Example of protected agricultural systems in Jordan. ©FAO/Talal Alfayez
15
Water accounting in Jordan
2.1 Introduction
Jordan is one of the few countries with limited water resources where demand by far exceeds existing supplies. Water resources in Jordan are affected by rainfall variation and therefore are characterized by scarcity, variability and uncertainty. Rain falls between October and May and varies in quantity, intensity and distribution from year to year. Average annual rainfall is about 400-600 mm in the highlands, 50-300 mm in the Jordan Valley and 50-200 mm the desert area (Badia). The per capita share of renewable water resources in 2014 was approximately 123 m3/year for all uses, ranking Jordan as the fourth poorest country globally in terms of available water resources per capita.
The country has developed and implemented successful policies, strategies and projects for water harvesting and recycling. In addition, the government has successfully implemented projects supporting water users’ associations. However, in light of increasing competition for water resources and the uncertain impacts of climate change, different technologies and innovations must be developed to maximize water use efficiency and support (or enhance) crop diversification, including the cultivation of high value crops that appeal to competitive local and international markets and replacing crops that use higher amounts of water. Jordan realizes that its intrinsic right for development is strongly linked to the availability of sufficient quantities of safe water for the domestic, agricultural, industrial and service sectors.
2.2 Water demand
Water resources in Jordan are allocated to four different sectors: agriculture, municipal, industry and tourism. By far the largest user of the country’s water resources is agriculture, which is concentrated in two primary regions: the Jordan Valley and the highlands. Despite the Jordan Valley being a very small area of land, this is where the bulk of the country’s agricultural production occurs and thus, where most of Jordan’s surface water resources are directed. In most of the highlands, water is acquired from rainfall or groundwater.
Agricultural production in Jordan uses 51 percent of the country’s available water resources. It must be considered, however, that the agriculture sector indirectly contributes to other aspects of the Jordanian economy, including agricultural support services, food security and the generation of tax revenue. This demonstrates the importance of the agriculture sector and the need to attend to and efficiently manage the sector’s growing demand for water. Fortunately, Jordan is increasingly looking towards demand management strategies for agriculture, such as better irrigation design and management, which can lead to more efficient and effective use of its diminishing water supply.
2

ASSESSMENT OF FOOD SUPPLY UNDER WATER SCARCITY CONDITIONS IN THE NENA REGION APPLYING THE FOOD SUPPLY COST CURVE APPROACH
16
The second largest water-consuming sector in Jordan is the municipal sector, which accounts for 44 percent of the country’s water usage to cover people’s daily use of water in their homes and businesses. These municipal needs, along with those of Jordan’s small industries, are concentrated in the larger population centres in the northwest of the country. The capital, Amman, and the cities that surround it use the bulk of their water resources for municipal purposes, as can be surmised from the large population in this area. Due to the importance of Amman as Jordan’s largest and most-populated city, water rationing typically favours Amman above all other cities and uses in the country.
Figure 2.1 Location of refugees in Jordan
Source: Ministry of the Interior, 2014

17
Water accounting in Jordan
While Jordan’s population is expected to continue to grow both through natural population growth and through the influx of multiple waves of refugees seeking a safe haven within its borders. It is estimated that in 1948, during the conflict between Israel and Palestine, half a million to one million Palestinians fled their homeland, a large portion of them settling in Jordan. In subsequent conflicts, further waves of Palestinians fled to Jordan. Today, roughly two million Palestinian refugees remain in Jordan. Furthermore, during the Iraq War in 2003, roughly half a million Iraqis fled to Jordan and settled there. Most recently, since the beginning of the conflict between the opposition and the governing regime in Syria in 2011, Jordan has had to host around 1.4 million Syrian refugees. Some have sought temporary shelter in refugee camps while the majority, around 700 000 people, live in host communities. All of these waves of refugees have imposed additional strains on Jordan’s already severely strained water resources, especially as they occurred without prior warning or proper planning.
Industrial demand for water in Jordan is likely to increase significantly in the near future due to the planned development of nuclear energy plants, with an expected demand of 45 MCM per year. Oil shale and uranium mining operations will require around 30 MCM annually. The government has estimated that the gross industrial demand in 2025 will reach about 150 MCM/year, compared to 39 MCM in 2014.
Table 2.1 Evolution of water resources and demand in MCM/Y
Water resource 2014 2015 2020 2025 2030
Groundwater safe yield 275 275 275 275 275
Groundwater over abstraction 173 173 156 130 104
Non-renewable groundwater 160 160 169 224 224
Surface water (local + Tiberia Lake) 250 250 260 270 280
Treated wastewater 137 140 180 200 220
Additional resources (desalination + SWAP) 10 10 90 90 240
Total resources 995 1 008 1 130 1 189 1 343
Sustainable resources 832 835 974 1059 1221
Municipal, industrial, tourist demands 714 717 727 751 810
Irrigation use (metre) 497 505 520 535 550
Irrigation demand 678 700 700 700 700
Oil shale and nuclear power demand 0 0 57 72 90
Total demand 1 211 1 222 1 304 1 358 1 450
Deficit in MCM/a (with over abstraction) -206 -214 -174 -169 -107
a Stop pumping 16 MCM from Disi to Aqaba due to Red-dead Phase 1 +10 MCM from Ageb +15 MCM.b 40 MCM from Sheideah and 15 MCM from Azraq deep groundwaterc Red-dead Phase 1 (80 MCM)d Red-dead Phase 2 (150 MCM)
a b
c d
ASSESSMENT OF FOOD SUPPLY UNDER WATER SCARCITY CONDITIONS IN THE NENA REGION APPLYING THE FOOD SUPPLY COST CURVE APPROACH
18
2.3 Water supply
Given that the shortage of water resources in Jordan was initially widely recognized in the early 1970s, several strategies and measures have been proposed to overcome it. Amongst these are supply augmentation measures involving the construction of various hydraulic structures and the development of groundwater resources. The country recognizes the need to adopt an integrated approach to enhance water availability, suitability and sustainability, since no single action can remedy the nation’s water shortage.
In 2008, annual renewable freshwater resources per capita in Jordan were estimated to be 145 m3, compared to less than 123 m3 in 2014. These figures are less than one third of the widely recognized “water poverty line” of 500 m3 per capita per year. This situation requires the sustainable management and efficient use of water resources, with strong demand management policies and the adoption of adequate measures for environmental protection to mitigate adverse impacts.
Surface water resources contribute approximately 27 percent to Jordan’s total water supply, estimated at 239 MCM in 2012 and projected to reach 400 MCM by 2025, including treated wastewater. Groundwater resources contribute approximately 60 percent to total water supply. However, unsustainable abstraction rates related to population growth and agricultural expansion are a major challenge. These unsustainable practices are exacerbated by the lack of enforcement of regulations on private sector well drilling and weak control of licensed abstraction, and have resulted in a significant drop in water tables and a significant increase in pumping costs and salinity levels.
The Water Authority of Jordan (WAJ) provides wastewater collection and treatment services to fourteen major populated areas. An estimated 4 million people (63 percent of the population) are served by sewerage systems producing about 137 MCM of effluent in 2014, 123 MCM of which is being reused primarily in agriculture. In addition, several brackish springs have been identified in various parts of the country with estimates of large volumes of water stored in major aquifers, suggesting immense resources. However not all these will feasibly be fit for utilization.
Investments in municipal networks remain inadequate. Although access to water services in Jordan is fairly high, serving 94 percent of the population in urban areas and 83 percent in rural areas, distribution systems are still far from optimal and efficiency is still low. In 2014, unaccounted water in municipal networks was estimated to be 52 percent of the total quantity supplied.
In order to understand how water demands are met in the country, it is necessary to examine the country’s water supply. Jordan’s conventional, or natural, water resources originate from rainfall, groundwater and surface water. The country has developed various ways to capture, store and distribute these water resources and has also developed some unconventional water resources, such as treated wastewater and desalinized brackish water. Average annual rainfall in the country is estimated at 93 mm per year; with large variations between the different regions. Some areas in the northwest receive as much as 600 mm of rain per year, while the southern and eastern desert areas only receive around 50 mm per year. Furthermore,
19
Water accounting in Jordan
approximately 92 percent of the rainfall evaporates into the atmosphere, leaving the country with an even more meagre share of rainfall. Rainfall is seasonal, typically occurring between October and May, with almost no rain at all during the rest of the months. Rainfall is the only source of recharge for the country’s groundwater aquifers and, as such, its potential decline in coming years could pose a significant problem for Jordan.
2.4 Water resources
2.4.1. Groundwater
The main source of water in Jordan is groundwater. Groundwater resources are distributed among twelve groundwater basins, consisting of several groundwater aquifer systems. About 80 percent of Jordan’s groundwater is located within three major aquifer systems: Amman-Wadi Al-Seer, Basalt and Rum. Jordan shares not only its surface water, but also its groundwater. The recharge of some groundwater aquifers occurrs beyond Jordanian territory in the Yarmouk Basin. Jordan also shares its major non-renewable fossil aquifer in the Disi area with Saudi Arabia.
Groundwater resources in Jordan consist of two main types: renewable and non-renewable (fossil). Renewable groundwater resources are aquifers recharged by annual rainfall, surface water flows, irrigation or artificial recharge with freshwater. The amount of water that can be safely withdrawn each year from renewable groundwater aquifers depends on the amount of recharge that the aquifer receives. Non-renewable groundwater is fossil water stored in deep aquifers. These aquifers were formed in earlier ages when climatic conditions in the area were different. Most of these fossil aquifers have no recharge.
The main non-renewable groundwater aquifer in Jordan is located in the southern part of the country in the Disi area. This fossil aquifer is shared by Jordan and Saudi Arabia and supplies Aqaba, a coastal town on the Red Sea, with 16 MCM/year for municipal and industrial uses and 34 MCM/year for irrigation. Studies have concluded that the Aqaba can safely yield 125 MCM for another 50 years. In July 2013 the Disi project began supplying 100 MCM of water per year to Amman and other governorates for municipal use. In Saudi Arabia, annual abstraction is estimated at over 700 MCM/year. The second non-renewable aquifer in Jordan is located in the Jafer Basin. It is estimated that this aquifer can supply Jordan with 18 MCM/year for the next 40 years. In addition to the current water resources, deep groundwater exploration has started and a location with an estimated 40 MCM has been identified in the Sheedeyeh/Al-Hasa area. This water should be available by the year 2025.
More than 50 percent of total groundwater resources are being used for irrigation. An estimated 250 MCM of groundwater was exploited for agriculture in Jordan in 2012. Since the 1980s, Jordan has overexploited some of its groundwater resources, exceeding their safe yield. In addition to reducing groundwater levels, this has significantly deteriorated the quality of the groundwater and increased salinity, endangering the sustainable use of these resources. In other cases, many municipal and irrigation water wells have been abandoned because of over extraction. Therefore, groundwater resources should be preserved and used sustainably.
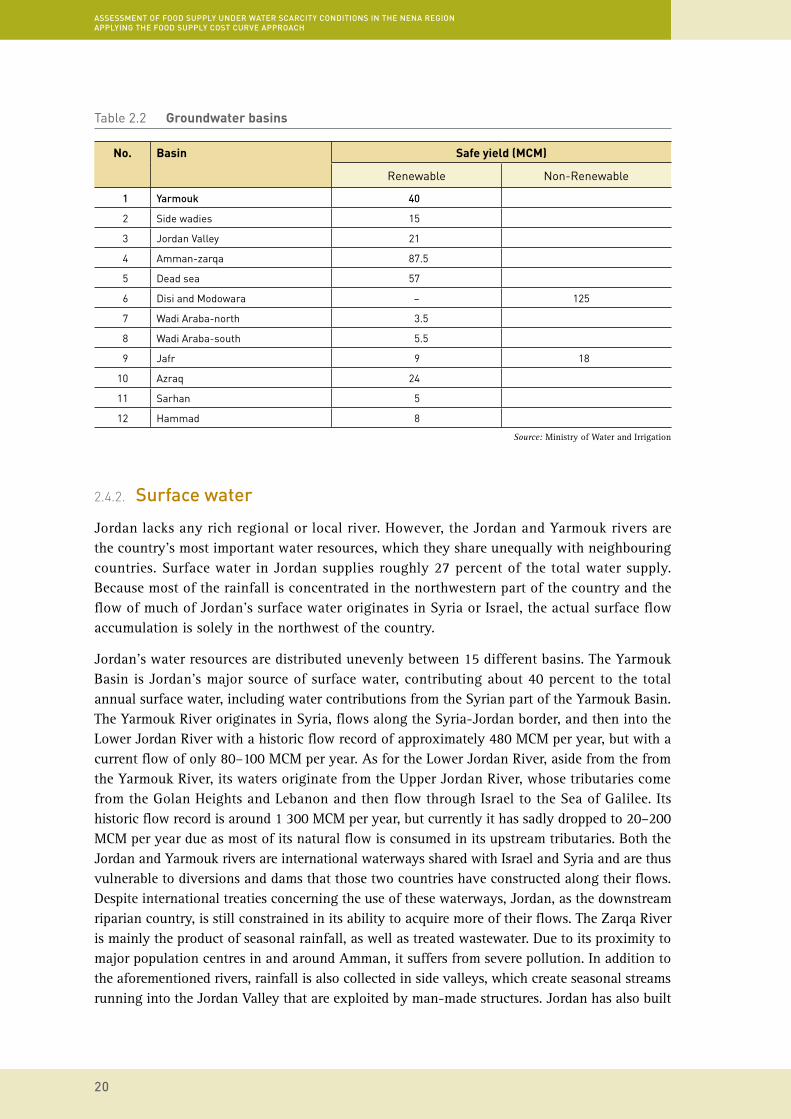
ASSESSMENT OF FOOD SUPPLY UNDER WATER SCARCITY CONDITIONS IN THE NENA REGION APPLYING THE FOOD SUPPLY COST CURVE APPROACH
20
Table 2.2 Groundwater basins
No. Basin Safe yield (MCM)
Renewable Non-Renewable
1 Yarmouk 40
2 Side wadies 15
3 Jordan Valley 21
4 Amman-zarqa 87.5
5 Dead sea 57
6 Disi and Modowara – 125
7 Wadi Araba-north 3.5
8 Wadi Araba-south 5.5
9 Jafr 9 18
10 Azraq 24
11 Sarhan 5
12 Hammad 8
Source: Ministry of Water and Irrigation
2.4.2. Surface water
Jordan lacks any rich regional or local river. However, the Jordan and Yarmouk rivers are the country’s most important water resources, which they share unequally with neighbouring countries. Surface water in Jordan supplies roughly 27 percent of the total water supply. Because most of the rainfall is concentrated in the northwestern part of the country and the flow of much of Jordan’s surface water originates in Syria or Israel, the actual surface flow accumulation is solely in the northwest of the country.
Jordan’s water resources are distributed unevenly between 15 different basins. The Yarmouk Basin is Jordan’s major source of surface water, contributing about 40 percent to the total annual surface water, including water contributions from the Syrian part of the Yarmouk Basin. The Yarmouk River originates in Syria, flows along the Syria-Jordan border, and then into the Lower Jordan River with a historic flow record of approximately 480 MCM per year, but with a current flow of only 80–100 MCM per year. As for the Lower Jordan River, aside from the from the Yarmouk River, its waters originate from the Upper Jordan River, whose tributaries come from the Golan Heights and Lebanon and then flow through Israel to the Sea of Galilee. Its historic flow record is around 1 300 MCM per year, but currently it has sadly dropped to 20–200 MCM per year due as most of its natural flow is consumed in its upstream tributaries. Both the Jordan and Yarmouk rivers are international waterways shared with Israel and Syria and are thus vulnerable to diversions and dams that those two countries have constructed along their flows. Despite international treaties concerning the use of these waterways, Jordan, as the downstream riparian country, is still constrained in its ability to acquire more of their flows. The Zarqa River is mainly the product of seasonal rainfall, as well as treated wastewater. Due to its proximity to major population centres in and around Amman, it suffers from severe pollution. In addition to the aforementioned rivers, rainfall is also collected in side valleys, which create seasonal streams running into the Jordan Valley that are exploited by man-made structures. Jordan has also built

21
Water accounting in Jordan
ten dams. Figure 2.2 indicates the locations and the potential annual water storage volume of each dam. The actual water storage in these dams is dependent on rainfall as the dams capture, store and regulate water flows in order to supply end-users in the most efficient manner.
In addition, the King Abdullah Canal (KAC) runs the length of the Jordan Valley for some 110 kilometers (km) with roughly 110 MCM per year of water pumped from the Yarmouk River, Lake Tiberias and nearby wells into the KAC. The canal has served as the major water supplier for agriculture in the Jordan Valley, thus representing the backbone of irrigated agriculture. Increasingly, though, irrigated agriculture is using other water supplies, such as treated wastewater, so more water from the canal is being transferred to Amman for municipal use.
Another way in which Jordan is able to supply additional water is through the use of treated wastewater. Although treated wastewater is only consumed by the agricultural sector, many fears still exist concerning its use in the municipal sector. About 63 percent of Jordan’s population is served by a sewerage system which produced about 137 MCM of effluent in 2014. Treated wastewater supplies around 50 percent of Jordan’s cultivated lands in the Jordan Valley, predominantly in the southern and middle sections, and is forecast to reach around 200 MCM per year in 2025.
Figure 2.2 Sources of surface water and dams in Jordan
Dam Capacity (MCM/Year)
Unity Dam 110.0
Wadi Arab 17.0
Ziglab 3.8
King Talal 75.0
Karama 55.0
Shueib 1.4
Kafrein 8.4
Waleh 9.3
Mujib 35.0
Tannour 16.8
Total 331.7
Source: Ministry of Water and Irrigation, 2012

ASSESSMENT OF FOOD SUPPLY UNDER WATER SCARCITY CONDITIONS IN THE NENA REGION APPLYING THE FOOD SUPPLY COST CURVE APPROACH
22
2.4.3. Wastewater
As municipal demand and urbanization increase constantly, the volume of wastewater generated also grows. If sufficiently treated, wastewater is suitable for various uses, depending on its quality. It is most commonly used for irrigation and in the industrial sector.
Wastewater in Jordan is collected and treated in thirty-three wastewater treatment plants. The As-Samra wastewater treatment plant is the largest in Jordan and the main provider of treated wastewater for agricultural reuse in the Jordan Valley. Due to the concentration of the urban population, the plant currently serves about 63 percent of Jordan’s connected population and treats about 76 percent of the total wastewater received in Jordanian treatment plants. The As-Samra plant was expanded in 2015 to increase its capacity to around 133 MCM annually, to absorb growing population of Amman and Zarqa. According to WAJ estimates, Jordan generated about 137 MCM of wastewater in 2014, of which about 125 MCM were used in the same year. The volume of available treated wastewater is expected to increase to more than 240 MCM/year by 2025. In addition, a new project (Reuse of treated wastewater for irrigation purposes in the northern Jordan Valley) has been operating since 2014 in northern Jordan and is expected to produce an effluent of 22 MCM in 2025, covering an irrigation area of 55 200 acres. Another wastewater plant project south of Amman began operating in mid-2014 with a capacity of around 12 MCM per year. The majority of the treated wastewater will continue to be used for irrigation and will substitute the demand on renewable groundwater resources.
Construction of a dry wall to protect cultivated land from water erosion.©FAO/Roberto Faidutti

23
Water accounting in Jordan
Table 2.3 Wastewater treatment plants in Jordan, 2014
WWTP Commis-sion date
Design load (m3/day)
Real load(m3/day)
INF_AVG(m3/day)
EFF_AVG(m3/day)
Design BOD
(mg/l)
BOD INF
(mg/l)
BOD EFF
(mg/l)
Reuse %
Abu-Nusier 1986 4 000 3 114 3 113.8 3 004.6 1 100 672.5 19.8 100
Ain-Ghazall Outgoing water is transferred from the station to Khirbet Samra station. 0
Akadeer 2005 4 000 3 907.9 2 950.8 2 638.1 1 500 226.0 100
Al-Jiza 2008 4 000 821 769.6 422.4 800 681.1 20.6 100
Al-Lajjoun 2005 1 000 853.1 678.4 595.8 2 000 26.9 100
Al-Maraad 2011 10 000 700 4 909.5 4 694.8 800 1 256.0 36.0 100
Al-Monsorha 2010 50 15 13.7 0 1 500 1 027.5 16.2 0
Aqaba Mech. 2005 12 000 9 845.5 10 891.6 8 528.5 420 376.0 6.0 100
Aqaba W.S.P 1987 9 000 6 730.6 7 447.5 5 780.5 900 376.0 38.0 100
As-Samra Mech 2008 360 000 230 606 283 739.9 279 799.5 650 577.3 6.4 100
Baqa' 1987 14 900 10 208.6 12 363.3 11 793.9 800 573.0 31.0 100
Fuhis 1997 2 400 2 221 2 380.3 2 325.3 995 448.0 10.0 100
Irbid 1987 11 023 8 132.1 7 544.1 7 246.6 800 1 316.1 85.2 100
Karak 1988 5 200 1 753.4 1 398.4 1 343.3 800 264.0 100
Kufranja 1989 9 000 2 763 2 601.7 2 550.0 850 757.5 210.7 100
Ma'an 1989 5 772 3 170.8 2 477.6 2 390.0 700 456.4 10.9 46
Madaba 1989 7 600 5 172 5 859.2 5 388.9 950 1 002.0 28.0 100
Mafraq W.S.P 1988 6 000 1 753.4 4 190.3 2 336.1 800 nothing nothing 100
Mu’tah 2014 7 060 577.0 577.9 500.0 800 470.0 27.0 0
North Shouneh 2014 1 200 700.0 700.0 N.A. 90
Queen Alia Airport 0
Ramtha 1987 7 400 3 488.3 4 713.4 3 756.5 1 000 930.0 40.0 100
Salt 1981 7 700 5 290.7 8 127.7 7 314.7 1 090 500.0 10.6 100
Shobak 2010 3 50 50 43.2 40.0 1 850 N.A. 5.0 0
Tafila 1988 1 600 1 380 1 242.0 1 185.3 1 050 827.9 59.7 0
Tall Mantah 2005 400 300 392.2 380.1 2000 1 023.0 16.1 0
Wadi Al Seer 1997 17 000 4 800 4 748.6 4 144.5 670 508.6 43.0 100
Wadi Arab 1999 21 000 1 0264 12 532.2 12 149.9 995 752.0 23.0 100
Wadi Hassan 2001 1 600 1 131.8 1 598.0 1 427.3 800 1 347.0 7.1 100
Wadi Mousa 2000 3 400 3 028.9 2 816.0 2 765.8 800 332.6 2.2 100
Wadi- Hallala 2013 14 070 5 385.0 5 385.0 3 840.4 762 602.0 13.0 100
South Amman 2015 52 000 3 000.0 3 000.0 2 800.0 750 N.A. 100
Source: Ministry of Water and Irrigation
2.5 Water policies and legislation
In 2002, the Ministry of Water and Irrigation (MWI) published the Jordan Water Policy and Strategy, which consisted of the following documents: Water Strategy for Jordan (2002), Groundwater Management Policy (1998), Water Utility Policy (1998), Irrigation Water Policy (1998) and Wastewater Management Policy (1998). In 2008, the MWI issued a water demand
ASSESSMENT OF FOOD SUPPLY UNDER WATER SCARCITY CONDITIONS IN THE NENA REGION APPLYING THE FOOD SUPPLY COST CURVE APPROACH
24
policy dealing with demand for domestic and irrigation water. Most recently, in 2015, the MWI issued five policies covering surface water, groundwater, energy efficiency and renewable energy, water substitution and water reallocation. The MWI is now updating its water strategy (Water for Life, 2008-2022), which will become the National Water Strategy, 2016-2030.
The issues covered by the Irrigation Water Policy are the sustainability, development and use of irrigation water resources; research and technology transfer; farm water management and irrigation water quality, management and administration; water pricing, regulation and control; and irrigation efficiency. Laws, bylaws and regulations are imposed to enable the relevant bodies to fulfil their responsibilities and perform their duties regarding water, irrigation and irrigated agriculture. These include laws enacted by the MWI and the Ministry of Agriculture (MOA) as well as the Environment Law and the public health laws. The latest bylaw prepared by the MWI and approved by the government is Bylaw No. 36/2014, which amended Bylaw No. 85/2002, to control groundwater abstraction and reduce overexploitation and depletion of groundwater aquifers by farmers.
2.5.1. Irrigated agriculture policy:
The limited availability of irrigation water is the most severe constraint facing the growth of the agricultural sector in Jordan. It is therefore imperative that policies geared towards improving the efficiency of water utilization receive the highest priority. Government policies and strategies in this area aim to achieve optimal, efficient and sustainable utilization of available water resources. The government also aims to adopt additional policies, such as maximizing the efficiency of water storage, conveyance and distribution and on-farm applications. Government policies in this area also aim to produce substantial savings in order to reduce the current shortages in irrigation water. This will require the joint effort and investment of the government and farmers, particularly in the following areas:
• developing suitable water storage structures both on and off-farm to minimize evaporation and seepage losses;
• converting the open-canal conveyance and distribution systems to closed-pipe systems in the Jordan Rift Valley and the highlands;
• replacing existing surface basin or furrow irrigation with drip systems;
• designing and implementing irrigation projects jointly between the public and private sectors;
• pricing publicly developed and managed water to reflect the importance and scarcity of water in Jordan.
In order to implement the above-mentioned policies, the government will adopt the following strategies:
• clarify all overlapping issues and responsibilities shared between ministries and other relevant public-sector institutions regarding the management of the country’s water resources to ensure that all the responsibilities are completed;
• strengthen national capacity for the generation and dissemination of technical information on water-saving technologies;

25
Water accounting in Jordan
• define crop-water requirements in the various agro-climatic zones to ration irrigation water;
• upgrade the management capacity of personnel involved in water distribution;
• increase public awareness regarding the efficient use of water, water quality and the conservation of watersheds;
• exempt materials required for the local manufacturing of water-saving technologies from import duties.
2.5.2. Maximum efficiency of water use in irrigation:
Maximizing net economic returns on each cubic meter of water used in irrigation means limiting the production of high-water-consuming crops, in particular if their gross margins per cubic meter are comparatively small. This assumes that protective policy measures for such crops are removed. Appropriate pricing and market mechanisms will ensure that crops with high net returns per cubic meter of water, and which are in demand in both domestic and export markets, will be prioritized by farmers. The following measures will be implemented to pursue this policy:
• adopt a water management plan for the Jordan Valley based on water requirements of crops, to ensure the availability of irrigation water for crops with high economic returns. Such a plan would reflect the economic value and the relative scarcity of irrigation water in different seasons;
• develop crop water regimes that maximize the net value of output per cubic meter of water;
• promote the use of technologies that maintain soil fertility and acceptable water quality;
• safeguard soil and water from contamination caused by drainage water carrying undesirable chemical residues and from misuse of fertilizers and pesticides;
• steer applied research to define water requirements and performance for various crops in the different agro-climatic zones, their economic returns on water input, quality requirements for the main crops and the effect of varying water quality on crop yields.
2.5.3. Water management for irrigated agriculture:
Severe water scarcity is responsible for the significant decline of water use in agriculture, while municipal use of water has increased steadily due to demographic and economic growth. Most irrigation occurs in two distinct areas, the Jordan River Valley and the highlands. Only 5 percent of the land area in Jordan receives enough rainfall to support cultivation. Irrigated agriculture is practiced on less than 10 percent of the total agricultural land, despite the fact that agriculture is the largest user of all available water resources in Jordan. Agricultural demand represented more than 60 percent of total water demand in 2013, while the agricultural sector contributed 3 to 4 percent of Jordan’s GDP and employed about 6 percent of the national workforce. Severe water shortages and weak electricity infrastructure are major factors discouraging investments in agricultural and industrial projects. Accordingly, the MWI plans to address the imbalance of water consumption across Jordan’s economic sectors based on their importance and their contribution to the GDP. Despite the significant reduction in the consumption ratio, the MWI is aiming to substitute fresh water with treated domestic wastewater for irrigated agriculture.

ASSESSMENT OF FOOD SUPPLY UNDER WATER SCARCITY CONDITIONS IN THE NENA REGION APPLYING THE FOOD SUPPLY COST CURVE APPROACH
26
About 60 percent of agriculture in Jordan depends on rainwater, while 39 percent is irrigated agriculture in the highlands and the Jordan Valley. This 39 percent share of irrigated agriculture produces 90 percent of total agricultural output, with the Jordan Valley alone producing 70 percent of total agricultural output, while consuming only 35 percent of irrigation water. This demonstrates the greater productivity of lands cultivated with irrigation water and the importance of irrigation in the Jordan Valley. Table 2.4 classifies Jordan’s agriculture by type and value.
Table 2.4 Rain-fed and irrigated agricultural areas in Jordan
Type of Agriculture Area Cultivated (thousand hectares)
Percentage of total cultivated area
Value (million USD)
Percentage of total value
Rain-fed 158 61 96 10
Irrigated 103 39 911 90
Total 261 100 1007 100
Source: Ministry of Agriculture, 2013 Annual Report
During the last 20 years, water use for irrigation in the different agricultural regions has changed. As of 2010, in the highlands, more groundwater was used (increasing 77 percent); while in the Jordan Valley less surface and treated water were used (dropping 21 percent). With the increased use of groundwater in the highlands, two thirds of irrigated agriculture is now concentrated in that region, using 65 percent of the groundwater, mostly for water-intensive and low-value crops. Meanwhile, the Jordan Valley consumes half the amount of irrigation water consumed by the highlands and produces double the volume. As to water costs in agriculture, although the JVA recovers 20 percent of the total cost of water supplied for agricultural and industrial uses, cost recovery from the industrial sector is vastly greater (40 times greater) that cost recovery from the agricultural sector.
With population increases and the impact of climate change, the use of water for irrigation is expected to increase in the near future to meet the increasing demand for food production and because more water is expected to be available from non-conventional water sources, such as treated wastewater, rainwater harvesting and desalinated seawater. The government has made efforts to enhance domestic water allocation by increasing the overall efficiency of agriculture, ensuring efficient water use in agriculture and gradually substituting the water previously allocated to agriculture with treated wastewater and rainwater.
2.5.4. Improvements to irrigated agriculture:
There are several options for optimizing agricultural water use and improving irrigation efficiencies in Jordan. These are described below:
1. Reduce inefficient agricultural practices:
• The MOA, with the support of the MWI and the JVA, intends to shift to a more water-efficient bundle of crops to optimize yield per cubic meter of water. Reducing water demand in agriculture will address macroeconomic distortions and go a long way towards reducing national water demand.

27
Water accounting in Jordan
• Form partnerships between water user associations to promote and enhance on-farm irrigation efficiency in order to maximize the agricultural output of a unit of land area per unit of irrigation water.
2. Increase water supply for agriculture:
• Increase water supply by substituting fresh water from surface and groundwater sources with treated wastewater from wastewater treatment plants.
• Irrigation water use in highlands will remain at current levels, and will possibly be reduced in the future. Irrigation water in the Jordan Valley may increase when new resources are made available, such as increased quantities of treated wastewater.
• It is necessary to diversify the sources of water used in irrigation, for example by introducing new technologies for direct use of brackish water in irrigation.
• The Red Sea-Dead Sea Project has great potential for permanently securing a consistent, continuous water supply for municipal water and irrigation wastewater in the long term.
3. Introduce appropriate water service costs and incentives:
• Promote water efficiency in irrigation and higher economic returns for irrigated agricultural products.
• The MOA and the MWI intend to discourage the production of water-intensive crops by imposing higher water tariffs on irrigated agriculture where such crops are being grown.
4. Establish a comprehensive risk management system:
• To ensure the health of agricultural labourers and the productivity of the soils and to guarantee safe produce.
2.5.5. Institutional support for irrigated agriculture:
The JVA’s strategic plan to expand and optimize irrigated agriculture in the Jordan Valley includes:
• meeting the needs of current and future water users by developing, protecting and sustaining both existing and new water resources, taking into account both economic and environmental considerations and, where feasible, involving the private sector;
• ensuring that the JVA’s existing water distribution infrastructure, systems, facilities and partnerships are managed in an efficient, transparent and equitable manner;
• developing, managing, regulating and protecting irrigation-related resources to maximize their economic usefulness, while ensuring environmental protection and sustainability in the Jordan Valley;
• developing a national approach based on Integrated Water Resources Management (IWRM) for sustainable and efficient use of water and treated wastewater in irrigation that targets food security, water-efficient crops, economic viability, environmental sustainability and cost-responsive water charges, with the ultimate goal of reducing poverty;

ASSESSMENT OF FOOD SUPPLY UNDER WATER SCARCITY CONDITIONS IN THE NENA REGION APPLYING THE FOOD SUPPLY COST CURVE APPROACH
28
• efficiently allocating and using water and treated wastewater for irrigation through demand management, conservation and reuse/recycling, and efficiently using surface water storage;
• expanding the safe use of treated wastewater using a public/private partnership approach to build new wastewater treatment plants to meet national demand and explore productive uses of treated wastewater in agriculture, industry and urban landscapes.
In Jordan, the agricultural sector consumes about 51 percent of the total available water resources. There is a direct relationship between agricultural water demand and economic return per cubic meter of water used. As part of the IWRM strategy, a better price regime that encourages water conservation, optimization and higher productivity can lead to the restructuring of agricultural production. Accordingly, the MWI is gradually limiting fresh-water irrigated agriculture in the highlands and replacing it with wastewater irrigation wherever feasible, in accordance with the IWRM strategy. As such, a more realistic and sustainable regime of water use in agriculture is to be introduced to maximize economic returns and ensure optimal use of wastewater.
2.5.6. Water management:
There are three public agencies responsible for managing water resources in Jordan. The first is the Ministry of Water and Irrigation (MWI), which is responsible for water resource policy and strategy development, planning, research and development, information systems and procuring financial resources. The two other agencies are the Water Authority of Jordan (WAJ) and the Jordan Valley Authority (JVA), which are executing bodies. They fall under the umbrella of the MWI and the Minister heads their boards of directors. The WAJ is responsible for providing water and sewage services nationwide and for water resource management. The JVA manages the development of the Jordan Valley, including water resources in the Valley and the southern Ghors. This includes managing dams, reservoirs and irrigation. The Ministry of Agriculture has a small role in irrigation management, confined to on-farm irrigation extension services and research and technology transfer through its research arm, the National Center for Agricultural Research and Extension (NCARE). The Ministry of the Environment monitors the quality of surface water in natural environments and the quality of industrial wastewater discharged into the ecosystems to protect environmental resources from pollution.
Until 1996, the water sector focused on increasing the water supply and was managed through short-term planning, fragmented short-term policies and overlapping responsibilities between the three agencies (the MWI, the WAJ and the JVA). There was no coordination between the MWI and other ministries, such as the MOA. For example, the responsibility for managing the highlands and on-farm irrigation was often lost between the MWI and the MOA. There was also no significant coordination between the MWI and the Ministry of the Environment or other relevant institutions. Nevertheless, according to the 2004 report prepared by the Economic and Social Commission for Western Asia (ESCWA), Jordan is one of the few countries in the Middle East that applied the integrated water resources management approach.
Despite earlier shortcomings, there are success stories to build upon in aspects such as enhancing the ability of water and wastewater operators to manage their operations following a commercial business model. For example, at the Khirbet As-Samra Wastewater Treatment Plant,

29
Water accounting in Jordan
the Jordanian government has successfully introduced private sector participation in the bulk water treatment market. The water companies in the cities of Miyahuna and Aqaba have adopted commercial business practices in the retail, distribution, collection and treatment of wastewater. At Aqaba, the service has improved and losses have been reduced, so the company is making profits that are used to further improve their service and infrastructure. Lessons learned from these experiences need to be incorporated into the expansion of commercial business practices in water resources management.
Growing water demand, limited water resources and the increase in fuel and operating costs are key elements to be considered for efficient operations in the progressive implementation of institutional reform. The management and reuse of wastewater in Jordan engages many actors and stakeholders at various levels including the MWI, the MOA, the MOH and the MOE, in addition to farming communities, water user associations and individual farmers. Furthermore, different responsibilities and activities in wastewater management and reuse are rarely integrated within a single institution. As such, a successful wastewater reuse programme requires substantial coordination between the different actors, which can be clearly divided into two major groups: government authorities and institutions, and the remaining actors.
2.5.7. Institutional reform:
As water management within Jordan is currently undertaken by three different agencies, a consolidated institutional and legal framework needs to be established with clearly defined responsibilities. A regulatory body also needs to be established to control and operate water and wastewater systems in the country, including controlling water losses, setting tariff rates and introducing necessary reforms to improve water and wastewater management from the utility level to the governance level.
There are also important institutional considerations in integrated water resource management that should be taken into account. First, there should be a hierarchical context. The focus should be on the system’s perspective, which means that while working on a problem at any level or scale, managers must seek the connections between all levels. Management should go beyond the administrative and political boundaries and define ecological boundaries at appropriate scales, for example basin level or watershed level. IWRM plans should also consider ecological integrity to protect total native diversity and the ecological patterns and processes that maintain that diversity. The use of ecological boundaries requires cooperation between federal (national), provincial (state) and local management agencies, as well as private parties (including NGOs) – thus calling for inter-agency cooperation. Managers must learn to work together and integrate conflicting legal mandates and management goals.
Another consideration for effective IWRM plans is good data collection. IWRM requires more research and data collection on habitat, disturbance regime dynamics, baselines and population assessment, as well as better management and use of existing data. Monitoring is necessary, because data gathered during monitoring provides feedback on the progress of action items and allows those in charge of the items to keep track of changes. The exchange of relevant, affordable and accessible information is the key starting point for integration. Relevant information is appropriate to the tasks. This information must be tested, be reliable and be of

ASSESSMENT OF FOOD SUPPLY UNDER WATER SCARCITY CONDITIONS IN THE NENA REGION APPLYING THE FOOD SUPPLY COST CURVE APPROACH
30
sufficiently high quality. Affordable and accessible information encompasses not only the cost of the data and information, but also the means and processes that the users already have to fully apply such information. New systems and software should not be required to view or use data unless absolutely necessary nor should access to information be limited because of the users’ location (distance) or gender or because of economic, cultural or social issues. With data collection and monitoring, it is also important for management to be adaptive (especially in the initial stages), and to understand that knowledge is provisional and management is both a learning process and continuous experiment.
In general, implementing IWRM requires changes in the structure and operation of management agencies. This may range from simple changes, such as forming an interagency committee, to complex changes, such as modifying professional norms and altering power relations. Finally, all stakeholders must be included in implementing the IWRM in order for it to be successful.
2.6 Irrigation water
It is hardly possible to produce food in semi-arid countries like Jordan without irrigation. Jordan’s irrigated agricultural areas are located in the Jordan Valley (some 33 000 ha) and in the plateau (some 44 100 ha). Irrigated agriculture provides most of the agricultural production in Jordan and offers the higher percentage of agricultural jobs and jobs in support services.
The total area developed for agriculture in the Jordan Valley under the responsibility and supervision of successive government agencies is about 33 000 ha. In addition, 8 000 ha of arable land north of the Dead Sea and some 2 000 ha south of the Dead Sea are fit for irrigation. More agricultural development has also taken place on the highlands using groundwater sources. The private sector was behind all this agricultural development, with the exception of small, scattered irrigation projects supervised by government agencies since the 1960s. Accordingly, the total irrigated area amounts to 44 010 ha, most of which using poor irrigation practices in the highlands, which results in poor irrigation efficiency.
Table 2.5 Water consumption for irrigation in Jordan
Region Total irrigation area (hectares)
Water resources Quantities of consumed water (MCM/year)
North JV 8 984 KAC (freshwater) 37
Middle-South JV 21 253KTR, Kafrain and Shu’aeb dams (reclaimed water) 52
Wells (brackish water) 40
Southern Ghors 5 658 Surface (freshwater) 37
Highlands 70 181Wells (freshwater) 250
+ Surface 39
Total 106 075 455
Source: Jordan Valley Authority
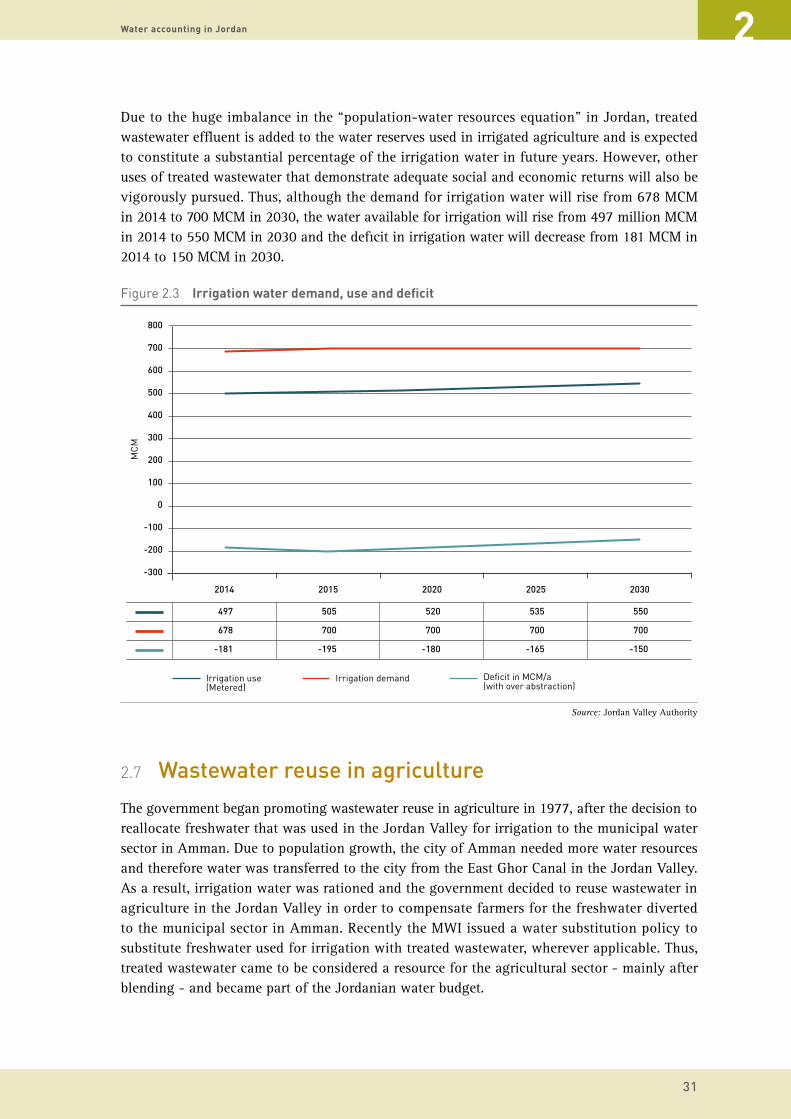
31
Water accounting in Jordan
Due to the huge imbalance in the “population-water resources equation” in Jordan, treated wastewater effluent is added to the water reserves used in irrigated agriculture and is expected to constitute a substantial percentage of the irrigation water in future years. However, other uses of treated wastewater that demonstrate adequate social and economic returns will also be vigorously pursued. Thus, although the demand for irrigation water will rise from 678 MCM in 2014 to 700 MCM in 2030, the water available for irrigation will rise from 497 million MCM in 2014 to 550 MCM in 2030 and the deficit in irrigation water will decrease from 181 MCM in 2014 to 150 MCM in 2030.
2.7 Wastewater reuse in agriculture
The government began promoting wastewater reuse in agriculture in 1977, after the decision to reallocate freshwater that was used in the Jordan Valley for irrigation to the municipal water sector in Amman. Due to population growth, the city of Amman needed more water resources and therefore water was transferred to the city from the East Ghor Canal in the Jordan Valley. As a result, irrigation water was rationed and the government decided to reuse wastewater in agriculture in the Jordan Valley in order to compensate farmers for the freshwater diverted to the municipal sector in Amman. Recently the MWI issued a water substitution policy to substitute freshwater used for irrigation with treated wastewater, wherever applicable. Thus, treated wastewater came to be considered a resource for the agricultural sector - mainly after blending - and became part of the Jordanian water budget.
Figure 2.3 Irrigation water demand, use and deficit
2014
MC
M
-300
-200
-100
0
100
200
300
400
500
600
700
800
2015 2020 2025 2030
Irrigation use (Metered)
Irrigation demand Deficit in MCM/a (with over abstraction)
497 505 520 535 550
678 700 700 700 700
-181 -195 -180 -165 -150
Source: Jordan Valley Authority

ASSESSMENT OF FOOD SUPPLY UNDER WATER SCARCITY CONDITIONS IN THE NENA REGION APPLYING THE FOOD SUPPLY COST CURVE APPROACH
32
Gradually, the government constructed additional wastewater treatment plants in different Jordanian cities. However, some of the existing treatment plants became overloaded and operated beyond their capacity, affecting the quality of the effluent. Some of these treatment plants are currently being upgraded.
Jordan was also one of the few countries in the region to apply the 2006 guidelines for the safe use of treated wastewater. According to an assessment of safe use of treated wastewater in Jordan, conducted in 2011 by a renowned international expert, wastewater reuse practices in Jordan are very safe. In 2014, the total amount of treated wastewater reused in agriculture was approximately 123 MCM, about 25 percent of the total amount of water used for irrigation (497 MCM). Treated wastewater that is not mixed with fresh water is reused for restricted irrigation in areas near the treatment plants or in areas downstream of the plants. Approximately 100 MCM of treated wastewater is used for restricted irrigation. For the time being, the following systems and standards are directly related to wastewater management and reuse in Jordan:
• Monitoring systems: Jordan has established an effective monitoring system to check the quality of irrigation water, including treated wastewater. The system is implemented by the Royal Scientific Society of Jordan (RSS), according to an agreement with the JVA. Another important monitoring system is the State Crop Monitoring Programme, instituted in 2004 by the Jordan Food and Drug Administration (JFDA), with support from the GTZ. The programme monitors the quality of crops irrigated with treated wastewater in terms of biological and heavy metal contamination. More than 99 percent of samples tested by the program comply with the EU’s strict regulations regarding biological contamination.
• Reclaimed domestic wastewater (JS 893/2006): This standard replaced the Jordanian standard JS 893/1995, which was the first Jordanian standard for wastewater reuse. Prior to JS 893/1995, the WHO 1989 “Health Guidelines for the Use of Wastewater in Agriculture and Aquaculture” were in use. By the year 1995, the first Jordanian standard for water reclamation was developed. The standard contained specifications for the use of wastewater to irrigate vegetables eaten cooked, fruit trees, industrial crop forests and grains, public parks and fodder. JS 893/1995 prohibited wastewater irrigation of crops eaten raw (tomato, cucumber, lettuce, etc.) and wastewater irrigation two weeks prior to harvesting and sprinkler irrigation. JS 893/1995 was modified because of prohibitions imposed by importing countries, including the Gulf countries, on the import of fruits and vegetable grown in Jordan. Because of this, a new standard was developed (JS 893/2006) that provided farmers with improved occupational health and safety conditions and provided consumers with safer foods. After a detailed review of the new water reuse standards by national and international experts and different agencies, the Jordan Institute of Standards and Metrology (JISM) approved the standards. The water sector has asked the JISM to issue new standards that take into account recent developments of the 2006 WHO guidelines. In response, the JISM will soon issue a new irrigation water quality standard that follows the 2006 WHO guidelines and paves the way for further uses of treated wastewater, lifting some of the restrictions contained in the JS 893/2006.

33
Water accounting in Jordan
• Industrial Wastewater Standard Specification No. 202/2007: This standard contains specifications for industrial wastewater that might be disposed of or reused for irrigation purposes.
• Jordanian Standard No. 1145/2006 regarding the use of sludge: This standard establishes the conditions for the use of sludge created in sewage water treatment stations in agriculture.
2.8 Water harvesting in Badia
Water harvesting is important in the Badia (desert) in providing water for irrigation, for livestock and for recharging underground reservoirs and ensuring the continued availability of water resources in the desert. Although the National Strategy for Agricultural Development and water and environment strategies include water harvesting in the desert as an important approach to obtain additional water resources, there is no integrated national strategy for water harvesting,
The government has supported water-harvesting projects implemented by various ministries in the desert. However, there was no coordination between these ministries. To improve this situation, the Ministry of Agriculture intends to build a database of the water harvesting projects, including location, storage capacity, current storage, use of the water, building materials, high sediment loads and costs. The following table provides data about water harvesting sites in Badia, estimated at about 287 in all, with a total estimated storage capacity of 123 MCM, including 250 sites with a storage capacity of 111 MCM and 37 sites with a storage capacity of 12 MCM, the latter having been completed in 2013 as part of government projects. As for the water harvesting sites, they do not meet the optimal storage capacity. A total of 56 dams were built with a storage capacity of 9 MCM, 129 ponds were built with a storage capacity of 2.6 MCM and 65 pools were built. The Ministry of Agriculture is planning to set up 75 water harvesting sites in the desert with a storage capacity of approximately 14.6 MCM. Sixty-seven percent of the water harvesting sites is in the desert of the northeastern provinces, 10 percent is in the southern provinces, and the rest of the sites are in the provinces of central Jordan.
Table 2.6 Number of water harvesting structures in Badia and their capacity (MCM)
Construction Existing Ongoing Future projects Total
No. Capacity No. Capacity No. Capacity No. Capacity
Dams 56 95.3 6 9.1 29 10.8 91 115.1
Ponds 129 15.2 31 2.6 46 3.9 206 21.7
Pools 65 0.3 – – 65 0.3
Total 250 110.8 37 11.7 75 14.7 362 137.1
Source: Ministry of Agriculture, Water Harvesting Department

ASSESSMENT OF FOOD SUPPLY UNDER WATER SCARCITY CONDITIONS IN THE NENA REGION APPLYING THE FOOD SUPPLY COST CURVE APPROACH
34
2.9 Recommendations
In light of this analysis of the Jordanian water sector, the scarcity of water resources and the difficult situation of water allocation for the competing sectors of the economy (domestic, agriculture, industry and tourism), it is evident that Jordan is facing a major problem: the demand for water far exceeds the current supply. A major element to consider in this regard is the fact that Jordan’s water resources depend greatly on rainfall, which is low, variable and uncertain. This results in low recharge rates, affecting the availability of both groundwater and surface water. Fifty-one percent of the annual water supply is consumed by the agricultural sector, and much of that demand is met through over abstraction from legal agricultural wells and illegal wells, depleting groundwater resources. Continuous population growth, along with the recurrent influxes of refugees (especially Syrian refugees since 2011), imposes further stress on water resources in the country.
Jordan is currently attempting to maximize the use of unconventional water resources such as treated wastewater and brackish water for agricultural purposes, in order to cope with the limited availability of natural water. In order for the Jordanian water sector to tackle the critical situation described above, the following additional measures must be implemented:
• reducing non-revenue water (NRW) by rehabilitating water networks in order to minimize water loss;
• providing new resources and maximizing the efficient use of available resources;
• improving the services provided by restructuring and rehabilitating water and wastewater networks;
• expanding water harvesting and surface water storage;
• allocating funds for the water sector to develop new water resources through sea water desalination, from deep groundwater aquifers, or by connecting the unserved areas to a sewage network, which would require building new wastewater treatment facilities or expanding existing ones;
• re-evaluating international agreements with neighbouring countries regarding shared groundwater and surface water resources;
• coordinating with different stakeholders to maximize the productivity of water per cubic meter;
• promoting private sector participation in managing and executing water projects and in water distribution;
• enhancing energy efficiency in water production and in the operation of facilities;
• further promoting the use of modern technologies in agriculture to increase production efficiency;
• recovering operational and maintenance costs of delivered water (water provision services) by adjusting the irrigation water tarriff.

35
Water accounting in Jordan
Supervises palm plantations of the integrated pest management project in the countries of the Near East in Dear Alla.©FAO/Khalil Mazraawi

ASSESSMENT OF FOOD SUPPLY UNDER WATER SCARCITY CONDITIONS IN THE NENA REGION APPLYING THE FOOD SUPPLY COST CURVE APPROACH
36
A Farmer observing plant growth and insect behavior to better manage the crops and pesticide use in a farm in Deir Alla.©FAO/Khalil Mazraawi
Farmer field school (FFS) graduates during the impact study focus and individual discussions in NENA region.©FAO/Lucie Chocholata
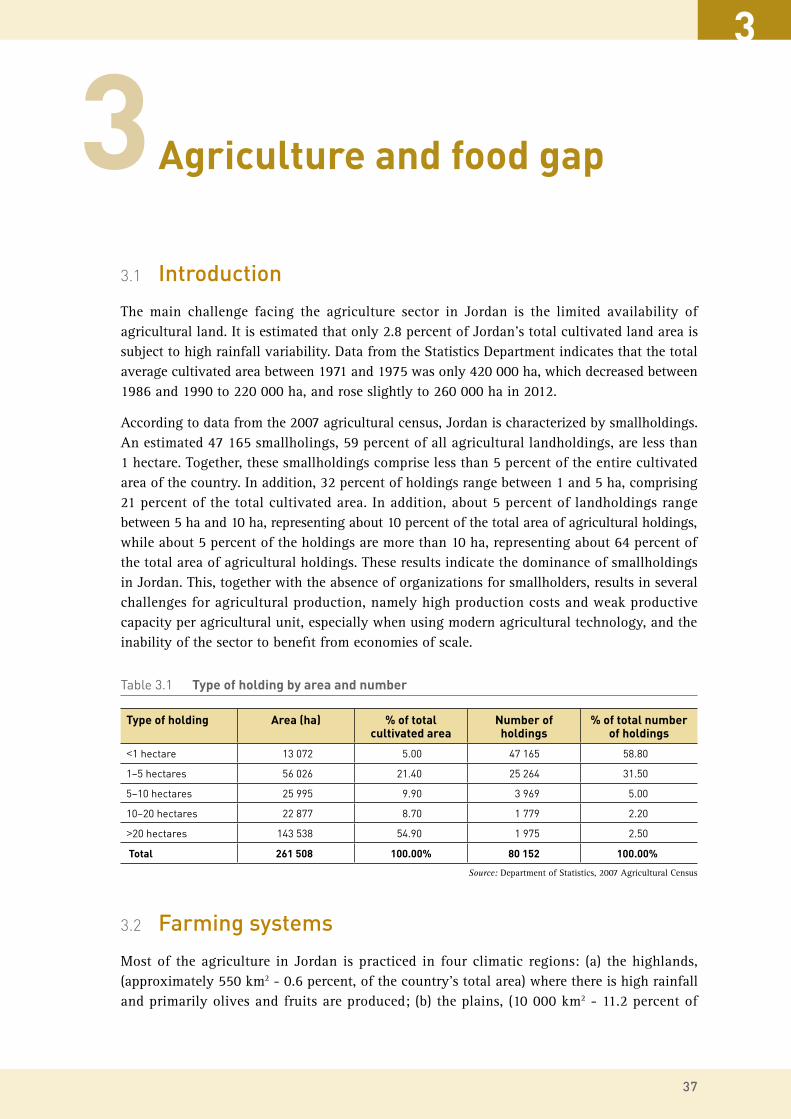
37
Agriculture and food gap
3.1 Introduction
The main challenge facing the agriculture sector in Jordan is the limited availability of agricultural land. It is estimated that only 2.8 percent of Jordan’s total cultivated land area is subject to high rainfall variability. Data from the Statistics Department indicates that the total average cultivated area between 1971 and 1975 was only 420 000 ha, which decreased between 1986 and 1990 to 220 000 ha, and rose slightly to 260 000 ha in 2012.
According to data from the 2007 agricultural census, Jordan is characterized by smallholdings. An estimated 47 165 smallholings, 59 percent of all agricultural landholdings, are less than 1 hectare. Together, these smallholdings comprise less than 5 percent of the entire cultivated area of the country. In addition, 32 percent of holdings range between 1 and 5 ha, comprising 21 percent of the total cultivated area. In addition, about 5 percent of landholdings range between 5 ha and 10 ha, representing about 10 percent of the total area of agricultural holdings, while about 5 percent of the holdings are more than 10 ha, representing about 64 percent of the total area of agricultural holdings. These results indicate the dominance of smallholdings in Jordan. This, together with the absence of organizations for smallholders, results in several challenges for agricultural production, namely high production costs and weak productive capacity per agricultural unit, especially when using modern agricultural technology, and the inability of the sector to benefit from economies of scale.
Table 3.1 Type of holding by area and number
Type of holding Area (ha) % of total cultivated area
Number of holdings
% of total number of holdings
<1 hectare 13 072 5.00 47 165 58.80
1–5 hectares 56 026 21.40 25 264 31.50
5–10 hectares 25 995 9.90 3 969 5.00
10–20 hectares 22 877 8.70 1 779 2.20
>20 hectares 143 538 54.90 1 975 2.50
Total 261 508 100.00% 80 152 100.00%
Source: Department of Statistics, 2007 Agricultural Census
3.2 Farming systems
Most of the agriculture in Jordan is practiced in four climatic regions: (a) the highlands, (approximately 550 km2 - 0.6 percent, of the country’s total area) where there is high rainfall and primarily olives and fruits are produced; (b) the plains, (10 000 km2 - 11.2 percent of
3

ASSESSMENT OF FOOD SUPPLY UNDER WATER SCARCITY CONDITIONS IN THE NENA REGION APPLYING THE FOOD SUPPLY COST CURVE APPROACH
38
Jordan’s total surface area) where the main crops are wheat, barley and some pulses, in addition to fruit and olives; (c) the Jordan Valley and southern Ghor, (about 8 228 km2 - 9.2 percent of Jordan’s total surface area) where fruit and vegetables are produced for local and export markets; and (d) the Badia, a semi-desert area, (70 000 km2 - 78.4 percent of the country’s total surface area) where there is little rainfall and the land is mainly used as natural pasture for livestock, especially sheep, goats and camels, the mainstay of the livelihood of the local population. The people of the Badia depend on Jordan’s main water bodies, including the Dead Sea and the Gulf of Aqaba, with a surface area of approximately 540 km2, representing about 0.6 percent of Jordan’s total surface area. The Gulf of Aqaba is used for small-scale fishing (160 million tons in 2012).
Agriculture is the most important source of income for rural families in Jordan. The 2007 agricultural census indicates that family labour in the agricultural sector is estimated at 109 000 persons, 101 000 men and around 8 000 women. The total number of hired labourers in the sector is estimated at 20 800, 20 500 men and 300 women and there are around 23 400 casual labourers. As such, family labour makes up about 71 percent of the total employment in the agricultural sector, while the share of permanently hired employees is about 14 percent of total employment, and casual hired labourers account for 13 percent of the total employment.These figures indicate the importance of agricultural activity in the economies of Jordan’s rural families.
In plant production, most irrigated agriculture occurs in the Jordan Valley, while rain-fed agriculture takes place in the plains and highlands. Agricultural systems in plant production are characterized by small agricultural holdings. Agricultural census data indicates that the total number of holdings in the vegetable production sector is approximately 65 200 units. Fifty percent of these holdings are smaller than 1 ha, representing 5.7 percent of the total cultivated area. Thirty-nine percent of the holdings are between 1 ha and 5 ha, representing about 25 percent of the total cultivated area, while 2.4 percent of the holdings are more than 20 ha, comprising approximately 49.8 percent of the total cultivated area.
Figure 3.1 Composition of surface area of Jordan
Badia (Semi-Desert)
Rift Valley
Highlands
Plains
Territorial Waters
0.6%
11.2%
78.4%
9.2%
0.6%
Source: Ministry of Agriculture

39
Agriculture and food gap
Table 3.2 Type of cultivated holding by area and number
Type of holding Area (hectares) % Number of agricultural holdings
%
<1 hectare 11 024 5.70 28 466 50.70
1–5 hectares 48 668 25.30 21 947 39.10
5–10 hectares 20 381 10.60 3 106 5.50
10–20 hectares 16 587 8.60 1 286 2.30
>20 hectares 95 768 49.80 1 346 2.40
Total 192 429 100.00% 56 151 100.00%
Source: Department of Statistics, 2007 Agricultural Census
In terms of the economic activities and the importance of agricultural production for rural families, census results indicate that there are around 99 800 workers in the sector. Eighty-four percent of them, 84 000 workers, are family labourers, while the remaining 16 percent, 15 900 workers, are hired labourers.
As for the livestock sector, it is mostly concentrated in the Jordanian desert, where farming systems for animal rearing are characterized mainly by small agricultural holdings using traditional methods of animal breeding. According to the agricultural census, there are approximately 15 500 holders in the livestock sector. Ninety-nine percent of them own less than 10 head, representing 22.6 percent of the total livestock in the country, 0.6 percent of them own between 10 and 50 animals, representing about 5 percent of the total livestock, while 0.03 percent own more than 200 animals, representing about 70 percent of the total livestock in the country.
Table 3.3 Type of holding by number and animal head
Type of holding Number of holdings % Number of animals %
<10 head 6 816 22.60 15 406 99.30
10–50 head 1 533 5.10 91 0.60
50–100 head 615 2.00 10 0.10
100–200 head 109 0.40 1 0.01
>200 head 21 084 69.90 5 0.03
Total 30 157 100.00% 15 513 100.00%
Source: Department of Statistics, 2007 Agricultural Census
Animal production is therefore important in the countryside and is a key economic activity for desert people. The census data indicates that there are 30 000 workers in the sector, 25 000 of whom (84 percent) are family labourers while 4 800 (16 percent) are hired labourers.
3.3 Cropping pattern
According to the Department of Statistics (DOS), the average total cultivated area during the period 1971–1975 was about 420 000 ha, including 340 000 ha planted with field crops, 35 500 ha planted with vegetables, and 39 400 ha planted with fruits. The following table shows that the average total cultivated area has dropped over different periods, decreasing to 230 000 ha

ASSESSMENT OF FOOD SUPPLY UNDER WATER SCARCITY CONDITIONS IN THE NENA REGION APPLYING THE FOOD SUPPLY COST CURVE APPROACH
40
STUDY ON SMALL-SCALE FAMILY FARMING
during the period 2006–2010, with an average area of 110 000 ha planted with crops, 41 400 ha with vegetables, and 82 900 ha with fruit trees.
Table 3.4 Cultivated area by type of cultivation, 1971 to 2013
Year Average area of field crops (thousand ha)
Average area of vegetables (thousand ha)
Average area of fruit trees
(thousand ha)
Total average cultivated area (thousand ha)
1971–1975 341 35.5 39.4 416
1976–1980 199 28.3 38.6 266
1981–1985 160 35.4 41.1 236
1986–1990 134 31.4 54.7 220
1991–1995 144 31.4 61.9 238
1996–2000 151 32.0 82.5 265
2001–2005 133 35.3 86.7 255
2006–2010 107 41.4 82.9 231
2011 113 42.9 85.0 241
2012 116 44.9 85.9 246
2013 128 49.5 83.6 261
Source: Department of Statistics, FAOSTAT
These results suggest that the patterns of agricultural production in Jordan have changed significantly. Specifically, the following changes have occurred: (1) the cultivated area dropped from 420 000 ha during the period 1971-1975 to about 260 000 ha in 2013; (2) the area planted with field crops dropped from 340 000 ha during the period 1971-1975 to 130 000 hectares in 2013; (3) the area cultivated with fruits rose from 394 000 ha during the period 1971-1975 to 83.6 000 ha in 2013 and (4) the area planted with vegetables rose moderately from 355 000 ha during the period 1971-1975 to 495 000 ha in 2013. Figure 3.2 shows these changes during the period from 1971 to 2013.
Figure 3.2 Agriculture change patterns between 1971 and 2013
1971
-197
5
0
50
100
150
200
250
300
350
400
450
1976
-198
0
1981
-198
5
1986
-199
0
1991
-199
5
1996
-200
0
2001
-200
5
2006
-201
0
2011
2013
2012

41
Agriculture and food gap
The following figure shows the prevailing agricultural patterns in Jordan during the period 1971-2013, when cereal crops constituted 49 percent of the cultivated area in 2013, while fruits constituted 32 percent, and vegetables constituted 19 percent.
According to DOS data, the total area cultivated with field crops, vegetables and fruits in 2013 was 260 000 ha. Field crops were produced on 130 000 ha (49 percent of the total cultivated area), fruits were produced on 83 600 ha (32 percent of the cultivated area) and vegetables were produced on 49 000 ha (19 percent of the total cultivated).
3.4 Agricultural production
Total agricultural production in 2013 was 2.6 million tons, comprised of 1.8 million tons of vegetables (70 percent), 434 000 tons of fruits (17 percent) and 278 000 tons of cereals (13 percent). This shows the importance of vegetable production, which comprises 70 percent of total plant production while occupying only 19 percent of the total cultivated area.
Average area of fruits (1 000 hectares)
Average area of vegetables (1 000 hectares)
Average area of field crops (1 000 hectares)
1971
-197
5
0
50
150
100
200
250
350
300
1976
-198
0
1981
-198
5
1986
-199
0
1991
-199
5
1996
-200
0
2001
-200
5
2006
-201
0
2011
2013
2012
Source: Department of Statistics, FAOSTAT
Figure 3.3 Prevailing agriculture pattern for the period 1971-2013 (Area percentage)
Cereals
Fruits
Vegetables
49%
19%32%
Source: Department of Statistics, FAOSTAT

ASSESSMENT OF FOOD SUPPLY UNDER WATER SCARCITY CONDITIONS IN THE NENA REGION APPLYING THE FOOD SUPPLY COST CURVE APPROACH
42
Table 3.5 Cropping pattern by area and production, 2013
Cropping pattern Area (thousand ha) Production (thousand ton)
Cereals 128 354
Fruits 84 434
Vegetables 50 1 845
Total 262 2 633
Source: Department of Statistics
Figure 3.4 Production of agricultural crops in 2012
Vegetables
Fruits
Cereals
17%
70%
13%
Traditional method of ploughing between olive trees using a donkey to pull the plough.©FAO/Jon Spaull
Source: Department of Statistics, FAOSTAT

43
Agriculture and food gap
3.5 Cereal production
As shown in Table 3.6 below, 340 000 ha (82 percent of the total cultivated area), were under cereal production during the period 1971–1975. This decreased to 200 000 ha, 75 percent of total cultivated area, during the period 1976–1980. The area planted with cereals continued to decline during the following period, until it reached 130 000 ha in 2013, representing about 49 percent of the total cultivated area. This decline was a result of decreased productivity over time in areas planted with cereals because of climate variations, specifically low rainfall and entrapment of rain during rain seasons. Additionally, more land was used for housing purposes and municipal activities at the expense of agricultural land, further reducing crop production and aggravating land use problems.
Table 3.6 Average total area of field crops and of cultivated land and the ratio, 1971–2013
Year The average area of field crops (thousand ha)
Total cultivated land (thousand ha)
%
1971–1975 341 416 82.0
1976–1980 199 266 74.9
1981–1985 160 236 67.6
1986–1990 134 220 61.0
1991–1995 144 238 60.7
1996–2000 151 265 56.8
2001–2005 133 255 52.1
2006–2010 107 231 46.2
2011 113 241 46.9
2012 116 246 46.9
2013 128 261 49.0
Source: Department of Statistics, FAOSTAT
Figure 3.5 Average area of field crops, 1971–2013 (1 000 hectares)
1971
-197
5
0
50
100
150
200
250
300
350
400
1976
-198
0
1981
-198
5
1986
-199
0
1991
-199
5
1996
-200
0
2001
-200
5
2006
-201
0
2011
2013
2012
199
341
160134 144 151
133107 113 116 128
Source: Department of Statistics, FAOSTAT

ASSESSMENT OF FOOD SUPPLY UNDER WATER SCARCITY CONDITIONS IN THE NENA REGION APPLYING THE FOOD SUPPLY COST CURVE APPROACH
44
Figure 3.6 shows the different types of field crops grown in Jordan, including barley, wheat and trefoil, which are among the most important field crops. According to 2013 statistics, barley was produced on 89 6000 ha, while wheat was produced on 26 200 ha and trefoil was produced on 5 000 ha. Crops with lower production areas include vetch, maize, sorghum, lentils, garlic and others.
Figure 3.6 Field crops by area in 2013
Barle
y
Barle
y
0
0
10
10
20
20
30
30
40
40
50
50
60
60
70
70
80
80
90
Whea
t
Whea
tClo
ver,
trifo
liate
Clove
r, tri
folia
teVe
tch, c
omm
on
Vetc
h, com
mon
Vetc
hVe
tch
Sorgh
um
Sorgh
umChick
peas
Chickpe
as
Mai
zeM
aize
Other
s
Other
s
Lentil
s
Lentil
sBro
om m
illet
Broom
mill
et
Garlic
Garlic
Toba
cco,
loca
l
Toba
cco,
loca
l
Alfalfa
Alfalfa
Sesam
e
Sesam
ePlanted Area (1 000 hectares)
Planted Area (%)
89.5
6
26.2
4
4.96
2.32
1.28
1.00
0.99
0.77
0.34
0.28
0.04
0.02
0.00
0.00
0.00
70.0
8%
20.5
3%
3.88
%
1.82
%
1.00
%
0.78
%
0.77
%
0.60
%
0.27
%
0.22
%
0.03
%
0.02
%
0.00
%
0.00
%
0.00
%
Source: Department of Statistics, FAOSTAT

45
Agriculture and food gap
According to 2013 DOS data, total grain output was about 354 000 tons. Trefoil represented 66 percent of the total (232 000 tons), barley accounted for 12 percent (41 000 tons), wheat accounted for 8 percent (29 000tons), white corn accounted for 5.2 percent (18 000 tons) and maize accounted for 4 percent (14 000 tons). The remaining production consists of the other crops, such as garlic and vetch.
Figure 3.7 Field crops by production (1 000 tons), 2013
Barle
y
Barle
y
0
0
10
20
30
50
40
100
50
150
60
200
70
250
Whea
t
Whea
tClo
ver,
trifo
liate
Clove
r, tri
folia
teVe
tch, c
omm
on
Vetc
h, com
mon
Vetc
hVe
tch
Sorgh
um
Sorgh
umChick
peas
Chickpe
as
Mai
zeM
aize
Other
s
Other
s
Lentil
s
Lentil
sBro
om m
illet
Broom
mill
et
Garlic
Garlic
Toba
cco,
loca
l
Toba
cco,
loca
l
Alfalfa
Alfalfa
Sesam
e
Sesam
e
Production (%)
40.9
1
28.5
2
232.
41
17.5
3
0.64 18
.48
0.72 14
.23
0.34
0.21
0.03
0.34
0.00
0.00
0.00
11.5
5%
8.05
%
65.5
8%
4.95
%
0.18
%
5.22
%
0.20
%
4.02
%
0.10
%
0.06
%
0.01
%
0.10
%
0.00
%
0.00
%
0.00
%
Source: 2013 DOS data
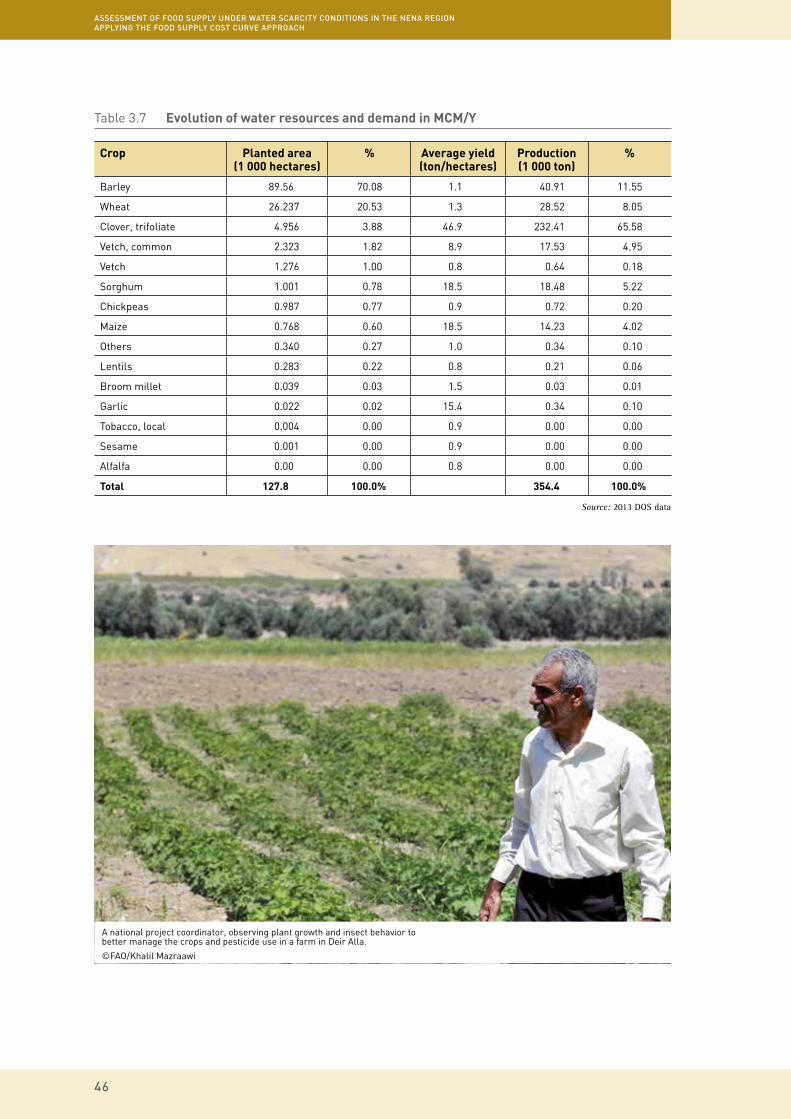
ASSESSMENT OF FOOD SUPPLY UNDER WATER SCARCITY CONDITIONS IN THE NENA REGION APPLYING THE FOOD SUPPLY COST CURVE APPROACH
46
Table 3.7 Evolution of water resources and demand in MCM/Y
Crop Planted area (1 000 hectares)
% Average yield (ton/hectares)
Production (1 000 ton)
%
Barley 89.56 70.08 1.1 40.91 11.55
Wheat 26.237 20.53 1.3 28.52 8.05
Clover, trifoliate 4.956 3.88 46.9 232.41 65.58
Vetch, common 2.323 1.82 8.9 17.53 4.95
Vetch 1.276 1.00 0.8 0.64 0.18
Sorghum 1.001 0.78 18.5 18.48 5.22
Chickpeas 0.987 0.77 0.9 0.72 0.20
Maize 0.768 0.60 18.5 14.23 4.02
Others 0.340 0.27 1.0 0.34 0.10
Lentils 0.283 0.22 0.8 0.21 0.06
Broom millet 0.039 0.03 1.5 0.03 0.01
Garlic 0.022 0.02 15.4 0.34 0.10
Tobacco, local 0.004 0.00 0.9 0.00 0.00
Sesame 0.001 0.00 0.9 0.00 0.00
Alfalfa 0.00 0.00 0.8 0.00 0.00
Total 127.8 100.0% 354.4 100.0%
A national project coordinator, observing plant growth and insect behavior to better manage the crops and pesticide use in a farm in Deir Alla.
©FAO/Khalil Mazraawi
Source: 2013 DOS data
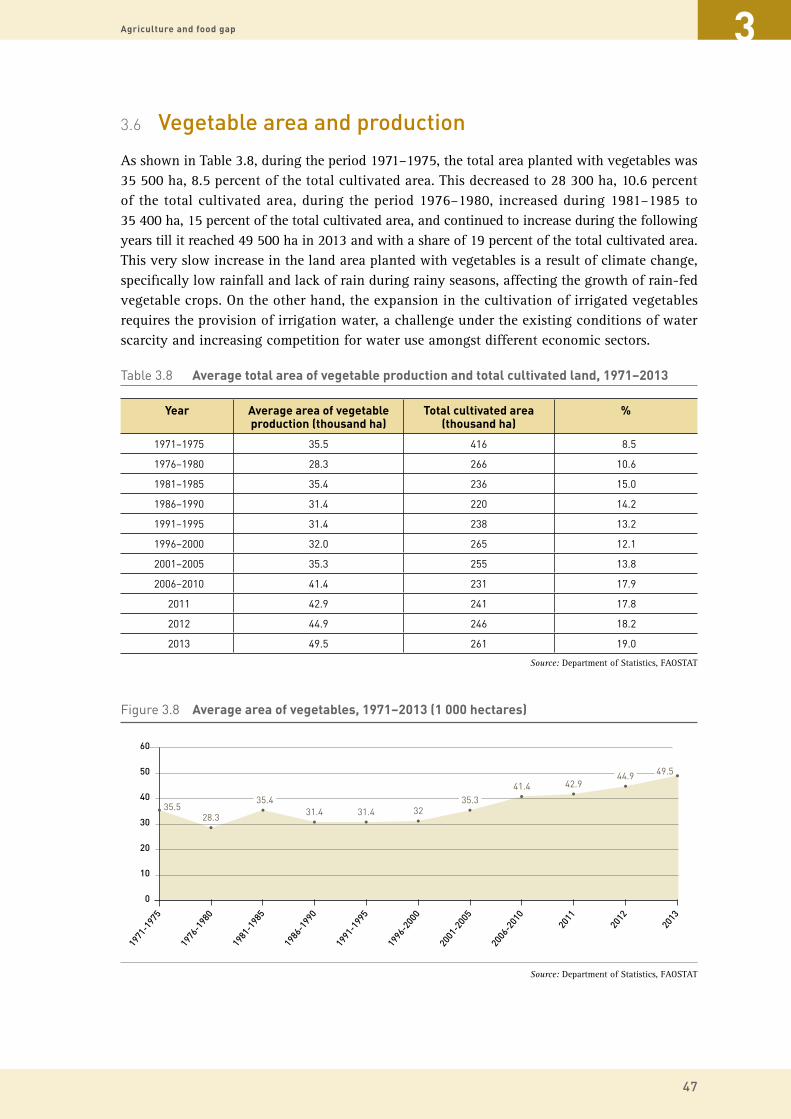
47
Agriculture and food gap
3.6 Vegetable area and production
As shown in Table 3.8, during the period 1971–1975, the total area planted with vegetables was 35 500 ha, 8.5 percent of the total cultivated area. This decreased to 28 300 ha, 10.6 percent of the total cultivated area, during the period 1976–1980, increased during 1981–1985 to 35 400 ha, 15 percent of the total cultivated area, and continued to increase during the following years till it reached 49 500 ha in 2013 and with a share of 19 percent of the total cultivated area. This very slow increase in the land area planted with vegetables is a result of climate change, specifically low rainfall and lack of rain during rainy seasons, affecting the growth of rain-fed vegetable crops. On the other hand, the expansion in the cultivation of irrigated vegetables requires the provision of irrigation water, a challenge under the existing conditions of water scarcity and increasing competition for water use amongst different economic sectors.
Table 3.8 Average total area of vegetable production and total cultivated land, 1971–2013
Year Average area of vegetable production (thousand ha)
Total cultivated area (thousand ha)
%
1971–1975 35.5 416 8.5
1976–1980 28.3 266 10.6
1981–1985 35.4 236 15.0
1986–1990 31.4 220 14.2
1991–1995 31.4 238 13.2
1996–2000 32.0 265 12.1
2001–2005 35.3 255 13.8
2006–2010 41.4 231 17.9
2011 42.9 241 17.8
2012 44.9 246 18.2
2013 49.5 261 19.0
Source: Department of Statistics, FAOSTAT
Figure 3.8 Average area of vegetables, 1971–2013 (1 000 hectares)
1971
-197
5
0
10
20
30
40
50
60
1976
-198
0
1981
-198
5
1986
-199
0
1991
-199
5
1996
-200
0
2001
-200
5
2006
-201
0
2011
2013
2012
28.335.5
35.431.4 31.4 32
35.341.4 42.9
44.9 49.5
Source: Department of Statistics, FAOSTAT
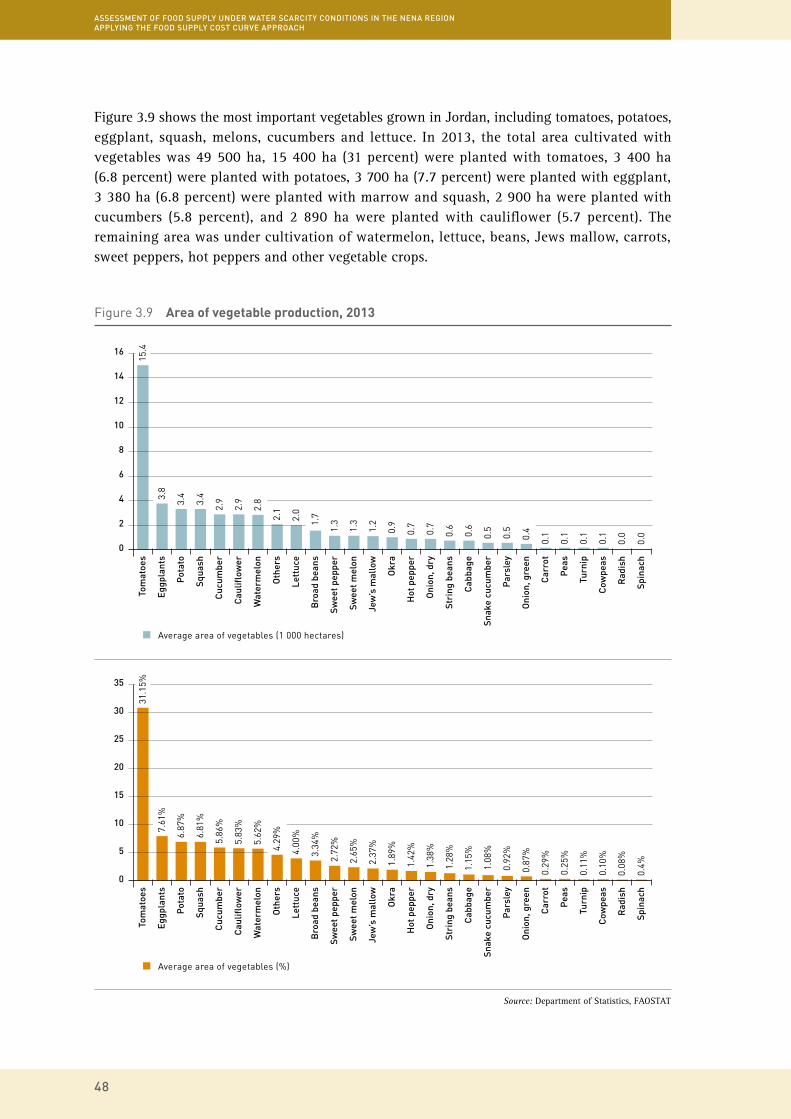
ASSESSMENT OF FOOD SUPPLY UNDER WATER SCARCITY CONDITIONS IN THE NENA REGION APPLYING THE FOOD SUPPLY COST CURVE APPROACH
48
Figure 3.9 shows the most important vegetables grown in Jordan, including tomatoes, potatoes, eggplant, squash, melons, cucumbers and lettuce. In 2013, the total area cultivated with vegetables was 49 500 ha, 15 400 ha (31 percent) were planted with tomatoes, 3 400 ha (6.8 percent) were planted with potatoes, 3 700 ha (7.7 percent) were planted with eggplant, 3 380 ha (6.8 percent) were planted with marrow and squash, 2 900 ha were planted with cucumbers (5.8 percent), and 2 890 ha were planted with cauliflower (5.7 percent). The remaining area was under cultivation of watermelon, lettuce, beans, Jews mallow, carrots, sweet peppers, hot peppers and other vegetable crops.
Figure 3.9 Area of vegetable production, 2013
Tom
atoe
sTo
mat
oes
Eggp
lant
sEg
gpla
nts
Pot
ato
Pot
ato
Squa
shSq
uash
Cuc
umbe
rC
ucum
ber
Cau
liflow
erC
aulifl
ower
Wat
erm
elon
Wat
erm
elon
Oth
ers
Oth
ers
Lett
uce
Lett
uce
Bro
ad b
eans
Bro
ad b
eans
Swee
t pep
per
Swee
t pep
per
Swee
t mel
onSw
eet m
elon
Jew
’s m
allo
wJe
w’s
mal
low
Okr
aO
kra
Hot
pep
per
Hot
pep
per
Oni
on, d
ryO
nion
, dry
Stri
ng b
eans
Stri
ng b
eans
Cab
bage
Cab
bage
Snak
e cu
cum
ber
Snak
e cu
cum
ber
Par
sley
Par
sley
Oni
on, g
reen
Oni
on, g
reen
Car
rot
Car
rot
Pea
sP
eas
Turn
ipTu
rnip
Cow
peas
Cow
peas
Rad
ish
Rad
ish
Spin
ach
Spin
ach
0
0
2
5
4
10
6
15
8
20
10
25
12
30
14
16
35
Average area of vegetables (1 000 hectares)
Average area of vegetables (%)
3.4
6.87
%
3.4
6.81
%
2.9
5.86
%
2.9
5.83
%
2.8
5.62
%
0.1
0.1
0.1
0.1
0.0
0.0
2.1
4.29
%
2.0
15.4
31.1
5%
3.8
7.61
%
1.3
1.3
1.2
0.9
0.7
0.7
0.6
0.61.
7
0.5
0.5
0.87
%
0.29
%
0.25
%
0.11
%
0.10
%
0.08
%
0.4%
4.00
%
2.72
%
2.65
%
2.37
%
1.89
%
1.42
%
1.38
%
1.28
%
1.15
%3.34
%
1.08
%
0.92
%
0.4
Source: Department of Statistics, FAOSTAT

49
Agriculture and food gap
DOS Data indicates that, in 2013, Jordan produced 1.9 million tons of vegetables. This included 869 000 tons of tomatoes (47 percent of the total production of vegetables), 172 000 tons of cucumbers (9.3 percent), 109 000 tons of eggplants (5.9 percent), 103 000 tons of potatoes (5.6 percent), 87 000 tons of watermelons (4.8 percent) and 78 700 tons of squash (4.3 percent). Sweet pepper, melon, hot pepper, cauliflower, lettuce and other vegetables make up the rest of the production.
Figure 3.10 Average production of vegetables, 2013
Tom
atoe
s
Eggp
lant
s
Pot
ato
Squa
sh
Cuc
umbe
r
Cau
liflow
er
Wat
erm
elon
Oth
ers
Lett
uce
Bro
ad b
eans
Swee
t pep
per
Swee
t mel
on
Jew
’s m
allo
w
Okr
a
Hot
pep
per
Oni
on, d
ry
Stri
ng b
eans
Cab
bage
Snak
e cu
cum
ber
Par
sley
Oni
on, g
reen
Car
rot
Pea
s
Turn
ip
Cow
peas
Rad
ish
Spin
ach
0
5
10
15
20
25
30
35
40
45
50
5.59
% 9.34
%
47.1
0%
5.93
%
0.31
%
0.17
%
0.06
%
0.04
%
0.05
%
0.04
%
1.09
%
0.47
%
1.06
%
0.70
%
0.76
%
1.57
%
0.36
%
0.46
%
0.20
%3.59
%
4.75
%
2.50
%
3.44
%
2.24
%
2.64
%
1.26
%4.26
%
Buying dates in a souk in Amman.©FAO/Lucie Chocholata
Source: Department of Statistics, FAOSTAT

ASSESSMENT OF FOOD SUPPLY UNDER WATER SCARCITY CONDITIONS IN THE NENA REGION APPLYING THE FOOD SUPPLY COST CURVE APPROACH
50
Table 3.9 Area, yield and production of vegetables in Jordan, 2013
Vegetable Planted Area (1 000 hectares)
% Average Yield (ton/ha)
Production (1 000 ton)
%
Tomatoes 15.43 31.15 56.3 869.1 47.10
Eggplants 3.77 7.61 29.0 109.4 5.93
Potato 3.40 6.87 30.3 103.2 5.59
Squash 3.38 6.81 23.3 78.7 4.26
Cucumber 2.90 5.86 59.3 172.3 9.34
Cauliflower 2.89 5.83 22.9 66.2 3.59
Watermelon 2.78 5.62 31.5 87.7 4.75
Others 2.12 4.29 21.7 46.2 2.50
Lettuce 1.98 4.00 32.1 63.6 3.44
Broad beans 1.65 3.34 14.0 23.2 1.26
Sweet pepper 1.35 2.72 30.7 41.3 2.24
Sweet melon 1.31 2.65 37.2 48.7 2.64
Jew's mallow 1.18 2.37 17.1 20.1 1.09
Okra 0.94 1.89 9.3 8.8 0.47
Hot pepper 0.70 1.42 27.8 19.5 1.06
Onion, dry 0.68 1.38 19.0 13.0 0.70
String beans 0.63 1.28 22.2 14.0 0.76
Cabbage 0.57 1.15 51.2 29.0 1.57
Snake cucumber 0.54 1.08 12.5 6.7 0.36
Parsley 0.46 0.92 18.6 8.5 0.46
Onion, green 0.43 0.87 8.5 3.7 0.20
Carrot 0.15 0.29 39.8 5.8 0.31
Peas 0.12 0.25 24.6 3.1 0.17
Turnip 0.05 0.11 19.6 1.0 0.06
Cowpeas 0.05 0.10 15.2 0.8 0.04
Radish 0.04 0.08 20.1 0.8 0.05
Spinach 0.02 0.04 35.7 0.8 0.04
Total 49.54 100.0% 1 845.2 100.0%
Source: Department of Statistics
3.7 Fruit production
As Table 3.10 shows, the total area planted with fruits was 39 400 ha during the period 1971–1975. This represented 9.5 percent of the total cultivated area. This increased to 38 600 ha (14.5 percent) during the period 1976–1980 and increased further to 41 100 ha (17.4 percent) during the period 1981-1985 and to 83 600 ha (32 percent) in 2013. These results also show the land area planted with fruits increasing rapidly during the first half of the period 1971–2013, while growing very slowly and even declining during the second half of this period. This is related to government programmes in land reclamation and fruit cultivation that were implemented during the first half of the period. The Jordanian government reduced funding of these programmes during the second half of the period, slowing land reclamation, especially within rain-fed areas, thus slowing the expansion of fruit cultivation.
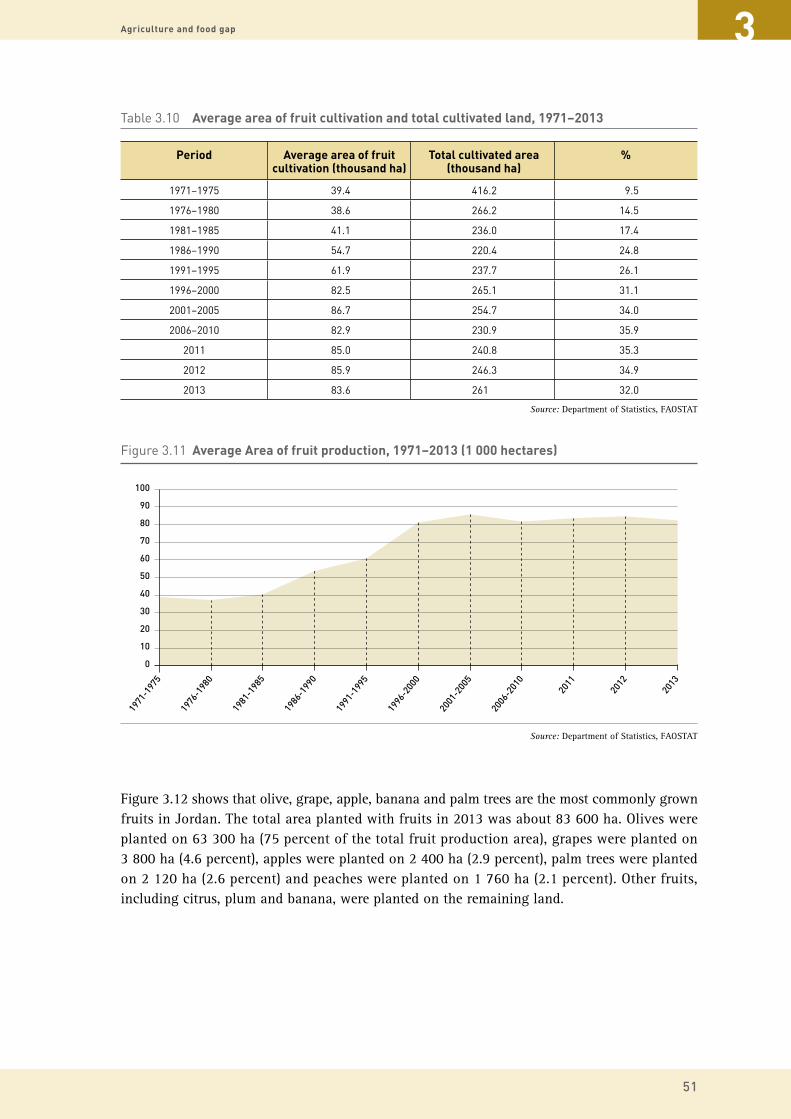
51
Agriculture and food gap
Table 3.10 Average area of fruit cultivation and total cultivated land, 1971–2013
Period Average area of fruit cultivation (thousand ha)
Total cultivated area (thousand ha)
%
1971–1975 39.4 416.2 9.5
1976–1980 38.6 266.2 14.5
1981–1985 41.1 236.0 17.4
1986–1990 54.7 220.4 24.8
1991–1995 61.9 237.7 26.1
1996–2000 82.5 265.1 31.1
2001–2005 86.7 254.7 34.0
2006–2010 82.9 230.9 35.9
2011 85.0 240.8 35.3
2012 85.9 246.3 34.9
2013 83.6 261 32.0
Source: Department of Statistics, FAOSTAT
Figure 3.12 shows that olive, grape, apple, banana and palm trees are the most commonly grown fruits in Jordan. The total area planted with fruits in 2013 was about 83 600 ha. Olives were planted on 63 300 ha (75 percent of the total fruit production area), grapes were planted on 3 800 ha (4.6 percent), apples were planted on 2 400 ha (2.9 percent), palm trees were planted on 2 120 ha (2.6 percent) and peaches were planted on 1 760 ha (2.1 percent). Other fruits, including citrus, plum and banana, were planted on the remaining land.
Figure 3.11 Average Area of fruit production, 1971–2013 (1 000 hectares)
1971
-197
5
0
10
20
30
40
50
60
70
80
90
100
1976
-198
0
1981
-198
5
1986
-199
0
1991
-199
5
1996
-200
0
2001
-200
5
2006
-201
0
2011
2013
2012
Source: Department of Statistics, FAOSTAT
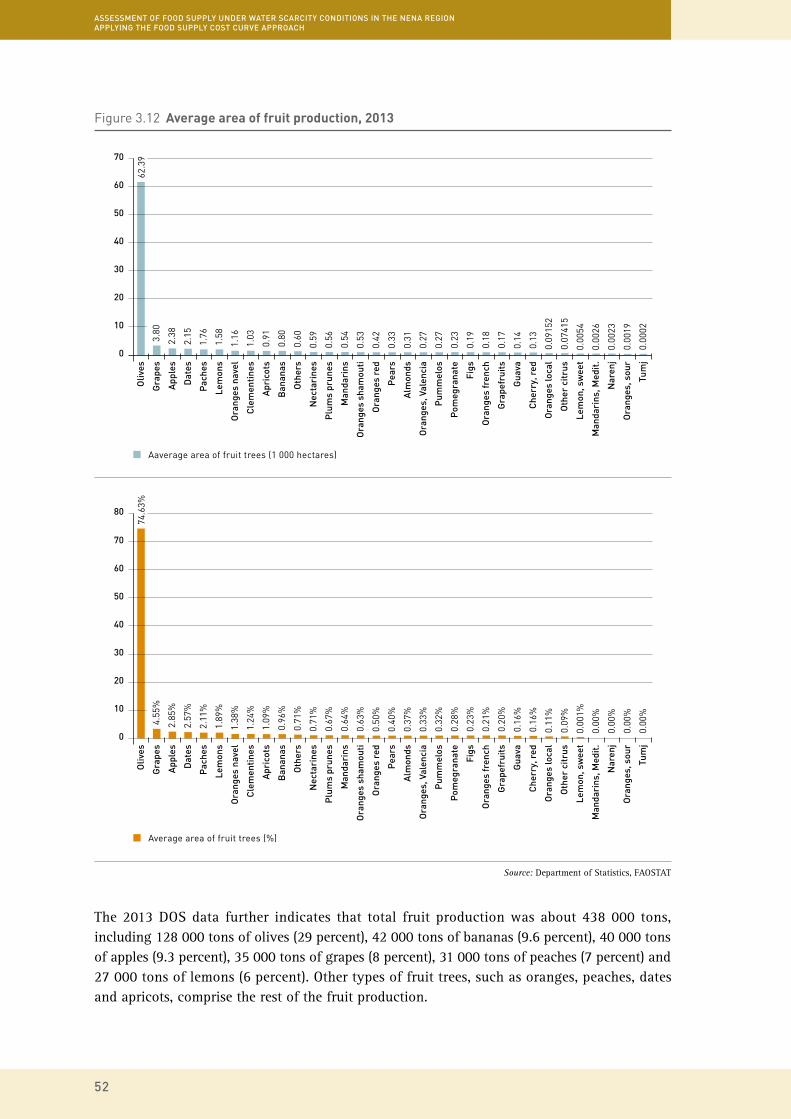
ASSESSMENT OF FOOD SUPPLY UNDER WATER SCARCITY CONDITIONS IN THE NENA REGION APPLYING THE FOOD SUPPLY COST CURVE APPROACH
52
The 2013 DOS data further indicates that total fruit production was about 438 000 tons, including 128 000 tons of olives (29 percent), 42 000 tons of bananas (9.6 percent), 40 000 tons of apples (9.3 percent), 35 000 tons of grapes (8 percent), 31 000 tons of peaches (7 percent) and 27 000 tons of lemons (6 percent). Other types of fruit trees, such as oranges, peaches, dates and apricots, comprise the rest of the fruit production.
Figure 3.12 Average area of fruit production, 2013O
lives
Oliv
es
Gra
pes
Gra
pes
App
les
App
les
Dat
esD
ates
Pac
hes
Pac
hes
Lem
ons
Lem
ons
Ora
nges
nav
elO
rang
es n
avel
Cle
men
tine
sC
lem
enti
nes
Apr
icot
sA
pric
ots
Ban
anas
Ban
anas
Oth
ers
Oth
ers
Nec
tari
nes
Nec
tari
nes
Plu
ms
prun
esP
lum
s pr
unes
Man
dari
nsM
anda
rins
Ora
nges
sha
mou
tiO
rang
es s
ham
outi
Ora
nges
red
Ora
nges
red
Pea
rsP
ears
Alm
onds
Alm
onds
Ora
nges
, Val
enci
aO
rang
es, V
alen
cia
Pum
mel
osP
umm
elos
Pom
egra
nate
Pom
egra
nate
Figs
Figs
Ora
nges
fren
chO
rang
es fr
ench
Gra
pefr
uits
Gra
pefr
uits
Gua
vaG
uava
Che
rry,
red
Che
rry,
red
Ora
nges
loca
lO
rang
es lo
cal
Oth
er c
itru
sO
ther
cit
rus
Lem
on, s
wee
tLe
mon
, sw
eet
Man
dari
ns, M
edit
.M
anda
rins
, Med
it.
Nar
enj
Nar
enj
Ora
nges
, sou
rO
rang
es, s
our
Tum
jTu
mj
0
0
10
10
20
20
30
30
40
40
50
50
60
60
70
70
80
Aaverage area of fruit trees (1 000 hectares)
Average area of fruit trees (%)
62.3
974
.63%
2.15
2.57
%
1.76
2.11
%
1.58
1.89
%
1.16
1.38
%
1.03
1.24
%
0.91
1.09
%
0.80
0.96
%
0.07
415
0.09
%
0.00
540.
001%
0.00
260.
00%
0.00
230.
00%
0.00
190.
00%
0.00
020.
00%
0.60
0.71
%
0.59
0.71
%
0.56
0.67
%
3.80
4.55
%
2.38
2.85
%
0.53
0.63
%
0.42
0.50
%
0.33
0.40
%
0.31
0.37
%
0.27
0.33
%
0.27
0.32
%
0.23
0.28
%
0.19
0.23
%
0.18
0.21
%
0.17
0.20
%
0.54
0.64
%
0.14
0.16
%
0.13
0.16
%
0.09
152
0.11
%
Source: Department of Statistics, FAOSTAT

53
Agriculture and food gap
Figure 3.13 Average production of fruits, 2013
Oliv
esO
lives
Gra
pes
Gra
pes
App
les
App
les
Dat
esD
ates
Pac
hes
Pac
hes
Lem
ons
Lem
ons
Ora
nges
nav
elO
rang
es n
avel
Cle
men
tine
sC
lem
enti
nes
Apr
icot
sA
pric
ots
Ban
anas
Ban
anas
Oth
ers
Oth
ers
Nec
tari
nes
Nec
tari
nes
Plu
ms
prun
esP
lum
s pr
unes
Man
dari
nsM
anda
rins
Ora
nges
sha
mou
tiO
rang
es s
ham
outi
Ora
nges
red
Ora
nges
red
Pea
rsP
ears
Alm
onds
Alm
onds
Ora
nges
, Val
enci
aO
rang
es, V
alen
cia
Pum
mel
osP
umm
elos
Pom
egra
nate
Pom
egra
nate
Figs
Figs
Ora
nges
fren
chO
rang
es fr
ench
Gra
pefr
uits
Gra
pefr
uits
Gua
vaG
uava
Che
rry,
red
Che
rry,
red
Ora
nges
loca
lO
rang
es lo
cal
Oth
er c
itru
sO
ther
cit
rus
Lem
on, s
wee
tLe
mon
, sw
eet
Man
dari
ns, M
edit
.M
anda
rins
, Med
it.
Nar
enj
Nar
enj
Ora
nges
, sou
rO
rang
es, s
our
Tum
jTu
mj
0
0
20
5
40
10
60
15
80
20
100
25
120
30
140
Average production of fruits (1 000 tons)
Average production of fruits (%)
128.
1929
.38%
2.75
%
30.7
1
26.7
9
18.8
5
42.0
19.
63%
0.97
12
0.02
96
0.03
4
0.01
63
0.04
0.00
0913.6
5
11.3
3
4.51
35.1
68.
06%
40.6
39.
31%
7.12
5.18
2.74
2.14 4.26
4.19
4.96
0.92
71
2.72
2.629.
22
1.19
0.72
23
1.8511
.98
13.4
3
8.15
3.13
%
3.08
%
1.87
%
0.22
%
0.01
%
0.01
%
0.00
%
0.01
%
0.00
%
1.14
%
0.21
%
0.62
%
0.60
%
0.27
%
0.17
%
0.42
%
2.60
%
1.03
%
1.63
%
1.19
%
0.63
%
0.49
%
0.98
%
0.96
%
2.11
%4.32
%7.04
%
6.14
%
Source: Department of Statistics, FAOSTAT
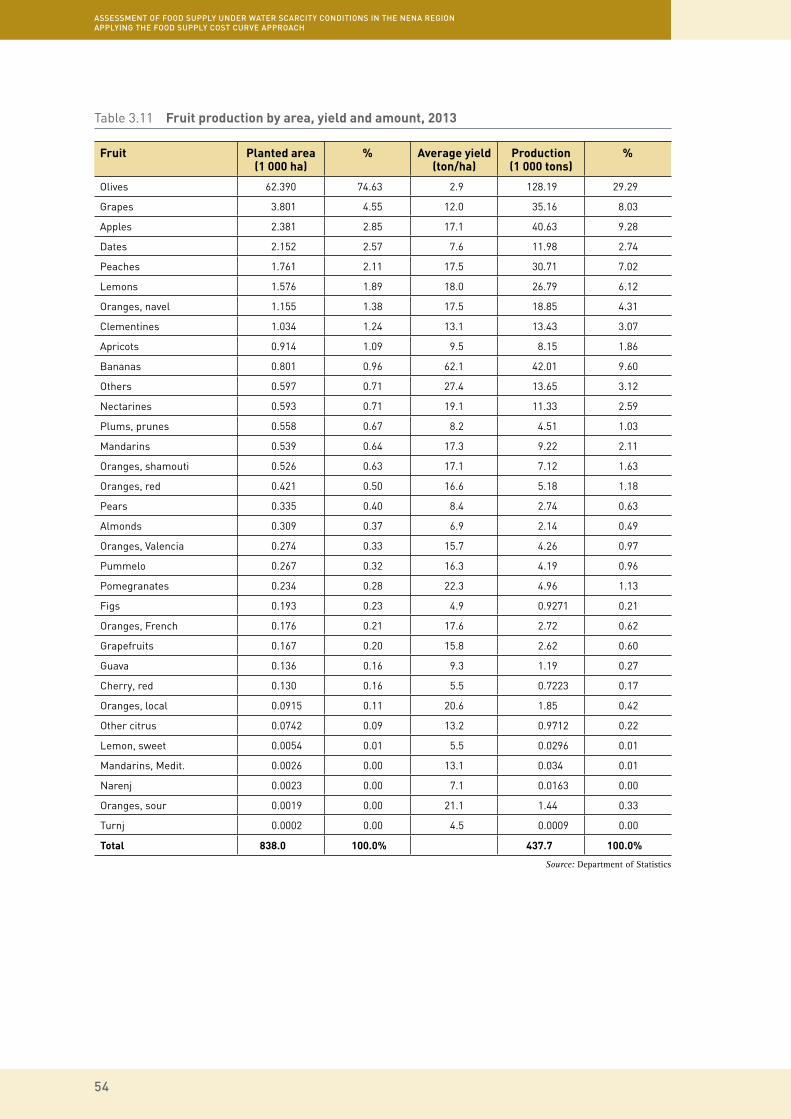
ASSESSMENT OF FOOD SUPPLY UNDER WATER SCARCITY CONDITIONS IN THE NENA REGION APPLYING THE FOOD SUPPLY COST CURVE APPROACH
54
Table 3.11 Fruit production by area, yield and amount, 2013
Fruit Planted area (1 000 ha)
% Average yield (ton/ha)
Production (1 000 tons)
%
Olives 62.390 74.63 2.9 128.19 29.29
Grapes 3.801 4.55 12.0 35.16 8.03
Apples 2.381 2.85 17.1 40.63 9.28
Dates 2.152 2.57 7.6 11.98 2.74
Peaches 1.761 2.11 17.5 30.71 7.02
Lemons 1.576 1.89 18.0 26.79 6.12
Oranges, navel 1.155 1.38 17.5 18.85 4.31
Clementines 1.034 1.24 13.1 13.43 3.07
Apricots 0.914 1.09 9.5 8.15 1.86
Bananas 0.801 0.96 62.1 42.01 9.60
Others 0.597 0.71 27.4 13.65 3.12
Nectarines 0.593 0.71 19.1 11.33 2.59
Plums, prunes 0.558 0.67 8.2 4.51 1.03
Mandarins 0.539 0.64 17.3 9.22 2.11
Oranges, shamouti 0.526 0.63 17.1 7.12 1.63
Oranges, red 0.421 0.50 16.6 5.18 1.18
Pears 0.335 0.40 8.4 2.74 0.63
Almonds 0.309 0.37 6.9 2.14 0.49
Oranges, Valencia 0.274 0.33 15.7 4.26 0.97
Pummelo 0.267 0.32 16.3 4.19 0.96
Pomegranates 0.234 0.28 22.3 4.96 1.13
Figs 0.193 0.23 4.9 0.9271 0.21
Oranges, French 0.176 0.21 17.6 2.72 0.62
Grapefruits 0.167 0.20 15.8 2.62 0.60
Guava 0.136 0.16 9.3 1.19 0.27
Cherry, red 0.130 0.16 5.5 0.7223 0.17
Oranges, local 0.0915 0.11 20.6 1.85 0.42
Other citrus 0.0742 0.09 13.2 0.9712 0.22
Lemon, sweet 0.0054 0.01 5.5 0.0296 0.01
Mandarins, Medit. 0.0026 0.00 13.1 0.034 0.01
Narenj 0.0023 0.00 7.1 0.0163 0.00
Oranges, sour 0.0019 0.00 21.1 1.44 0.33
Turnj 0.0002 0.00 4.5 0.0009 0.00
Total 838.0 100.0% 437.7 100.0%
Source: Department of Statistics

55
Agriculture and food gap
3.8 The most important crops grown in Jordan
3.8.1. The most important crops in terms of production area
As shown in Figure 3.14, barley is the most important crop in terms of production area, with a total planted area of 89 500 ha, representing 34 percent of the total cultivated area. The second most important crop is olives, produced on of 62 400 ha (24 percent of the total cultivated area), followed by wheat, produced on 26 200 ha (10 percent). Other significant crops are tomatoes, grown on 15 400 ha (6 percent); trefoil, grown on 5 000 ha (2 percent) and grapes, grown on 3 800 ha (1.5 percent).
Figure 3.14 Main crops by area, 2013
Caulifl
ower
Caulifl
ower
0
0
20
40
60
80
100
Cucum
ber
Cucum
ber
Squas
h
Squas
h
Potat
o
Potat
o
Eggpl
ants
Eggpl
ants
Grape
s
Grape
sClo
ver,
trifo
liate
Clove
r, tri
folia
te
Tom
atoe
s
Tom
atoe
s
Whea
t
Whea
t
Barle
y
Barle
y
Olives
Olives
Planted Area (1 000 hectares)
Planted Area (%)
2.9
2.9
3.4
3.4 3.8
3.8
4.96
15.4
26.2
4
62.3
.9
89.5
6
5
10
15
20
25
30
35
40
5.9%
10.1
%
1.1%
1.1%
1.3%
1.3%
1.4%
1.5%
1.9%
23.9
%
34.3
%
Source: Department of Statistics, FAOSTAT

ASSESSMENT OF FOOD SUPPLY UNDER WATER SCARCITY CONDITIONS IN THE NENA REGION APPLYING THE FOOD SUPPLY COST CURVE APPROACH
56
3.8.2. The most important crops in terms of production
Figure 3.15 below shows that the most important crop in terms of production is tomato, with a total production of 869 000 tons – 33 percent of total crop production. The next most important crop is trefoil, with 232 tons (9 percent); followed by cucumber, with 172 000 tones (6.5 percent); olives, with 128 000 tons (5 percent); eggplant, with 109 000 tons (4.2 percent) and potatoes, with 103 000 tons (3.9 percent). Watermelon production was about 88 000 tons (3.3 percent); sweet melon was production was 49 000 tons (1.9 percent) and squashes, sweet peppers, cauliflower, lettuce, cabbages, bananas and apples account for the remaining production.
Figure 3.15 Main crops by production, 2013 (1 000 tons)
Sweet m
elon
Sweet m
elon
0
0
200
100
400
300
600
500
800
700
1 000
900
Lettu
ce
Lettu
ce
Caulifl
ower
Caulifl
ower
Squas
h
Squas
h
Wat
erm
elon
Wat
erm
elon
Potat
o
Potat
o
Eggpl
ants
Eggpl
ants
Olives
Olives
Cucum
ber
Cucum
ber
Tom
atoe
s
Tom
atoe
s
Clove
r, tri
folia
te
Clove
r, tri
folia
te
Production (%)
48.7
63.6
66.2 87.7
103.
2
109.
4
128.
19
172.
3 232.
41
869.
1
5
10
15
20
25
30
35
6.5%
1.9% 2.4% 3.0%
2.5% 3.3% 3.9%
8.8%
33%
78.7
4.9%
4.2%
Source: Department of Statistics, FAOSTAT

57
Agriculture and food gap
3.8.3. Most important crops in terms of yield
The figure below shows that the most important agricultural crop in terms of yield is cucumber, with an estimated yield of 59 tons per ha, while tomatoes come in second with a yield of 56 tons per ha. Other important crops in terms of yield are cabbage, at 51 tons per ha; trefoil, at 47 tons per ha; carrots, at 40 tons per ha and sweet melon, at 37 tons per ha.
3.9 Livestock
3.9.1. Number of livestock
Livestock plays an important economic role for Jordanians living in the countryside and desert. It is, in fact, one of the most important sources of income for families in these areas. As shown in Table 3.12, the average number of livestock during the period 1971–1975 was 1.2 million, including: 766 000 sheep, 425 000 goats, 43 000 cows and 17 000 camels. The number of domestic livestock increased by 2013 to 3.2 million, including 2.3 million sheep, 737 000 goats, 70 000 cows and 13 000 camels. Livestock rearing remains the main activity in desert and rural areas. In the desert areas, the combination of overgrazing and climate variations (especially drought) has deteriorated natural pastures. The regional crises of the first and second gulf wars, as well as the Syrian crisis, have translated into an influx of large numbers of livestock into Jordan. This has had a positive impact on the agricultural sector in the country, as it increased the livestock wealth, but it has also further deteriorated natural pastures, despite the government being responsible for preserving the natural pastures as a resource for animal breeding.
Figure 3.16 Average yield of the most important crops, 2013 (ton/ha)
Sweet p
eppe
r
0
Banan
as
Wat
erm
elon
Lettu
ce
Spinac
h
Sweet m
elon
Carro
tClo
ver,
trifo
liate
Cabba
ge
Cucum
ber
Tom
atoe
s
10
20
30
40
50
60
70
51.2
30.7
31.0
32.1
31.5 35
.7 37.2
56.3 59
.3
46.9
39.8
Source: Department of Statistics, FAOSTAT

ASSESSMENT OF FOOD SUPPLY UNDER WATER SCARCITY CONDITIONS IN THE NENA REGION APPLYING THE FOOD SUPPLY COST CURVE APPROACH
58
Table 3.12 Average livestock numbers, 1971 to 2013
Year Camels Cows Goats Sheep Total
1971–1975 17.1 42.7 424.6 765.5 1 249.9
1976–1980 13.2 30.6 431.4 800.3 1 275.5
1981–1985 15.4 30.8 499.1 1 024.8 1 570.1
1986–1990 16.2 30.7 496.9 1 301.4 1 845.2
1991–1995 13.8 59.6 774.0 2 368.6 3 215.9
1996–2000 7.0 63.0 666.3 1 993.8 2 730.0
2001–2005 5.8 67.3 509.6 1 567.6 2 150.3
2006–2010 9.3 71.9 759.6 2 192.6 3 033.4
2011 12.7 67.6 752.2 2 264.6 3 097.1
2012 13.0 68.5 792.0 2 234.0 3 107.5
2013 13.1 69.7 836.5 2 311.2 3 230.5
Source: Department of Statistics, FAOSTAT
Figure 3.17 indicates that there were 765 000 head of sheep in the period 1971–1976. This increased to 2.4 million during the period 1991–1995, and stabilized at 2.2 million to 2.3 million during the period 2006–2013.
During the period 1971–1975, there were 424 000 goats. This increased to 774 000 during the period 1991–1995 and rose again to 759 000 to 837 000 during the period 2006–2013. As to cow, there were approximately 42 700 cows in the period from 1971 to 2013.
DOS data from 2013, presented in Figure 3.18, indicates that sheep represent approximately 72 percent of the total livestock in Jordan, while goats represent about 25.9 percent, cows 2.1 percent and camels 0.4 percent. This demonstrates the importance of small cattle in the livestock sector in Jordan.
Figure 3.17 Livestock by type, 1971–2013
1971
-197
5
0
500
1 000
1500
2000
2500
1976
-198
0
1981
-198
5
1986
-199
0
1991
-199
5
1996
-200
0
2001
-200
5
2006
-201
0
2011
2013
2012
Sheep Goats Cattle Camels
765,
5
800,
3 1024
,8 1301
,4
2368
,6
1993
,8
1567
,6
2192
,6
2264
,6
2234 23
11,2
424,
6
431,
4
499,
1
496,
9 774
666,
3
509,
6 759,
6
7522
792
836,
5
42,7
30,6
30,8
30,7
59,6
63 67,3
71,9
67,6
68,5
69,7
17,1
13,2
15,4
16,2
13,8
7 5,8
9,3
12,7
13 13,1
Source: Department of Statistics, FAOSTAT

59
Agriculture and food gap
According to a farm survey conducted in 2013 by the Department of Statistics, there are 1 635 broiler poultry farms producing about 247 000 tons of poultry meat. There are also 298 egg farms producing approximately 7.3 million table eggs and approximately 72 poultry breeder farms producing about 252 million hatching eggs. Finally, there are 35 hatcheries producing around 168 million chicks for the production of poultry meat and eggs.
The production of fresh fish is limited in the Jordanian agricultural sector. The annual report of the Ministry of Agriculture indicates that 1 912 tons fish were produced in 2013. Freshwater sources are the main source of fish in Jordan, producing approximately 954 tons in 2013. Aquaculture is the second most important source of fish, with 28 medium and small-sized aquaculture farms producing 798 tons of fish in 2013. Fishing is limited to the Aqaba Gulf and is estimated at about 160 tons in 2013.
The bee sector is an unregulated sector. Beekeeping is concentrated in the Jordan Valley during the winter and in the highlands in the late spring and summer. According to the Ministry of Agriculture, there were approximately 57 000 beehives in the country in 2013, that produced 200 tons of honey.
3.9.2. Animal production
According to DOS data, the livestock industry in Jordan generated about USD 1.7 billion in 2013. This included USD 685 million in livestock, with USD 434 million generated through the production of newborn animals (1.3 million lambs, 575 000 kids, and 30 000 calves). The production of milk and dairy products generated USD 244 million, with a total production of 320 000 tons, including 70 000 tons of sheep and goat milk, 237 000 tons of cow milk and about 29 tons of dairy products.
As shown in Table 3.13, the poultry industry generated a total of USD 855 million in 2013. This included 247 000 tons of poultry meat worth an estimated USD 545 million, 703 million table eggs worth an estimated USD 97 million, 252 million hatching eggs worth an estimated USD 91 million and169 million chickens worth an estimated USD 123 million. Finally, 259 000 tons of organic manure were sold, worth an estimated USD 3.2 million.
Figure 3.18 Livestock by type, 2013
Sheep
Goats
Cattle
Camels
25.89%
2.16% 0.41%
71.54%
Source: Department of Statistics, FAOSTAT

ASSESSMENT OF FOOD SUPPLY UNDER WATER SCARCITY CONDITIONS IN THE NENA REGION APPLYING THE FOOD SUPPLY COST CURVE APPROACH
60
Table 3.13 Livestock production in amount and value, 2013
Type Unit Amount (Value in thousand USD)
Newborn sheep thousand heads 1 332.9 312 059.3
Newborn goats thousand heads 575.3 120 777.5
Newborn cows thousand heads 29.9 19 335.0
Sheep and goat milk thousand MT 70.4 72 676.6
Cow milk thousand MT 236.8 156 728.5
Dairy products thousand MT 2.9 15 784.7
Wool thousand MT 6.6 3 452.8
Mohair thousand MT 0.002 1.6
Broiler thousand MT 246.6 545 729.5
Table eggs thousand eggs 703 388.6 97 120.2
Hatchery eggs thousand eggs 251 495.8 91 036.9
Chicks thousand birds 168 568.3 123 418.6
Organic manure thousand MT 333.0 4 198.3
Industrial activity Value (thousand USD) 0 70 086.7
Total 1 632 406.4
Source: Department of Statistics
3.10 Future of agriculture
As mentioned earlier, the agriculture sector in Jordan faces several challenges, especially because of the scarcity of land and water. These challenges limit the development of the agricultural sector. In order to overcome these challenges and increase the volume and value of agricultural production, and consequently achieve acceptable levels of food security in the country, agricultural resources must be properly managed and utilized.
Properly managing and using agricultural resources requires taking into account the issue of small and fragmented agricultural holdings. This is a fundamental challenge facing the agricultural sector in Jordan and is expected to worsen during the next twenty years, due to the nature of agricultural land ownership and the transfer of land from generation to generation. This problem also affects the economics of agricultural production as it contributes to higher production costs and weak use of agricultural technology, thus limiting production growth and affecting the competitiveness of Jordan’s agricultural products in local and international markets. The future development of agriculture in Jordan will require programmes that encourage small farmers to set up companies or cooperatives, which can manage the operations of various small units as a single unit, leveraging advantages of mass production and the use of technology to increase food production and thus improve food security.
As previously stated, Jordan suffers from water scarcity and is one of the ten poorest countries in the world in terms of water resources. Due to competition for water between the various economic sectors, the country should focus on agricultural activities with lower water needs,

61
Agriculture and food gap
especially in irrigated areas. It should be noted, however, that the return per cubic meter of water used may not necessarily encourage this trend, as some of the crops achieving high returns may consume large amounts of water. Thus, improving efficiency in the use of irrigation water requires further research, the dissemination of technology to provide sufficient water for irrigation and the use of irrigation systems that reduce water loss.
In the highlands and plains, where agriculture depends on rainwater, the focus should be on water harvesting activities. This can reduce the risks related to the volatile annual rainfall. The region could also focus on high-value crops, which can contribute towards improving farmer incomes and improving food security.
In areas of irrigated agriculture, the sector should focus on producing vegetables, which have the highest productivity per unit area. The focus on vegetable cultivation will significantly increase food production and, thus, improve food security in Jordan. However, success in switching to vegetable production will require the development of marketing sector infrastructure, which can operate in two directions: (1) increasing the added value of agricultural products, and (2) preventing bottlenecks in marketing associated with the expansion of vegetable cultivation.
Urban agriculture and home gardening in rural areas are also important agricultural activities that should be taken into account. These activities will contribute to improving income and food security at the household level in both urban and rural areas, while improving the quality of the vegetables and animal products the families consume. An important aspect of this type of production is that it is primarily women who are engaged it in, especially in rural areas.
The plan for the livestock sector should focus on maintaining existing livestock numbers through disease prevention programmes and on improving the quality of veterinary services. There is also a need to develop different livestock breeding systems, especially for sheep and goats, which should be transitioned from conventional breeding, which relies on grazing in natural pastures, to intensive breeding, which will increase production and prevent pasture degradation.
Large cattle, especially cows, are the main producers of milk in Jordan; however there are only 63 000 head in the country. More investment should be made in this sector, especially in breeding dairy cattle and encouraging the use of modern technology. Cow production at household level should also be encouraged, especially in rural areas in the highlands and in the Jordan Valley, where coarse fodder and remnants of field crops and vegetables can serve as feed and increase milk production.
As for the poultry sector, small farmer companies or cooperatives should be created in order to have larger-scale suppliers for the industry. These companies or cooperatives can focus on production, slaughtering and freezing of broiler chickens and on egg production. This will increase the production of poultry meat and eggs for domestic consumption and for export, reduce production costs and increase the sector’s competitiveness. The development of the sector will also improve food security in Jordan.

ASSESSMENT OF FOOD SUPPLY UNDER WATER SCARCITY CONDITIONS IN THE NENA REGION APPLYING THE FOOD SUPPLY COST CURVE APPROACH
62
3.11 SWOT analysis
This section provides an analysis of the internal and external environment of the agricultural sector. Formulating a strategic plan requires the study and analysis of internal and external factors that affect Jordan’s agriculture sector, identifying strengths, weaknesses, opportunities and threats (SWOT).
3.11.1.Analysis of the internal environment
Analysing the internal environment entails analysing the functions, activities and resources of the internal environment to identify strengths and weaknesses. Once the strengths and weaknesses are identified, the sector can maximize its strengths and tackle its weaknesses, while working efficiently to utilize the available opportunities and mitigate the threats in the external environment.
(I) Strengths:
The sector must have the capacity to efficiently use its strengths to achieve the best results. The most important strengths in the agriculture sector are:
• the existence of legislation, laws and regulations governing the functioning of the sector;
• the presence of sources of agricultural funds;
• the existence of 918 farming companies in 2011 with a combined capital of USD 469 million;
• the availability of trained technical personnel capable of adapting quickly to and adopting new technologies in the sector;
• the availability of modern techniques that can be easily adopted in Jordan (if in some cases these new technologies need large capital investment, the economic and financial returns are very high);
• successful methods of crop management, including integrated and biological pest management and organic farming;
• compared to Euro-Mediterranean countries, Jordan has a long production season, low costs and low prices.
(II) Weaknesses:
Weaknesses are areas in which the sector is not capable of responding to the surrounding variables, because of lack of resources (human, financial, etc.), infrastructure or other factors. The most common weaknesses are the following:
• weak coordination and cooperation between public and private sectors and between different public institutions in terms of strategy implementation;
• support focused primarily on production with weak support for research, technology transfer and infrastructure;

63
Agriculture and food gap
• increased gap between domestic production and the need for field crops and forage, which contributes to food security threats;
• low productivity in rain-fed agriculture related to weak research, technology transfer and extension, in addition to the cultivation of certain crops in unsuitable agricultural environments (barley in marginal areas, wheat in barley-growing areas and olives in heavy clay soils);
• low productivity in irrigated agriculture due to inefficient use of production inputs, poor management capacity, lack of training in modern production techniques and issues related to water quantity and quality;
• low productivity in the livestock sector, with an estimated calf death rate on cow farms of more than 20 percent, compared with 2-5 percent in developed countries, and a chick death rate of about 15 percent on broiler chicken farms, compared to 5-10 percent in developed countries;
• weak price competitiveness due to small production units, which prevent capacity optimization, economies of scale and the use of technologies which could raise production efficiency and reduce costs;
• production that is not oriented to the needs of local markets and potential export markets in terms of required products, quantities and timing, and the absence of export-oriented contract farming and manufacturing, due to shortfalls in the marketing system;
• weak integration between plant and animal sectors, resulting in low added-value in plant and animal production;
• deterioration of vegetation due to overgrazing, incorrect use of forestland and the absence of a comprehensive national pasture programme;
• absence of commodity organizations, councils and unions for the various production sectors; and absence of indicative guidance regarding production; and absence of institutional representation of producers in public sector development planning and policy-making;
• high percentage of loss and damage in the different marketing stages;
• weak structure of the national agricultural information system; weak agricultural statistics and divergences in data of the Department of Statistics and the Ministry of Agriculture; and the proved inaccuracy of much data regarding resources, production, domestic marketing and foreign trade, which weakens the ability of planners and decision-makers to develop plans and make sound decisions;
• failure to provide funding for agricultural cooperative projects;
• poor participation of forestry and pasture users in decision-making;
• weak veterinary services, lack of qualified veterinary personnel and limited response to farmers’ veterinary needs;
• lack of coordination between stakeholders conducting research, which often does not focus on the actual problems experienced by the livestock sector;

ASSESSMENT OF FOOD SUPPLY UNDER WATER SCARCITY CONDITIONS IN THE NENA REGION APPLYING THE FOOD SUPPLY COST CURVE APPROACH
64
• marketing difficulties, in particular for broiler farms and milk producers and their vulnerability to exploitation by marketers or dairy plants;
• weak farmers’ organizations, which are often concerned mainly with the needs of the large-scale farmers who fund them and whose needs often contradict those of small farmers, and due to the inability of these organizations to find appropriate solutions, especially in marketing, storage and purchase of production inputs, as well as to provide the basic needs for small farmers to prevent them from being subject to exploitation because of their lack of financial resources;
• lack of linkage between producers and domestic and external buyers;
• weak promotional activities and marketing strategies;
• low quality products due to non-application of standards and technical regulations;
• weakness of government agencies working in the field of agricultural marketing, in terms of numbers, training and logistical capacities;
• low prices and low farm income compared to the higher prices for consumers, as well as large marketing margins represented by large differences between producer prices and consumer prices;
• inability to export high value agricultural products to traditional Gulf markets and European markets due to higher standards;
• lack of contract farming agreements between farmers and exporters or manufacturers;
• lack of accurate data and statistics required for investors to prepare feasibility studies for their intended projects.
3.11.2.Analysis of the external environment:
The analysis of the external environmental explores social, economic, political, technological and cultural factors to identify opportunities and threats. The analysis also explores the sources and components of these opportunities and threats by breaking them down into subcomponents, in order to understand the relationships between different elements. Such analysis helps the sector by forming a larger picture of existing risks, so that the sector can take the necessary measures to prevent potential threats and mitigate their effects. The analysis also helps the sector design procedures and strategies to utilize the available opportunities in order to achieve its strategic objectives.
(I) Opportunities:
Opportunities are factors present in an organization’s external environment during a specific period of time, which, if properly used, may result in physical and non-physical benefits. The most important opportunities for the agricultural sector are:
• climate variability, which results in several production periods throughout the year and in the possibility to produce certain crops during their usual season under natural conditions and continuing production of the same crops throughout the year in the Jordan Valley, the highlands and the eastern region without long overlapping periods;

65
Agriculture and food gap
• the existence of appropriate infrastructure in terms of cooling warehouses, wholesale markets and grading and packing stations;
• Jordan’s prevailing investment climate, as one of the few countries that do not impose taxes on income earned from agricultural activities, on agricultural resources, on elements needed for production and for machinery, and on the purchase of equipment;
• new markets and export opportunities in the agricultural sector, thanks to multilateral and bilateral partnership agreements with European countries and with economic groups such as the World Trade Organization and thanks to the Greater Arab Free Trade Agreement;
• availability of appropriate transportation and communication infrastructure, including agricultural and international road networks linking Jordan with traditional Arabian Gulf markets and other countries as well as air transportation, in addition to telecommunication networks and information technology, providing a competitive advantage;
• increasing demand for agricultural products in addition to traditional demand factors such as population increase and income growth,
• potential for increased demand among tourists through government efforts to activate the tourism industry;
• availability of large areas of rangelands.
(II) Threats:
Threats are the possible events that could harm the sector. Threats do not necessarily exist now. They can be extrapolated from certain indicators and trends within the external environment, including threats that may arise in the short or long term. The following are the most important threats facing the agricultural sector:
• weak legislation governing the sustainable use of forest and rangelands;
• lack of funds required for programmes and strategic projects;
• poor participation of institutions involved in the implementation of the strategy, where responsibility for implementation rests only with the Ministry of Agriculture;
• lack of commitment on the part of other ministries and institutions to the implementation of the strategy’s programmes and projects;
• increasing production costs, especially for small-scale farmers, in light of the rise and instability of oil prices;
• increasing agricultural risks due to weather conditions, which limit investment in agriculture and increase government spending to compensate farmers for their losses;
• rainfall fluctuation and successive years of drought;
• continuous decline in the quantity and quality of fresh surface water for irrigation;
• continuous decline of agricultural land due to urban spread and fragmentation of agricultural holdings not necessarily adequate for productive and profitable agriculture;
• challenges related to the quantitative and qualitative shortage in agricultural labour;
ASSESSMENT OF FOOD SUPPLY UNDER WATER SCARCITY CONDITIONS IN THE NENA REGION APPLYING THE FOOD SUPPLY COST CURVE APPROACH
66
• continuous decrease in the amount of fresh surface water available for irrigation and the continuous deterioration in water quality due to the increasing blending with highly saline treated wastewater, especially in areas of the central Jordan Valley, leading to the salinization of soils;
• continuous encroachment on forestlands through unregulated grazing, illegal cutting of trees and conversion of forests by some public and private entities;
• lack of technical capacities among agricultural workers;
• agricultural labour is still not covered by labour laws, or by social security laws, leading farmers to migrate to other economic sectors and resulting in foreign labourers replacing local workers;
• weak global investment environment, the global investment environment being a factor in the private sector in efficiently playing its role;
• weak the control system for product quality, multiplicity of regulatory bodies, and lack of necessary integration between relevant laboratories;
• poor marketing infrastructure, especially for wholesale markets and livestock markets, in terms of managing marketing facilities;
• high cost of improving and rehabilitating forestry and pasture land and lack of financial allocations for these purposes;
• weak economy in local communities surrounding forests and pastoral reserves;
• agricultural risks which have not been dealt with seriously by the Ministry of Agriculture or by international organizations and donor countries within the framework of livestock sector management;
• growing competition of imports in the domestic market, high vulnerability of local products to the different forms of unfair competition and exposure of the local market to illegal practices in terms of public health, sanitary and phytosanitary procedures due to the lack of planning, personnel and equipment for the application of WTO agreements;
• shortage or weak promotion of incentives that encourage investment in the agricultural sector.
3.12 Climate change and agriculture in Jordan
Most of Jordan is characterized by dry, hot summers and mild, wet winters, with extreme variability in rainfall, generally insufficient for crop production. As rainfall is unevenly distributed throughout the growing seasons and often comes in intense bursts, it cannot usually support economically viable farming.
The figures below show the amount of rainfall during the months of November through March, the rainy season, from 1960 through 2011, as well as average low and high temperatures for one of the most important areas of rain-fed agriculture in Jordan, the province of Irbid, which is the main producer of wheat and barley. Although annual rainfall rates are stable, a closer look at the months of November through March shows that during November, January and February, there

67
Agriculture and food gap
are cycles of stable rainstorms, while rainfall tends to decrease during the months of December and March. As these months play a major role in the growth of field crops, especially winter crops, the decrease in rainfall has a negative impact on agricultural production.
The analysis of average lower and higher temperatures during the different seasons between 1960 and 2013 shows that both tend to rise, with minimum temperatures rising more than maximum temperatures. This change affects the life cycle of plants as well as the rates of evaporation, thus negatively affecting agricultural production.
Figure 3.19 Total amounts of rainfall between 1960 and 2013 (mm)
0
0
0
0
0
0
50
50
50
50
200
100
100
100
100
400
100
150
150
150
150
600
200
200
250
200
200
200
250
250
350
300
300
1 000
400
250
800
300
1960
1960
1960
1960
1960
1960
1963
1963
1963
1963
1963
1963
1966
1966
1966
1966
1966
1966
1969
1969
1969
1969
1969
1969
1972
1972
1972
1972
1972
1972
1975
1975
1975
1975
1975
1975
1978
1978
1978
1978
1978
1978
1981
1981
1981
1981
1981
1981
1984
1984
1984
1984
1984
1984
1987
1987
1987
1987
1987
1987
1990
1990
1990
1990
1990
1990
1993
1993
1993
1993
1993
1993
1996
1996
1996
1996
1996
1996
1999
1999
1999
1999
1999
1999
2002
2002
2002
2002
2002
2002
2005
2005
2005
2005
2005
2005
2008
2008
2008
2008
2008
2008
2011
2011
2011
2011
2011
2011
NOVEMBER
JANUARY
MARCH
DECEMBER
FEBRUARY
T O T A L
Source: Department of Statistics, FAOSTAT
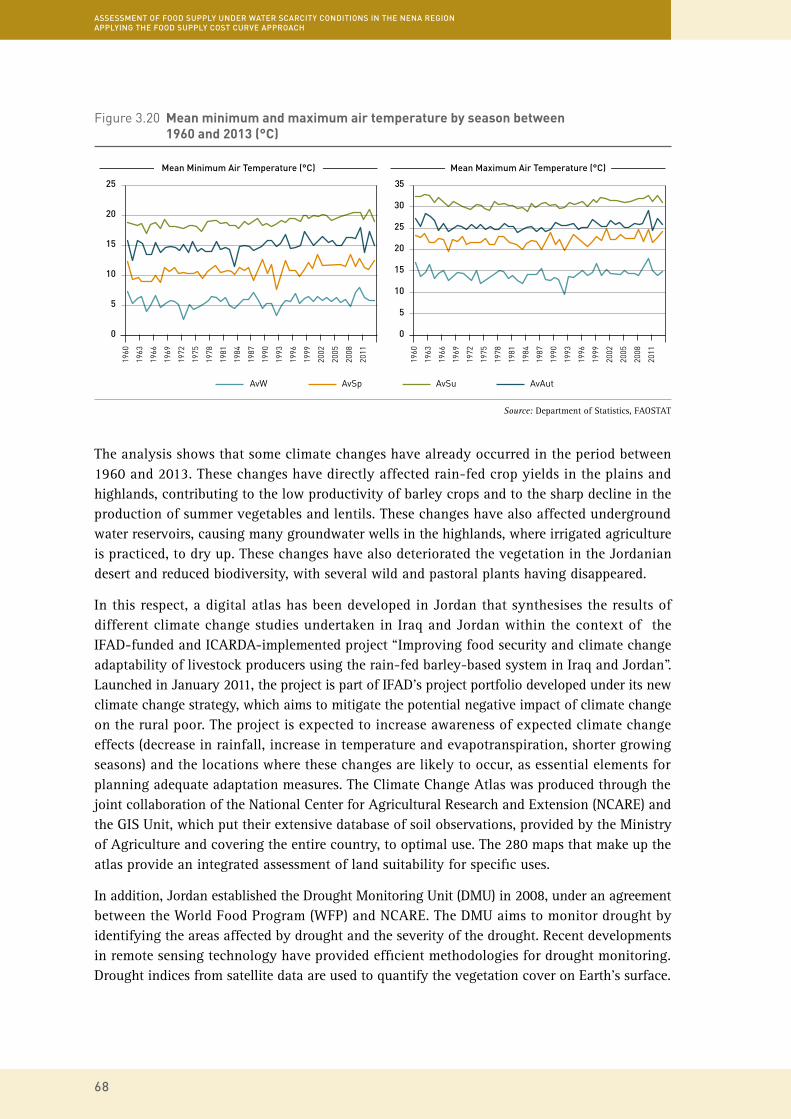
ASSESSMENT OF FOOD SUPPLY UNDER WATER SCARCITY CONDITIONS IN THE NENA REGION APPLYING THE FOOD SUPPLY COST CURVE APPROACH
68
The analysis shows that some climate changes have already occurred in the period between 1960 and 2013. These changes have directly affected rain-fed crop yields in the plains and highlands, contributing to the low productivity of barley crops and to the sharp decline in the production of summer vegetables and lentils. These changes have also affected underground water reservoirs, causing many groundwater wells in the highlands, where irrigated agriculture is practiced, to dry up. These changes have also deteriorated the vegetation in the Jordanian desert and reduced biodiversity, with several wild and pastoral plants having disappeared.
In this respect, a digital atlas has been developed in Jordan that synthesises the results of different climate change studies undertaken in Iraq and Jordan within the context of the IFAD-funded and ICARDA-implemented project “Improving food security and climate change adaptability of livestock producers using the rain-fed barley-based system in Iraq and Jordan”. Launched in January 2011, the project is part of IFAD’s project portfolio developed under its new climate change strategy, which aims to mitigate the potential negative impact of climate change on the rural poor. The project is expected to increase awareness of expected climate change effects (decrease in rainfall, increase in temperature and evapotranspiration, shorter growing seasons) and the locations where these changes are likely to occur, as essential elements for planning adequate adaptation measures. The Climate Change Atlas was produced through the joint collaboration of the National Center for Agricultural Research and Extension (NCARE) and the GIS Unit, which put their extensive database of soil observations, provided by the Ministry of Agriculture and covering the entire country, to optimal use. The 280 maps that make up the atlas provide an integrated assessment of land suitability for specific uses.
In addition, Jordan established the Drought Monitoring Unit (DMU) in 2008, under an agreement between the World Food Program (WFP) and NCARE. The DMU aims to monitor drought by identifying the areas affected by drought and the severity of the drought. Recent developments in remote sensing technology have provided efficient methodologies for drought monitoring. Drought indices from satellite data are used to quantify the vegetation cover on Earth’s surface.
Figure 3.20 Mean minimum and maximum air temperature by season between 1960 and 2013 (°C)
AvW AvSp AvSu AvAut
0 0
55
10
10
15 20
15
20
25 35
30
25
1960
1960
1963
1963
1966
1966
1969
1969
1972
1972
1975
1975
1978
1978
1981
1981
1984
1984
1987
1987
1990
1990
1993
1993
1996
1996
1999
1999
2002
2002
2005
2005
2008
2008
2011
2011
Mean Minimum Air Temperature (°C) Mean Maximum Air Temperature (°C)
Source: Department of Statistics, FAOSTAT

69
Agriculture and food gap
3.13 Food Gap
3.13.1.Food Needs
As shown in Figure 3.21, in 2012, Jordan required 3.91 million tons of food, including: 1.05 million tons of grain (27 percent of the total food needs); 758 000 tons of vegetables (19 percent); 445 000 tons of milk and milk products (11 percent); 399 000 tons of fruits (10 percent); 334 000 tons of sugar and sweeteners (9 percent) and 331 000 tons of meat (8 percent). The remaining food needs were distributed among tuber starches (5 percent), vegetable oil (4 percent) and oil crops, eggs, pulses, fish and seafood and other food products (1 percent each). Data indicates that each person in Jordan requires a total of 612 kg per year of these food products, which would provide about 2 774 kilocalories, including 2 376 kilocalories from plant products and 398 kilocalories from animal products. These food products also provide 75 grams (g) of protein per person per day, 50 g from plant products and 24.7 g from animal products, as well as providing 74.6 g of fat, including 46.1 g from plant products and about 28.5 g from animal products.
Figure 3.21 Food needs in 2012 (1 000 tons and %)
Pulses
0
200
400
600
1 000
800
1 200
Fish, s
eafo
od
Eggs
Oil cr
ops
Acquat
ic pr
oduct
s, ot
herVe
geta
bles
oils
Starc
hy roo
ts
Mea
t
Sugar
and
swee
tener
sFr
uits,
excl
uding w
ine
Milk
,
excl
uding b
utter
Cerea
ls,
excl
uding b
eer
Vege
tabl
es
24.8
29.4 44.6
54.5 10
3.7
183
331.
8
334.
1
399.
4
445.
6
758.
2
1054
.3
144.
7
Source: Department of Statistics, FAOSTAT

ASSESSMENT OF FOOD SUPPLY UNDER WATER SCARCITY CONDITIONS IN THE NENA REGION APPLYING THE FOOD SUPPLY COST CURVE APPROACH
70
Table 3.14 Food needs, 2012
Food (Thousand tons) (% of total)
Cereals, excluding beer 1 054.3 27
Vegetables 758.2 19.4
Milk, excluding butter 445.6 11.4
Fruits, excluding wine 399.4 10.2
Sugar and sweeteners 334.1 8.5
Meat 331.8 8.5
Starchy roots 183 4.7
Vegetable oils 144.7 3.7
Aquatic products, other 103.7 2.7
Oil crops 54.5 1.4
Eggs 44.6 1.1
Pulses 24.8 0.6
Fish, seafood 29.4 0.8
Total 3 908.10 100
Source: Department of Statistics, FAOSTAT (Food consumption adjusted by researcher using FAO approach)
3.13.2 Food self-sufficiency
As shown in Table 3.15 below, data from the food self-sufficiency budget indicates that Jordan has achieved self-sufficiency in oil crops, vegetables and table eggs, and different degrees of self-sufficiency in other agricultural commodities. Data also indicates that the overall self-sufficiency ratio (SSR) for agricultural commodities is 75.63 percent, which is an acceptable rate. However, Jordan hardly achieves even 6 percent self-sufficiency for products with a high rate of consumption, such as grains and sugar.
Table 3.15 Production, consumption and SSR by food type, 2012
Food Production (1 000 tons)
Consumption (1 000 tons)
SSR (%)
Oil crops 194.9 54.5 357.60
Vegetables 1 570.3 758.2 207.10
Eggs 61.8 44.6 138.60
Starchy roots 141.6 183 77.40
Fruits, excluding wine 305.1 399.4 76.40
Meat 234.6 331.8 70.70
Milk, excluding butter 310.4 445.6 69.70
Aquatic products, other 42.8 103.7 41.30
Vegetable oils 24.6 144.7 17.00
Pulses 2 24.8 8.10
Cereals, excluding beer 66 1 054.3 6.30
Fish, seafood 1.2 29.4 4.10
Sugar and sweeteners 0.2 334.1 0.10
Total 2 955.5 3 908 75.63%
Source: Department of Statistics, FAOSTAT (Food consumption adjusted by researcher using FAO approach)

71
Agriculture and food gap
3.13.3.Food Gap
As shown in the table below, Jordan’s total food gap in 2012 was 1.93 million tons. While Jordan has a surplus of some food products, especially vegetables, oil crops and eggs, which amounts to about 970 000 tons, the net food gap is about 952 000 tons, 24.37 percent of Jordan’s total food needs.
Figure 3.22 Production, consumption and SSR by food type, 2012 (1 000 tons and percentage)
0
400
200
800
600
1200
1 000
1400
1600 Ve
geta
bles
Milk
,
excl
uding b
utter
Fruits
,
excl
uding w
ine
Mea
t
Oil cr
ops
Starc
hy roo
ts
Cerea
ls,
excl
uding b
eer
Eggs
Acquat
ic pr
oduct
s, ot
herVe
geta
bles
oils
Pulses
Sugar
and
swee
tener
s
Fish, s
eafo
od
1054
.3
334.
1
0.210
3.7
42.8 14
4.7
24.6
24.8
2 29.4
1.244
.6
61.8
331.
8
234.
6
54.5
194.
9
183
141.
6
66
758.
2
1570
.3
445.
6
310.
4
399.
4
305.
1
0
SSR (%)
50
100
150
200
250
300
350
40070
.70%
76.4
0%
77.4
0% 138.
60%
0.10
%
4.10
%
8.10
%
6.30
%
17.0
0% 41.3
0% 69.7
0%
207.
10%
357.
60%
Sugar
and
swee
tener
s F
ish, s
eafo
od
Cerea
ls,
excl
uding b
eer
Pulses
Vege
tabl
es oi
lsAcq
uatic
prod
ucts,
other M
ilk,
excl
uding b
utter
Mea
t
Fruits
,
excl
uding w
ine
Starc
hy roo
ts
Eggs
Oil cr
ops
Vege
tabl
es
Source: Department of Statistics, FAOSTAT

ASSESSMENT OF FOOD SUPPLY UNDER WATER SCARCITY CONDITIONS IN THE NENA REGION APPLYING THE FOOD SUPPLY COST CURVE APPROACH
72
Table 3.16 Food gap in terms of quantity and ratio, 2012
2012 Food (1 000 ton) Food gap (1 000 tons) Food gap (%)
Oil crops 54.5 140.4 257.60
Vegetables 758.2 812.1 107.10
Eggs 44.6 17.2 38.60
Starchy roots 183 -41.4 -22.60
Fruits, excluding wine 399.4 -94.3 -23.60
Meat 331.8 -97.2 -29.30
Milk, excluding butter 445.6 -135.2 -30.30
Aquatic products, other 103.7 -60.9 -58.70
Vegetable oils 144.7 -120.1 -83.00
Pulses 24.8 -22.8 -91.90
Cereals, excluding beer 1 054.3 -988.3 -93.70
Fish, seafood 29.4 -28.2 -95.90
Sugar and sweeteners 334.1 -333.9 -99.90
Total 3908 -952.5 -24.37%
Sum positive food gap 969.7
Sum negative food gap -1922.3
Source: Department of Statistics, FAOSTAT (Food consumption adjusted by researcher using FAO approach)
The charts below show that the food gap is largest for grain products, sugar, beans, fish, seafood products and vegetable oils. Jordan depends on imports to close these gaps. On the other hand, the gap is less severe for products such as tuber starch, milk and milk products, fruits, meat and animal fat.
Figure 3.23 Food gap, 2012 (1 000 tons and percentage)
Food need (1 000 Tons)
Cerea
ls,
excl
uding b
eer
0
200
400
600
1 000
800
1200
Vege
tabl
es Milk
,
excl
uding b
utter
Fruits
,
excl
uding w
ine
Sugar
and
swee
tener
s
Mea
tSta
rchy r
oots
Vege
tabl
es oi
lsAcq
uatic
prod
ucts,
other
Oil cr
ops
Eggs
Pulses
Fish, s
eafo
od
24.8
29.444.6
54.510
3.7
183
331.
8
334.
1
399.
4
445.
6
758.
2
1054
.3
144.
7

73
Agriculture and food gap
3.14 Recommendations
The analysis presented in this chapter demonstrates that there is a limited amount of land available for agriculture and, further, that the amount of land used for agriculture has decreased over time. Given the food needs of the local population and the competition for water resources between the agriculture sector and other economic sectors, the rain-fed agricultural areas in the plains (the main producers of field crops in the north, central and southern parts of Jordan) will be unable to meet the growing demand for food. This is mainly due to conflicting needs between agrarian and non-agrarian populations and activities and the food production gap, which is usually covered through imports.
Food gap (1 000 Tons)
Food gap (1 000 Tons)
Oil cr
ops
Cerea
ls
excl
uding b
eer
-100
-50
0
50
200
250
100
150
300
Vege
tabl
es
Vege
tabl
es
Eggs
Milk
excl
uding b
utter
Starc
hy roo
ts
Fruits
excl
uding w
ine
Fruits
,
excl
uding w
ine
Sugar
and
swee
tener
s
Mea
t
Mea
t
Milk
,
excl
uding b
utter
Starc
hy roo
ts
Acquat
ic
prod
ucts,
other
Vege
tabl
es oi
ls
Vege
tabl
es oi
ls
Acquat
ic pr
oduct
s, ot
her
Pulses
Oil cr
ops
Cerea
ls,
excl
uding b
eer
Eggs
Sugar
and
swee
tener
s
Pulses TOTAL
Fish, s
eafo
od
Fish, s
eafo
od
-1 000
-600
-800
-200
-400
200
0
600
400
1 000
800
-988
.3
812.
1
-135
.2
-333
.9
-97.
2
-41.
4
-60.
9
-120
.1
17.214
0.4
-28.
2
-22.
8
-952
.5
-94.
3
445.
6%
758.
2%
-24.
8%
-29.
4%
-44.
6%
-54.
5%
-103
.7%
-144
.7%
-183
%
-331
.8%
-334
.1%
-399
.4%
1054
.3%
Source: Department of Statistics, FAOSTAT

ASSESSMENT OF FOOD SUPPLY UNDER WATER SCARCITY CONDITIONS IN THE NENA REGION APPLYING THE FOOD SUPPLY COST CURVE APPROACH
74
Under the current circumstances, Jordan cannot provide for its domestic demand for grains. Its production covers only 6 percent of its total needs and factors such as reduced agricultural areas, decreased production and a growing population further limit the country’s capacity to meet its demand. Agricultural policies aiming to increase grain production in the plains areas would be doomed to fail as the environment in Jordan is not favourable for grain production. Therefore, agricultural policies must focus on expanding agriculture on slope lands in rain-fed areas, in order to increase farmland food production, especially of olive crops.
On the other hand, Jordan produces large quantities of fruits and vegetables on irrigated land in the Jordan Valley and in the highlands. Perhaps the development of production technologies will make it possible to increase agricultural productivity in irrigated areas, and updated agricultural practices may significantly contribute to increasing food production in the country. Consequently, this approach may reduce the domestic food supply/demand gap. This will also improve food security in the country, as the sale of surplus production will enable the population to purchase food products not produced in the country. In light of the analysis presented in this section, we suggest that agricultural policies to increase food production in Jordan include the following:
• expand land reclamation in the highlands, where rainfall is more than 200 mm, to increase the agricultural land and the production of fruit crops;
• develop infrastructure sectors and support agricultural production, especially marketing and processing, to increase the added-value of agricultural production activities;
• introduce modern technologies in irrigated agriculture to increase output and reduce costs;
• improve methods for breeding sheep and goats through the promotion of closed breeding to increase production and preserve grazing resources;
• encourage the breeding of cows at household level and support the establishment of livestock agricultural complexes to increase production and reduce costs;
• encourage the formation of small-farmer cooperatives and agricultural companies.

75
Agriculture and food gap
Lima al-naeem supervises palm plantations of the integrated pest management project in the countries of the Near East in Dear Alla.©FAO/Khalil Mazraawi

ASSESSMENT OF FOOD SUPPLY UNDER WATER SCARCITY CONDITIONS IN THE NENA REGION APPLYING THE FOOD SUPPLY COST CURVE APPROACH
76
©FA
O/F
ayce
l Che
nini
76
Farmer working in a field in Deir Alla.©FAO/Khalil Mazraawi
Sampling of insects population on olive tree.©FAO/Lucie Chocholata

77
Food supply cost curve
4.1 Food production and consumption
Jordan largely depends on food imports to meet its requirements for grains and meat. Food security is therefore one of the country’s priority issues, cutting across different economic sectors, and is an essential element in the strategies of various ministries. The challenges facing Jordan’s economy and its agriculture sector, particularly agricultural land issues and water scarcity, restrict the country’s ability to achieve food security. (Jordan is one of the ten poorest countries in the world in terms of water resources.) Despite these challenges and constraints, Jordan has succeeded in providing its population with some food supplies and has achieved high levels of productivity in vegetables, table eggs, poultry meat and olive oil. This reflects Jordan’s ability to rely on its own resources to provide some of these necessary foods. Food consumption includes a wide range of agricultural products, summarized below:
• Cereals: The cereal segment includes wheat, rice, barley, maize and millet. Jordan depends on imports for most of these cereals, as the agricultural sector produces only 3 percent of its cereal needs, including limited quantities of wheat and barley.
• Starchy roots: These include potatoes and sweet potatoes. Jordan produces 60 percent of its starchy root requirement, consisting only of potatoes, and depends on imports to cover the remaining requirement.
• Sugar and sweeteners: Sugar and sweeteners include sugar and honey. Jordan imports most of the sugar and sweeteners consumed in the country, since the agricultural sector produces only 0.1 percent of its sugar and sweetener needs, with limited honey production.
• Pulses: Pulses include beans, chickpeas and lentils. Jordan depends on imports to provide pulses, since the agricultural sector produces only 4.2 percent of its needs, including limited quantities of lentils and chickpeas.
• Oil crops: Oil crops include soybean, groundnut, sunflower, coconut, sesame and olive. Jordan depends on imports to provide most of the oil crops. The agricultural sector produces 87 percent of its needs for oil crops, limited to olive crops.
• Vegetable Oils: Vegetable oils include soybean oil, sunflower oil, cottonseed oil, palm oil, coconut oil, olive oil and corn oil. Jordan depends on imports for vegetable oils, since the agricultural sector produces 15.3 percent of vegetable oil needs, limited to olive oil.
• Vegetables: Vegetables include tomatoes, cucumbers, squash, eggplant, cauliflower, onions, carrots, sweet melon and watermelon. Jordan produces more vegetables than it requires (160 percent) and exports large quantities.
4

ASSESSMENT OF FOOD SUPPLY UNDER WATER SCARCITY CONDITIONS IN THE NENA REGION APPLYING THE FOOD SUPPLY COST CURVE APPROACH
78
• Fruits: Fruits include oranges, lemons, bananas, apples, apricots and grapes. Jordan produces 79 percent of its fruit needs and imports the deficit.
• Meat: Meats include beef, mutton, chicken and goat meat. Jordan produces 78 percent of its domestic meat consumption, mainly mutton and chicken, and relies on imports to cover the remaining domestic demand.
• Eggs: Eggs include table eggs and hatchery eggs. Jordan’s egg production exceeds its domestic consumption (107 percent of domestic consumption).
• Milk and derivate products: Milk and milk products include cow, goat and sheep milk, yoghurt and cheese. Jordan covers 54 percent of its domestic consumption of milk and milk products.
• Fish and seafood products: Fish and seafood products include fish, crustaceans and cephalopods. Jordan depends on imports to provide most of its consumption of fish and seafood products, since the agricultural sector produces 1.6 percent of its domestic consumption.
• Other food products: Jordan depends on imports to cover most of its consumption of spices, stimulants, nuts, alcohol, animal fat and edible offal as the agricultural sector produces less than 30 percent of the domestic requirement of these products.
As shown in Table 4.1, annual average food consumption in Jordan during 1991–1995 was 2 159 million tons. This was consumed by 4 million people, with an average per capita share of 538 kg per year. Food consumption increased during the period 2006–2010 to 3.480 million tons consumed by 5.9 million people, at an average of 595 kg per capita per year. Food consumption continued to increase to 3.861 million tons in 2012 and to 4.195 million tons in 2015, and is expected to increase to 4.818 million tons in 2020. This 2.5 percent annual growth rate of food consumption assumes a continuing population growth rate of 2 percent during the period 2015–2020 (from 6.4 million in 2012, to 6.8 million in 2015, and to 7.6 million in 2020). Average per capita consumption of food is expected to increase by 0.5 percent per annum during the period 2012–2020, from 605 kg per year in 2012 to 615 kg in 2015 and to 633 kg in 2020.
Table 4.1 Annual average food consumption and growth rate (tons and %)
Item 1991–1995 1996–2000 2001–2005 2006–2010 2012 2015 2020 G. R. %
Cereals 605.4 736.4 809.6 947.2 1007.5 1096.0 1261.1 0.025
Starchyroots 61.2 79.4 112.4 142.3 183.0 197.6 224.6 0.023
Sugarandsweeteners 155.2 177.4 234.4 271.8 334.1 362.1 414.1 0.024
Pulses 28.0 24.0 40.8 40.7 24.8 27.3 32.2 0.029
Oilcrops 20.6 31.2 45.0 51.7 54.5 58.9 67.1 0.023
Vegetableoils 56.6 69.8 97.2 104.4 144.7 156.5 178.3 0.023
Vegetables 453.8 390.0 559.8 691.9 758.2 824.7 948.9 0.025
Fruits 275.8 250.8 294.4 315.0 399.4 435.5 503.1 0.026
Meat 134.8 151.2 192.2 250.8 331.8 359.0 409.4 0.024
Eggs 36.0 35.4 29.2 32.0 44.6 48.8 56.6 0.027
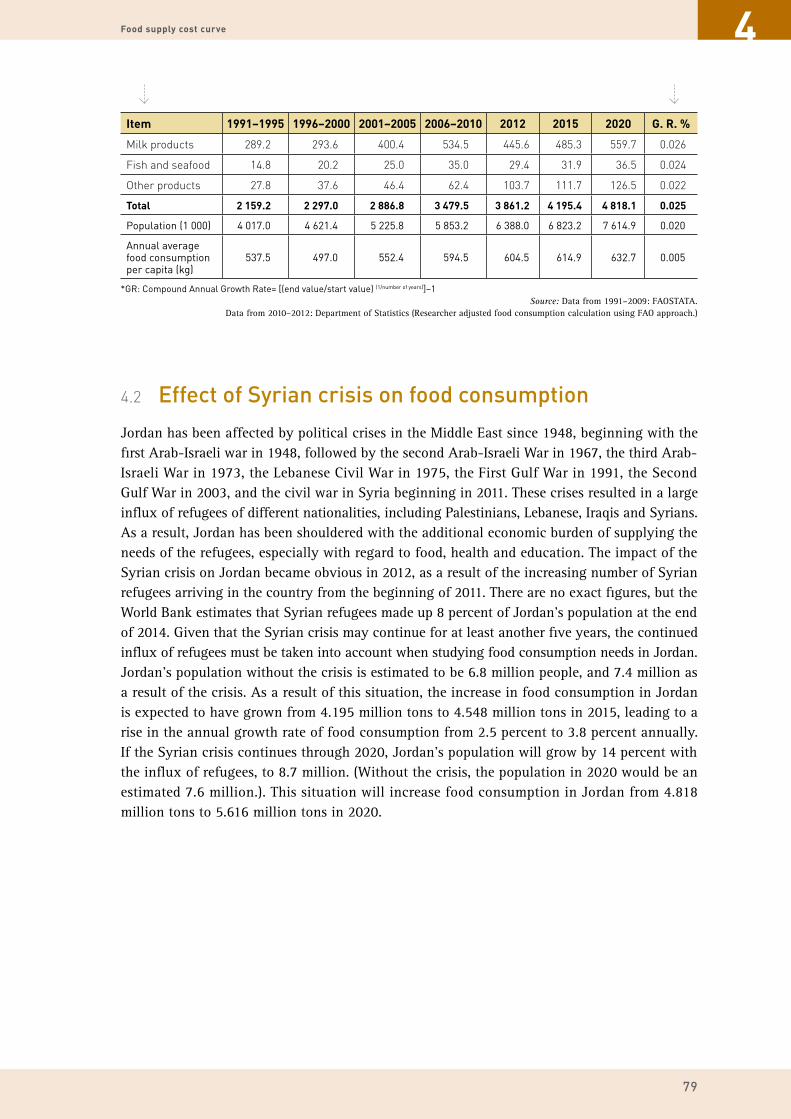
79
Food supply cost curve
Table 4.1 Annual average food consumption and growth rate (tons and %)
Item 1991–1995 1996–2000 2001–2005 2006–2010 2012 2015 2020 G. R. %
Milkproducts 289.2 293.6 400.4 534.5 445.6 485.3 559.7 0.026
Fishandseafood 14.8 20.2 25.0 35.0 29.4 31.9 36.5 0.024
Otherproducts 27.8 37.6 46.4 62.4 103.7 111.7 126.5 0.022
Total 2 159.2 2 297.0 2 886.8 3 479.5 3 861.2 4 195.4 4 818.1 0.025
Population (1 000) 4 017.0 4 621.4 5 225.8 5 853.2 6 388.0 6 823.2 7 614.9 0.020
Annual average food consumption per capita (kg)
537.5 497.0 552.4 594.5 604.5 614.9 632.7 0.005
*GR: Compound Annual Growth Rate= [(end value/start value) (1/number of years)]–1Source: Data from 1991–2009: FAOSTATA.
Data from 2010–2012: Department of Statistics (Researcher adjusted food consumption calculation using FAO approach.)
4.2 Effect of Syrian crisis on food consumption
Jordan has been affected by political crises in the Middle East since 1948, beginning with the first Arab-Israeli war in 1948, followed by the second Arab-Israeli War in 1967, the third Arab-Israeli War in 1973, the Lebanese Civil War in 1975, the First Gulf War in 1991, the Second Gulf War in 2003, and the civil war in Syria beginning in 2011. These crises resulted in a large influx of refugees of different nationalities, including Palestinians, Lebanese, Iraqis and Syrians. As a result, Jordan has been shouldered with the additional economic burden of supplying the needs of the refugees, especially with regard to food, health and education. The impact of the Syrian crisis on Jordan became obvious in 2012, as a result of the increasing number of Syrian refugees arriving in the country from the beginning of 2011. There are no exact figures, but the World Bank estimates that Syrian refugees made up 8 percent of Jordan’s population at the end of 2014. Given that the Syrian crisis may continue for at least another five years, the continued influx of refugees must be taken into account when studying food consumption needs in Jordan. Jordan’s population without the crisis is estimated to be 6.8 million people, and 7.4 million as a result of the crisis. As a result of this situation, the increase in food consumption in Jordan is expected to have grown from 4.195 million tons to 4.548 million tons in 2015, leading to a rise in the annual growth rate of food consumption from 2.5 percent to 3.8 percent annually. If the Syrian crisis continues through 2020, Jordan’s population will grow by 14 percent with the influx of refugees, to 8.7 million. (Without the crisis, the population in 2020 would be an estimated 7.6 million.). This situation will increase food consumption in Jordan from 4.818 million tons to 5.616 million tons in 2020.
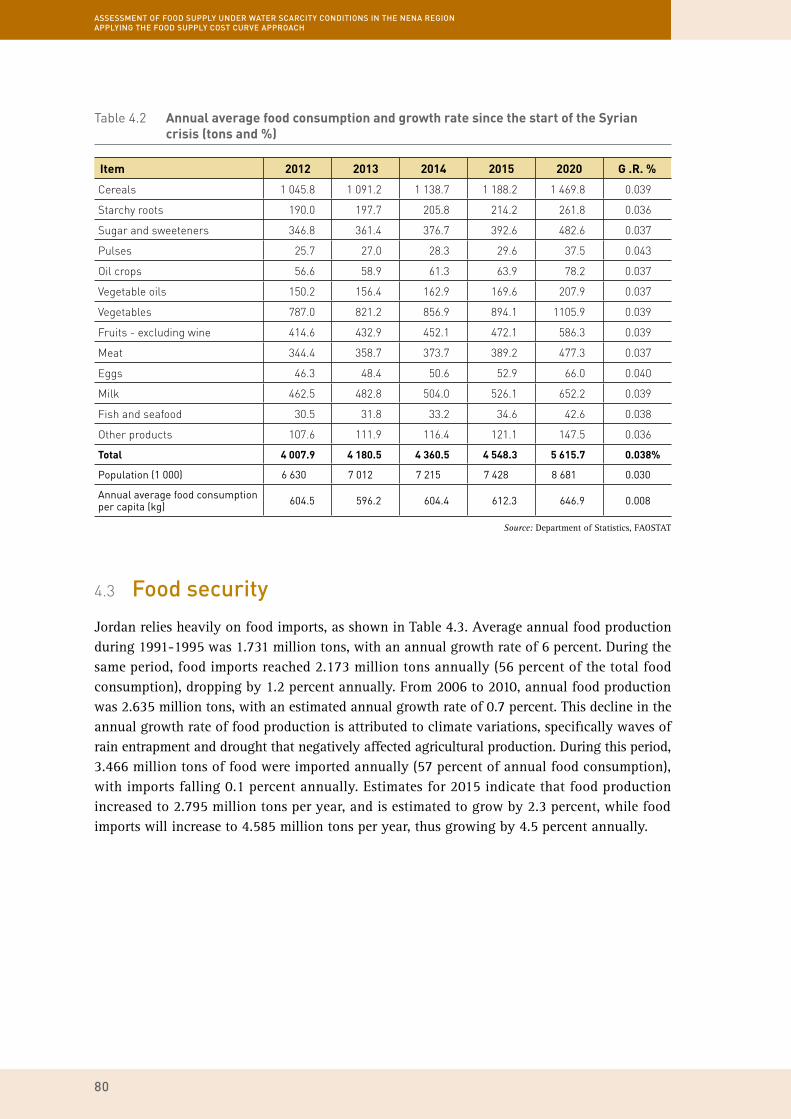
ASSESSMENT OF FOOD SUPPLY UNDER WATER SCARCITY CONDITIONS IN THE NENA REGION APPLYING THE FOOD SUPPLY COST CURVE APPROACH
80
Table 4.2 Annual average food consumption and growth rate since the start of the Syrian crisis (tons and %)
Item 2012 2013 2014 2015 2020 G .R. %
Cereals 1045.8 1091.2 1138.7 1188.2 1469.8 0.039
Starchyroots 190.0 197.7 205.8 214.2 261.8 0.036
Sugarandsweeteners 346.8 361.4 376.7 392.6 482.6 0.037
Pulses 25.7 27.0 28.3 29.6 37.5 0.043
Oilcrops 56.6 58.9 61.3 63.9 78.2 0.037
Vegetableoils 150.2 156.4 162.9 169.6 207.9 0.037
Vegetables 787.0 821.2 856.9 894.1 1105.9 0.039
Fruits-excludingwine 414.6 432.9 452.1 472.1 586.3 0.039
Meat 344.4 358.7 373.7 389.2 477.3 0.037
Eggs 46.3 48.4 50.6 52.9 66.0 0.040
Milk 462.5 482.8 504.0 526.1 652.2 0.039
Fishandseafood 30.5 31.8 33.2 34.6 42.6 0.038
Otherproducts 107.6 111.9 116.4 121.1 147.5 0.036
Total 4 007.9 4 180.5 4 360.5 4 548.3 5 615.7 0.038%
Population (1 000) 6 630 7 012 7 215 7 428 8 681 0.030
Annual average food consumption per capita (kg) 604.5 596.2 604.4 612.3 646.9 0.008
4.3 Food security
Jordan relies heavily on food imports, as shown in Table 4.3. Average annual food production during 1991-1995 was 1.731 million tons, with an annual growth rate of 6 percent. During the same period, food imports reached 2.173 million tons annually (56 percent of the total food consumption), dropping by 1.2 percent annually. From 2006 to 2010, annual food production was 2.635 million tons, with an estimated annual growth rate of 0.7 percent. This decline in the annual growth rate of food production is attributed to climate variations, specifically waves of rain entrapment and drought that negatively affected agricultural production. During this period, 3.466 million tons of food were imported annually (57 percent of annual food consumption), with imports falling 0.1 percent annually. Estimates for 2015 indicate that food production increased to 2.795 million tons per year, and is estimated to grow by 2.3 percent, while food imports will increase to 4.585 million tons per year, thus growing by 4.5 percent annually.
Source: Department of Statistics, FAOSTAT
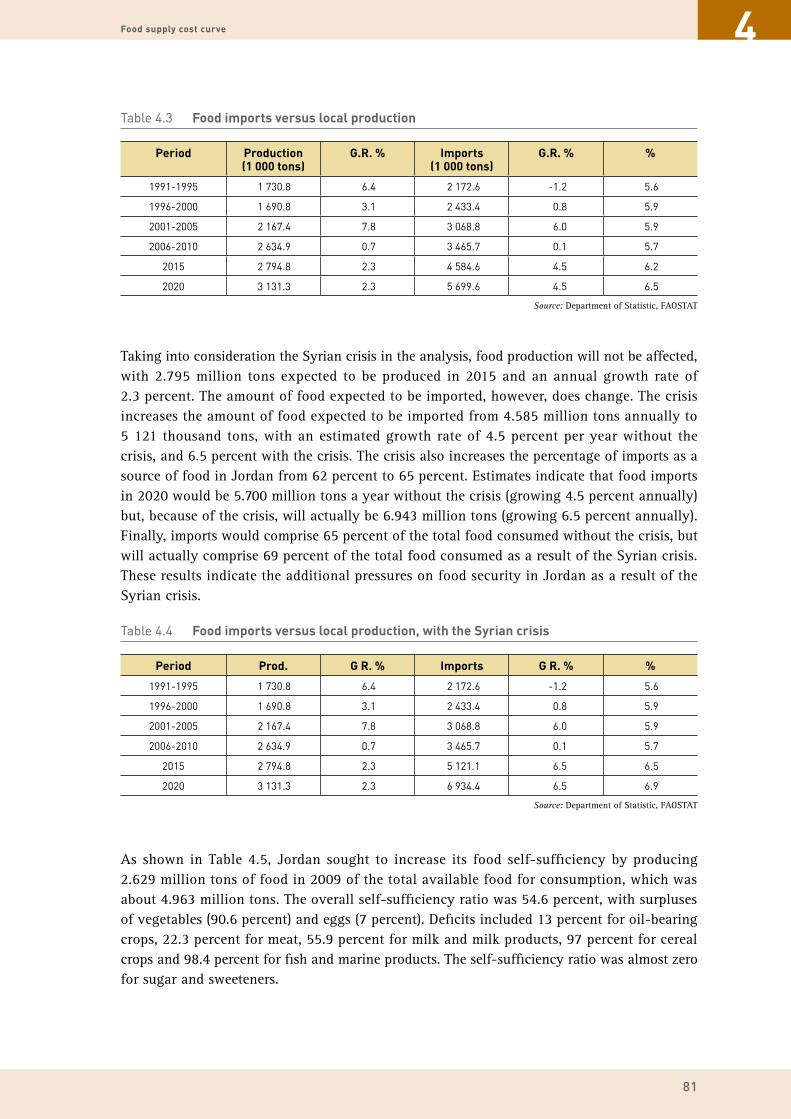
81
Food supply cost curve
Table 4.3 Food imports versus local production
Period Production (1 000 tons)
G.R. % Imports (1 000 tons)
G.R. % %
1991-1995 1 730.8 6.4 2 172.6 -1.2 5.6
1996-2000 1 690.8 3.1 2 433.4 0.8 5.9
2001-2005 2 167.4 7.8 3 068.8 6.0 5.9
2006-2010 2 634.9 0.7 3 465.7 0.1 5.7
2015 2 794.8 2.3 4 584.6 4.5 6.2
2020 3 131.3 2.3 5 699.6 4.5 6.5
Source: Department of Statistic, FAOSTAT
Taking into consideration the Syrian crisis in the analysis, food production will not be affected, with 2.795 million tons expected to be produced in 2015 and an annual growth rate of 2.3 percent. The amount of food expected to be imported, however, does change. The crisis increases the amount of food expected to be imported from 4.585 million tons annually to 5 121 thousand tons, with an estimated growth rate of 4.5 percent per year without the crisis, and 6.5 percent with the crisis. The crisis also increases the percentage of imports as a source of food in Jordan from 62 percent to 65 percent. Estimates indicate that food imports in 2020 would be 5.700 million tons a year without the crisis (growing 4.5 percent annually) but, because of the crisis, will actually be 6.943 million tons (growing 6.5 percent annually). Finally, imports would comprise 65 percent of the total food consumed without the crisis, but will actually comprise 69 percent of the total food consumed as a result of the Syrian crisis. These results indicate the additional pressures on food security in Jordan as a result of the Syrian crisis.
Table 4.4 Food imports versus local production, with the Syrian crisis
Period Prod. G R. % Imports G R. % %
1991-1995 1 730.8 6.4 2 172.6 -1.2 5.6
1996-2000 1 690.8 3.1 2 433.4 0.8 5.9
2001-2005 2 167.4 7.8 3 068.8 6.0 5.9
2006-2010 2 634.9 0.7 3 465.7 0.1 5.7
2015 2 794.8 2.3 5 121.1 6.5 6.5
2020 3 131.3 2.3 6 934.4 6.5 6.9
Source: Department of Statistic, FAOSTAT
As shown in Table 4.5, Jordan sought to increase its food self-sufficiency by producing 2.629 million tons of food in 2009 of the total available food for consumption, which was about 4.963 million tons. The overall self-sufficiency ratio was 54.6 percent, with surpluses of vegetables (90.6 percent) and eggs (7 percent). Deficits included 13 percent for oil-bearing crops, 22.3 percent for meat, 55.9 percent for milk and milk products, 97 percent for cereal crops and 98.4 percent for fish and marine products. The self-sufficiency ratio was almost zero for sugar and sweeteners.

ASSESSMENT OF FOOD SUPPLY UNDER WATER SCARCITY CONDITIONS IN THE NENA REGION APPLYING THE FOOD SUPPLY COST CURVE APPROACH
82
Table 4.5 Production and SSR of food types, 2009 vs. 2012
Item 2009 2012
Prod. Food available for consumption
SSR % Prod. Food available for consumption
SSR %
Vegetables 1 422 746 190.6 1 570.3 954.3 164.5
Eggs 46 43 107.0 61.8 61.8 100.0
Oil crops 141 162 87.0 194.9 223.7 87.1
Fruits 283 358 79.1 234.6 332.9 70.5
Meat 192 247 77.7 305.1 437.7 69.7
Starchy roots 119 197 60.4 141.6 213.9 66.2
Milk 319 590 54.1 310.4 711.7 43.6
Other products 21 69 30.4 42.8 104.47 41.0
Vegetable oils 22 144 15.3 24.6 144.7 17.0
Pulses 2 48 4.2 1.2 29.4 4.1
Cereals 61 2 033 3.0 2 52.6 3.8
Fish and seafood 1 63 1.6 19.2 2 621.6 0.7
Sugar and sweeteners 0 263 0 0.2 334.1 0.1
Total 2 629 4 963 54.6% 2 908.7 6 222.87 51.4%
Source: Department of Statistic, FAOSTAT
In 2012, Jordan produced 2.908 million tons of food, while food available for consumption was about 6.223 million tons, and the average self-sufficiency ratio was 51.4 percent. The table also shows that Jordan achieved a surplus of 64.5 percent in vegetables and covered all its needs for eggs, while maintaining a deficit of 12.9 percent for oil-bearing crops, 30.3 percent for meat, 46.4 percent for milk and milk products, 96.2 percent for cereal crops, 99.3 percent for fish and marine products and 99.9 percent for sugar and sweeteners.
These results indicate that Jordan has reduced its dependence on its own agricultural production by saving food, where the proportion of self-sufficiency fell from 54.6 percent in 2009 to 51.4 percent in 2012, and rates of self-sufficiency decreased for all major food items, particularly cereals, meat, milk and milk products. The results also indicate the seriousness of the impact of the Syrian crisis on food security and self-sufficiency in Jordan. Despite the fact that Jordan’s food production has increased, its self-sufficiency ratio decreased because of increasing consumption resulting from the increase in the number of refugees.
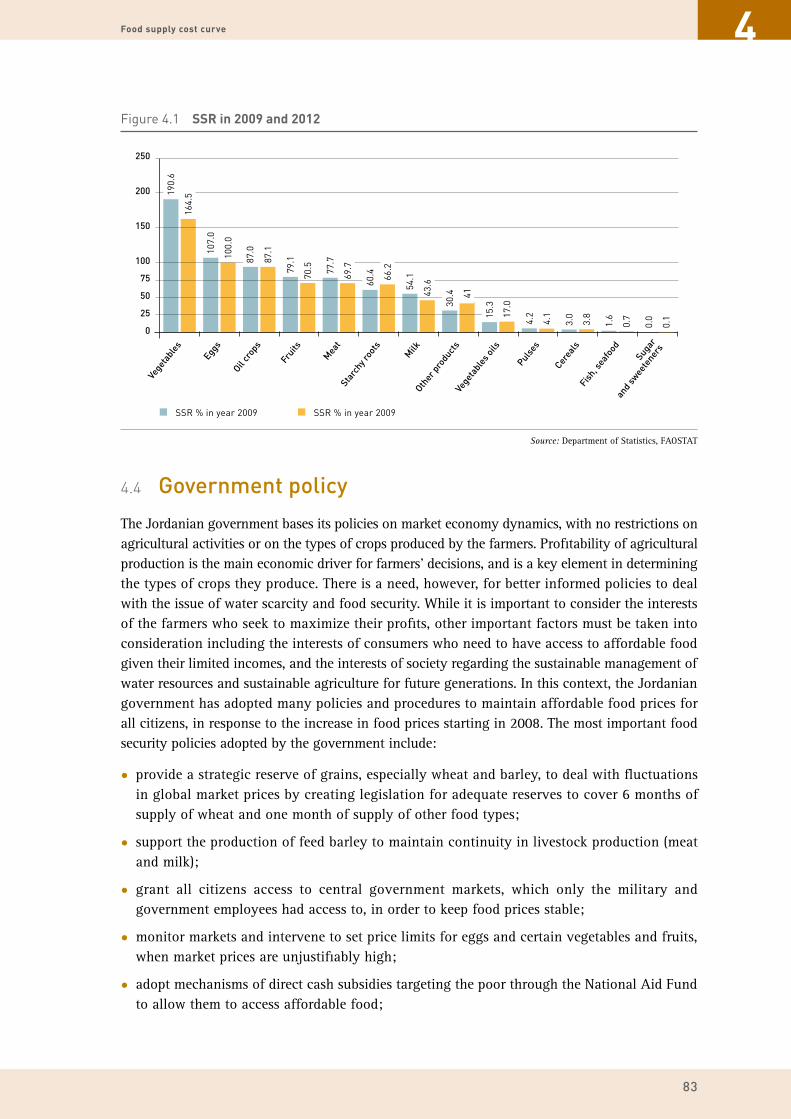
83
Food supply cost curve
4.4 Government policy
The Jordanian government bases its policies on market economy dynamics, with no restrictions on agricultural activities or on the types of crops produced by the farmers. Profitability of agricultural production is the main economic driver for farmers’ decisions, and is a key element in determining the types of crops they produce. There is a need, however, for better informed policies to deal with the issue of water scarcity and food security. While it is important to consider the interests of the farmers who seek to maximize their profits, other important factors must be taken into consideration including the interests of consumers who need to have access to affordable food given their limited incomes, and the interests of society regarding the sustainable management of water resources and sustainable agriculture for future generations. In this context, the Jordanian government has adopted many policies and procedures to maintain affordable food prices for all citizens, in response to the increase in food prices starting in 2008. The most important food security policies adopted by the government include:
• provide a strategic reserve of grains, especially wheat and barley, to deal with fluctuations in global market prices by creating legislation for adequate reserves to cover 6 months of supply of wheat and one month of supply of other food types;
• support the production of feed barley to maintain continuity in livestock production (meat and milk);
• grant all citizens access to central government markets, which only the military and government employees had access to, in order to keep food prices stable;
• monitor markets and intervene to set price limits for eggs and certain vegetables and fruits, when market prices are unjustifiably high;
• adopt mechanisms of direct cash subsidies targeting the poor through the National Aid Fund to allow them to access affordable food;
Figure 4.1 SSR in 2009 and 2012
0
100
75
50
25
200
150
250 Ve
geta
bles
Egg
s
Oil cr
ops
Fruits
Mea
tSta
rchy r
oots
Milk
Other
pro
duct
sVe
geta
bles
oils
Pulses
Cerea
ls
Sugar
and
swee
tener
s
Fish, s
eafo
od
43.6
0.1
0.017
.0
15.3
4.1
4.2
3.8
3.0
0.7
1.6
41
30.4
70.579
.1
69.777
.7
66.2
60.4
54.1
164.
5190.
6
100.
0
107.
0
87.1
87.0
SSR % in year 2009 SSR % in year 2009
Source: Department of Statistics, FAOSTAT

ASSESSMENT OF FOOD SUPPLY UNDER WATER SCARCITY CONDITIONS IN THE NENA REGION APPLYING THE FOOD SUPPLY COST CURVE APPROACH
84
• modify tax policies by exempting production inputs from customs duties and general sales tax;
• establish and expand water harvesting to provide water for irrigation and livestock production;
• support the adoption of modern technologies in agriculture, especially those designed to reduce production costs and increase production, including sustainable irrigation and fertilization practices.
Jordan has also adopted strategic planning to cope with the food crisis, as outlined in the 2002 2010 Agricultural Strategy and the 2009 2013 Agricultural Strategic Document. Both documents identify food security and price stability as priority goals, while establishing a group of policies that support the implementation of different projects to increase the country’s agricultural area. Furthermore, the Jordanian government has been working on the 2014–2023 National Agricultural Development Strategy that gives special attention to food security and water scarcity. The strategy was developed with the support of international organizations and addresses the role of different ministries concerned with food security. It covers the following objectives:
• ensure food availability by supporting sufficient, definite, reliable and sustainable means of food production;
• ensure food accessibility, taking into account ease of distribution and access for all segments of Jordanian society, including marginalized groups, groups with special needs, and children;
• ensure food variety, with suitable quality, quantity and availability at all times, to supply needed nutrients for health and growth for all, taking into account the needs of the marginalized groups and their particular diets;
• respect diversity in terms of food-related needs and customs of all segments of society (Receptivity, Acceptability) in food distribution and food security systems;
• ensure sufficiency and continuity (Adequacy) through a sustainable food system that is democratic and just in terms of production, distribution, consumption and waste management;
• develop policies and regulations (Agency) that include enablers that ensure food security.
The ministries of health and agriculture, in collaboration with the World Health Organization, are also preparing a national nutrition strategy, which includes the following objectives:
• integrate healthy nutrition goals within national economic, social and other development programmes;
• ensure adequate food and nutrition for all segments of the population, at affordable prices, through means to increase production and improve standards of living, taking into consideration the role of women as producers and consumers of food at the household level;
• strengthen food safety monitoring systems and improve the quality of nutrition through evidence and legislation;
• improve food quality standards for the marginalized poor, displaced populations and those with special therapeutic dietary needs;

85
Food supply cost curve
• provide for training and institutional capacity building in the field of food and nutrition;
• enhance nutrition awareness and education.
Strategic food production projects have been implemented, including agricultural land reclamation projects in the highlands, which since they began in 1964, have increased the land area cultivated with fruits. In addition, the110 km-long King Abdullah Canal was built, which provides irrigation water to about 35 360 ha in the Jordan Valley, increasing the land area planted with vegetables and fruits. Finally, the Agricultural Credit Corporation funded the expansion of irrigated agriculture using groundwater wells, which provided water for irrigation and the reclamation of 42 000 ha for vegetable and fruit cultivation.
As shown in Table 4.6, Jordan’s total irrigated agricultural area increased by 55 percent, from 66 600 ha in 1994 to 103 400 ha in 2013. In the Jordan Valley, irrigated agricultural area increased 18 percent, from 27 500 ha in 1994 to 32 300 ha in 2013. In the upland areas, there was a 96 percent increase, from 36 200 ha in 1994 to 71 000 ha in 2013.
Table 4.6 Irrigated area by tree crops, field crops and vegetable crops (ha), 1994 and 2013
Item 1994 2013 Change in total
%Jordan Valley
Upland Total Jordan Valley
Upland Total
Tree crops 8 053 14 357 22 410 8 838 36 257 45 095 101
Field crops 4 214 6 831 13 927 2 602 8 512 11 113 -20
Vegetables 15 243 15 023 30 267 20 940 26 295 47 235 56
Total 27 510 36 211 66 603 32 380 71 063 103 443 55%
Source: Department of Statistics
Figure 4.2 Irrigated area in 1994 and 2013 (ha)
Vegetables Tree crops Field crops
(45.44%)
(20.92%)
13 927
30 267
(33.64%)
22 410
1994 2013
11 113
47 235
(45.66%)
(43.59%)
(10.75%)
45 095
Source: Department of Statistics, FAOSTAT

ASSESSMENT OF FOOD SUPPLY UNDER WATER SCARCITY CONDITIONS IN THE NENA REGION APPLYING THE FOOD SUPPLY COST CURVE APPROACH
86
4.5 Value of water in the agricultural sector
The value of water in the agricultural sector is the value of the net revenue of production after deducting all costs except the cost of water. This approach expresses the price that the farmer pays for water after covering all other production costs. This methodology is called water balance for agricultural crops. The approach is sometimes categorized as a farm crop budgeting technique when applied to agriculture. A difficulty is that the residual return (after deducting the costs of all measured non-water inputs) includes water plus all unmeasured inputs, and hence will result in an overvaluation of water. The approach is also extremely sensitive to small variations in assumptions concerning the nature of the production function or prices, factors that can vary considerably each year. Furthermore, the approach assumes homogeneity in land, crops, husbandry, quality of produce and price between irrigated and non-irrigated production. The fact that these elements are heterogeneous brings into question the use of the difference in net returns as net willingness to pay for irrigation water. Therefore, in our analysis, the crops are disaggregated according to crop group (field crops, vegetables and fruit trees) and further disaggregated by location and production season.
4.6 Irrigation development in Jordan
According to the Department of Statistics, the total cultivated area in Jordan was 260 000 ha in 2013, with 228 300 ha in the highlands (88 percent) and 32 600 ha in the Jordan Valley (12 percent). Total rain-fed land is estimated at 160 000 ha, 100 000 of which is used for rain fed agriculture. As for agricultural production, total agricultural production is estimated at 2.6 million tons, with areas of the Jordan Valley producing about 1.13 million tons (43 percent) and the highlands producing 1.5 million tons (57 percent).
From 1994 to 2013, the total irrigated area increased from 66 600 ha to 100 000 ha. The main increase was in the highlands. Due to this increase, there was excessive abstraction of groundwater from different aquifers, resulting in the decline of groundwater levels and the degradation of water quality in some aquifers. In 1992, the government prohibited the drilling of wells for agriculture to reduce abstractions from the depleting groundwater resources. In the immediate future, the MWI will take other measures and actions to help remedy the issue of groundwater depletion. This will include closing some of the licensed wells and changing irrigation water pricing policy.
Table 4.7 Area and production of field crops by type of agriculture, 2013
Type of agriculture
Area (1 000 ha) Production (1 000 tons)
JV HL JOR % JV HL JOR %
Rain-fed 0.23 157.27 157.5 60.4 3.9 504.5 508.4 19.3
Irrigation 32.38 71.06 103.44 39.6 1 127.9 1 001 2 128.9 80.7
Total 32.61 228.33 260.94 100% 1 131.8 1 505.5 2 637.3 100%
Percent 12.5% 87.5% 100% 42.9% 57.1% 100%
Source: Department of Statistics

87
Food supply cost curve
The total agricultural production in 2013 is estimated at 2.6 million tons. Irrigated agriculture contributed about 80.7 percent, while rain-fed agriculture contributed 19.3 percent, despite the fact that the land area of rain-fed agriculture constitutes 60 percent of the total agricultural area. Rain-fed agriculture includes the cultivation of olive trees as well as field crops such as wheat and barley. As for irrigated agriculture, cultivation includes a wide variety of agricultural crops such as winter vegetables, summer vegetables, fruits and some field crops.
Table 4.8 Cropped area and production by crop type, 2013
Item Area (1 000 ha) Production (1 000 tons)
Irrigated Non-irrigated
Total Irrigated Non-irrigated
Total
Jordan Valley 1 422 746 190.6 1 570.3 954.3 164.5
Tree crops 8.84 0.02 8.86 161 0.4 161.4
Field crops 2.60 0.21 2.81 41.9 3.4 45.3
Vegetables, winter 13.83 0.004 13.84 690.2 0.2 690.4
Vegetables, summer 7.11 0 7.11 234.8 0 234.8
Total 32.38 2.34 32.61 1 127.9 4 1 131.9
Percent 99% 1% 100% 99.5% 0.5% 100%
Upland 21 69 30.4 42.8 104.47 41.0
Tree crops 36.26 38.49 74.75 134.1 142.3 276.4
Field crops 8.51 116.48 124.99 21.0 288.0 309.0
Vegetables, winter 7.91 0 7.91 234.5 0 234.5
Vegetables, summer 18.38 2.3 20.68 609.2 76.4 685.6
Total 71.06 157.27 228.33 998.8 506.7 1 505.5
Percent 29% 71% 100% 94% 6% 100%
National totals
Tree crops 45.09 38.51 83.60 295.1 142.7 437.8
Field crops 11.11 116.69 127.80 62.9 291.4 354.3
Vegetables, winter 21.74 0.004 21.75 924.7 0.2 924.9
Vegetables. summer 25.49 2.3 27.79 844 76.4 920.4
Total 103.44 157.504 260.95 2 126.7 510.7 2 637.4
Percent 40% 60% 100% 95% 5% 100%
Source: Department of Statistics
4.7 Irrigation water used for agricultural crops
A total of 613 MCM of irrigation water was used in the country in 2013 (calculated for this study based on the water needs of the crops grown). Fifty-seven percent of the water (347 MCM) was used to irrigate fruit trees, 28 percent (171 MCM) was used to irrigate vegetables (84 MCM for summer vegetables and 87 MCM for winter vegetables) and 15 percent (94 MCM) was used to irrigate field crops. Thirty-four percent of irrigation water was used to irrigate crops in the Jordan Valley and the remaining 66 percent was used in the highlands. Data indicates that the

ASSESSMENT OF FOOD SUPPLY UNDER WATER SCARCITY CONDITIONS IN THE NENA REGION APPLYING THE FOOD SUPPLY COST CURVE APPROACH
88
amount of irrigation water used in 2013 is estimated at 415 MCM, whereas farmers actually used about 613 MCM of irrigation water. These results indicate the illegal use of approximately 198 MCM of water for irrigation.
Table 4.9 Area and water use in irrigated crops, 2013
2013 Area (thousand ha) Water use (MCM) Percent of water use
JV UL JOR JV UL JOR
Field crops 2.6 8.53 11.13 16.4 78.1 94.5 15%
Vegetables, winter 13.835 7.912 21.747 54.54 32.28 86.83 14%
Vegetables, summer 7.109 18.383 25.493 23.575 60.805 84.38 14%
Fruits 8.872 36.257 45.129 112.67 234.66 347.33 57%
Total 32.416 71.082 103.499 207.185 405.845 613.04 100%
Percent 31% 69% 100% 34% 66% 100%
Source: Department of Statistics Water use calculated by experts.
4.8 Value of water for field crops
4.8.1. Water use for field crop irrigation
Irrigated field crops are cultivated on a small scale in Jordan, with a total area of 11 100 ha in 2013 consuming about 94.5 MCM of water for irrigation. Table 4.10 shows that 17 percent of the irrigation water was used in the Jordan Valley while the remaining 83 percent was used in the highlands. The table also shows that 68 percent of the water was used to irrigate field crops such as clover and trifoliate, 17 percent was used to irrigate wheat crops and about 6 percent was used for sorghum, with the rest being used for a variety of other crops.
Cultivation of vegetables in greenhouses.©FAO/Roberto Faidutti

89
Food supply cost curve
Table 4.10 Area and water use in irrigated field crops, 2013
Area (thousand ha) Water use (MCM) Percent of water use
JV UL JOR JV UL JOR
Wheat 1.209 2.602 3.811 5.200 11.19 16.39 17.34%
Barley 0.151 0.151 0.452 0.45 0.48%
Lentils
Vetch
Chickpeas 0.065 0.065 0.324 0.32 0.34%
Maize 0.715 0.064 0.779 5.360 0.48 5.84 6.18%
Sorghum 0.119 0.882 1.001 0.713 5.29 6.00 6.35%
Broom millet
Tobacco, local
Garlic 0.010 0.012 0.022 0.030 0.04 0.07 0.07%
Vetch, common 0.00 0.01 0.010
Sesame
Clover, trifoliate 0.332 4.624 4.956 4.316 60.11 64.43 68.16%
Alfalfa
Others 0.002 0.338 0.340 0.005 1.01 1.01 1.07%
Total field crops 2.602 8.532 11.134 16.400 78.12 94.52 100.00%
Percent 23.40% 76.6% 100.00% 17.400% 82.60% 100.00%
Source: Department of Statistics Water use calculated by experts
4.8.2. Value of water in field crops
In the Jordan Valley, the water value (USD/m3) for irrigated crops in 2013 ranged between USD 6.20 for garlic and about USD 0.31 for chickpeas. For other crops, the water value was more than USD 0.71 for clover, trifoliate, maize and sorghum, and less than USD 0.71 for the remaining field crops. The yield per cubic meter in the highlands ranged between USD 6.10 for garlic and about USD 0.13 for wheat. For other crops in the highlands, the water value was more than USD 0.71 for clover, trifoliate and sorghum, and less than USD 0.71 for the remaining field crops. As shown in the following table, the weighted average yield per cubic meter of water for irrigation of garlic, clover, trifoliate, maize and sorghum was USD 1.41/m3, and less than USD 0.71/m3 for the remaining field crops.

ASSESSMENT OF FOOD SUPPLY UNDER WATER SCARCITY CONDITIONS IN THE NENA REGION APPLYING THE FOOD SUPPLY COST CURVE APPROACH
90
Table 4.11 Computed water values (USD/m3) for field crops in different regions in Jordan, 2013
2013 Crop
JV water use
(MCM)
JV.FUSD/m3
UL water use
(MCM)
HLL.FUSD/m3
National water use
(MCM)
Weighted average USD/m3
Wheat 5.20 0.65 12.64 0.13 17.842 0.27
Barley 0.45 0.32 0.00 0.00 0.452 0.32
Lentils 0.00 0.00 0.00 0.00 0.000 0.00
Vetch 0.00 0.00 0.00 0.00 0.000 0.00
Chickpeas 0.32 0.31 0.00 0.00 0.324 0.31
Maize 5.36 0.88 0.40 0.31 5.762 0.83
Sorghum 0.71 1.03 5.29 0.85 6.005 0.88
Broom millet 0.00 0.00 0.00 0.00 0.000 0.00
Tobacco, local 0.00 0.00 0.00 0.00 0.000 0.00
Garlic 0.03 6.23 0.04 6.07 0.066 6.14
Sesame 0.00 0.00 0.00 0.00 0.000 0.00
Vetch, common 0.00 0.00 0.00 0.00 0.000 0.00
Clover, trifoliate 4.32 1.81 60.11 1.23 64.427 1.27
Alfalfa 0.00 0.00 0.00 0.00 0.000 0.00
Others 0.00 0.13 0.00 0.00 0.005 0.13
Total 16.40 0.00 78.48 0.00 94.882 0.00
Percentage 0.17% 0.00% 0.83% 0.00% 1.000% 0.00%
Weighted average 5.81 3.46 3.81
Figure 4.3 Water values in the highlands and JV field crops, 2013
Garlic
0
1
2
4
6
5
3
7
Clove
r, tri
folia
te
Sorgh
um
Mai
ze
Whea
t
Other
s
Chickpe
as
Barle
y
Weighted average USD/cm JV land USD/cmH land USD/cm
Source: Department of Statistics, FAOSTAT
Source: Department of Statistics, FAOSTAT

91
Food supply cost curve
4.9 Value of water for winter vegetables
4.9.1. Water use for irrigation of winter vegetables
In 2013, the total irrigated area of winter vegetables was about 21 700 ha, which consumed about 87 MCM of water. As shown in Table 4.12, 63 percent of the irrigation water for winter vegetables was consumed in the Jordan Valley and 37 percent was consumed in the highlands. Thirty-eight percent of the water for winter vegetables was used to irrigate tomatoes, 10 percent was used for potatoes, 7.6 percent for eggplant, 7.4 percent for squash, 6.9 percent for broad beans and about 5.6 percent for cucumber. The remaining water was used for other crops such as cauliflower, sweet peppers, hot peppers, okra, lettuce and others.
Table 4.12 Area and water use for irrigated winter vegetables, 2013
2012 VW Area (thousand ha) Water use (MCM) Percent of water use
JV HL JOR JV HL JOR
Tomatoes 4.654 2.615 7.269 21.17 11.90 33.07 38.09
Squash 1.409 0.130 1.539 5.92 0.55 6.46 7.45
Eggplants 1.823 0.003 1.826 6.56 0.01 6.57 7.57
Cucumber 1.169 0.189 1.358 4.21 0.68 4.89 5.63
Potato 1.598 0.909 2.507 5.51 3.14 8.65 9.96
Cabbage 0.298 0.089 0.387 1.24 0.37 1.61 1.85
Cauliflower 0.224 0.887 1.110 0.94 3.72 4.66 5.37
Hot pepper 0.312 0.004 0.316 1.00 0.01 1.01 1.17
Sweet pepper 0.594 0.047 0.641 2.05 0.16 2.21 2.55
Broad beans 0.417 1.173 1.590 1.58 4.46 6.04 6.96
String beans 0.181 0.004 0.185 0.67 0.02 0.68 0.79
Peas 0.007 0.081 0.088 0.04 0.48 0.52 0.60
Cowpeas 0.002 0.00 0.002 0.00 0.00 0.00 0.00
Jew's mallow 0.002 0.00 0.002 0.00 0.00 0.00 0.00
Okra 0.002 0.00 0.002 0.01 0.00 0.01 0.01
Lettuce 0.544 0.188 0.731 1.44 0.50 1.94 2.23
Sweet melon 0.006 0.00 0.006 0.00 0.00 0.00 0.00
Watermelon 0.001 0.030 0.031 0.00 0.11 0.11 0.12
Spinach 0.005 0.010 0.015 0.01 0.02 0.04 0.04
Onion, green 0.065 0.310 0.375 0.27 1.30 1.57 1.81
Onion, dry 0.127 0.399 0.526 0.65 2.04 2.68 3.09
Snake cucumber 0.001 0.003 0.004 0.00 0.01 0.01 0.01
Turnip 0.004 0.000 0.004 0.01 0.00 0.01 0.01
Carrot 0.095 0.045 0.140 0.25 0.12 0.36 0.42
Parsley 0.089 0.243 0.332 0.28 0.78 1.06 1.22
Radish 0.015 0.008 0.023 0.04 0.02 0.07 0.08
Others 0.194 0.544 0.738 0.68 1.90 2.58 2.98
Total winter vegetables 13.835 7.912 21.747 54.54 32.28 86.83 100.00%
Percent 64% 36% 100% 63% 37% 100%
Source: Department of Statistics. Water use calculated by authors.

ASSESSMENT OF FOOD SUPPLY UNDER WATER SCARCITY CONDITIONS IN THE NENA REGION APPLYING THE FOOD SUPPLY COST CURVE APPROACH
92
4.9.2. Value of water for winter vegetables
In 2013, the value per cubic meter of irrigation water in the Jordan Valley was approximately USD 9.50 for cucumbers, USD 7.90 for carrots, USD 7.60 for string beans and USD 7.20 for tomatoes. The value per cubic meter for other winter vegetables in the Jordan Valley was between USD 1.41 and USD 7.10.
In the highlands, the value per cubic meter of irrigation water was about USD 8.10 for cucumbers, USD 6.40 for carrots, USD 6.20 for sweet peppers and about USD 6.10 for potatoes. The value per cubic meter for other winter vegetables in the highlands was between USD 1.41 and USD 5.70.
The weighted average yield per cubic meter of water for irrigation in Jordan, as shown in the table below, was USD 9.30 for cucumbers and about USD 0.96 for parsley, whereas the value of a cubic meter of water for irrigation was more than USD 5.65 for cucumbers, tomatoes, potatoes, hot peppers, sweet pepper, string beans, okra and carrots, and less than USD 5.65 for the other winter vegetables.
Table 4.13 Water values (USD/m3) for winter vegetables, 2013
2013Crop
JV water use
(MCM)
JV.FUSD/m3
HL water use
(MCM)
HL.FUSD/m3
JOR water use
(MCM)
Weighted average USD/m3
Tomatoes 21.17 7.26 11.90 3.97 33.072 6.07
Squash 5.92 2.91 0.55 3.54 6.465 2.95
Eggplants 6.56 3.11 0.01 4.11 6.572 3.11
Cucumber 4.21 9.49 0.68 8.01 4.887 9.28
Potato 5.51 6.79 3.14 6.09 8.648 6.54
Cabbage 1.24 2.16 0.37 2.05 1.606 2.13
Cauliflower 0.94 2.15 3.72 1.74 4.663 1.82
Hot pepper 1.00 6.58 0.01 3.77 1.012 6.54
Sweet pepper 2.05 6.23 0.16 6.23 2.213 6.23
Broad beans 1.58 4.39 4.46 2.33 6.041 2.87
String beans 0.67 7.58 0.02 4.59 0.685 7.51
Peas 0.04 2.67 0.48 4.13 0.518 4.01
Cowpeas 0.00 0.00 0.00 0.00 0.000 0.00
Jew's mallow 0.00 0.00 0.00 0.00 0.000 0.00
Okra 0.01 6.47 0.00 0.00 0.008 6.47
Lettuce 1.44 3.33 0.50 3.04 1.938 3.25
Sweet melon 0.00 0.00 0.00 0.00 0.000 0.00
Watermelon 0.00 5.44 0.11 4.71 0.107 4.72
Spinach 0.01 3.38 0.02 2.62 0.038 2.90
Onion, green 0.27 4.62 1.30 0.93 1.573 1.57
Onion, dry 0.65 2.57 2.04 1.49 2.682 1.75
Snake cucumber 0.00 5.28 0.01 3.48 0.009 3.87
Turnip 0.01 3.40 0.00 0.00 0.011 3.40
Carrot 0.25 7.97 0.12 6.37 0.364 7.46
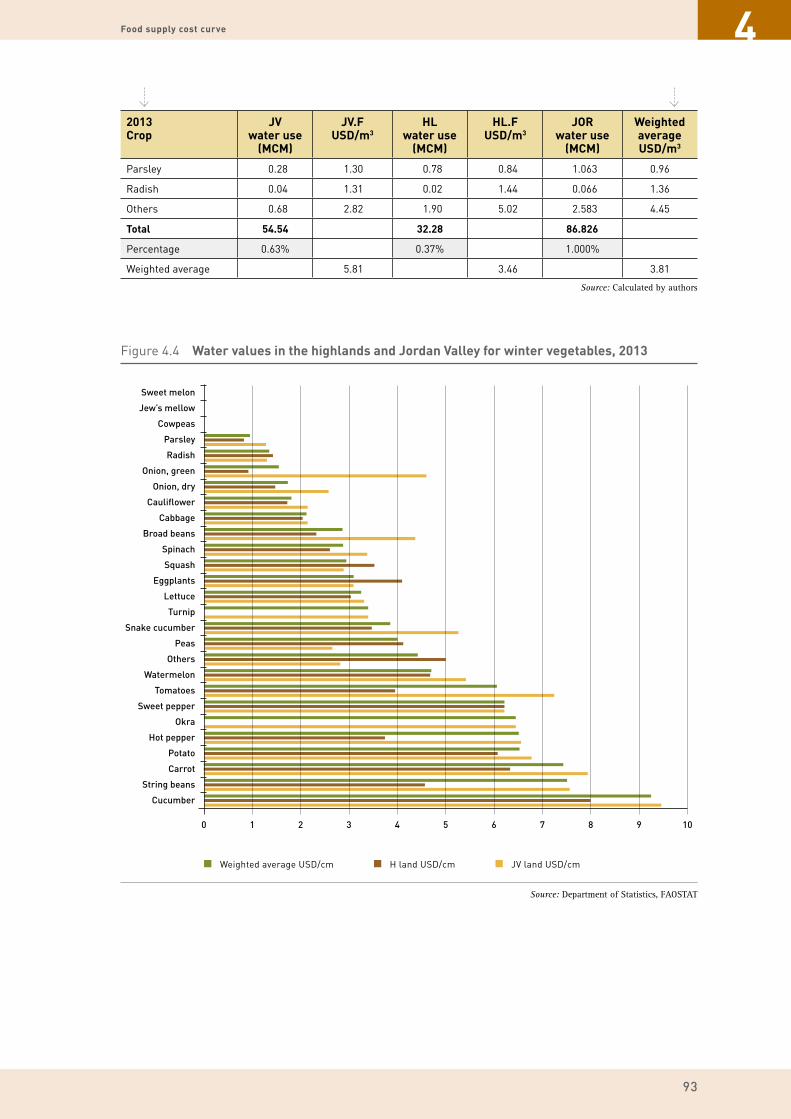
93
Food supply cost curve
Table 4.13 Water values (USD/m3) for winter vegetables, 2013
2013Crop
JV water use
(MCM)
JV.FUSD/m3
HL water use
(MCM)
HL.FUSD/m3
JOR water use
(MCM)
Weighted average USD/m3
Parsley 0.28 1.30 0.78 0.84 1.063 0.96
Radish 0.04 1.31 0.02 1.44 0.066 1.36
Others 0.68 2.82 1.90 5.02 2.583 4.45
Total 54.54 32.28 86.826
Percentage 0.63% 0.37% 1.000%
Weighted average 5.81 3.46 3.81
Source: Calculated by authors
Figure 4.4 Water values in the highlands and Jordan Valley for winter vegetables, 2013
Sweet melon
Jew’s mellow
Cowpeas
Parsley
Radish
Onion, green
Onion, dry
Cauliflower
Cabbage
Broad beans
Spinach
Squash
Eggplants
Lettuce
Turnip
Snake cucumber
Peas
Others
Watermelon
Tomatoes
Sweet pepper
Okra
Hot pepper
Potato
Carrot
String beans
Cucumber
7 8 1096543210
Weighted average USD/cm JV land USD/cmH land USD/cm
Source: Department of Statistics, FAOSTAT

ASSESSMENT OF FOOD SUPPLY UNDER WATER SCARCITY CONDITIONS IN THE NENA REGION APPLYING THE FOOD SUPPLY COST CURVE APPROACH
94
4.10 Value of water for summer vegetables
4.10.1.Water use for summer vegetable irrigation
The total irrigated area planted with summer vegetables is about 25.5 thousand ha, consuming just over 84 MCM of irrigation water. As indicated in Table 4.14, in 2013 the Jordan Valley consumed 22 percent of the irrigation water for summer vegetables, while 78 percent was consumed in the highlands. Thirty-three percent of the water used to irrigate summer vegetables was used to irrigate tomatoes, 11 percent was used for watermelon, 7 percent for eggplants, 5.8 percent for cucumber, 5.3 percent for sweet melons, 5.3 percent for cauliflower, and about 5.2 percent for Jew’s mallow. The rest of the irrigation water was used for other crops such as squash, cucumbers, okra and lettuce.
A demonstration by an extension worker showing women farmers how to prune olive trees. ©FAO/Jon Spaull

95
Food supply cost curve
Table 4.14 Area and water use for irrigated summer vegetables, 2013
Crop Area (1 000 ha) Water use (MCM) Percent of water use
JV HL JOR JV HL JOR
Tomatoes 0.869 6.844 7.714 3.172 24.982 28.154 33.37
Squash 0.752 0.796 1.548 1.766 1.871 3.637 4.31
Eggplants 1.371 0.574 1.945 4.251 1.780 6.030 7.15
Cucumber 0.138 1.408 1.546 0.442 4.505 4.947 5.86
Potato 0.449 0.448 0.896 1.480 1.477 2.957 3.50
Cabbage 0.057 0.124 0.180 0.170 0.371 0.541 0.64
Cauliflower 0.051 1.729 1.779 0.126 4.322 4.448 5.27
Hot pepper 0.142 0.245 0.387 0.405 0.698 1.102 1.31
Sweet pepper 0.237 0.470 0.707 0.984 1.949 2.933 3.48
Broad beans 0.018 0.048 0.065 0.063 0.172 0.235 0.28
String beans 0.179 0.268 0.447 0.465 0.698 1.163 1.38
Peas 0.004 0.032 0.036 0.012 0.109 0.121 0.14
Cowpeas 0.026 0.023 0.049 0.066 0.057 0.122 0.15
Jew's mallow 1.172 0.003 1.175 4.394 0.011 4.405 5.22
Okra 0.491 0.045 0.536 1.866 0.169 2.035 2.41
Lettuce 0.180 1.071 1.251 0.424 2.516 2.940 3.48
Sweet melon 0.524 0.781 1.304 1.938 2.889 4.827 5.72
Watermelon 0.239 2.514 2.753 0.837 8.825 9.663 11.45
Spinach 0.002 0.005 0.007 0.004 0.009 0.014 0.02
Onion, green 0.007 0.052 0.059 0.028 0.218 0.246 0.29
Onion, dry 0.037 0.030 0.067 0.137 0.110 0.246 0.29
Snake cucumber 0.057 0.048 0.104 0.142 0.119 0.261 0.31
Turnip 0.001 0.047 0.049 0.003 0.123 0.127 0.15
Carrot 0.005 0.00 0.005 0.013 0.000 0.013 0.01
Parsley 0.004 0.122 0.126 0.011 0.304 0.315 0.37
Radish 0.006 0.013 0.018 0.015 0.035 0.050 0.06
Others 0.094 0.646 0.740 0.362 2.487 2.849 3.38
Total summer vegetables 7.109 18.383 25.493 23.575 60.805 84.380 100.00%
Percent 28% 0.72 97% 22% 78% 100%
Source: Department of Statistics. Water use calculated by authors.
4.10.2.Value of water for summer vegetables
The value per cubic meter of irrigation water in the Jordan Valley for summer vegetables was USD 12.30 for spinach; USD 0.13 for radish; more than USD 7.10 for string beans, spinach, carrot, cowpeas, cucumber, okra and tomatoes; and less than USD 7.10 for other summer vegetables. In the highlands, the value per m3 of irrigation water was USD 12.10 for string beans; USD 1.30 for radish; more than USD 7.10 for spinach, cucumber and peas; and less than USD 7.10 for other crops.

ASSESSMENT OF FOOD SUPPLY UNDER WATER SCARCITY CONDITIONS IN THE NENA REGION APPLYING THE FOOD SUPPLY COST CURVE APPROACH
96
The weighted average per cubic meter of irrigation water in Jordan, as shown in Table 4.15, was USD 11.70 for string beans; USD 1.30 for radish; more than USD 7.10 spinach, carrot, cowpeas, cucumber and peas; and less than USD 7.10 for the other summer vegetable crops.
Table 4.15 Water values (USD/m3) for summer vegetables, 2013
2013Crop
JV water use
(MCM)
JV.FUSD/m3
HL water use
(MCM)
HL.FUSD/m3
JOR water use
(MCM)
Weighted average USD/m3
Tomatoes 3.17 9.22 24.98 4.72 28.154 5.23
Squash 1.77 5.42 1.87 5.42 3.637 5.42
Eggplants 4.25 4.39 1.78 6.52 6.030 5.01
Cucumber 0.44 11.34 4.50 8.10 4.947 8.39
Potato 1.48 5.47 1.48 6.05 2.957 5.76
Cabbage 0.17 4.04 0.37 3.82 0.541 3.88
Cauliflower 0.13 5.13 4.32 3.79 4.448 3.83
Hot pepper 0.40 6.17 0.70 3.71 1.102 4.62
Sweet pepper 0.98 3.63 1.95 2.97 2.933 3.19
Broad beans 0.06 2.43 0.17 2.06 0.235 2.16
String beans 0.47 11.40 0.70 12.10 1.163 11.82
Peas 0.01 5.14 0.11 8.63 0.121 8.29
Cowpeas 0.07 12.10 0.06 5.37 0.122 8.98
Jew's mallow 4.39 2.09 0.01 1.96 4.405 2.09
Okra 1.87 8.77 0.17 3.80 2.035 8.35
Lettuce 0.42 3.83 2.52 2.73 2.940 2.88
Sweet melon 1.94 3.16 2.89 4.62 4.827 4.04
Watermelon 0.84 3.43 8.83 2.51 9.663 2.60
Spinach 0.00 12.37 0.01 10.83 0.014 11.30
Onion, green 0.03 5.00 0.22 2.97 0.246 3.21
Onion, dry 0.14 3.59 0.11 2.42 0.246 3.06
Snake cucumber 0.14 3.49 0.12 2.81 0.261 3.18
Turnip 0.00 6.45 0.12 4.10 0.127 4.17
Carrot 0.01 10.03 0.00 0.00 0.013 10.03
Parsley 0.01 2.74 0.30 1.57 0.315 1.61
Radish 0.01 1.30 0.03 1.28 0.050 1.29
Others 0.36 3.22 2.49 3.33 2.849 3.32
Total 23.57 60.81 84.380
Percentage 0.28 0.72 1.000
Weighted average 5.23 4.52 4.72
Source: Calculated by authors

97
Food supply cost curve
4.11 Value of water for fruit production
4.11.1.Water use for fruit tree irrigation
In 2013, the total irrigated area planted with fruits was about 45 100 ha and consumed just over 347 MCM of water. As indicated in Table 4.16, the Jordan Valley consumed 32 percent of the irrigation water to irrigate fruit trees, while the highlands consumed 68 percent. Data also shows that 41 percent of the water resources were used to irrigate fruit trees, especially olive trees, while 8 percent was used to irrigate dates, 5.5 percent to irrigate lemon trees and 5.9 percent to irrigate apple trees. The value per cubic meter of irrigation water for the other fruit trees was less than USD 7.10.
Figure 4.5 Water values in the highlands and Jordan Valley for summer vegetables, 2013
Sweet melon
Jew’s mellow
Cowpeas
Parsley
Radish
Onion, green
Onion, dry
Cauliflower
Cabbage
Broad beans
Spinach
Squash
Eggplants
Lettuce
Turnip
Snake cucumber
Peas
Others
Watermelon
Tomatoes
Sweet pepper
Okra
Hot pepper
Potato
Carrot
String beans
Cucumber
8 10 14126420
Weighted average USD/cm JV land USD/cmH land USD/cm
Source: Department of Statistics, FAOSTAT
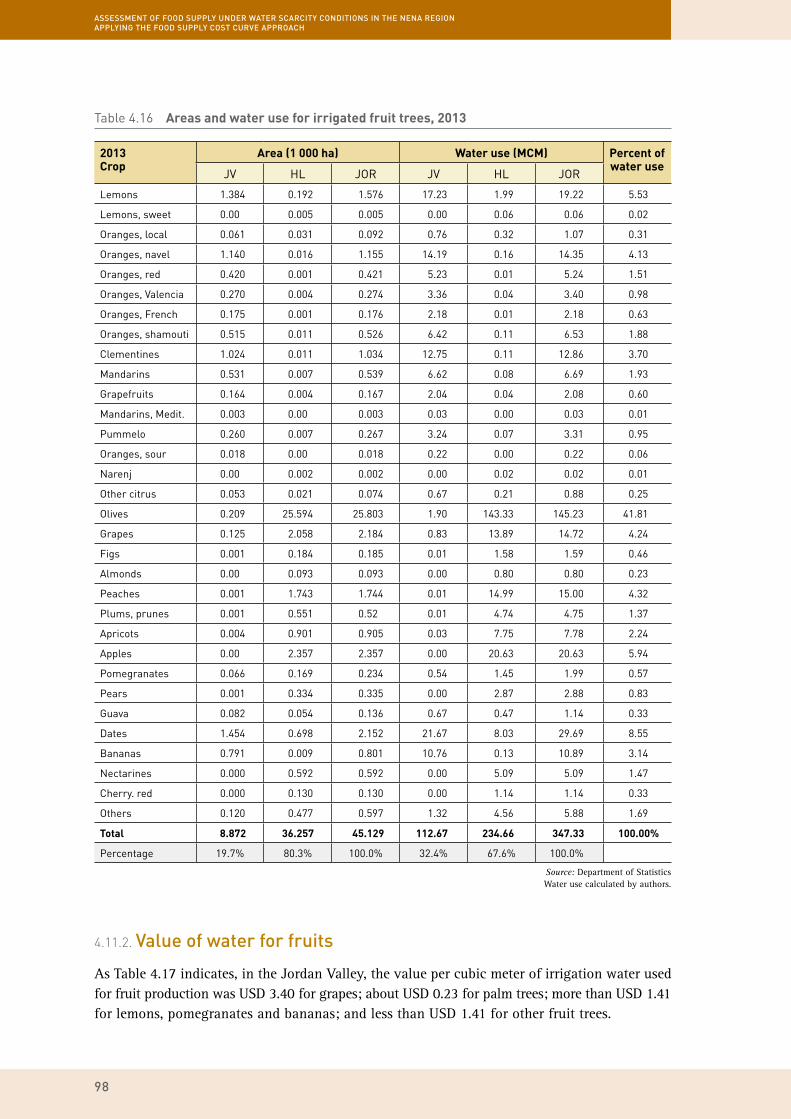
ASSESSMENT OF FOOD SUPPLY UNDER WATER SCARCITY CONDITIONS IN THE NENA REGION APPLYING THE FOOD SUPPLY COST CURVE APPROACH
98
Table 4.16 Areas and water use for irrigated fruit trees, 2013
2013Crop
Area (1 000 ha) Water use (MCM) Percent of water use
JV HL JOR JV HL JOR
Lemons 1.384 0.192 1.576 17.23 1.99 19.22 5.53
Lemons, sweet 0.00 0.005 0.005 0.00 0.06 0.06 0.02
Oranges, local 0.061 0.031 0.092 0.76 0.32 1.07 0.31
Oranges, navel 1.140 0.016 1.155 14.19 0.16 14.35 4.13
Oranges, red 0.420 0.001 0.421 5.23 0.01 5.24 1.51
Oranges, Valencia 0.270 0.004 0.274 3.36 0.04 3.40 0.98
Oranges, French 0.175 0.001 0.176 2.18 0.01 2.18 0.63
Oranges, shamouti 0.515 0.011 0.526 6.42 0.11 6.53 1.88
Clementines 1.024 0.011 1.034 12.75 0.11 12.86 3.70
Mandarins 0.531 0.007 0.539 6.62 0.08 6.69 1.93
Grapefruits 0.164 0.004 0.167 2.04 0.04 2.08 0.60
Mandarins, Medit. 0.003 0.00 0.003 0.03 0.00 0.03 0.01
Pummelo 0.260 0.007 0.267 3.24 0.07 3.31 0.95
Oranges, sour 0.018 0.00 0.018 0.22 0.00 0.22 0.06
Narenj 0.00 0.002 0.002 0.00 0.02 0.02 0.01
Other citrus 0.053 0.021 0.074 0.67 0.21 0.88 0.25
Olives 0.209 25.594 25.803 1.90 143.33 145.23 41.81
Grapes 0.125 2.058 2.184 0.83 13.89 14.72 4.24
Figs 0.001 0.184 0.185 0.01 1.58 1.59 0.46
Almonds 0.00 0.093 0.093 0.00 0.80 0.80 0.23
Peaches 0.001 1.743 1.744 0.01 14.99 15.00 4.32
Plums, prunes 0.001 0.551 0.52 0.01 4.74 4.75 1.37
Apricots 0.004 0.901 0.905 0.03 7.75 7.78 2.24
Apples 0.00 2.357 2.357 0.00 20.63 20.63 5.94
Pomegranates 0.066 0.169 0.234 0.54 1.45 1.99 0.57
Pears 0.001 0.334 0.335 0.00 2.87 2.88 0.83
Guava 0.082 0.054 0.136 0.67 0.47 1.14 0.33
Dates 1.454 0.698 2.152 21.67 8.03 29.69 8.55
Bananas 0.791 0.009 0.801 10.76 0.13 10.89 3.14
Nectarines 0.000 0.592 0.592 0.00 5.09 5.09 1.47
Cherry. red 0.000 0.130 0.130 0.00 1.14 1.14 0.33
Others 0.120 0.477 0.597 1.32 4.56 5.88 1.69
Total 8.872 36.257 45.129 112.67 234.66 347.33 100.00%
Percentage 19.7% 80.3% 100.0% 32.4% 67.6% 100.0%
Source: Department of Statistics Water use calculated by authors.
4.11.2.Value of water for fruits
As Table 4.17 indicates, in the Jordan Valley, the value per cubic meter of irrigation water used for fruit production was USD 3.40 for grapes; about USD 0.23 for palm trees; more than USD 1.41 for lemons, pomegranates and bananas; and less than USD 1.41 for other fruit trees.

99
Food supply cost curve
In the highlands, the value of per cubic meter of irrigation water was USD 3.20 for pomegranates, about USD 0.35 for dates and more than USD 1.41 for crops including grapes, peaches, apricots, apples, guava, pears, bananas and nectarines. The value per cubic meter of irrigation water for the remaining fruits was less than USD 1.41.
Table 4.17 Water values (USD/m3) for fruits, 2013
2013Type
JV water use
(MCM)
JV.FUSD/m3
HL water use
(MCM)
HLL.FUSD/m3
JOR water use
(MCM)
Weighted average USD/m3
Lemons 17.23 1.424 1.99 1.178 19.22 1.398
Lemons, sweet 0.00 0.000 0.06 0.531 0.06 0.531
Oranges, local 0.76 0.997 0.32 0.380 1.07 0.815
Oranges, navel 14.19 0.811 0.16 0.501 14.35 0.806
Oranges, red 5.23 0.545 0.01 0.879 5.24 0.545
Oranges, Valencia 3.36 0.770 0.04 0.677 3.40 0.768
Oranges, French 2.18 0.843 0.01 0.960 2.18 0.843
Oranges, shamouti 6.42 0.726 0.11 0.586 6.53 0.725
Clementines 12.75 0.732 0.11 0.538 12.86 0.730
Mandarins 6.62 0.694 0.08 0.438 6.69 0.691
Grapefruits 2.04 0.555 0.04 0.421 2.08 0.552
Mandarins, Medit. 0.03 0.994 0.00 0.000 0.03 0.994
Pummelo 3.24 1.027 0.07 0.917 3.31 1.024
Oranges, sour 0.22 0.000 0.00 0.000 0.22 0.000
Narenj 0.00 0.000 0.02 0.401 0.02 0.401
Other citrus 0.67 0.852 0.21 0.504 0.88 0.767
Olives 1.90 0.780 143.33 0.425 145.23 0.429
Grapes 0.83 3.388 13.89 1.599 14.72 1.699
Figs 0.01 0.323 1.58 0.685 1.59 0.682
Almonds 0.00 0.000 0.80 1.383 0.80 1.383
Peaches 0.01 0.490 14.99 2.134 15.00 2.133
Plums, prunes 0.01 0.000 4.74 0.997 4.75 0.996
Apricots 0.03 1.021 7.75 1.688 7.78 1.685
Apples 0.00 0.000 20.63 2.948 20.63 2.948
Pomegranates 0.54 1.770 1.45 3.297 1.99 2.880
Pears 0.00 1.883 2.87 1.558 2.88 1.558
Guava 0.67 2.195 0.47 1.613 1.14 1.958
Dates 21.67 8.03 29.69
Bananas 10.76 0.13 10.89
Nectarines 0.00 0.000 5.09 1.508 5.09 1.508
Cherry, red 0.00 0.000 1.14 1.086 1.14 1.086
Others 1.32 0.866 4.56 0.525 5.88 0.602
Total 112.67 0.000 234.66 0.000 347.33 0.000
Percentage 0.32 0.000 0.68 0.000 1.00 0.000
Weighted average 1.031 0.946 0.975
Source: Calculated by authors
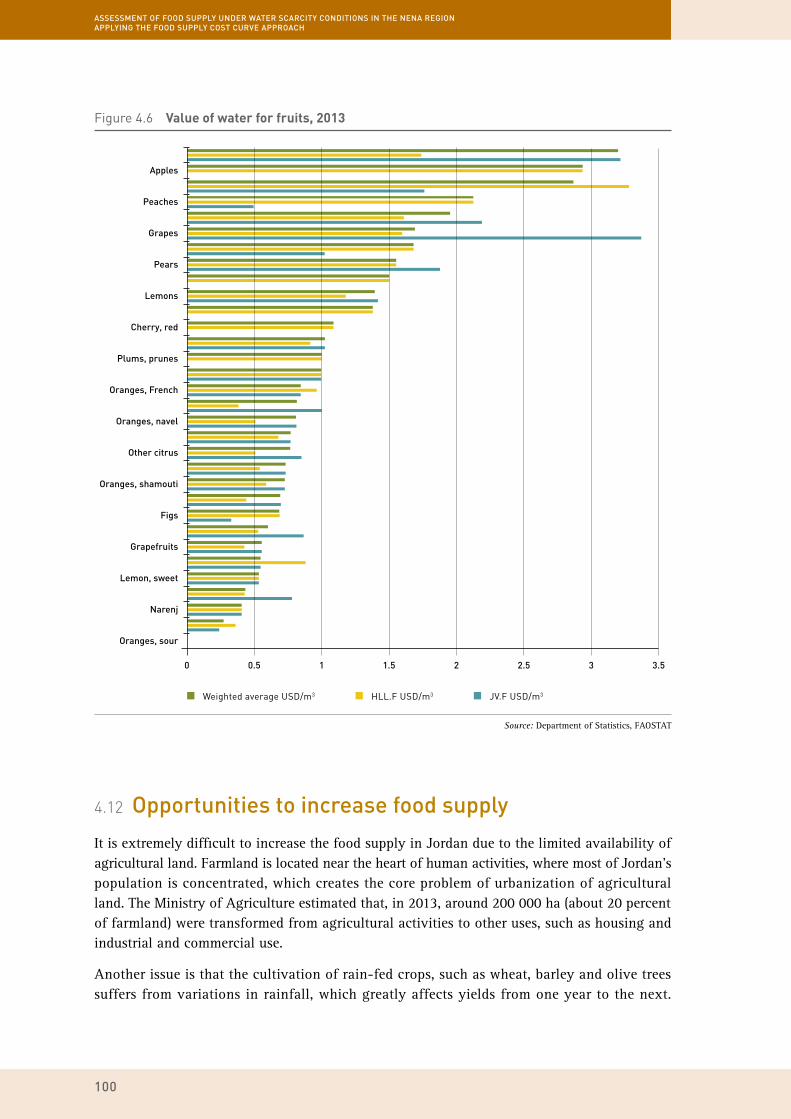
ASSESSMENT OF FOOD SUPPLY UNDER WATER SCARCITY CONDITIONS IN THE NENA REGION APPLYING THE FOOD SUPPLY COST CURVE APPROACH
100
4.12 Opportunities to increase food supply
It is extremely difficult to increase the food supply in Jordan due to the limited availability of agricultural land. Farmland is located near the heart of human activities, where most of Jordan’s population is concentrated, which creates the core problem of urbanization of agricultural land. The Ministry of Agriculture estimated that, in 2013, around 200 000 ha (about 20 percent of farmland) were transformed from agricultural activities to other uses, such as housing and industrial and commercial use.
Another issue is that the cultivation of rain-fed crops, such as wheat, barley and olive trees suffers from variations in rainfall, which greatly affects yields from one year to the next.
Figure 4.6 Value of water for fruits, 2013
Grapes
Grapefruits
Lemon, sweet
Apples
Peaches
Narenj
Oranges, French
Cherry, red
Pears
Other citrus
Plums, prunes
Oranges, shamouti
Lemons
Oranges, navel
Oranges, sour
Figs
2 2.5 3.531.510.50
Weighted average USD/m3 JV.F USD/m3HLL.F USD/m3
Source: Department of Statistics, FAOSTAT

101
Food supply cost curve
Accordingly, any policy aiming to increase food production should focus on improving agricultural management in rain-fed areas, especially for olive trees which represented 24 percent of the total cultivated area in 2013.
Although the area under vegetable cultivation represents only 19 percent of Jordan’s total cultivated land, it produces about 70 percent of the total agricultural output of the country. This is mainly due to the use of irrigation, which leads to high productivity. Therefore, expanding the growth of vegetables is a possible opportunity to increase food production in Jordan, especially for those crops that will reduce the country’s food gap.
Policies aiming to increase production in Jordan must take into consideration the limited water resources and the return per cubic meter of irrigation water. As the data presented in this chapter shows, vegetables achieve the highest return on water irrigation in Jordan with an expected weighted average return for winter vegetables of USD 3.80 per cubic meter, USD 5.81 per cubic meter in the Jordan Valley and USD 3.46 per cubic meter in the highlands. The overall weighted average return for summer vegetables was about USD 4.72 per m3, USD 5.23 in the Jordan Valley and USD 4.52 the highlands. The overall weighted average for fruit trees was about USD 0.97 per cubic meter, with a return of USD 1.03 per cubic meter in the Jordan Valley and USD 0.95 per cubic meter in the highlands. Finally, the weighted average return for cultivated field crops in irrigated areas was about USD 3.8 per cubic meter. The high return for field crops is due to an odd value, that of garlic, which has an expected average return in the Jordan Valley of USD 5.81, and about USD 1.17 in the highlands.
The opportunities for increasing food supply and achieving sufficiency in the use of water mentioned in this section will require agricultural policies that address the following areas:
• Improve agricultural practices on rain-fed olive farms to increase productivity and food production.
• Replace fruit tree cultivation with vegetable cultivation, especially in irrigated agriculture in the highlands and the Jordan Valley, as vegetables crops have higher yields than fruit trees. This will address Jordan’s food gap and enhance food security for the local population. The following specific actions can be taken in this regard:
1. increase olive production in rain-fed agriculture;
2. increase potato production in the highlands;
3. increase onion production in the Jordan Valley.
4.12.1.Increasing production of olives in rain-fed areas
Olives are one of the most important oil crop in Jordan, with per capita consumption estimated at about 3.6 kg per year (according to studies on family incomes and spending in 2010), with an expected growth rate of 17 percent and with a total domestic consumption estimated at 22.3 million kg per year. Jordan’s population in 2013 was estimated at 6.53 million people. Therefore, domestic consumption of olives is estimated at 146 000 tons in 2013 and is expected to increase to 148 000 tons in 2020. With an estimated production of 128 000 tons of olives in 2013, the gap for that year is approximately 18 000 tons.

ASSESSMENT OF FOOD SUPPLY UNDER WATER SCARCITY CONDITIONS IN THE NENA REGION APPLYING THE FOOD SUPPLY COST CURVE APPROACH
102
The scenario to improve olive farm management in rain-fed land areas is based on increasing productivity. The total area under olive cultivation was about 36 600 ha in 2013, with an estimated rain-fed olive production of about 75 000 tons and an estimated productivity of 2 tons per ha. This low productivity is mainly due to four factors: agricultural rotation, reduced average rainfall, limited use of fertilizer in rain-fed lands, and lack of water harvesting systems to complete irrigation. (The latter would not only contribute water for olive production but also limit the risks caused by rainfall fluctuation.) It is hoped that this scenario will contribute to providing agricultural guidance for farmers concerning the importance of fertilizer use for olive farms, of suitable pruning techniques and of implementing projects which finance farmers to create water harvesting systems inside their farms, as they would save water to irrigate fruit trees.
The potential impact of this scenario in increasing olive production in traditional, rain-fed cultivation is analysed below:
(I) Production costs:
As Table 4.18 shows, production costs in current traditional olive cultivation are estimated at USD 13 220 per ha, in addition to the cost of preparing land for cultivation, the cost of breeding trees till they begin producing fruit and the cost of protecting the trees. Production costs are estimated to increase to USD 18 164 per ha with the use of improved farm management methods, compared to using the water harvesting with traditional cultivation. The investment period in rain-fed agriculture is estimated to be 40 to 60 years during the productive period for olive trees.
Table 4.18 Capital costs for olive cultivation in the highlands
Item Fixed costs Unit Scenario A Scenario B
Min. Max. Min. Max.
Preparing the land and planting USD/ha 1 412 1 483 1 412 1 483
Raising the trees until they bear fruit USD/ha 5 523 5 799 5 523 5 799
Water harvesting method (water well 100 m3) USD/water well 0 0 4 944 5 191
Wire protection USD/ha 6 285 6 600 6 285 6 600
Total USD 13 220 13 881 18 164 19 072
Duration Years 40 60 40 60
Variable costs for traditional rain-fed cultivation are estimated at about USD 2 292 per ha per year, including chemical fertilizers, pesticides, mechanical work for ploughing the land, and temporary labor for harvesting. These costs increase to USD 2 952 per year when using organic fertilizers and additional quantities of chemical fertilizers.
Source: Department of Statistics, FAOSTAT

103
Food supply cost curve
Table 4.19 Capital costs for olive cultivation in the highlands
Item Unit Unit price (USD )
T. Cult. B. M. Cult.
Quantity Value (USD)
Quantity Value (USD)
Organic fertilizers Ton 63.6 0.0 5 317.8
Chemical fertilizers Kg 0.6 150.0 84.7 750.0 423.7
Pesticides Unit 11.3 10 113.0 10 113.0
Machine work Unit 9.9 10.0 98.9 10.0 98.9
Permanent labour Unit 0.0 0.0
Temporary labour Working hours 2.8 700.0 1 977.4 700.0 1 977.4
Packages for filling crops Unit 0.4 50 17.7 60 21.2
Total variable cost 2 291.7 2 952.0
(II) Returns:
The average production of olives per hectare in traditional rain-fed agriculture is estimated at 1.8 to 2.2 tons per ha. With an expected annual average price in the local market of USD 1 162 per ton, the average return per ha in rain-fed agriculture is USD 2 331 per year. Improved farm management in rain-fed agriculture is expected to increase productivity per hectare to between 2.5 and 3.0 tons per year, with returns of approximately USD 3 192 per ha per year.
(III) Analysis of returns and costs in both scenarios:
A special programme of the FAO was used to conduct a cost/benefit analysis, assuming that the opportunity cost of irrigation water is equivalent to the price at which a farmer could sell water to neighbouring farmers (USD 0.353 per m3), or to ranchers (USD 1.412 per m3). As Table 4.20 shows, with improved management, average production per ha of olive trees will increase by 40 percent, from 2 tons to 2.8 tons, and as such, the cost of production per ton of olives will fall by 3.5 percent, from USD 1 369 to USD 1 321.
Table 4.20 Costs and returns for olive cultivation in the highlands
Indicator Scenario A (Traditional cultivation)
Scenario B (Improved management
cultivation)
Min. unit cost 11 402.1 10 943.2
Max. unit cost 15 974.2 15 466.1
Min. yield 1.8 2.5
Max. yield 2.2 3.0
Sel. prob. 89.9% 92.6%
Exp. unit cost 13 688.1 13 204.7
Exp. yield 2.0 2.8
Source: Department of Statistics, FAOSTAT
Source: Department of Statistics, FAOSTAT

ASSESSMENT OF FOOD SUPPLY UNDER WATER SCARCITY CONDITIONS IN THE NENA REGION APPLYING THE FOOD SUPPLY COST CURVE APPROACH
104
Table 4.21 Weighted olive prices in local markets
Month Weighted price USD (average)
Weighted price USD (highest)
Weighted price USD (lowest)
January 1 129.9 1 365.4 894.5
February 1 129.9 1 365.4 894.5
March 1 129.9 1 365.4 894.5
April 0.0 0.0 0.0
May 0.0 0.0 0.0
June 0.0 0.0 0.0
July 0.0 0.0 0.0
August 0.0 0.0 0.0
September 1 311.5 1 866.4 938.3
October 885.1 1 683.4 713.8
November 1 269.2 2 652.5 657.5
December 1 404.9 2 783.2 715.6
Annual weighted price 1 161.9 2 174.5 727.0
Source: Ministry of AgricultureCalculated by authors
(IV) Analysing the effects of improving the management of rain-fed olive crops to increase production:
The results of the previous analysis show that improving the management of rain-fed olive production will increase average production at a rate of 0.8 tons per ha. In 2013, there were an estimated 36 600 ha of rain-fed olive production. This policy will aim to cover 50 percent of rain-fed olive areas. This will increase olive production by about 14 600 tons per year, from 146 000 tons to 160 600 tons, thus reducing the gap in olive production/consumption from 18 000 tons to around 3 000 tons per year. This also reduces the unit production costs by USD 480 per ha and will reduce the overall production costs for rain-fed agriculture by USD 8.8 million per year (assuming the improvements are implemented in 50 percent of rain-fed olive production areas).
4.12.2.Increase in production of potatoes in the highlands
Potatoes are one of the main starchy crops in Jordan. Per capita consumption of potatoes is estimated at 25.24 kg per year. With an estimated population of 6.53 million in 2013, domestic demand for potatoes in Jordan is approximately 165 000 tons per year. This is expect to increase to 167 000 tons per year in 2020. According to the Department of Statistics, total potato production for 2013 amounted to 103 000 tons, which means that the gap in potato production/consumption is about 64 000 tons per year.
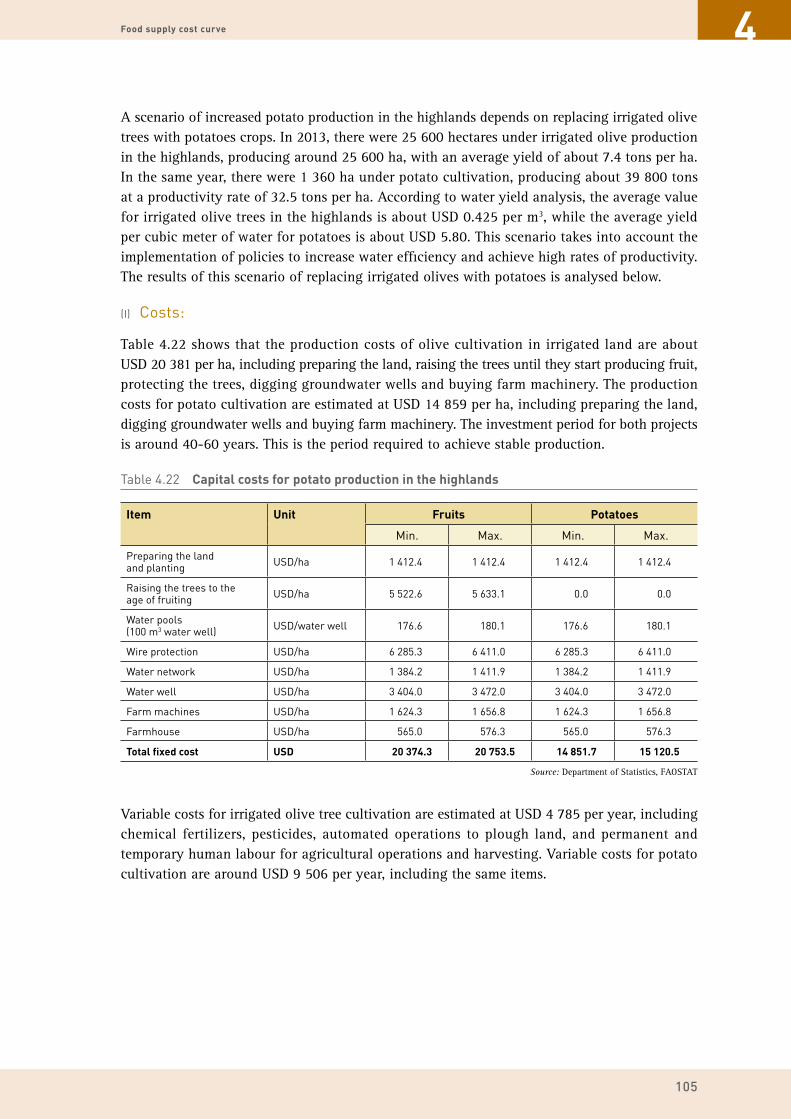
105
Food supply cost curve
A scenario of increased potato production in the highlands depends on replacing irrigated olive trees with potatoes crops. In 2013, there were 25 600 hectares under irrigated olive production in the highlands, producing around 25 600 ha, with an average yield of about 7.4 tons per ha. In the same year, there were 1 360 ha under potato cultivation, producing about 39 800 tons at a productivity rate of 32.5 tons per ha. According to water yield analysis, the average value for irrigated olive trees in the highlands is about USD 0.425 per m3, while the average yield per cubic meter of water for potatoes is about USD 5.80. This scenario takes into account the implementation of policies to increase water efficiency and achieve high rates of productivity. The results of this scenario of replacing irrigated olives with potatoes is analysed below.
(I) Costs:
Table 4.22 shows that the production costs of olive cultivation in irrigated land are about USD 20 381 per ha, including preparing the land, raising the trees until they start producing fruit, protecting the trees, digging groundwater wells and buying farm machinery. The production costs for potato cultivation are estimated at USD 14 859 per ha, including preparing the land, digging groundwater wells and buying farm machinery. The investment period for both projects is around 40-60 years. This is the period required to achieve stable production.
Table 4.22 Capital costs for potato production in the highlands
Item Unit Fruits Potatoes
Min. Max. Min. Max.
Preparing the land and planting USD/ha 1 412.4 1 412.4 1 412.4 1 412.4
Raising the trees to the age of fruiting USD/ha 5 522.6 5 633.1 0.0 0.0
Water pools (100 m3 water well) USD/water well 176.6 180.1 176.6 180.1
Wire protection USD/ha 6 285.3 6 411.0 6 285.3 6 411.0
Water network USD/ha 1 384.2 1 411.9 1 384.2 1 411.9
Water well USD/ha 3 404.0 3 472.0 3 404.0 3 472.0
Farm machines USD/ha 1 624.3 1 656.8 1 624.3 1 656.8
Farmhouse USD/ha 565.0 576.3 565.0 576.3
Total fixed cost USD 20 374.3 20 753.5 14 851.7 15 120.5
Variable costs for irrigated olive tree cultivation are estimated at USD 4 785 per year, including chemical fertilizers, pesticides, automated operations to plough land, and permanent and temporary human labour for agricultural operations and harvesting. Variable costs for potato cultivation are around USD 9 506 per year, including the same items.
Source: Department of Statistics, FAOSTAT

ASSESSMENT OF FOOD SUPPLY UNDER WATER SCARCITY CONDITIONS IN THE NENA REGION APPLYING THE FOOD SUPPLY COST CURVE APPROACH
106
Table 4.23 Variable costs for olive and potato production in the highlands
Item Unit Unit price (USD)
Olives Potatoes
Quantity Value (USD) Quantity Value (USD)
Seeds and seedlings Kg 1.4 0.0 2 500 3 531.1
Organic fertilizers Ton 63.6 16.0 1 016.9 10 635.6
Chemical fertilizers Kg 0.6 1 270 717.5 2 550 1 440.7
Pesticides Unit 11.3 10 113.0 80 904.0
Machine work Unit 25.4 10 254.2 15 381.4
Permanent labour Unit 353.1 0.0 2 706.2
Temporary labour Man-hours 2.8 700 1 977.4 200 565.0
Packing boxes Unit 0.4 2 000 706.2 3 000 1 059.3
Other variable costs Unit 28.2 0.0 10 282.5
Total variable costs 4 785.3 9 505.6
(II) Returns:
The average production rate of irrigated olive trees in the highlands is estimated at 6.8 to 8.0 tons per ha. With an average price USD 1 162 per ton on the domestic market, the average annual yield per hectare is USD 8 602. As to potatoes, production is estimated at 25 to 40 tons per ha. With an annual average price on the domestic market of USD 692 per ton, the annual average yield per hectare is USD 22 500.
(III) Returns and costs in both scenarios:
The same FAO program mentioned above was used to conduct a cost/benefit analysis, assuming that the opportunity cost of irrigation water is equivalent to the price at which a farmer could sell water to neighbouring farmers (USD 0.353 per m3) or to ranchers (USD 1.412 per m3). The results presented in the following table show that expected costs per hectare of olive production in the highlands are estimated at USD 18 616 per ha, whereas the cost of cultivating potatoes is estimated at USD 4 661 per ha. As the average production rate of olives is estimated at 7.4 tons per ha, compared to 32.5 tons per ha for potatoes, the production cost of potatoes is around 25 percent that of olives.
Table 4.24 Costs and returns for olive and potato cultivation in the highlands
Item Olives Potatoes
Min. unit cost 9 830.2 274.7
Max. unit cost 27 412.6 656.4
Min. yield 6.8 25.0
Max. yield 8.0 40.0
Sel. prob. 54.3% 96.2%
Exp. unit cost 18 621.3 4 655.4
Exp. yield 7.4 32.5
Source: Department of Statistics, FAOSTAT
Source: Department of Statistics, FAOSTAT

107
Food supply cost curve
In terms of unit costs compared to international prices, Jordan relies on market dynamics, where the international price of olives ranges between USD 1 366 and USD 2 784 per ton, with an annual estimated average of about USD 2 175 per ton, compared to the international prices of potatoes, ranging between USD 600 and USD 1 715 per ton. By comparing international production costs per unit, Table 4.24 (above) indicates that international prices are higher than the average production cost per unit for both crops. However, the probability of price increases per unit cost was 96.2 percent for potato crops grown in the highlands, compared to 54 percent for olive trees. As such, the recommendation is that olive production be replaced with potato production.
Table 4.25 Weighted potato prices in local markets
Month Weighted price (average)
Weighted price (highest) Weighted price (lowest)
January 649.34 880.62 472.80
February 648.52 1 715.78 452.16
March 617.15 816.60 420.71
April 523.64 710.69 419.52
May 452.53 601.24 372.19
June 554.15 697.74 396.03
July 601.68 791.40 360.44
August 675.88 869.17 447.88
September 825.34 905.86 547.73
October 759.65 1 039.17 584.34
November 1 012.54 1 181.74 785.45
December 965.08 1 175.58 781.69
Annual weighted price 692.53 962.27 560.24
(IV) The effect of increasing potato cultivation in the highlands to increase food production:
The proposed policy scenario will replace olive cultivation with potato cultivations on 5 percent of the land currently under olive production. This would increase land under potato cultivation by about 1 300 ha, with an increase in potato production of 42 000 tons per year, from 103 000 tons to 145 000 tons. Consequently, the country’s food gap would drop from 64 000 tons to 22 000 tons per year. Additionally, this scenario will reduce unit production costs of USD 13 969 per hectare, leading to reduced production costs in irrigated agriculture in the highlands totaling USD 18.2 million per year, assuming five percent of the land currently under irrigated olive cultivation is converted to potato cultivation. In terms of efficient use of irrigation water, the water yield for potato cultivation in the highlands is about USD 5.8 per m3 and around USD 0.424 for olive cultivation. Replacing olive cultivation with potato cultivation will reduce the consumption of irrigation water by 3 MCM, while increasing the value of used water from USD 3.1 million to USD 24.9 million, thus achieving very high efficiency in the use of irrigation water.
Source: Department of Statistics, FAOSTAT

ASSESSMENT OF FOOD SUPPLY UNDER WATER SCARCITY CONDITIONS IN THE NENA REGION APPLYING THE FOOD SUPPLY COST CURVE APPROACH
108
4.12.3. Increase the production of onions in the Jordan Valley
Onions are considered among the most important vegetable crops in Jordan, given that individual consumption is estimated at 10.45 kg per year. With an estimated population in 2013 of 6.53 million, the annual domestic consumption of onions is estimated at 68 200 tons. This is expected to increase to 69 300 tons in 2020. However, according to the Department of Statistics, 13 000 tons of onions were produced in 2013, indicating a food gap for onions of approximately 56 300 tons per year.
The scenario of increasing onion production in the Jordan Valley is based on cultivating onions in the irrigated area currently under citrus tree cultivation. The total land area in the Jordan Valley under irrigated citrus cultivation in 2013 is estimated at 6 020 ha, with an estimated production of 64 000 tons and an average productivity of 19 tons per hectare. The total land area under onion cultivation in the Jordan Valley is estimated at 160 ha, with an estimated production of 4 500 tons of onions and an average productivity of 27 tons per ha. As to the water yield, the average yield per cubic meter of water for citrus trees in the Jordan Valley was about USD 0.84, while the average yield for onions was about USD 3.5. The scenario for increasing onion production should take into account water use efficiency as well as higher rates of productivity per hectare. The following section analyses the scenario of cultivating onions instead of citrus trees and the different elements for increasing food production efficiency.
(I) Costs:
The following table shows the costs for irrigated cultivation of citrus trees in the Jordan Valley, which is estimated at USD 31 596 per ha, including preparing the land, breeding the trees until they start producing fruit, protecting the trees, building ponds and irrigation networks and buying farm machinery. The costs for onion cultivation are estimated at USD 26 074 per ha, including preparing the land, building ponds and irrigation networks and buying farm machinery. The investment period for both crops is estimated at 40 to 60 years, reflecting long-term planning.
Table 4.26 Capital costs for the cultivation of citrus fruits and onionslands
Item Unit Citrus fruits Onions
Min. Max. Min. Max.
Preparing the land and planting USD/ha 1 412.4 1 440.7 1 412.4 1 440.7
Raising the trees until fruit production USD/ha 5 522.6 5 632.8 0.0 0.0
Water pool (water well 100 m3) USD/water well 1 172.3 1 200.6 1 172.3 1 200.6
Wire protection USD/ha 6 285.3 6 411.0 6 285.3 6 411.0
Water network USD/ha 1 384.2 1 412.4 1 384.2 1 412.4
Farm machines USD/ha 10 734.5 10 949.2 10 734.5 10 949.2
Farmhouse USD/ha 5 084.7 5 186.4 5 084.7 5 186.4
Total fixed cost USD 31 596.0 32 233.1 26 073.4 26 600.3
Source: Department of Statistics, FAOSTAT

109
Food supply cost curve
Variable costs for citrus cultivation are estimated at USD 7 299 per year, including chemical fertilizers, pesticides, automated work on the land and permanent and temporary human labour during harvest and for agricultural operations. Variable costs for the cultivation of onions is around USD 5 059 per year.
Table 4.27 Variable costs for the cultivation of citrus fruits and onions
Item Unit Unit price (USD)
Citrus trees Onions
Quantity Value (USD) Quantity Value (USD)
Seeds and seedlings Kg 192.1 0.0 5 960.5
Organic fertilizers Ton 63.6 34 2 161.0 10 635.6
Chemical fertilizers Kg 0.6 2140 1 209.0 1 380 779.7
Pesticides Unit 11.3 25 282.5 15 169.5
Machine work Unit 9.9 10 98.9 15 148.3
Permanent labour Unit 353.1 0.4 123.6 1.6 565.0
Temporary labour Working hours 2.8 800 2 259.9 450 1 271.2
Packing boxes Unit 0.4 2 500 882.8 2 500 247.2
Other variable costs Unit 28.2 10 282.5 10 282.5
Total variable costs 282.5 282.5
(II) Returns:
The average production rate of irrigated citrus trees in the Jordan Valley is 12.3 to 26.2 tons per ha, with an annual average price of USD 667 per ton on the local market and an average yield of USD 12 839 per ha per year. For onions, the average production rate is estimated at 27 to 28 tons per ha, with an annual average price of USD 477 per ton in the local market and an average yield of around USD 12 641 per ha per year.
(III) Analysis of returns and costs for both scenarios:
Again, for this scenario, the special FAO programme was used determine the cost/benefit ratio, assuming that the opportunity cost of irrigation water is equivalent to the price at which a farmer could sell water to neighbouring farmers (USD 0.353 per m3) or to ranchers (USD 1.412 per m3). The table below shows that expected production cost for citrus trees in the Jordan Valley is about USD 12 853 per ha, while production cost for onions is about USD 3 305 - only 27 percent of the production costs for citrus trees. Furthermore, average production of citrus is estimated at 19.3 tons per ha, while the average production of onions is estimated at 26.5 tons per ha.
Source: Department of Statistics, FAOSTAT

ASSESSMENT OF FOOD SUPPLY UNDER WATER SCARCITY CONDITIONS IN THE NENA REGION APPLYING THE FOOD SUPPLY COST CURVE APPROACH
110
Table 4.28 Indicator analysis of costs and returns for the cultivation of citrus fruits and onions
Short Name Citrus fruits Onions
Min. unit cost 4 246.9 2 410.0
Max. unit cost 21 485.6 4 186.9
Min. yield 12.3 25.0
Max. yield 26.2 28.0
Sel. prob. 26.7% 100.0%
Expected unit cost 12 866.2 3 298.4
Expected yield 19.3 26.5
In terms of unit costs compared to international prices, Jordan relies on market dynamics, where the international price of citrus fruit ranges between USD 572 and USD 979 per ton, with an annual estimated average of about USD 638 per ton, compared to international prices of onions, which range between USD 461 and USD 775 per ton. International prices for the cost of a production unit of citrus fruits and onions (see Table 4.28 above), indicate that there is a 100 percent probability that international prices for onion crops will be higher than the average unit cost, international prices for citrus fruits will be lower than the average unit cost, with almost 27 percent possibility that international prices could be higher than the cost of production. As such, it is apparent that citrus cultivation in Jordan is not economically efficient.
Table 4.29 Production and SSR of food types, 2009 vs. 2012
Month Citrus fruit Onions
Weighted price
(average)
Weighted price
(highest)
Weighted price
(lowest)
Weighted price
(average)
Weighted price
(highest)
Weighted price
(lowest)
January 615.1 884.7 406.7 486.9 607.5 388.6
February 631.4 910.3 407.1 567.0 723.1 433.0
March 683.2 978.8 430.8 518.1 657.2 340.4
April 734.3 975.3 562.5 384.5 575.0 299.5
May 760.8 971.5 620.3 321.1 498.2 208.0
June 702.8 915.7 555.1 387.7 461.1 252.1
July 512.9 660.8 374.9 409.3 515.3 282.7
August 482.5 612.3 396.9 509.1 636.4 384.1
September 445.6 572.5 368.9 546.3 674.3 417.8
October 536.3 687.9 415.9 478.0 549.4 406.5
November 605.8 827.6 447.9 494.8 600.6 428.1
December 720.8 982.2 488.3 495.6 776.1 414.0
Annual weighted price 666.4 938.2 450.3 477.6 626.2 390.6
Source: Department of Statistics, FAOSTAT
Source: Department of Statistics, FAOSTAT
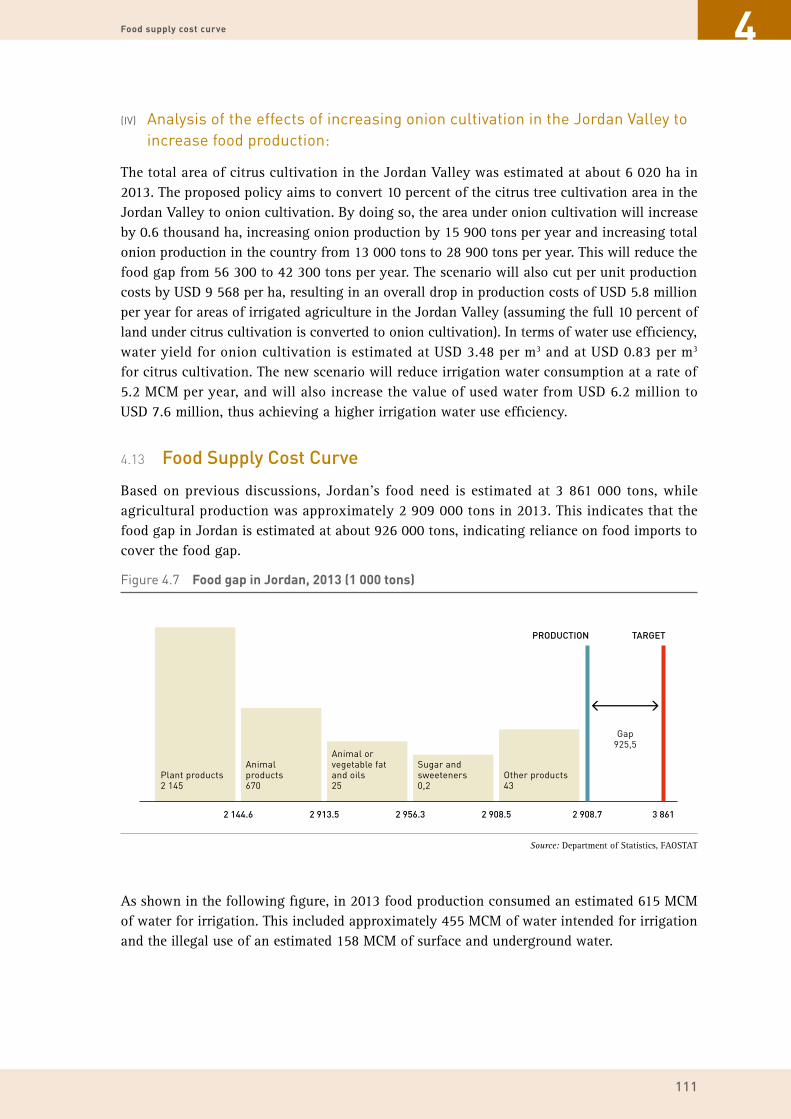
111
Food supply cost curve
(IV) Analysis of the effects of increasing onion cultivation in the Jordan Valley to increase food production:
The total area of citrus cultivation in the Jordan Valley was estimated at about 6 020 ha in 2013. The proposed policy aims to convert 10 percent of the citrus tree cultivation area in the Jordan Valley to onion cultivation. By doing so, the area under onion cultivation will increase by 0.6 thousand ha, increasing onion production by 15 900 tons per year and increasing total onion production in the country from 13 000 tons to 28 900 tons per year. This will reduce the food gap from 56 300 to 42 300 tons per year. The scenario will also cut per unit production costs by USD 9 568 per ha, resulting in an overall drop in production costs of USD 5.8 million per year for areas of irrigated agriculture in the Jordan Valley (assuming the full 10 percent of land under citrus cultivation is converted to onion cultivation). In terms of water use efficiency, water yield for onion cultivation is estimated at USD 3.48 per m3 and at USD 0.83 per m3 for citrus cultivation. The new scenario will reduce irrigation water consumption at a rate of 5.2 MCM per year, and will also increase the value of used water from USD 6.2 million to USD 7.6 million, thus achieving a higher irrigation water use efficiency.
4.13 Food Supply Cost Curve
Based on previous discussions, Jordan’s food need is estimated at 3 861 000 tons, while agricultural production was approximately 2 909 000 tons in 2013. This indicates that the food gap in Jordan is estimated at about 926 000 tons, indicating reliance on food imports to cover the food gap.
As shown in the following figure, in 2013 food production consumed an estimated 615 MCM of water for irrigation. This included approximately 455 MCM of water intended for irrigation and the illegal use of an estimated 158 MCM of surface and underground water.
Figure 4.7 Food gap in Jordan, 2013 (1 000 tons)
Plant products 2 145
Animal products 670
Animal or vegetable fat and oils 25
Sugar and sweeteners 0,2
Other products 43
Gap 925,5
2 144.6 2 913.5 2 956.3 2 908.5 2 908.7
PRODUCTION
3 861
TARGET
Source: Department of Statistics, FAOSTAT
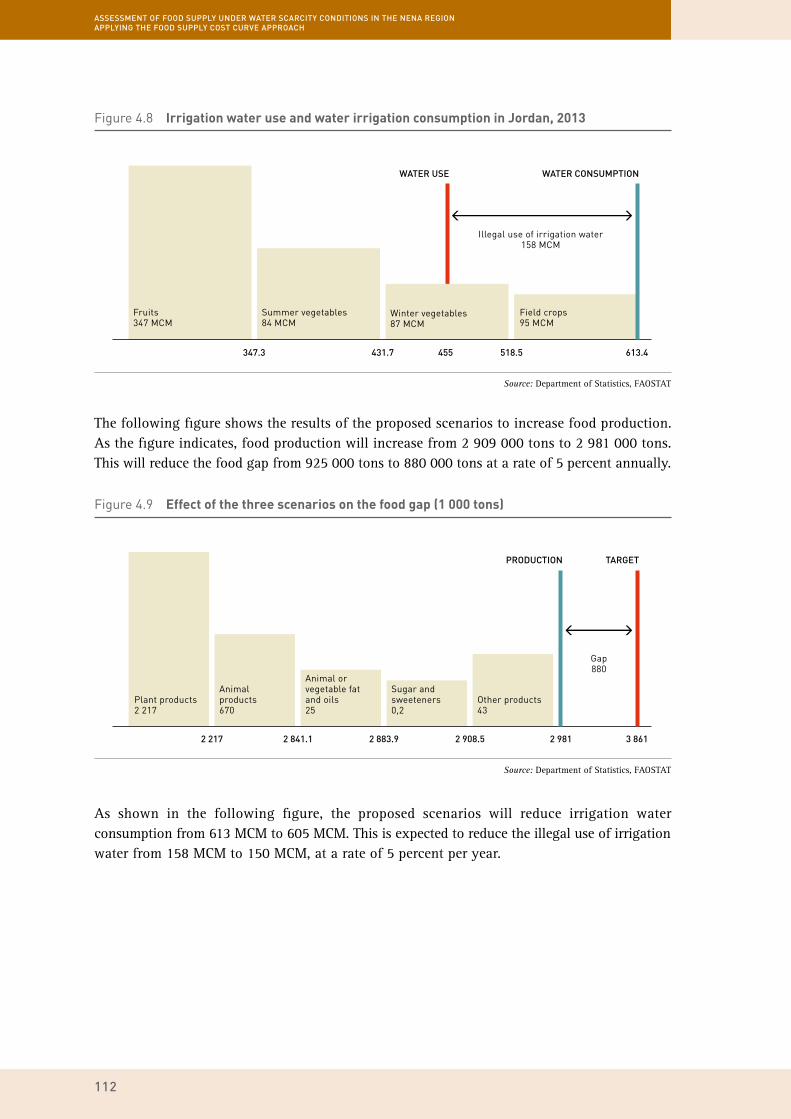
ASSESSMENT OF FOOD SUPPLY UNDER WATER SCARCITY CONDITIONS IN THE NENA REGION APPLYING THE FOOD SUPPLY COST CURVE APPROACH
112
The following figure shows the results of the proposed scenarios to increase food production. As the figure indicates, food production will increase from 2 909 000 tons to 2 981 000 tons. This will reduce the food gap from 925 000 tons to 880 000 tons at a rate of 5 percent annually.
As shown in the following figure, the proposed scenarios will reduce irrigation water consumption from 613 MCM to 605 MCM. This is expected to reduce the illegal use of irrigation water from 158 MCM to 150 MCM, at a rate of 5 percent per year.
Figure 4.8 Irrigation water use and water irrigation consumption in Jordan, 2013
Fruits 347 MCM
Summer vegetables 84 MCM
Winter vegetables 87 MCM
Field crops 95 MCM
Illegal use of irrigation water 158 MCM
347.3 431.7 455 518.5
WATER USE
613.4
WATER CONSUMPTION
Figure 4.9 Effect of the three scenarios on the food gap (1 000 tons)
Plant products 2 217
Animal products 670
Animal or vegetable fat and oils 25
Sugar and sweeteners 0,2
Other products 43
Gap 880
2 217 2 841.1 2 883.9 2 908.5 2 981
PRODUCTION
3 861
TARGET
Source: Department of Statistics, FAOSTAT
Source: Department of Statistics, FAOSTAT
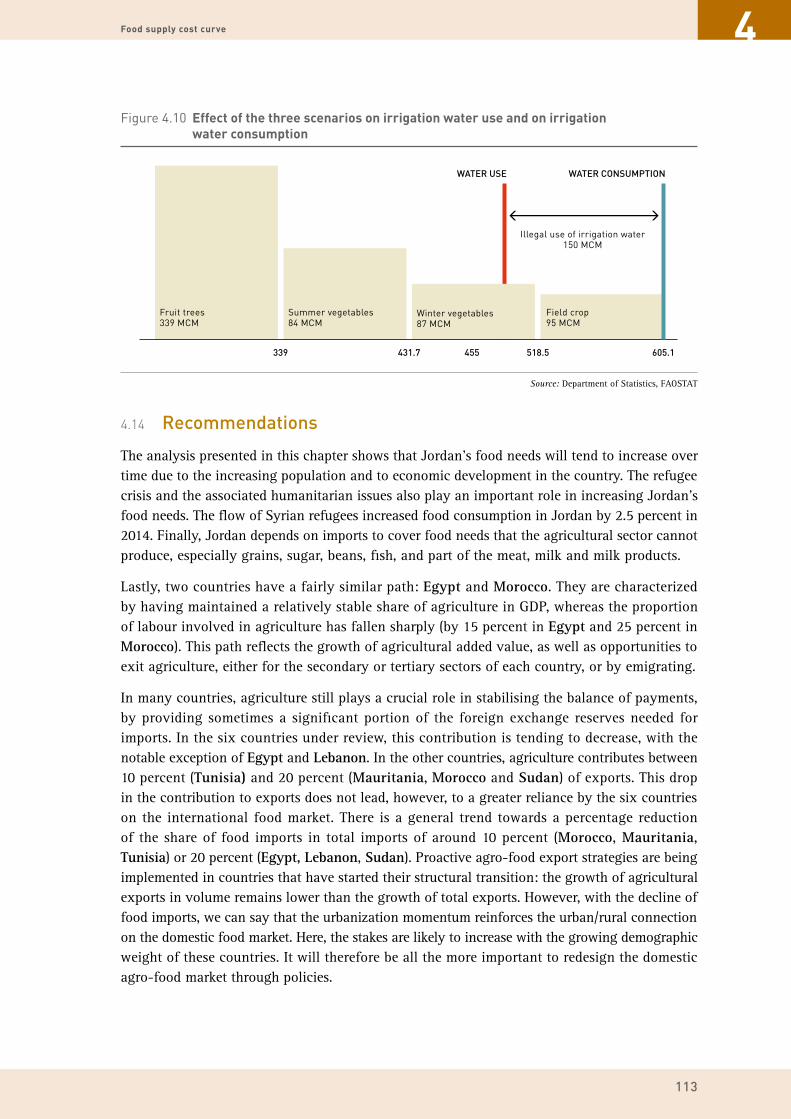
113
Food supply cost curve
4.14 Recommendations
The analysis presented in this chapter shows that Jordan’s food needs will tend to increase over time due to the increasing population and to economic development in the country. The refugee crisis and the associated humanitarian issues also play an important role in increasing Jordan’s food needs. The flow of Syrian refugees increased food consumption in Jordan by 2.5 percent in 2014. Finally, Jordan depends on imports to cover food needs that the agricultural sector cannot produce, especially grains, sugar, beans, fish, and part of the meat, milk and milk products.
Lastly, two countries have a fairly similar path: Egypt and Morocco. They are characterized by having maintained a relatively stable share of agriculture in GDP, whereas the proportion of labour involved in agriculture has fallen sharply (by 15 percent in Egypt and 25 percent in Morocco). This path reflects the growth of agricultural added value, as well as opportunities to exit agriculture, either for the secondary or tertiary sectors of each country, or by emigrating.
In many countries, agriculture still plays a crucial role in stabilising the balance of payments, by providing sometimes a significant portion of the foreign exchange reserves needed for imports. In the six countries under review, this contribution is tending to decrease, with the notable exception of Egypt and Lebanon. In the other countries, agriculture contributes between 10 percent (Tunisia) and 20 percent (Mauritania, Morocco and Sudan) of exports. This drop in the contribution to exports does not lead, however, to a greater reliance by the six countries on the international food market. There is a general trend towards a percentage reduction of the share of food imports in total imports of around 10 percent (Morocco, Mauritania, Tunisia) or 20 percent (Egypt, Lebanon, Sudan). Proactive agro-food export strategies are being implemented in countries that have started their structural transition: the growth of agricultural exports in volume remains lower than the growth of total exports. However, with the decline of food imports, we can say that the urbanization momentum reinforces the urban/rural connection on the domestic food market. Here, the stakes are likely to increase with the growing demographic weight of these countries. It will therefore be all the more important to redesign the domestic agro-food market through policies.
Figure 4.10 Effect of the three scenarios on irrigation water use and on irrigation water consumption
Fruit trees 339 MCM
Summer vegetables 84 MCM
Winter vegetables 87 MCM
Field crop 95 MCM
Illegal use of irrigation water 150 MCM
339 431.7 455 518.5
WATER USE
605.1
WATER CONSUMPTION
Source: Department of Statistics, FAOSTAT
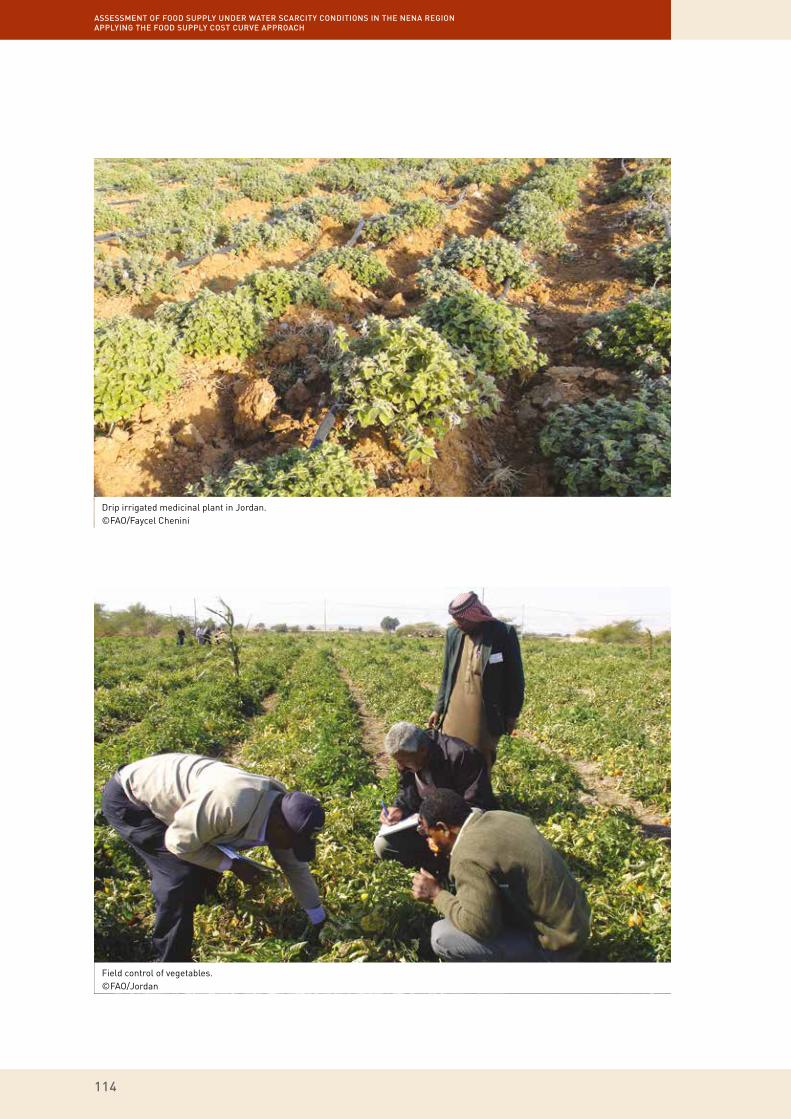
ASSESSMENT OF FOOD SUPPLY UNDER WATER SCARCITY CONDITIONS IN THE NENA REGION APPLYING THE FOOD SUPPLY COST CURVE APPROACH
114
Drip irrigated medicinal plant in Jordan. ©FAO/Faycel Chenini
Field control of vegetables. ©FAO/Jordan

115
Conclusions and recommendations
5.1 Conclusions
The analysis provided in this report shows the limitations on water use for agriculture in Jordan, reflecting the difficulty in balancing water use for food production with the requirements of other economic sectors. While agricultural water use is important in food production, it should be noted that water uses in other economic sectors are also important for economic development and job creation. Thus, water use efficiency is the key entry point of the analysis.
The term water use efficiency is still unclear as a concept or as a tool to measure productivity per m3 of water. Its use may be misleading, as the return on water use for a particular sector or crop may be higher, while consuming more water resources. Given that Jordan suffers from water scarcity, policies that encourage this may create a water demand crisis, especially since the country already suffers from a severe water deficit. The most suitable measure for planning water use for the different economic sectors, including agriculture, may be water efficiency for production. The use of this indicator may lead to lower monetary returns for water use, but it will inevitably lead to rational use of water resources.
The preceding discussion illustrates the difficulty of deciding on water management policy in Jordan, particularly since different international organizations are moving to adopt policies primarily concerned with water returns. Key questions addressing water returns depend largely on the prices of produced goods, which are subject to the rules of supply and demand. Adopting policies based on water returns may lead to an increase in production of agricultural products achieving a high-water yield, but the resulting increased supply may lower prices over time, which in turn will reduce the water yield of these crops. The current water policies, which are not based on economic research and thus overlook their long-term effects, will lead to great losses for farmers.
5
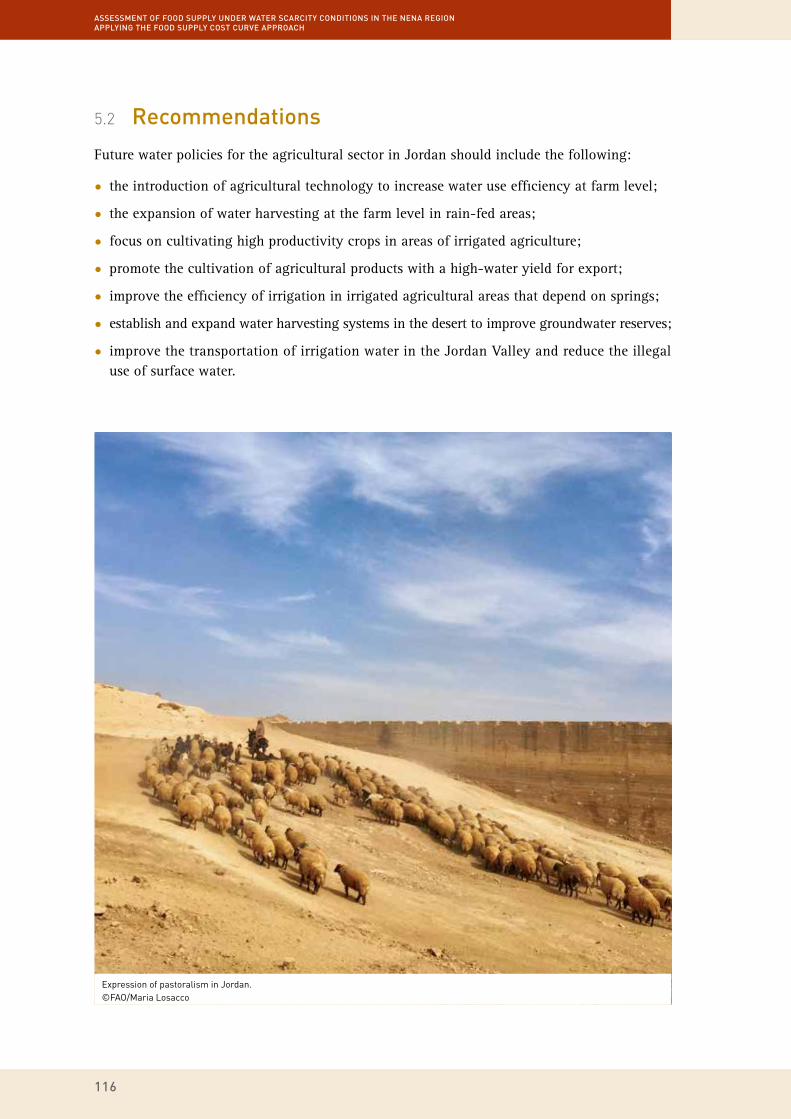
ASSESSMENT OF FOOD SUPPLY UNDER WATER SCARCITY CONDITIONS IN THE NENA REGION APPLYING THE FOOD SUPPLY COST CURVE APPROACH
116
5.2 Recommendations
Future water policies for the agricultural sector in Jordan should include the following:
• the introduction of agricultural technology to increase water use efficiency at farm level;
• the expansion of water harvesting at the farm level in rain-fed areas;
• focus on cultivating high productivity crops in areas of irrigated agriculture;
• promote the cultivation of agricultural products with a high-water yield for export;
• improve the efficiency of irrigation in irrigated agricultural areas that depend on springs;
• establish and expand water harvesting systems in the desert to improve groundwater reserves;
• improve the transportation of irrigation water in the Jordan Valley and reduce the illegal use of surface water.
Expression of pastoralism in Jordan. ©FAO/Maria Losacco

117
REFERENCES
ReferencesDepartment of Statistics. 2010. Results of a survey of organized farms and hatcheries using GPS 2010.
Amman.
Department of Statistics. 2012a. Statistical Yearbook, 2009, 2010, 2011, 2012. Amman.
Department of Statistics. 2012b. Food Balance Sheet, 2009, 2010, 2011, 2012. Amman.
FAO. 2017. FAOSTAT. Rome. [Cited 2017]. http://www.fao.org/faostat/en/#home
World Bank. 2017. World Bank Open Data. [Cited 2017]. http://data.worldbank.org/
Ministry of Agriculture. 2012. Yearbook 2009, 2010, 2011, 2012. Amman.
Ministry of Agriculture. 2012. Statistical Yearbook 2010, 2011, 2012. Amman.
Ministry of Agriculture. 2012. The general framework of strategic food security in Jordan. Amman.
FAO. 2013. Assessment of the Water Harvesting Sector in Jordan, Final Report. Amman.
Bassam, H. 2013. Baseline Assessment Study for SWIM-Sustain Water MED: Wastewater Treatment Plant for Public Security Directorate Compound in Moqabalane Area. Amman.
Samir, A. 2006. Guide for the use of reclaimed water in the Jordan Valley (Arabic version). Jordan Valley Authority. Amman.
Ministry of Water and Irrigation. 2009. Water for Life: Jordan’s Water Strategy 2008–2022. Amman.
Ministry of Planning and International Cooperation. 2006. National Agenda 2006–2015. Amman.
Ministry of Agriculture. 2013. Land and water situation in Jordan. Amman.
Bani Hani, M. 2005. Management of irrigation water in Jordan. AARDO - International Workshop: Role of modern irrigation techniques in improving food security. Amman.
Ministry of Agriculture. 2005. The national strategy for agricultural development 2002–2010. Amman.
Ministry of Agriculture. 2010. The agricultural document 2009. Amman.
Ministry of Agriculture. 2014. Water Resources and Land Use in Jordan, Country Report. Amman.
Al-Karablieh, E. 2012. Disaggregated Economic Value Of Water in Industry and Irrigated Agriculture in Jordan. USAID. Amman.
6
117

ASSESSMENT OF FOOD SUPPLY UNDER WATER SCARCITY CONDITIONS IN THE NENA REGION APPLYING THE FOOD SUPPLY COST CURVE APPROACH
118
A farmhand harvesting in a field in Dear Alla.©FAO/AFP/Khalil Mazraawi
Farmers harvesting onions in a field in Dear Alla.©FAO/AFP/Khalil Mazraawi
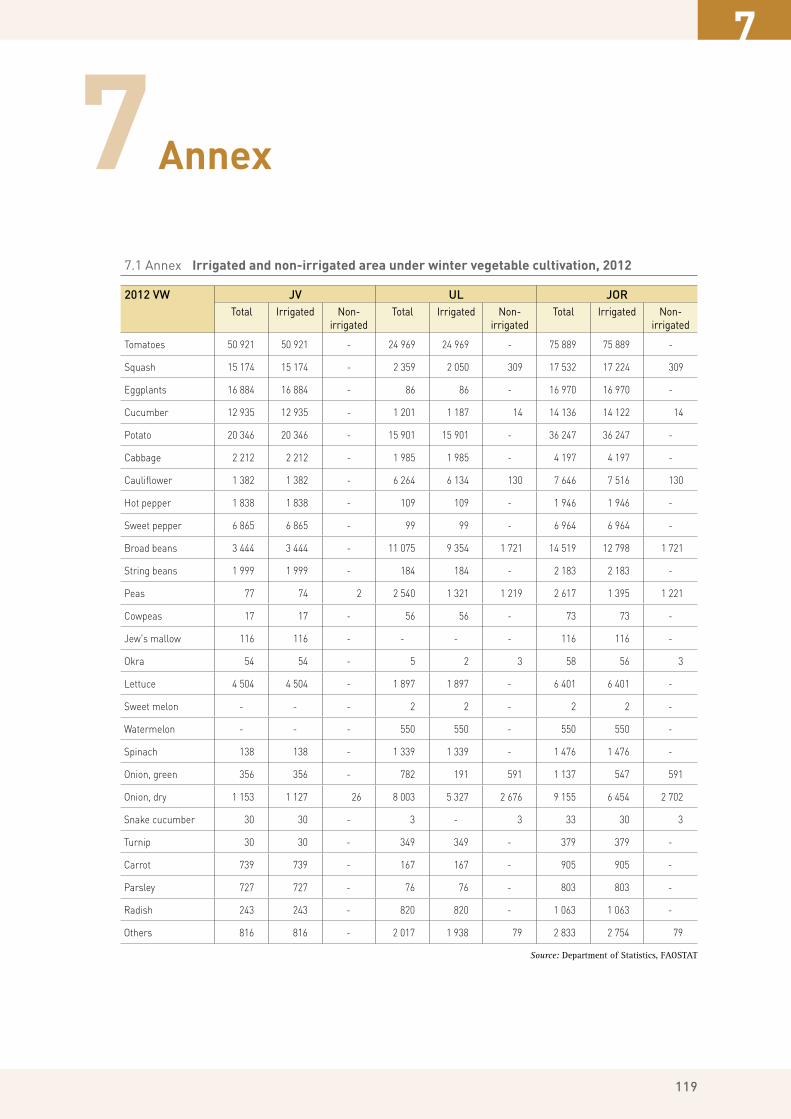
119
Annex
7.1 Annex Irrigated and non-irrigated area under winter vegetable cultivation, 2012
2012 VW JV UL JORTotal Irrigated Non-
irrigatedTotal Irrigated Non-
irrigatedTotal Irrigated Non-
irrigated
Tomatoes 50921 50921 - 24969 24969 - 75889 75889 -
Squash 15174 15174 - 2359 2050 309 17532 17224 309
Eggplants 16884 16884 - 86 86 - 16970 16970 -
Cucumber 12935 12935 - 1201 1187 14 14136 14122 14
Potato 20346 20346 - 15901 15901 - 36247 36247 -
Cabbage 2212 2212 - 1985 1985 - 4197 4197 -
Cauliflower 1382 1382 - 6264 6134 130 7646 7516 130
Hotpepper 1838 1838 - 109 109 - 1946 1946 -
Sweetpepper 6865 6865 - 99 99 - 6964 6964 -
Broadbeans 3444 3444 - 11075 9354 1721 14519 12798 1721
Stringbeans 1999 1999 - 184 184 - 2183 2183 -
Peas 77 74 2 2540 1321 1219 2617 1395 1221
Cowpeas 17 17 - 56 56 - 73 73 -
Jew'smallow 116 116 - - - - 116 116 -
Okra 54 54 - 5 2 3 58 56 3
Lettuce 4504 4504 - 1897 1897 - 6401 6401 -
Sweetmelon - - - 2 2 - 2 2 -
Watermelon - - - 550 550 - 550 550 -
Spinach 138 138 - 1339 1339 - 1476 1476 -
Onion,green 356 356 - 782 191 591 1137 547 591
Onion,dry 1153 1127 26 8003 5327 2676 9155 6454 2702
Snakecucumber 30 30 - 3 - 3 33 30 3
Turnip 30 30 - 349 349 - 379 379 -
Carrot 739 739 - 167 167 - 905 905 -
Parsley 727 727 - 76 76 - 803 803 -
Radish 243 243 - 820 820 - 1063 1063 -
Others 816 816 - 2017 1938 79 2833 2754 79
7
Source: Department of Statistics, FAOSTAT

ASSESSMENT OF FOOD SUPPLY UNDER WATER SCARCITY CONDITIONS IN THE NENA REGION APPLYING THE FOOD SUPPLY COST CURVE APPROACH
120
7.2 Annex Irrigated and non-irrigated area under summer vegetable cultivation, 2012
2012 JV UL JORTotal Irrigated Non-
irrigatedTotal Irrigated Non-
irrigatedTotal Irrigated Non-
irrigated
Tomatoes 3676 3676 - 51712 51062 650 55388 54738 650
Squash 3705 3705 - 8471 7864 607 12176 11569 607
Eggplants 14074 14074 - 4772 4772 - 18846 18846 -
Cucumber 328 328 - 6438 6366 71 6766 6694 71
Potato 1626 1626 - 18915 18915 - 20541 20541 -
Cabbage 181 181 - 2874 2874 - 3055 3055 -
Cauliflower 67 67 - 3690 3690 - 3757 3757 -
Hotpepper 1458 1458 - 2039 2039 - 3496 3496 -
Sweetpepper 2205 2205 - 2644 2644 - 4849 4849 -
Broadbeans 38 38 - 236 205 30 274 243 30
Stringbeans 840 840 - 2419 2419 - 3259 3259 -
Peas 8 8 - 1469 988 481 1477 996 481
Cowpeas 577 569 7 304 97 207 880 666 214
Jew'smallow 12496 12496 - 59 59 - 12555 12555 -
Okra 6506 6362 143 6241 1099 5141 12747 7462 5285
Lettuce 589 589 - 6646 6646 - 7235 7235 -
Sweetmelon 3993 3993 - 4722 4666 56 8714 8658 56
Watermelon 2611 2611 - 26702 26702 - 29313 29313 -
Spinach 45 45 - 115 115 - 160 160 -
Onion,green - - - 169 144 25 169 144 25
Onion,dry 279 279 - 2162 2085 76 2441 2364 76
Snakecucumber 983 983 - 3543 579 2963 4526 1562 2963
Turnip 19 19 - - - - 19 19 -
Carrot 17 17 - 536 536 - 553 553 -
Parsley 93 93 - 224 224 - 317 317 -
Radish 68 68 - 136 136 - 204 204 -
Others 805 805 - 2902 1973 930 3707 2777 930
Source: Department of Statistics, FAOSTAT
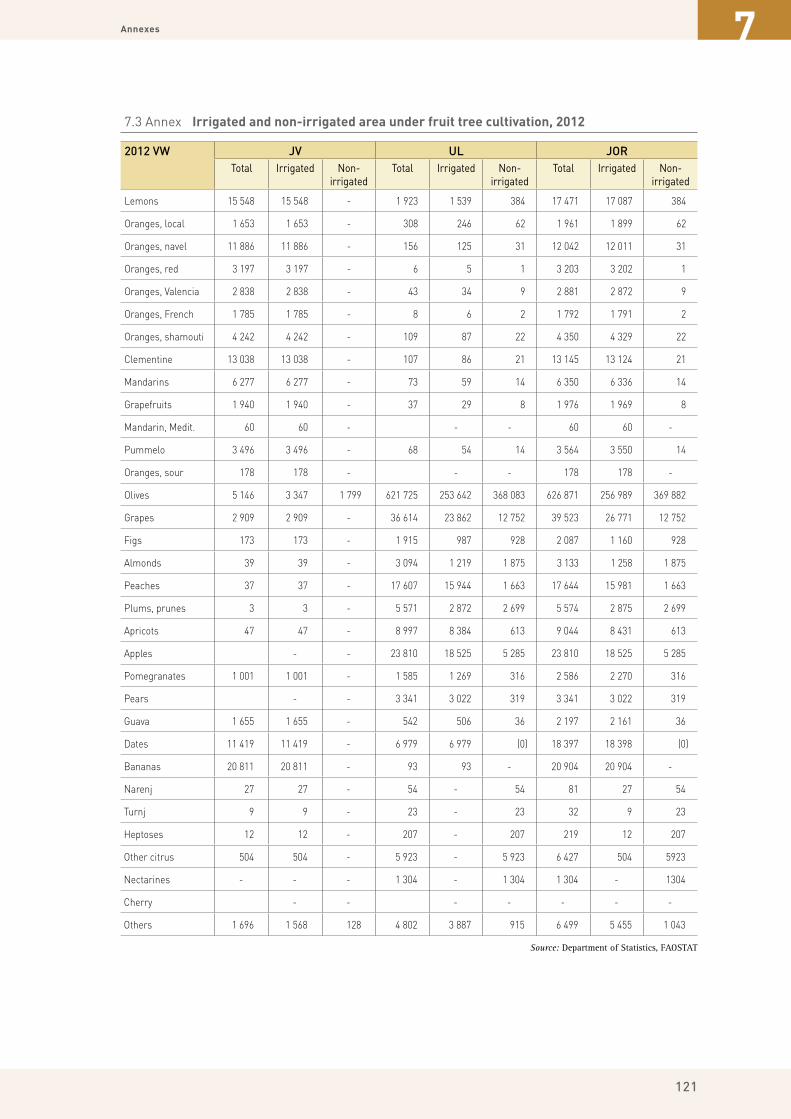
Annexes
121
7.3 Annex Irrigated and non-irrigated area under fruit tree cultivation, 2012
2012 VW JV UL JORTotal Irrigated Non-
irrigatedTotal Irrigated Non-
irrigatedTotal Irrigated Non-
irrigated
Lemons 15548 15548 - 1923 1539 384 17471 17087 384
Oranges,local 1653 1653 - 308 246 62 1961 1899 62
Oranges,navel 11886 11886 - 156 125 31 12042 12011 31
Oranges,red 3197 3197 - 6 5 1 3203 3202 1
Oranges,Valencia 2838 2838 - 43 34 9 2881 2872 9
Oranges,French 1785 1785 - 8 6 2 1792 1791 2
Oranges,shamouti 4242 4242 - 109 87 22 4350 4329 22
Clementine 13038 13038 - 107 86 21 13145 13124 21
Mandarins 6277 6277 - 73 59 14 6350 6336 14
Grapefruits 1940 1940 - 37 29 8 1976 1969 8
Mandarin,Medit. 60 60 - - - 60 60 -
Pummelo 3496 3496 - 68 54 14 3564 3550 14
Oranges,sour 178 178 - - - 178 178 -
Olives 5146 3347 1799 621725 253642 368083 626871 256989 369882
Grapes 2909 2909 - 36614 23862 12752 39523 26771 12752
Figs 173 173 - 1915 987 928 2087 1160 928
Almonds 39 39 - 3094 1219 1875 3133 1258 1875
Peaches 37 37 - 17607 15944 1663 17644 15981 1663
Plums,prunes 3 3 - 5571 2872 2699 5574 2875 2699
Apricots 47 47 - 8997 8384 613 9044 8431 613
Apples - - 23810 18525 5285 23810 18525 5285
Pomegranates 1001 1001 - 1585 1269 316 2586 2270 316
Pears - - 3341 3022 319 3341 3022 319
Guava 1655 1655 - 542 506 36 2197 2161 36
Dates 11419 11419 - 6979 6979 (0) 18397 18398 (0)
Bananas 20811 20811 - 93 93 - 20904 20904 -
Narenj 27 27 - 54 - 54 81 27 54
Turnj 9 9 - 23 - 23 32 9 23
Heptoses 12 12 - 207 - 207 219 12 207
Othercitrus 504 504 - 5923 - 5923 6427 504 5923
Nectarines - - - 1304 - 1304 1304 - 1304
Cherry - - - - - - -
Others 1696 1568 128 4802 3887 915 6499 5455 1043
Source: Department of Statistics, FAOSTAT

ASSESSMENT OF FOOD SUPPLY UNDER WATER SCARCITY CONDITIONS IN THE NENA REGION APPLYING THE FOOD SUPPLY COST CURVE APPROACH
122
7.4 Annex Irrigated and non-irrigated area under field crop cultivation, 2012
2012 JV UL JORTotal Irrigated Non-
irrigatedTotal Irrigated Non-
irrigatedTotal Irrigated Non-
irrigated
Wheat 8585 6936 1649 204378 1580 202799 212964 8516 204448
Barley 2509 1994 514 852107 8326 843781 854616 10320 844296
Lentils 819 - 819 1976 - 1976 2795 - 2795
Vetch - - 3198 - 3198 3198 - 3198
Chickpeas - - 13305 248 13057 13305 248 13057
Maize 12917 12917 - 689 689 - 13606 13606 -
Sorghum 1525 1525 - 6308 6308 - 7832 7832 -
Broommillet - - - - - - -
Tobacco,local - - 112 112 - 112 112 -
Garlic 169 169 - 503 503 - 672 672 -
Vetch,common 4 4 - 6376 460 5916 6380 464 5916
Sesame 15 15 - 16 - 16 31 15 16
Clover,trifoliate 3796 3796 - 32803 32803 - 36599 36599 -
Alfalfa 5 5 - - - 5 5 -
Others 73 72 1 3045 1718 1327 3118 1790 1329
7.5 Annex Area cultivated and production, 2012
Crop Area (1 000 dunums) Production (1 000 tons) Average Yield (kg/dunum)
Barley 854.6 32.1 0.1
Olives 626.9 155.6 0.3
Wheat 213.0 19.2 0.1
Tomatoes 123.4 738.2 6.0
Potato 60.4 141.6 2.3
Grapes 39.5 35.7 1.2
Clover,trifoliate 36.6 148.3 4.1
Eggplants 35.8 121.2 3.4
Squash 29.5 69.0 2.3
Watermelon 29.3 108.7 3.7
Apples 23.8 36.4 1.5
Bananas 20.9 38.9 3.1
Cucumber 20.8 155.9 7.5
Lettuce 19.0 39.5 2.1
Dates 18.4 10.4 0.8
Peaches 17.6 28.1 1.6
Lemons 17.5 26.5 1.6
Chickpeas 14.1 3.7 0.3
Broadbeans 13.8 13.6 1.0
Maize 13.6 14.4 1.1
Cauliflower 13.4 39.8 3.0
Clementines 13.1 24.0 2.0
Okra 12.8 5.9 0.5
Jew'smallow 12.7 25.9 2.1
Oranges,navel 12.0 16.3 1.6
Source: Department of Statistics, FAOSTAT

Annexes
123
7.5 Annex Area cultivated and production, 2012
Crop Area (1 000 dunums) Production (1 000 tons) Average Yield (kg/dunum)
Sweetpepper 11.7 56.4 4.8
Onion,dry 10.3 26.5 2.6
Apricots 9.0 8.0 0.9
Cabbage 9.0 39.5 4.4
Sweetmelon 8.7 42.0 4.8
Sorghum 7.8 18.4 2.4
Othervegetables 7.6 22.2 2.9
Stringbeans 6.9 11.6 1.7
Otherfruits 6.5 3.9 0.7
Vetch,common 6.4 5.9 1.0
Mandarin 6.4 11.8 2.0
Nectarines 5.9 11.7 2.0
Plums,prunes 5.6 4.1 0.7
Hotpepper 5.4 15.8 2.9
Peas 4.8 3.8 0.8
Snakecucumber 4.6 5.7 1.3
Oranges,shamouti 4.4 7.4 1.7
Pummelo 3.6 4.8 1.4
Pears 3.3 2.7 0.8
Oranges,red 3.2 6.2 1.9
Vetch 3.2 0.3 0.1
Almonds 3.1 1.9 0.6
Otherfieldcrops 3.1 0.2 0.1
Oranges,Valencia 2.9 6.0 2.1
Pomegranates 2.6 2.4 1.1
Guava 2.2 2.1 1.0
Figs 2.1 0.9 0.5
Lentils 2.0 0.1 0.1
Grapefruits 2.0 3.3 1.7
Oranges,local 2.0 1.9 1.0
Oranges,French 1.8 2.9 1.6
Carrot 1.8 6.7 3.8
Cherry,red 1.3 0.7 0.5
Parsley 1.1 4.1 3.7
Cowpeas 0.9 0.6 0.7
Onion,green 0.9 3.0 3.4
Radish 0.8 2.0 2.4
Othercitrus 0.7 0.5 1.1
Garlic 0.7 0.7 1.1
Spinach 0.4 1.3 3.0
Turnip 0.2 0.6 2.7
Souroranges 0.2 0.0 0.0
Tobacco,local 0.1 0.0 0.1
Lemon,sweet 0.1 0.1 0.7
Mandarin,Medit. 0.1 0.1 2.2
Sesame 0.0 0.0 0.2
Narenj 0.0 0.0 0.7
Heptoses 0.0 0.0 1.5
Turnj 0.0 0.0 0.8
Alfalfa 0.0 0.0 1.6
Broommillet 0.0 0.0
Tobacco,red 0.0 0.0
2,459.9 2,399.5 134.8
Source: Department of Statistics, FAOSTAT

ASSESSMENT OF FOOD SUPPLY UNDER WATER SCARCITY CONDITIONS IN THE NENA REGION APPLYING THE FOOD SUPPLY COST CURVE APPROACH
124
7.6 Annex Food Gap and SSR, 2010, 2011 and 2012
2010 2011 2012Prod.
(1000 Ton)
Food (1000 Ton)
SSR (%)
Food Gap
(1000 Ton)
Food Gap (%)
Prod. (1000 Ton)
Food (1000 Ton)
SSR (%)
Food Gap
(1000 Ton)
Food Gap (%)
Prod. (1000 Ton)
Food (1000 Ton)
SSR (%)
Food Gap
(1000 Ton)
Food Gap (%)
Oilcrops 229.1 71.4 320.90 157.7 220.90 154.1 36.1 426.90 118 326.90 194.9 54.5 357.60 140.4 257.60
Vegetables 1616.5 959.3 168.50 657.2 68.50 1697.7 806.7 210.40 891 110.40 1570.3 758.2 207.10 812.1 107.10
Eggs 69.3 46.2 150.00 23.1 50.00 69.3 49.2 140.90 20.1 40.90 61.8 44.6 138.60 17.2 38.60
Starchyroots 175 181.4 96.50 -6.4 -3.50 216.5 233.6 92.70 -17.1 -7.30 141.6 183 77.40 -41.4 -22.60
Fruit,excludingwine
288.3 372.8 77.30 -84.5 -22.70 318.8 415.3 76.80 -96.5 -23.20 305.1 399.4 76.40 -94.3 -23.60
Meat 216.9 284.2 76.30 -67.3 -23.70 225.4 310.3 72.60 -84.9 -27.40 234.6 331.8 70.70 -97.2 -29.30
Milk,excludingbutter
349.4 503.3 69.40 -153.9 -30.60 306.9 441.4 69.50 -134.5 -30.50 310.4 445.6 69.70 -135.2 -30.30
Aquaticproducts,other
33.1 75.9 43.60 -42.8 -56.40 38.4 88.5 43.40 -50.1 -56.60 42.8 103.7 41.30 -60.9 -58.70
Vegetableoils 25.4 97.9 26.00 -72.5 -74.00 34.6 143.3 24.10 -108.7 -75.90 24.6 144.7 17.00 -120.1 -83.00
Pulses 2 24.3 8.20 -22.3 -91.80 2 23.4 8.60 -21.4 -91.40 2 24.8 8.10 -22.8 -91.90
Cereals,excludingbeer
62 989.8 6.30 -927.8 -93.70 66 1024.3 6.40 -958.3 -93.60 66 1054.3 6.30 -988.3 -93.70
Fish,seafood 1 23.1 4.30 -22.1 -95.70 1.1 37 3.00 -35.9 -97.00 1.2 29.4 4.10 -28.2 -95.90
Sugarandsweeteners 0.2 299.8 0.10 -299.6 -99.90 0.2 276.2 0.10 -276 -99.90 0.2 334.1 0.10 -333.9 -99.90
Total 3 068.2 3 929.4 -861.2 3 131 3 885.2 -754.2 2 955.5 3 908 -952.5
Source: Department of Statistics, FAOSTAT

Annexes
125
7.7 Annex Mean maximum air temperature (°C), 1960-2013
Year JAN FEB MAR APR MAY JUN JUL AUG SEPT OCT NOV DEC1960
ST
AT
IO
N:
I
RB
ID
EL
EM
EN
T C
OD
E:
ME
AN
MA
XI
MU
M A
IR
TE
MP
ER
AT
UR
E (
°C)
14.8 17.6 17.1 22.1 30.7 30.8 32.9 33.4 31 30.1 21.5 18.4
1961 12.5 12.7 16.4 23.3 28.8 32.4 32.7 32.7 28.7 27.3 20.6 15.5
1962 13.4 13.5 20.7 22.2 28.2 32.4 32.9 33.7 32.5 28.8 24.4 16.4
1963 16.8 16.9 16.4 23.2 25.7 31.8 32.6 33.8 32 28.9 22.9 15.9
1964 10.7 13.3 18.3 20.9 25.7 30.5 31.4 31.6 29.8 29.9 21.6 15.4
1965 12.4 15.7 19.8 20.5 27.5 33.1 32.5 31.5 29.9 23.3 20.3 15.7
1966 14.9 15.4 17.7 23 26.3 31 31.2 31.6 28.6 26.2 23.7 15
1967 12.1 11.4 13.9 20.3 24.8 28.9 30.5 30.8 28.3 26.2 18.8 15.3
1968 11.5 14 16 22.9 28.3 30 32.2 31.6 28.8 25 20.9 15.3
1969 11.2 15.9 18.4 19.6 27.5 30.9 29.7 31.3 31 25.4 20.9 16.7
1970 14.1 15.8 18.7 23.8 26.9 29.3 30 30.7 29 26.1 21.3 13.4
1971 15.9 14.1 17.7 18.2 27.4 29 29.3 30.5 29.9 25.5 19.4 11.8
1972 12 12.5 16.5 23.3 25.3 28.5 29.1 30.5 30.6 27.7 19.7 13.2
1973 13.1 17.4 16.9 21.8 26.7 28.9 31.5 30.7 30.4 27.8 17.4 14.8
1974 9.7 13.6 17.7 20.9 26.3 29.7 30.9 29.9 29 28.4 20.8 13.5
1975 12.6 12.9 17.7 24.1 25.8 28.6 30.6 29.3 28.8 25.6 20.2 12.9
1976 12.8 11.6 16.2 20.6 26.7 28.9 29.2 29.1 28.2 26.5 22.4 16.2
1977 11.6 18.1 16.7 20.5 27 29.6 31.4 32.5 28.9 24 21.5 13.3
1978 13.9 16.1 18 22.3 29.2 29.6 32.1 29.7 28.5 27.9 18.4 15.5
1979 14.2 17 18.5 24.2 26.2 30.6 30.4 30.7 29.9 26.6 22.6 12.8
1980 11.6 12.5 16.2 21.2 28 30.3 30.2 30.4 28 26.5 21.7 15.3
1981 12.3 13 17.7 21.8 25 29.5 30.5 30.4 30.8 27.7 17.9 16.8
1982 13.7 12.2 14.9 23.5 24.9 29 29.4 30.3 29.2 26 16.6 12.6
1983 9.3 11.4 15.1 19.8 25.5 29 30.2 30.1 28.6 24.7 21.4 15.8
1984 13.5 16.1 17.5 19.8 27.3 28.4 29.9 29.1 30 26.7 19.2 13
1985 14.9 11.9 18.1 21.6 26.7 28.9 30.2 32.6 29.8 24 22.6 15.3
1986 13.6 15.4 18.5 24.2 23 28.8 30.4 30.5 31 25.8 16 13.2
1987 14.9 16.5 13.5 19.9 27.1 29 31.4 31.6 30.3 24.4 21 14.6
1988 12 12.9 15.1 21.8 28.2 29.7 32.2 30.9 30.4 24.6 17.9 14.2
1989 10.2 13.7 16.7 27.4 28.2 28.8 31 30.8 29.4 24.9 20.7 15
1990 10.8 12.4 16.3 21.5 26 29.4 30.8 30.7 28.8 27.5 23.2 17.5
1991 12.6 14.2 18 23.3 25.8 29.3 29.5 29.8 29.3 27.1 21.2 11.8
1992 9.2 8.8 14.3 20.6 24.9 28.5 29.6 31.3 29.1 28.2 19.7 11.3
1993 12 11.4 16.6 22.8 24.8 30.4 30.8 31.8 29.7 28.5 19.1 17.8
1994 14.4 14 16.6 25.5 28.4 29.4 30.6 31.6 31.7 29.1 17.6 12.1
1995 13.7 14.6 17.7 21.6 27.6 30.5 30.7 31.4 30.2 25.5 18.7 14.6
1996 13 15.4 15.7 20.8 28.5 29.8 31.7 32 30 24.7 20.9 16.7
1997 14.7 11.9 14.1 19.6 28.5 29.8 31.3 29.2 28.5 26.7 20.6 15.4
1998 12.2 14 15.3 23.1 27.5 29.7 31.9 33.6 30.9 27.6 23.5 17
1999 15 15.8 18.2 22.4 29 29.3 31.3 32.7 30.8 26.6 22 18.6
2000 12.2 13.8 16.1 23.6 26.7 30.9 34.2 31.7 29.7 24.9 22 15.6
2001 15.2 14.9 22.6 24.7 27.7 31.4 32.3 32.2 29.6 26.5 20 15.8
2002 11.8 17.3 20.1 20.8 25.9 30.1 32.9 31.9 31 28.5 21.7 14.2
2003 15.6 12.4 14.4 21.9 30.7 30.2 31.8 32.6 29.5 27.4 21.4 14.9
2004 13.4 15 20.4 23.4 26.8 29.9 32.8 31.2 30.9 28.3 20.4 14.2
2005 13.9 13.2 19 23.1 26.2 29.3 31.9 32 29.9 25.7 19.9 18.2
2006 13.3 15.3 18.8 21.9 27 30.6 30.7 32.3 31 25.4 19.3 14.5
2007 13.4 14.9 17.3 21.4 28.7 30.7 32.2 31.8 30 27.8 21 15.2
2008 10.8 14.3 22.2 25.5 26.6 31.4 32.1 32.6 30.3 25.8 22 16.9
2009 14.7 15.5 16.5 22.5 26.6 32.1 31.9 32.1 29.4 29.4 19.6 16.8
2010 16.8 17.6 21.2 24.5 28.2 30.7 32.2 34.6 31.7 29.5 26.7 18.3
2011 14.8 15 18.2 21.3 25.8 28.7 32.9 31.7 30.1 25.8 17.7 16
2012 12.4 13.2 16.3 24.4 27.5 31.8 33.4 32.7 31.5 28.9 21.8 16.3
2013 13.9 16.6 21.2 22.7 28.9 30.1 30.9 32 29.6 25.9 23.1 13.8
Source: Department of Statistics, FAOSTAT

ASSESSMENT OF FOOD SUPPLY UNDER WATER SCARCITY CONDITIONS IN THE NENA REGION APPLYING THE FOOD SUPPLY COST CURVE APPROACH
126
7.8 Annex Mean minimum air temperature (°C), 1960-2013
Year JAN FEB MAR APR MAY JUN JUL AUG SEPT OCT NOV DEC AvW Av Sp
Av Su
Av Aut
1960
ST
AT
IO
N:
I
RB
ID
EL
EM
EN
T C
OD
E:
ME
AN
MI
NI
MU
M A
IR
TE
MP
ER
AT
UR
E (
°C)
7.4 7 8.1 11.8 16.8 17.5 18.7 20.1 16.7 17.4 11.6 7.4 7.3 12 19 15
1961 4.4 4.3 5.2 9.8 14.1 18 18.8 19.3 16 13.1 8.6 7.1 5.3 9.7 19 13
1962 5.2 6.2 7.9 8.9 13 17.2 18.3 20 17.9 15.7 12 7 6.1 9.9 19 15
1963 6.7 7.2 5.9 10.1 12.4 17 19.1 19.9 18.4 16.2 10.4 5.2 6.4 9.5 19 15
1964 1.3 5.1 8.5 9 10.9 16.1 17.4 18.2 16.3 14 10.1 5.5 4 9.5 17 13
1965 4.4 5 6.9 8.8 12.3 18.2 18.5 19.2 18.4 13.2 9.1 7.2 5.5 9.3 19 14
1966 6.2 6.8 6.9 10.6 13.5 18.1 19.3 19.3 17.8 15.6 11.7 6.8 6.6 10 19 15
1967 3.6 3.4 5.4 9.1 13 16.3 18.5 19.3 17.6 14.6 9 7.1 4.7 9.2 18 14
1968 3.8 4.6 6.5 12 15.8 18.1 20.3 19.7 17.3 14.8 11.1 7.7 5.4 11 19 14
1969 5 5.7 8.7 8.7 14.6 18.3 18 19 19 15.1 9.5 7 5.9 11 18 15
1970 5.9 6.8 8.7 11.4 13.9 17.3 18.7 19.2 18.2 13.9 11.4 4.3 5.7 11 18 15
1971 5.7 5.4 7.3 9.3 14.8 17.2 18.1 19.3 18 13.7 10.1 4.6 5.2 10 18 14
1972 3 2 7.1 11.4 13.2 16.6 18.2 19.3 18.6 16 9.7 2.9 2.6 11 18 15
1973 2.9 6.7 6.8 9.6 14.9 16.7 19.3 19.1 18.3 15.9 6.9 6.2 5.3 10 18 14
1974 2.6 4.9 8.5 9.6 13.2 17.4 19.3 18.8 17.9 16.9 10.9 5.6 4.4 10 19 15
1975 4.5 5 6.7 12.2 13.3 16.9 19.1 18.7 17.6 13.5 10.3 4.6 4.7 11 18 14
1976 4.4 3.6 6 9.6 13.4 16.3 18.1 18.2 16.9 15.6 10.2 7.1 5 9.7 18 14
1977 3.2 7.5 7 9.9 14.8 17.5 19.6 20.2 17.9 12.8 10.5 5.9 5.5 11 19 14
1978 5.8 6 8.1 10.1 15.4 17.6 21.1 18.5 17.6 16.2 7.5 8 6.6 11 19 14
1979 5.6 7.8 9.2 11.8 14.2 19.4 19.2 19.1 18.3 15.6 11.8 5.4 6.3 12 19 15
1980 4.2 5.1 6.6 10.6 14.6 17.7 19.3 19.5 16.9 15 10.4 7.4 5.6 11 19 14
1981 5 6 8.5 11.1 13 17.5 19.7 19.5 18.6 16.3 8.5 7.9 6.3 11 19 14
1982 5.8 4.1 6.2 12.2 13.9 17.3 18.7 19.4 18.4 15.7 8.2 5 5 11 18 14
1983 2.2 4.2 6.8 10.1 14.2 17.2 19 19.3 18.2 14.2 2.7 7 4.5 10 19 12
1984 6.4 5.6 8.6 10.4 15.2 17 18.8 18.5 18.3 15.1 10.1 3.4 5.1 11 18 15
1985 7 3.9 5.8 10.8 16.1 17.5 18.5 20.9 18.5 13.9 11.5 7.3 6.1 11 19 15
1986 5.5 7.2 8.9 12.6 12.3 17.6 19 19.5 19.9 15.6 8.3 5.3 6 11 19 15
1987 6.4 6.9 4.9 9.3 13.7 17 19.8 20.2 18.5 14.6 9.1 7.7 7 9.3 19 14
1988 5.7 5.5 7.4 10.6 15.2 17.6 20.4 20.2 19.1 14.9 8.7 6.6 5.9 11 19 14
1989 2.4 4.2 7.7 14 15.6 16.7 19.4 19.4 18.1 14.6 11.4 6.8 4.5 12 19 15
1990 3.6 4.9 6.8 10.3 14.1 17.1 19.5 19.2 17.8 16.1 12.1 7.7 5.4 10 19 15
1991 5.1 5.5 9.1 11.7 14.5 17 18.6 19.5 18 16.7 11.2 5.4 5.3 12 18 15
1992 2.6 2.8 5.4 9.9 9 17.2 18.5 20 17.9 16.2 9.7 4.8 3.4 8.1 19 15
1993 3.2 3.7 6.4 10.8 13.5 17.9 19.4 20.3 18.5 17 9.1 7.9 4.9 10 19 15
1994 7.1 6.2 8.3 13.1 16 17.4 19.5 19.9 20.3 17.9 10.2 4 5.8 12 19 16
1995 6 5.8 7.7 9.9 15.1 18.2 19.7 20.5 19 14.8 8.6 5.1 5.6 11 19 14
1996 5.2 7 7.6 9.6 15.9 17.6 20.5 20 18.8 14.1 10.1 8.3 6.8 11 19 14
1997 5.2 3 5.7 8.9 15.8 17.8 20.3 19.1 17.8 15.3 10.9 7.5 5.2 10 19 15
1998 4.8 5.3 6.6 11.7 15.1 17.9 20.5 21.6 20.1 16.1 13 8.2 6.1 11 20 16
1999 5.8 6.4 8.7 11.1 16.1 18.1 20 20.9 19 16.1 10.9 7.2 6.5 12 20 15
2000 4.4 5 6.9 12.2 14.6 18.4 21.3 20.6 19 14.8 9.8 7.2 5.5 11 20 15
2001 5.8 6.4 11.2 12.6 15.7 18.7 20.3 20.7 19 16.5 10.1 7.3 6.5 13 20 15
2002 3.9 7.3 9.5 10.9 14.1 17.8 21.4 21 19.4 17.1 11 6.1 5.8 12 20 16
2003 7.3 5.6 6.4 11 17.4 18.4 20.3 20.8 18.3 16.1 10.8 6.1 6.3 12 20 15
2004 6.1 5.9 9.6 11.3 14 17.6 20.5 19.9 18.6 16.8 10.6 4.6 5.5 12 19 15
2005 5.7 5.2 8.6 12 14.5 17.4 20.5 21 19.1 14.7 9.8 8.4 6.4 12 20 15
2006 5.7 6.3 8.8 11.7 15 18.6 19.8 21.1 19.4 15.7 8.8 4.8 5.6 12 20 15
2007 4.7 6.6 7.7 10.6 16.3 18.9 21 20.8 19.1 16.9 11.3 6.8 6 12 20 16
2008 1.9 5.1 11.5 13.4 14.4 19.1 20.6 21.3 19.6 16.1 11.4 7.3 4.8 13 20 16
2009 5.6 7.2 7.8 11.2 15.2 19.6 21.1 20.8 18.7 17.4 10.5 8.5 7.1 11 21 16
2010 7.4 8.1 10.5 12.1 15.3 18.8 20.1 22.6 20.4 17.8 12.9 8 7.8 13 21 17
2011 6.5 6.9 7.9 11.3 14.6 17.2 20.4 20.6 19 14 8 5.5 6.3 11 19 14
2012 5.4 4.1 6 11.9 15.4 18.9 22 21.6 19.5 17.3 12.8 7.8 5.8 11 21 17
2013 5.2 7.8 9.5 11.3 16.2 18.2 19.2 20.2 18.5 13.2 12.6 4.6 5.9 12 19 15
Source: Department of Statistics, FAOSTAT

Annexes
127
7.9 Annex Total amount of rainfall (mm), 1960-2013
Year JAN FEB MAR APR MAY JUN JUL AUG SEPT OCT NOV DEC1960
ST
AT
IO
N:
I
RB
ID
EL
EM
EN
T C
OD
E:
TO
TA
L R
AI
NF
AL
L A
MO
UN
T (
mm
)45.1 24.8 91.4 26 1 0 0 0 0 0 84.3 68.3
1961 74.2 89.4 34.7 15.8 2.6 0 0 0 0 3.4 23.2 250.9
1962 82.6 90.9 3.7 15.6 0 0 0 0 0 0.4 0 73.6
1963 59.1 135.7 73.6 26.7 23.8 0 0 0 0 37.5 22.7 97.5
1964 87.1 156 103.5 4.9 12.8 0 0 0 0 0 107.7 55
1965 145.8 67.9 43.8 44.2 0.4 0 0 0 0 52.1 20 68.2
1966 49.3 70.9 127.3 6.9 3.7 0 0 0 0 38.3 32.5 191.3
1967 188.1 74.8 215 5.5 8.7 0 0 0 0 13.3 76.2 78.5
1968 236.9 46.8 31.8 20.9 14.7 0 0 0 0 15.8 28.3 162.5
1969 162.2 43.9 143.2 14.6 0 0 0 0 5.6 29.8 44.3 29.8
1970 140.3 46.4 154.2 28.6 0.7 0 0 0 0 11.2 18.9 87
1971 74.9 146.4 70.5 192.6 1 1 0 0 0 0 26.4 164.7
1972 81.6 112.3 60 35.2 5 0.9 0 0 0 6.6 28.5 16.5
1973 156.1 33 96.4 4.4 7 0 0 0 0 9 88.2 56.9
1974 270.5 94.7 69.5 40.1 0 0 0 0 0 0 20.5 49.5
1975 38.4 154.6 78.7 6.1 0.1 0 0 0 2.8 1 54.1 92.6
1976 61.4 103.5 83.3 31.6 15.4 0 0 0 0 16.8 58.5 28.8
1977 103.4 26.2 102.7 75.7 3.3 0.3 0 0 0 17 11.9 131.5
1978 64 66.3 121.9 13.5 0.7 0.2 0 0 0 25.1 3.4 46.6
1979 64 21.7 73.6 6.9 0 0 0 0 0 40.6 111.8 198.1
1980 116.9 109.6 142.8 19.3 3.6 0 0 0 0 21.2 10 147.1
1981 111.4 71.6 47.2 18.8 0.1 0 0 0 0 0 55.3 28.1
1982 71.5 114.3 95.7 5.7 38.5 0 0 0 2.4 4.1 62.1 47.9
1983 148.7 219.1 110 20.5 5 0 0 0 0 2.4 44.7 15.9
1984 117.6 42.9 146 77.2 0 0 0 0 0 30.6 52 73.9
1985 48.1 245.9 22.5 11.2 0.6 0 0 0 0 18.9 35 30.7
1986 103.5 106.3 37.3 35.2 28.9 0 0 0 0 31 214.5 103.4
1987 89.7 43 114.4 1.8 0 0 0 0 0 15.5 8.2 126.6
1988 133.9 149.3 115.2 16.7 0 0 0 0 0 6.4 35.3 107
1989 30.3 47.6 59.1 0 0 20.2 0 0 0 10.2 54 50.3
1990 152.2 68.4 97.7 30.2 0.6 0 0 0 0 4.2 22.9 22.3
1991 165.7 48.4 91.2 45.9 2.9 0 0 0 0 0 58.3 233.3
1992 214.6 336 36.2 4.4 12.1 18 0 0 0 0 58.9 197.5
1993 73.4 62.8 34.6 0 33.2 0 0 0 0.4 17.3 17 20.8
1994 118.1 69.5 102.8 2 1.4 0 0 0 7.7 12.7 152.3 119.8
1995 17.8 63.7 37.8 21.4 1.6 0 0 0 0 5.5 77.3 27.7
1996 110.1 21.4 126.5 18.1 0 0 0 0 0 25 26.1 53
1997 86.2 191.9 93.8 21 5.2 0 0 0 4.2 17.4 43.1 95.5
1998 122.8 60.8 170.6 10.8 3.7 0 0 0 0.5 2 2.1 27.1
1999 69 66.9 41.9 7.8 0 0 0 0 0 0 7.6 21.2
2000 222.2 68.3 44.7 2.3 0 0 0 0 0 22.2 3 84.2
2001 53.3 82 17.4 3.9 11.6 0 0 0 0 6.9 51.1 74.5
2002 133.3 40.4 117.7 65.8 4 0 0 0 0 14.9 36.3 205.1
2003 54.6 317.3 214.7 39.3 0.2 0 0 0 0 15.5 15 89.7
2004 125.4 111.6 28.7 2.5 3.8 0 0 0 0 26 129.3 20.4
2005 89.3 186.8 19.4 12.3 16.6 0 0 0 0 2.3 41.3 79.6
2006 76.3 123.3 12.7 57 0 0 0 0 0 46.6 23.3 32.8
2007 70.8 114.7 83.7 23.1 6.4 0 0 0 0 0 56.4 23.7
2008 118 70.3 13.4 0.2 6 0 0 0 2.1 6.1 11.6 72.3
2009 11.6 227.6 87.6 38.8 0 0 0 0 3.2 23.8 71.8 122
2010 99.4 97.4 1.3 0.2 0.7 0 0 0 0 16 0 99.6
2011 62.3 106.4 72.2 81.7 9 0 0 0 1.3 1.2 59.4 44.1
2012 97 162.6 110.1 0.3 1.4 9.2 0 0 0.4 5.3 58.4 82.1
2013 294.7 19 4.4 45.6 13 0 0 0 0 34.4 2 153.5
Source: Department of Statistics, FAOSTAT

Policy makers, water resources managers, irrigation developers and financial institutions are invited to provide their views and feedbacks to our dedicated e-mail: [email protected]
CA1156EN/1/09.18
ISBN 978-92-5-130872-1
9 7 8 9 2 5 1 3 0 8 7 2 1