assessment of field size on radiotherapy machines using
TRANSCRIPT

Sudan Medical Monitor | Jan-Mar 2014 | Vol 9 | Issue 1 5
Address for correspondence: Dr. Yousif M. Y. Abdallah, Department of Radiotherapy and Nuclear Medicine, College of Medical Radiological Science, Sudan University of Science and Technology, Khartoum, Sudan. E‑mail: [email protected]
Assessment of field size on radiotherapy machines using texture analysis
Yousif M. Y. Abdallah, Menas A. Boshara
Department of Radiotherapy and Nuclear Medicine, College
of Medical Radiological Science, Sudan University of Science and
Technology, Khartoum, Sudan
AbstractThe main objective of this study was to verify the superimposition of light and radiation field automatically using image processing technique. For radiotherapy machines (Co‑60 and linear accelerator), each film scanned using digitizer scanner then treat using image processing program MatLab, where the congruence of the light and radiation field should be determined. The scanned image saved in a TIFF file format to preserve the quality of the image. The data analyzed include upper, lower, right, and left borders of the light and radiation field in megavoltage films. The result showed that the mean light field size was 10.0 × 10.1 cm, medical physicist score was 10.2 ± 0.11608 cm × 10.2 ± 0.099861 cm, and the field size that calculated by computerized score using MatLab program was 9.9 ± 0.36049 cm × 9.9 ± 0.1123 cm, the result also showed that the computerized score is more accurate in determining of borders and penumbra than medical physicist score.
Key words: Field size, image texture analysis, radiotherapy machines
Access this article onlineQuick Response Code:
Website: www.sudanmedicalmonitor.org
DOI: 10.4103/1858‑5000.144642
and to ensure maximum information is retrieved from the examination. When producing images using conventional radiography, it is important that the quality and quantity of the radiation delivered to the patient are of the appropriate levels. This enables the emerging radiation to create a good image with respect to contrast and density. The quantity of the beam is controlled by altering the milliampere seconds (mAs). This relates to the number of X‑ray that are produced in a given time. The quality of the beam or “penetrative power” is contro l led by a l ter ing the k i lovol tage in kV (voltage/potential difference) that is applied across the X‑ray tube. The X‑ray beam energy (its penetrative power) is an important factor in terms of the contrast and density produced in the image. The radiation map that is produced represents the internal structure of the patient. At this stage, the image is not yet visible. The map from the patient interacts with the recording system, which converts it to light. The more radiation reaching the recording system, the more light is produced and the greater the degree of blackening on the recording system.
INTRODUCTION
The use of digital images provides an opportunity to extract more information or correct for problems in the original data generated by the exposure. When an image is generated, a vast array of grey values is represented in the DR panel. This is known as the system “fidelity.” It is a requirement of the system that this is as faithful as possible. This material is stored as raw data and forms the basis from which the image can be manipulated. Several approaches such as histogram analysis and exposure control may be adopted to achieve this, with a view to improve image rendition for the human viewer
Original Article
[Downloaded free from http://www.sudanmedicalmonitor.org on Monday, August 31, 2015, IP: 41.235.5.72]

Abdallah and Boshara: Field size in radiotherapy using texture analysis
Sudan Medical Monitor | Jan-Mar 2014 | Vol 9 | Issue 16
Thus, the radiation map of the body is translated into a visible monochrome (grey scale) image. The verification of light and radiation field is a crucial process for radiotherapy process. The portal verification of the positioning of these radiation and light fields is carried out by comparing the location of the treated portal image of radiation taken during delivery with the reference simulation, which is an image taken on a simulator or a digitally reconstructed radiograph. Developing an efficient method for an automated verification of the treatment portal localization is crucial to the quality assurance of conformal radiotherapy. If localization accuracy is improved, it is possible to envision applying higher dosage to the tumor with exclusion excess to normal tissues.[1] Radiographic film has a long history of use in radiotherapy physics measurements. It has been used most successfully for quality control and electron beam measurements. In the past decade, radiochromic film has been introduced into radiotherapy physics practice. This film is more tissue equivalent than radiographic film and is becoming more widely used for photon beam dosimetry. Film dosimetry also requires a densitometer to evaluate the darkening of the film and to relate the darkening to the radiation received. It should be noted that different densitometers are suggested for radiochromic film than for conventional radiographic film as the absorption peaks occur at different wavelengths for these different films.[2] The alignment of the photon field is a complex procedure that should only be performed by trained medical physicist. Any misalignment must be evaluated for its magnitude, effect on treatment and whether biomedical engineer should be called in to verify and correct the problem. The automatic evaluation of radioscopic images includes the detection of deviations from the regular structure of the object under inspection. For this task, two principle problems have to be taken into account: A way for powerful image segmentation must be found which is relatively insensitive to noise due to the nature of X‑ray images and secondly the algorithm has to work very quickly in order to satisfy industrial standards. Both problems touch each other because the design of the segmentation algorithm has to be a compromise between efficiency and reliability on the one side and processing time on the other side. The application of image processing methods in the field of radiotherapy physics like radioscopic inspection requires the consideration of some special conditions. While visual optical images usually contain sharp edges, less noise, and relative high percentage of homogeneous grey value areas, X‑ray images are highly contaminated by noise, have very rough edges because of scattered radiation and have only small homogeneous areas and many corner regions due
to superposition; the latter condition strongly depends on complexity of the inspected object. This means that deviations or defects like flaws, pores or holes, which can be viewed as a kind of impulsive noise; have to be detected both in edge and homogeneous noisy regions. Previous investigators have tested many of the edge‑detection techniques traditionally used in computer vision to determine the boundaries of the radiation field. A two‑step process combining histogram thresholding and Sobel gradient operator was applied on portal image.[3‑7] The usual statement of the beam size refers to its dimensions on the entrance surface or, more strictly, its dimensions on a plane at right‑angles to the central ray at the usual source‑surface distance (SSD). Many authors suggested that the field size may be specified either geometrically or dosimetrically. The geometrical field size is defined as “the projection, on a plane perpendicular to the beam axis, of the distal end of the collimator as seen from the front size.” This definition, usually, corresponds to the field defined by the light localizer, arranged as if a point source of light was located at the center of the front surface of the radiation source. The dosimetric, or the physical, field size is the distance intercepted by a given isodose curve (usually 50% isodose) on a plane perpendicular to the beam axis at a stated distance such as the SSD or the source‑axis distance source to axis distance (SAD). The latter term is the distance from the source to axis of the gantry rotation known as isocenter. In the case of an applicator, this is easy to determine since it is the inside dimension of the box which finally defines the beam dimensions with movable diaphragms, at a distance from the skin, the situation is much more difficult since, in this case, there may be considerable penumbra at the skin level. Where, then, is beam edge. Because it is ill‑defined, a number of different conventions has been suggested for example that the position of the 80, 85, or 90% isodose line should be used to mark the edge but that likely to be most generally adopted is the geometrical definition recommended by the International Commission on Radiological Units. This runs as follows: “The geometric field size is the geometric projection on a plane perpendicular to central axis, of the distal end (i.e. the end nearest to the patient) of the limited diaphragm as seen from the center of the front surface of the source.”[8,9] The depth dose at a point is effectively the result of the primary radiation, that is, the photons which have traversed the overlying medium without interacting. The contribution of the scattered photons to the depth dose in this case is negligible. But as the field size increased, the contribution of the scattered radiation to the absorbed doses increases; because this increase in
[Downloaded free from http://www.sudanmedicalmonitor.org on Monday, August 31, 2015, IP: 41.235.5.72]

Abdallah and Boshara: Field size in radiotherapy using texture analysis
Sudan Medical Monitor | Jan-Mar 2014 | Vol 9 | Issue 1 7
scattered dose is greater at larger depths than D max, the percent depth dose increases with increasing field size. The increase in percent depth dose caused by increase in field size depends on beam quality. Since the scattering probability or cross‑section decreases with energy increase and the higher‑energy photons are scattered more predominately in the forward direction, the field size dependence of percent depth dose is less pronounced for the higher‑energy than lower‑energy beams. Percent depth dose data for radiation therapy beams are, usually, tabulated for square fields. Since the majority of the treatments encountered in clinical practice require rectangular and irregularly shaped (blocked) fields, a system of equating square fields to different field shapes is required. Semi‑empirical methods have been developed to relate central axis depth dose for square, rectangular, circular, and irregularly shaped fields. Although general methods (based on Clarkson’s principle) are available, simpler methods have been developed specifically for interrelating square, rectangular, and circular field data.[10‑14]
MATERIALS AND METHODS
For radiotherapy machines (Co‑60 and Linear accelerator), each film scanned using digitizer scanner then treat using image processing program (MatLab Math Work CompanyVersion: R2009a, Math Works, developed 1984, Release R2014b, Natick, Massachusetts, USA), where the congruence of the light and radiation field will be determined. The scanned image will be saved in a TIFF file format to preserve the quality of the image. The data analyzed include upper, lower, right, and left borders of the light and radiation field in telecobalt megavoltage films. The medical physicist used to score the verification film subjectively by placing a ready pack direct exposure film on the table on the SAD. With the collimator angle set at 0°, 10 × 10 cm square light fields was obtained and mark the edges with a radiopaque object or a ballpoint pen by drawing lines on the film jacket with sufficient pressure to scratch the emulsion. Then the film was exposed for 1‑2 min to obtain an optical density in the linear range of its sensitometric curve, usually around 1. Two more exposures at the collimator angles of + 90° were made using fresh area of the same film or another film. The film was processed in an automatic rapid processor. With millimeter graph paper attached to the patient treatment table raised to the nominal isocenter distance, the gantry was orientated to point the collimator axis of rotation vertically downward. The position of the collimator axis of rotation was indicated on this graph
paper. The projected image of the cross‑hair should be coincident with the collimator axis of rotation and should not deviate >1 mm from this point as the collimator is rotated through its full range of motion. The projected images of the jaws should open and close symmetrically about this point. The symmetry of the collimator jaw images about this point should be better than 1 mm at all cardinal angles of the collimator. The congruence of the light and radiation field can now be verified. A ready pack of radiographic film was placed perpendicularly to the collimator axis of rotation. The edges of the light field are marked with radio‑opaque objects or by pricking holes with a pin through the ready pack film at the corners of the light field. The film was positioned near zmax by placing plastic on top of it and is irradiated to yield an OD of between 1 and 2 mm. The congruence of the light and radiation field was verified in the center, upper, and the lower of the field, and then the reading was obtained by the MatLab. The researcher calculated the data analyzed include upper, lower, right, and left borders of the light and radiation field. The data analyzed using statistical package, Statistical Package for Social Studies Version 22 (SPSS Inc., 233s. Wacker Drive, Chicago, IL, 60606‑6412, USA) under windows using t‑test to measure a significant difference between the medical physicist scoring and the automatic scoring.
RESULTS
This study deal with radiation and light field size that was scored objectively by computer program (MatLab) and subjectively by medical physicist, the results presented in table and figures represented light and radiation field size and penumbra. The following tables and graphs show summary of the results including light field size, manual radiation field size, and computerized score. t‑test was been performed for all score variations in this study. P value was calculated to show if there is any significant impact of each light and radiation field size variation i.e.:• P > 0.05 no significance• P < 0.05 significant.
CONCLUSIONS
The congruence of the light and radiation field could be verified regularly by trained medical physicist. The edges of the light field were marked with radio‑opaque objects or by pricking holes with a pin through the ready pack film at the corners of the light field. The film was positioned near zmax by placing plastic on top of it then
[Downloaded free from http://www.sudanmedicalmonitor.org on Monday, August 31, 2015, IP: 41.235.5.72]
Abdallah and Boshara: Field size in radiotherapy using texture analysis
Sudan Medical Monitor | Jan-Mar 2014 | Vol 9 | Issue 18
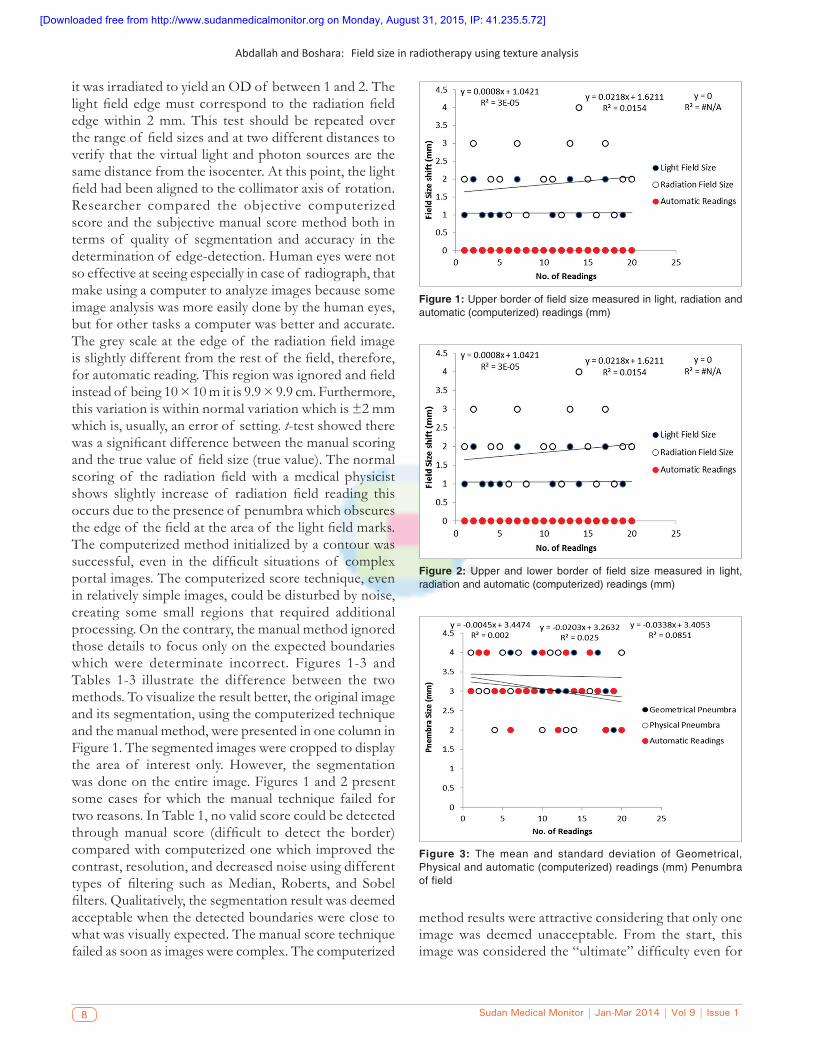
it was irradiated to yield an OD of between 1 and 2. The light field edge must correspond to the radiation field edge within 2 mm. This test should be repeated over the range of field sizes and at two different distances to verify that the virtual light and photon sources are the same distance from the isocenter. At this point, the light field had been aligned to the collimator axis of rotation. Researcher compared the objective computerized score and the subjective manual score method both in terms of quality of segmentation and accuracy in the determination of edge‑detection. Human eyes were not so effective at seeing especially in case of radiograph, that make using a computer to analyze images because some image analysis was more easily done by the human eyes, but for other tasks a computer was better and accurate. The grey scale at the edge of the radiation field image is slightly different from the rest of the field, therefore, for automatic reading. This region was ignored and field instead of being 10 × 10 m it is 9.9 × 9.9 cm. Furthermore, this variation is within normal variation which is ±2 mm which is, usually, an error of setting. t‑test showed there was a significant difference between the manual scoring and the true value of field size (true value). The normal scoring of the radiation field with a medical physicist shows slightly increase of radiation field reading this occurs due to the presence of penumbra which obscures the edge of the field at the area of the light field marks. The computerized method initialized by a contour was successful, even in the difficult situations of complex portal images. The computerized score technique, even in relatively simple images, could be disturbed by noise, creating some small regions that required additional processing. On the contrary, the manual method ignored those details to focus only on the expected boundaries which were determinate incorrect. Figures 1‑3 and Tables 1‑3 illustrate the difference between the two methods. To visualize the result better, the original image and its segmentation, using the computerized technique and the manual method, were presented in one column in Figure 1. The segmented images were cropped to display the area of interest only. However, the segmentation was done on the entire image. Figures 1 and 2 present some cases for which the manual technique failed for two reasons. In Table 1, no valid score could be detected through manual score (difficult to detect the border) compared with computerized one which improved the contrast, resolution, and decreased noise using different types of filtering such as Median, Roberts, and Sobel filters. Qualitatively, the segmentation result was deemed acceptable when the detected boundaries were close to what was visually expected. The manual score technique failed as soon as images were complex. The computerized
method results were attractive considering that only one image was deemed unacceptable. From the start, this image was considered the “ultimate” difficulty even for
Figure 1: Upper border of field size measured in light, radiation and automatic (computerized) readings (mm)
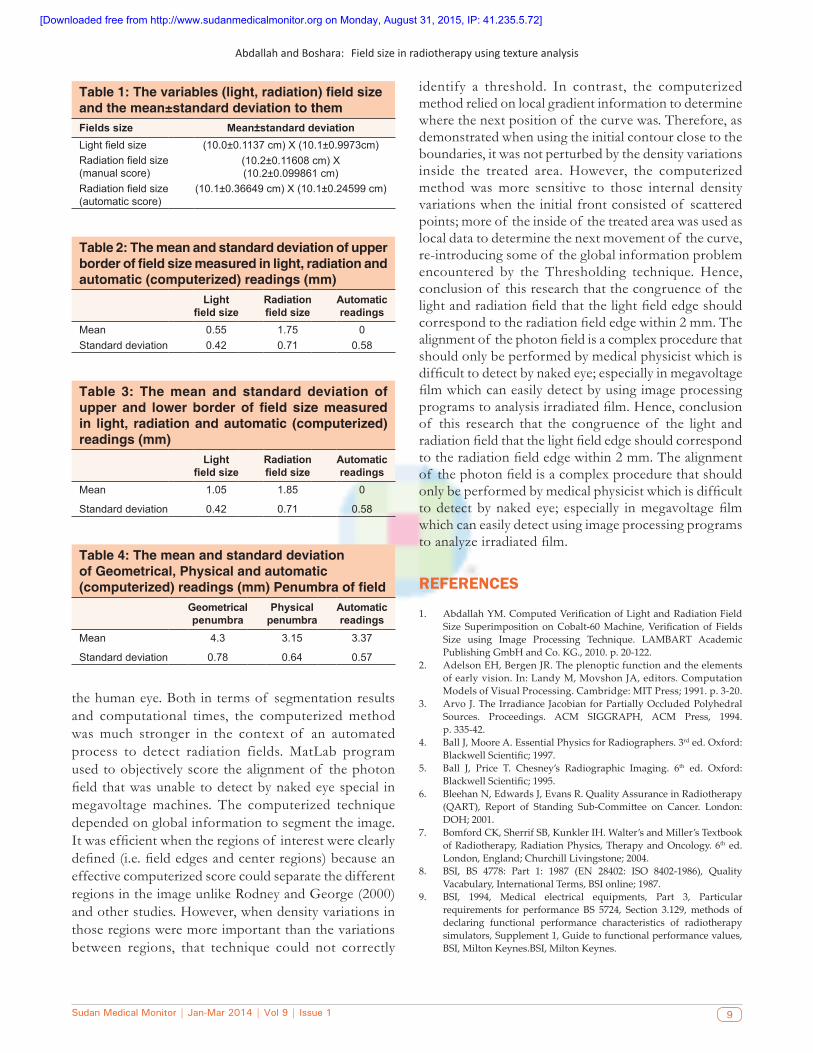
Figure 2: Upper and lower border of field size measured in light, radiation and automatic (computerized) readings (mm)
Figure 3: The mean and standard deviation of Geometrical, Physical and automatic (computerized) readings (mm) Penumbra of field
[Downloaded free from http://www.sudanmedicalmonitor.org on Monday, August 31, 2015, IP: 41.235.5.72]
Abdallah and Boshara: Field size in radiotherapy using texture analysis
Sudan Medical Monitor | Jan-Mar 2014 | Vol 9 | Issue 1 9
the human eye. Both in terms of segmentation results and computational times, the computerized method was much stronger in the context of an automated process to detect radiation fields. MatLab program used to objectively score the alignment of the photon field that was unable to detect by naked eye special in megavoltage machines. The computerized technique depended on global information to segment the image. It was efficient when the regions of interest were clearly defined (i.e. field edges and center regions) because an effective computerized score could separate the different regions in the image unlike Rodney and George (2000) and other studies. However, when density variations in those regions were more important than the variations between regions, that technique could not correctly
identify a threshold. In contrast, the computerized method relied on local gradient information to determine where the next position of the curve was. Therefore, as demonstrated when using the initial contour close to the boundaries, it was not perturbed by the density variations inside the treated area. However, the computerized method was more sensitive to those internal density variations when the initial front consisted of scattered points; more of the inside of the treated area was used as local data to determine the next movement of the curve, re‑introducing some of the global information problem encountered by the Thresholding technique. Hence, conclusion of this research that the congruence of the light and radiation field that the light field edge should correspond to the radiation field edge within 2 mm. The alignment of the photon field is a complex procedure that should only be performed by medical physicist which is difficult to detect by naked eye; especially in megavoltage film which can easily detect by using image processing programs to analysis irradiated film. Hence, conclusion of this research that the congruence of the light and radiation field that the light field edge should correspond to the radiation field edge within 2 mm. The alignment of the photon field is a complex procedure that should only be performed by medical physicist which is difficult to detect by naked eye; especially in megavoltage film which can easily detect using image processing programs to analyze irradiated film.
REFERENCES
1. AbdallahYM.ComputedVerificationofLightandRadiationFieldSize Superimposition onCobalt-60Machine,Verification of FieldsSize using Image Processing Technique. LAMBART AcademicPublishingGmbHandCo.KG.,2010.p.20-122.
2. AdelsonEH,BergenJR.Theplenopticfunctionandtheelementsofearlyvision.In:LandyM,MovshonJA,editors.ComputationModelsofVisualProcessing.Cambridge:MITPress;1991.p.3-20.
3. ArvoJ.TheIrradiance JacobianforPartiallyOccludedPolyhedralSources. Proceedings. ACM SIGGRAPH, ACM Press, 1994.p.335-42.
4. BallJ,MooreA.EssentialPhysicsforRadiographers.3rded.Oxford:BlackwellScientific;1997.
5. Ball J, Price T. Chesney’s Radiographic Imaging. 6th ed. Oxford:BlackwellScientific;1995.
6. BleehanN,EdwardsJ,EvansR.QualityAssuranceinRadiotherapy(QART), Report of Standing Sub-Committee on Cancer. London:DOH;2001.
7. BomfordCK,SherrifSB,KunklerIH.Walter’sandMiller’sTextbookofRadiotherapy,RadiationPhysics,TherapyandOncology.6th ed. London,England;ChurchillLivingstone;2004.
8. BSI, BS 4778: Part 1: 1987 (EN 28402: ISO 8402-1986), QualityVacabulary,InternationalTerms,BSIonline;1987.
9. BSI, 1994, Medical electrical equipments, Part 3, Particularrequirements for performance BS 5724, Section 3.129,methods ofdeclaring functional performance characteristics of radiotherapysimulators,Supplement1,Guidetofunctionalperformancevalues,BSI,MiltonKeynes.BSI,MiltonKeynes.
Table 1: The variables (light, radiation) field size and the mean±standard deviation to themFields size Mean±standard deviationLight field size (10.0±0.1137 cm) X (10.1±0.9973cm)Radiation field size (manual score)
(10.2±0.11608 cm) X (10.2±0.099861 cm)
Radiation field size (automatic score)
(10.1±0.36649 cm) X (10.1±0.24599 cm)
Table 2: The mean and standard deviation of upper border of field size measured in light, radiation and automatic (computerized) readings (mm)
Light field size
Radiation field size
Automatic readings
Mean 0.55 1.75 0Standard deviation 0.42 0.71 0.58
Table 3: The mean and standard deviation of upper and lower border of field size measured in light, radiation and automatic (computerized) readings (mm)
Light field size
Radiation field size
Automatic readings
Mean 1.05 1.85 0
Standard deviation 0.42 0.71 0.58
Table 4: The mean and standard deviation of Geometrical, Physical and automatic (computerized) readings (mm) Penumbra of field
Geometrical penumbra
Physical penumbra
Automatic readings
Mean 4.3 3.15 3.37
Standard deviation 0.78 0.64 0.57
[Downloaded free from http://www.sudanmedicalmonitor.org on Monday, August 31, 2015, IP: 41.235.5.72]

Abdallah and Boshara: Field size in radiotherapy using texture analysis
Sudan Medical Monitor | Jan-Mar 2014 | Vol 9 | Issue 110
10. Buehler C, BosseM,McMillan L, Gortler S, CohenM. UnstructuredLumigraphrendering,Proceedings.ACMSIGGRAPH,ACMPress;2001.
11. Chai JX, Tong X, Chan, SC, Shum H. Plenoptic Sampling,Proceedings.ACMSIGGRAPH,ACMPress;2000.p.307-18.
12. Courtellemont P, Olivier C, Avila M. “2-D modeling and HoughTransform for document analysis,” IEEE, Proceedings of the1992 International Conference on Industrial Electronics, Control,Instrumentation,andAutomation.Vol.3.1992.p.1325-30.
13. DakinJ.Insearchofasimulator.RadiogrToday1991;57:11-9.
How to cite this article: Abdallah YM, Boshara MA. Assessment of field size on radiotherapy machines using texture analysis. Sudan Med Monit 2014;9:5‑10.
Source of Support: Nil. Conflict of Interest: None declared.
Announcement
Android AppA free application to browse and search the journal’s content is now available for Android based mobiles and devices. The application provides “Table of Contents” of the latest issues, which are stored on the device for future offline browsing. Internet connection is required to access the back issues and search facility. The application is compatible with all the versions of Android. The application can be downloaded from https://market.android.com/details?id=comm.app.medknow. For suggestions and comments do write back to us.
14. DurandF,HolzschuchN,SolerC,ChanE,SillionFx.AFrequencyanalysis ofLightTransport,Proceedings.ACMSIGGRAPH,ACMPress;2005.p.1115-26.
[Downloaded free from http://www.sudanmedicalmonitor.org on Monday, August 31, 2015, IP: 41.235.5.72]