assessment of environmental water requirements for the ...€¦ · web viewthe assessment of...
TRANSCRIPT
Published by Murray-Darling Basin AuthorityPostal Address GPO Box 1801, Canberra ACT 2601Office location Level 4, 51 Allara Street, Canberra CityAustralian Capital TerritoryFor further information contact the Murray-Darling Basin Authority office Telephone (02) 6279 0100 international + 61 2 6279 0100Facsimile (02) 6248 8053 international + 61 2 6248 8053E-Mail [email protected] http://www.mdba.gov.au
MDBA Publication No: 41/12
ISBN: 978-1-922068-49-1 (online)
© Murray–Darling Basin Authority for and on behalf of the Commonwealth of Australia, 2012.
With the exception of the Commonwealth Coat of Arms, the MDBA logo, all photographs, graphics and trademarks, this publication is provided under a Creative Commons Attribution 3.0 Australia Licence.
http://creativecommons.org/licenses/by/3.0/au
The MDBA’s preference is that you attribute this publication (and any material sourced from it) using the following wording:
Title: Assessment of environmental water requirements for the proposed Basin Plan: Barwon-Darling River upstream of Menindee Lakes
Source: Licensed from the Murray–Darling Basin Authority, under a Creative Commons Attribution 3.0 Australia Licence.
The MDBA provides this information in good faith but to the extent permitted by law, the MDBA and the Commonwealth exclude all liability for adverse consequences arising directly or indirectly from using any information or material contained within this publication.
Australian Government Departments and Agencies are required by the Disability Discrimination Act 1992 (Cth) to ensure that information and services can be accessed by people with disabilities. If you encounter accessibility difficulties or the information you require is in a format that you cannot access, please contact us.

Barwon-Darling Region
Assessment of the environmental water requirements for the Barwon-Darling River upstream of Menindee Lakes
1. Introduction
The Water Act 2007 (Cwlth) established the Murray–Darling Basin Authority (MDBA) and tasked it with the preparation of a Basin Plan to provide for the integrated management of the Basin’s water resources. One of the key requirements of the Basin Plan is to establish environmentally sustainable limits on the quantities of surface water that may be taken for consumptive use, termed Sustainable Diversion Limits (SDLs). SDLs are the maximum long term annual average volumes of water that can‐ be taken from the Basin and they must represent an Environmentally Sustainable Level of Take (ESLT).
The method used to determine the ESLT is described in detail within ‘The proposed “environmentally sustainable level of take” for surface water of the Murray-Darling Basin: Method and Outcomes,’ (MDBA 2011). A summary of the main steps undertaken to determine the ESLT is presented in Figure 1. The assessment of environmental water requirements including specification of site-specific flow indicators at a subset of hydrologic indicator sites (Step 3 of the overall ESLT method) is the focus of this document.
The work described herein is the MDBA’s current understanding of the environmental water requirements of the Barwon-Darling River upstream of Menindee Lakes. It is not expected that the environmental water requirements assessments will remain static, rather it is intended that they will evolve over time in response to new knowledge or implementation of environmental watering actions. Within this context, feedback is sought on the material presented within this document whether that be as part of the formal draft Basin Plan consultation phase or during the environmental watering implementation phase within the framework of the Environmental Watering Plan.
1.1. Method to determine site-specific flow indicators
Assessment of environmental water requirements for different elements of the flow regime using the hydrologic indicator site approach is one of the key lines of evidence that has informed the proposed SDLs. Effort focussed on regions and parts of the flow regime with greatest sensitivity to the scale of reduction in diversions necessary to achieve environmental objectives, an ESLT and a healthy working Basin.
Within the overall framework of the ESLT method (Figure 1) the MDBA used an iterative process to assess environmental water requirements and develop site-specific flow indicators.
The hydrologic indicator site approach uses detailed eco-hydrological assessment of environmental water requirements for a subset of the key environmental assets and key ecosystem functions across the Basin. Effort focused on high flow (freshes, bankfull flows and overbank flows) requirements
1
reflecting the prioritisation of effort on parts of the flow regime that are most sensitive to the determination of the ESLT and SDLs. The Barwon-Darling River upstream of Menindee Lakes is one of the key environmental assets where a detailed assessment of environmental water requirements was undertaken.
Figure 1 Outline of method used to determine an Environmentally Sustainable Level of Take (Source: MDBA 2011).
Detailed environmental water requirement assessments lead to the specification of site-specific flow indicators to achieve site-specific ecological targets. Flow indicators were expressed at a hydrologic indicator site or sites. Environmental water requirements specified at hydrologic indicator sites are
2
intended to represent the broader environmental flow needs of river valleys or reaches and thus the needs of a broader suite of ecological assets and functions.
This report provides a description of the detailed eco-hydrological assessment of environmental water requirements of the Barwon-Darling River upstream of Menindee Lakes including information supporting the development of site-specific flow indicators for the site (with reference to flows gauged on the Darling River at Bourke, Louth and Wilcannia). More information on how the site-specific flow indicators for the site were used within the Basin-wide modelling process to inform the ESLT (i.e. Step 5 and 6 in Figure 1) can be found in the report ‘Hydrologic modelling to inform the proposed Basin Plan: Methods and results’ (MDBA 2012).
A description of the detailed eco-hydrological assessments of environmental water requirements for other indicator sites are described in other documents in the series ‘Assessment of environmental water requirements for the proposed Basin Plan’.
1.2. Scope and purpose for setting site-specific flow indicators
The MDBA’s assessment of environmental water requirements and associated site-specific flow indicators at hydrologic indicator sites has been used to inform the development of SDLs. This enables the MDBA to estimate the amount of water that will be required by the environment over the long-term to achieve a healthy working Basin through the use of hydrological models. Accordingly, site-specific flow indicators are not intended to stipulate future use of environmental water. MDBA expects that the body of work undertaken to establish these site-specific flow indicators will provide valuable input to environmental watering but this watering will be a flexible and adaptive process guided by the framework of the Environmental Watering Plan and natural eco-hydrological cues. It will be up to the managers of environmental water, such as the Commonwealth Environmental Water Holder, State Government agencies, and local communities to decide how best to use the available environmental water during any one year to achieve environmental outcomes.
2. Location and extent
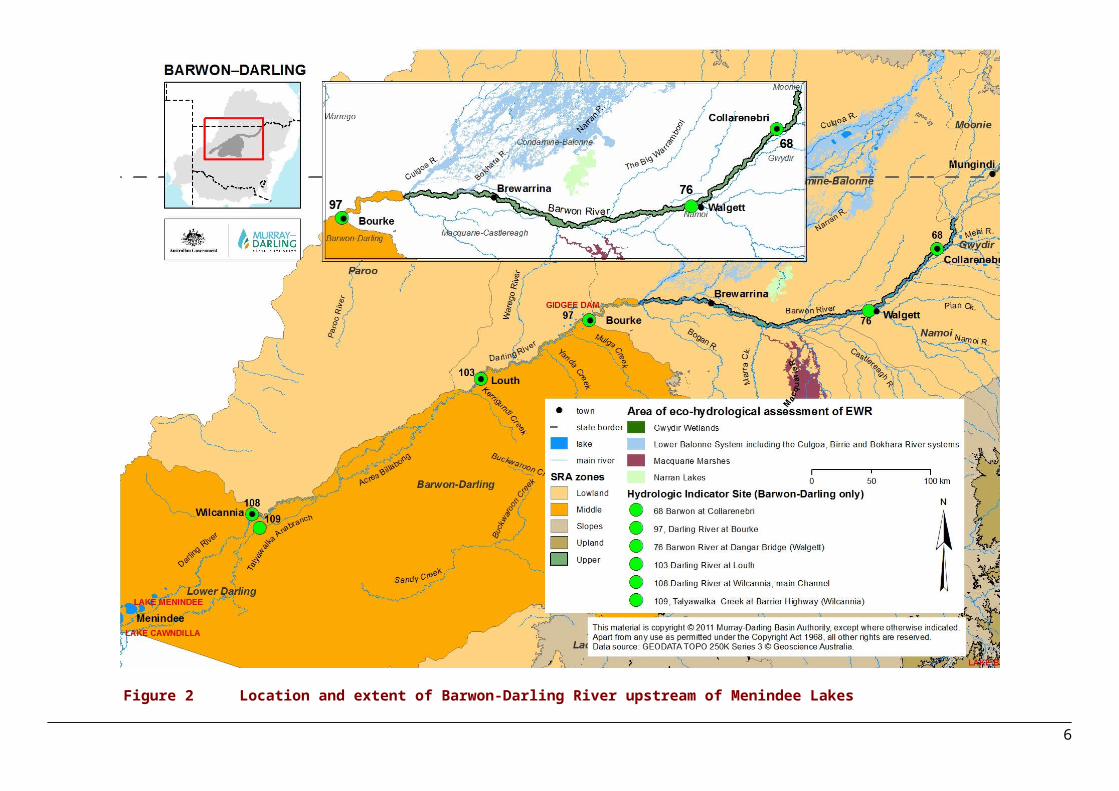
The Macintyre, Barwon and Darling Rivers are the same continuous channel; named the Macintyre River upstream of Mungindi, the Barwon River downstream to the Culgoa confluence and the Darling for the remainder of its length (Boys 2007). This report considers the environmental water needs of the Darling River from Menindee Lakes to the Culgoa confluence, and the Barwon River (Figure 2).
3
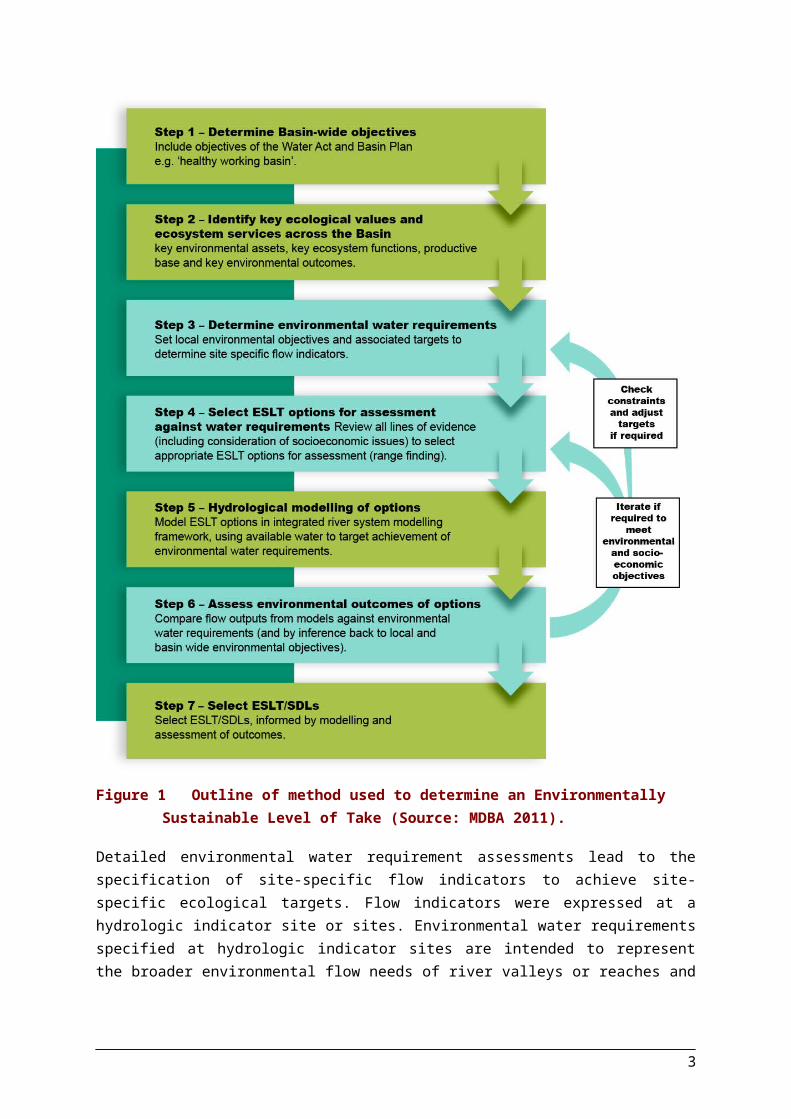
Figure 2 Location and extent of Barwon-Darling River upstream of Menindee Lakes
4

Recognising the importance and condition of the Barwon-Darling system, the main Barwon-Darling channel from Mungindi to its junction with the Murray has been declared endangered as part of the Lowland Darling River Aquatic Ecological Community under the Fisheries Management Act (1994) (NSW Department of Primary Industries 2011).
3. Ecological values
The natural morphology of the river system includes deep channels, deep pool areas, suspended load depositional ‘benches’, higher floodplain ‘benches’, braided channels, terminal wetland complexes, gravel beds and riffle zones (NSW Department of Primary Industries 2007). The floodplain is also an integral part of this river system. The complex river morphology provides a multitude of habitats that play a critical role in the life cycles of a wide range of species (NSW Department of Primary Industries 2007).
Many of the water dependent ecosystems occurring along the Barwon-Darling River upstream of Menindee Lakes are reliant on the variable and unpredictable patterns of high and low flows that characterise this system, for example, many fish species rely on the seasonal flow pattern to trigger spawning and create suitable breeding habitats (NSW Department of Primary Industries 2011).
A total of 30 species of fish have been recorded within the Barwon-Darling River and its tributaries (Boys 2007). Of these, 23 species from 10 families are native and seven are introduced species (Boys 2007). The Barwon-Darling River also provides habitat for three species of fish that are formally listed as vulnerable or endangered under State or Commonwealth threatened species legislation (SKM 2009). Silver perch (Bidyanus bidyanus) is listed as vulnerable and freshwater catfish (Tandanus tandanus) is listed as endangered under the NSW Threatened Species Conservation Act 1994, while the Murray cod (Maccullochella peelii peelii) is listed as vulnerable under the Commonwealth Environment Protection and Biodiversity Conservation Act 1999.
The combination of in-channel and adjacent habitats enables the Darling River floodplain to periodically support large populations of waterbirds. Kingsford et al. (1997) identified 24 floodplains which were known or predicted to support 20,000 or more waterbirds with the Darling River floodplain near Louth identified as one of these areas. Regular aerial surveys show that this section of the Darling River floodplain can infrequently support waterbird populations in excess of 100,000 (Kingsford et al. 1997).
The Barwon-Darling also provides flows to the important Talyawalka Anabranch wetland area. This wetland system comprises the Talyawalka Anabranch of the Darling River and its distributary Teryaweynya Creek and is located between Wilcannia and Menindee. The Talyawalka Anabranch and Teryaweynya Creek system includes numerous lakes and supports large areas of black box (Eucalyptus largiflorens) and river red gum (E. camaldulensis) (Jenkins and Briggs 1997). Kingsford et al. (1997) identified the system as being able to support 20,000 or more waterbirds.
The ecological values of the Barwon-Darling River upstream of Menindee Lakes are reflected in the MDBA’s assessment against the criteria used to identify key environmental assets within the Basin. The MDBA established five criteria to identify assets based on international agreements and broad
5
alignment with the National Framework and Guidance for Describing the Ecological Character of Australian Ramsar Wetlands (Department of the Environment, Water, Heritage and the Arts 2008) and the draft criteria for identifying High Conservation Value Aquatic Ecosystems (SKM 2007).
Based on the ecological values identified for the Barwon-Darling River upstream of Menindee Lakes, the various elements of the system meet all five key environmental asset criteria (Table 1).
Table 1 Assessment of the Barwon-Darling River upstream of Menindee Lakes against MDBA key environmental assets criteria
Criterion Ecological values that support the criterion
1. The water-dependent ecosystem is formally recognised in international agreements or, with environmental watering, is capable of supporting species listed in those agreements
Species listed in international agreements that have been recorded throughout the Barwon-Darling system are listed in Appendix B.
2. The water-dependent ecosystem is natural or near-natural, rare or unique
Talyawalka Anabranch and Teryaweynya Creek contain a system of braided channels, interspersed by a series of varying sized lakes (Department of the Environment, Water, Heritage and the Arts 2010). This system of channels and lakes is nationally important and has been listed in the Australian Wetlands Database system. The Directory of Important Wetlands in Australia (Department of the Environment, Water, Heritage and the Arts 2010) reports that this wetland system is relatively unaltered and representative of black box dominated semi-arid inland floodplain wetland systems.
3. The water-dependent ecosystem provides vital habitat
Kingsford et.al (1997) identified Poopelloe Lake, Talyawalka Creek and Pelican Lake within the Teryaweynya system as well as the Darling River floodplain near Louth as areas known or predicted to support 20,000 or more waterbirds.
The main stem of the Barwon-Darling is characterised by an incised channel and an extremely variable flow pattern. Due to its morphology and variable hydrology the river provides a multitude of habitats that play a critical role in the life cycles of a variety of species. The lowland Darling River also provides a wide range of habitats for fish and invertebrates, including pools, riffles backwaters and billabongs, in-stream woody habitats and aquatic plants (NSW Department of Primary Industries 2007).
4. Water-dependent ecosystems that support Commonwealth, State or Territory listed threatened species or communities
The Barwon-Darling River upstream of Menindee Lakes supports a range of native species listed as threatened under Commonwealth or State legislation (see Appendix B).
5. The water-dependent ecosystem supports, or with environmental watering is capable of supporting, significant biodiversity
The NSW Fisheries Scientific Committee, established to review the status of aquatic ecological communities of the Barwon-Darling system and its tributaries, found that the community has a diverse assemblage of native species, including 21 native fish species and a large number of native invertebrate species (NSW Department of Primary Industries 2011).
The channels and lakes of the Talyawalka Anabranch and Teryaweynya Creek system support extensive areas of floodplain vegetation (Jenkins and Briggs 1997). When inundated, the system’s lakes provide habitat for large numbers of waterbirds (Department of Environment, Water, Heritage and the Arts 2010).
6
4. Hydrology
The flow regime of the Barwon-Darling River is one of the most variable in the world with low-flows punctuated by episodic flooding events that inundate the extensive areas of semi-arid floodplain (Boys 2007). The Barwon-Darling River is not regulated, although many of the main inflows are from regulated rivers (SKM 2009).
Major tributaries to the Barwon-Darling River include the Condamine-Balonne, MacIntyre, Gwydir, Namoi, Castlereagh and Macquarie Rivers, which enter the Barwon-Darling River upstream of Bourke (Brennan et al. 2002). Other tributaries, such as the Paroo and Warrego Rivers, have their headwaters in the more arid west and contribute intermittent flows during high rainfall periods (Thoms and Sheldon 2000). Fifteen fixed-crested weirs are located between Mungindi and Wilcannia (Thoms et al., 1996), many to provide town water supply, the most notable of these weirs being at the towns of Brewarrina, Bourke and Louth (Boys 2007).
The region is mostly arid to semi-arid with significant areas contributing no run-off to rivers (Thoms et al. 1996). Although run-off generated in the region is very low, the Barwon-Darling plays an important role in connecting major river systems of the northern Basin to its southern reaches. In doing so, it periodically collects and carries large volumes of water from the upstream catchments down into the Lower Darling and subsequently the Murray regions.
Annual rainfall varies across the region, increasing from west to east. Brewarrina, in the eastern part of the region, receives an average rainfall of 413 mm/y, while Wilcannia, at the south-west extreme, receives an average of 259 mm/y. Cobar, in the central part of the Barwon-Darling region, receives an average of 396 mm/y (Bureau of Meteorology 2010).
Rainfall in the Barwon-Darling region varies significantly between years (Bureau of Meteorology 2010). It is not uncommon for annual rainfall to be less than 200 mm or above 500 mm (CSIRO 2008). On average, rainfall is highest in the summer months and June for Cobar, while Bourke experiences its highest rainfalls in February, June and November. The low annual rainfall is reflected in the domination of low flows in the Barwon-Darling River. Analysis of modelled flow data for the period 1895-2009 shows that flows less than 13,000 ML/d occur 80 % of time under without-development conditions at Bourke (Figure 3).
7
0% 10% 20% 30% 40% 50% 60% 70% 80% 90% 100%0
10000
20000
30000
40000
50000
60000
70000
Proportion of Time Flow Exceeded
Flow
(ML/
d)
Figure 3 Flow duration curves for modelled without-development conditions at Bourke
To investigate the impact current levels of extractive use and regulation are having on flows in the Barwon-Darling River upstream of Menindee Lakes, the MDBA analysed modelled flow data for the period 1895-2009 at Wilcannia. Figure 4 shows how flows in the mid-lower sections of the Darling River have changed between without-development and baseline (current arrangements) conditions. This figure shows that flows under baseline conditions are now lower on average, with less defined seasonal peaks.
January
February
March
AprilMay June
July
August
Septem
ber
October
November
December
0
2000
4000
6000
8000
10000
12000Without developmentCurrent arrangements
Aver
age
daily
rive
r flow
(ML/
d)
Figure 4 Modelled flows for the Darling River at Wilcannia (average flows for period 1895-2009)
8
5. Determining the site-specific flow indicators for the Barwon Darling River upstream of Menindee Lakes
5.1. Setting site-specific ecological targets
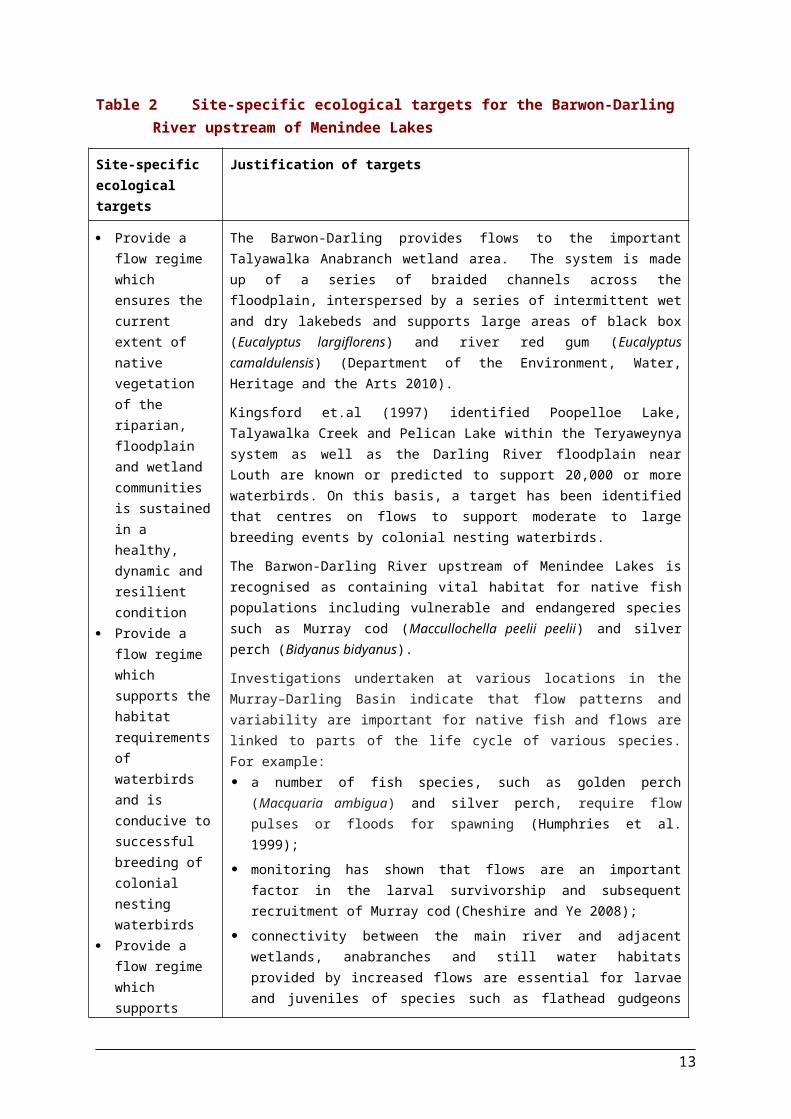
The objective setting framework used to determine the ESLT is outlined in the report ‘The proposed “environmentally sustainable level of take” for surface water of the Murray-Darling Basin: Method and Outcomes’ (MDBA 2011). In summary, the MDBA developed a set of Basin-wide environmental objectives and ecological targets, which were then applied at a finer scale to develop site-specific objectives for individual key environmental assets. Using these site-specific objectives, ecological targets that relate specifically to the Barwon-Darling River upstream of Menindee Lakes were developed (Table 2). Information underpinning site-specific ecological targets is shown in Table 2.
Table 2 Site-specific ecological targets for the Barwon-Darling River upstream of Menindee Lakes
Site-specific ecological targets
Justification of targets
Provide a flow regime which ensures the current extent of native vegetation of the riparian, floodplain and wetland communities is sustained in a healthy, dynamic and resilient condition
Provide a flow regime which supports the habitat requirements of waterbirds and is conducive to successful breeding of colonial nesting waterbirds
Provide a flow regime which supports recruitment opportunities for a range of native aquatic species (e.g. fish, frogs, turtles, invertebrates)
Provide a flow regime which supports key ecosystem functions, particularly those related to connectivity
The Barwon-Darling provides flows to the important Talyawalka Anabranch wetland area. The system is made up of a series of braided channels across the floodplain, interspersed by a series of intermittent wet and dry lakebeds and supports large areas of black box (Eucalyptus largiflorens) and river red gum (Eucalyptus camaldulensis) (Department of the Environment, Water, Heritage and the Arts 2010).
Kingsford et.al (1997) identified Poopelloe Lake, Talyawalka Creek and Pelican Lake within the Teryaweynya system as well as the Darling River floodplain near Louth are known or predicted to support 20,000 or more waterbirds. On this basis, a target has been identified that centres on flows to support moderate to large breeding events by colonial nesting waterbirds.
The Barwon-Darling River upstream of Menindee Lakes is recognised as containing vital habitat for native fish populations including vulnerable and endangered species such as Murray cod (Maccullochella peelii peelii) and silver perch (Bidyanus bidyanus).
Investigations undertaken at various locations in the Murray–Darling Basin indicate that flow patterns and variability are important for native fish and flows are linked to parts of the life cycle of various species. For example: a number of fish species, such as golden perch (Macquaria ambigua) and silver perch,
require flow pulses or floods for spawning (Humphries et al. 1999);
monitoring has shown that flows are an important factor in the larval survivorship and subsequent recruitment of Murray cod (Cheshire and Ye 2008);
connectivity between the main river and adjacent wetlands, anabranches and still water habitats provided by increased flows are essential for larvae and juveniles of species such as flathead gudgeons (Philypnodon grandiceps) and Australian smelt (Retropinna semoni), which require high concentrations of small prey to feed on and develop (Humphries et al. 1999).
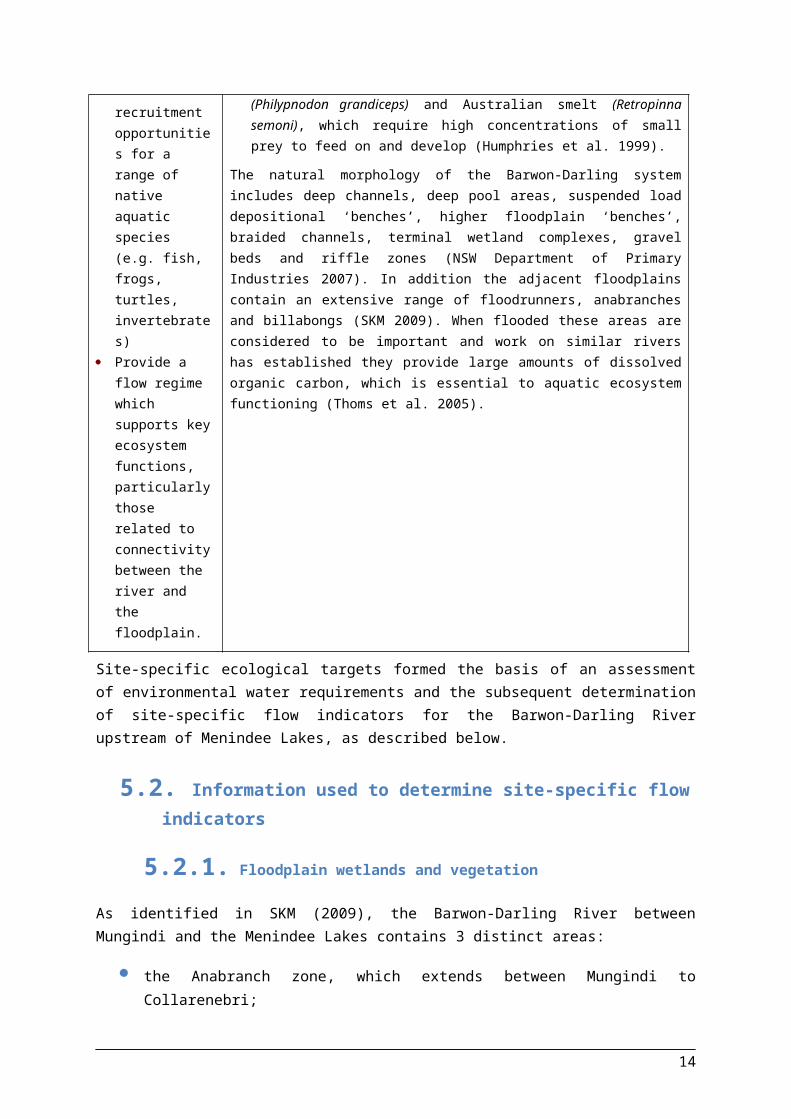
The natural morphology of the Barwon-Darling system includes deep channels, deep pool areas, suspended load depositional ‘benches’, higher floodplain ‘benches’, braided channels, terminal wetland complexes, gravel beds and riffle zones (NSW Department of Primary Industries 2007). In addition the adjacent floodplains contain an extensive range of floodrunners, anabranches and billabongs (SKM 2009). When flooded these areas are considered to be important and work on similar rivers has established they provide large amounts of dissolved organic carbon, which is essential to aquatic ecosystem functioning (Thoms et al. 2005).
9
between the river and the floodplain.
Site-specific ecological targets formed the basis of an assessment of environmental water requirements and the subsequent determination of site-specific flow indicators for the Barwon-Darling River upstream of Menindee Lakes, as described below.
5.2. Information used to determine site-specific flow indicators
5.2.1. Floodplain wetlands and vegetation
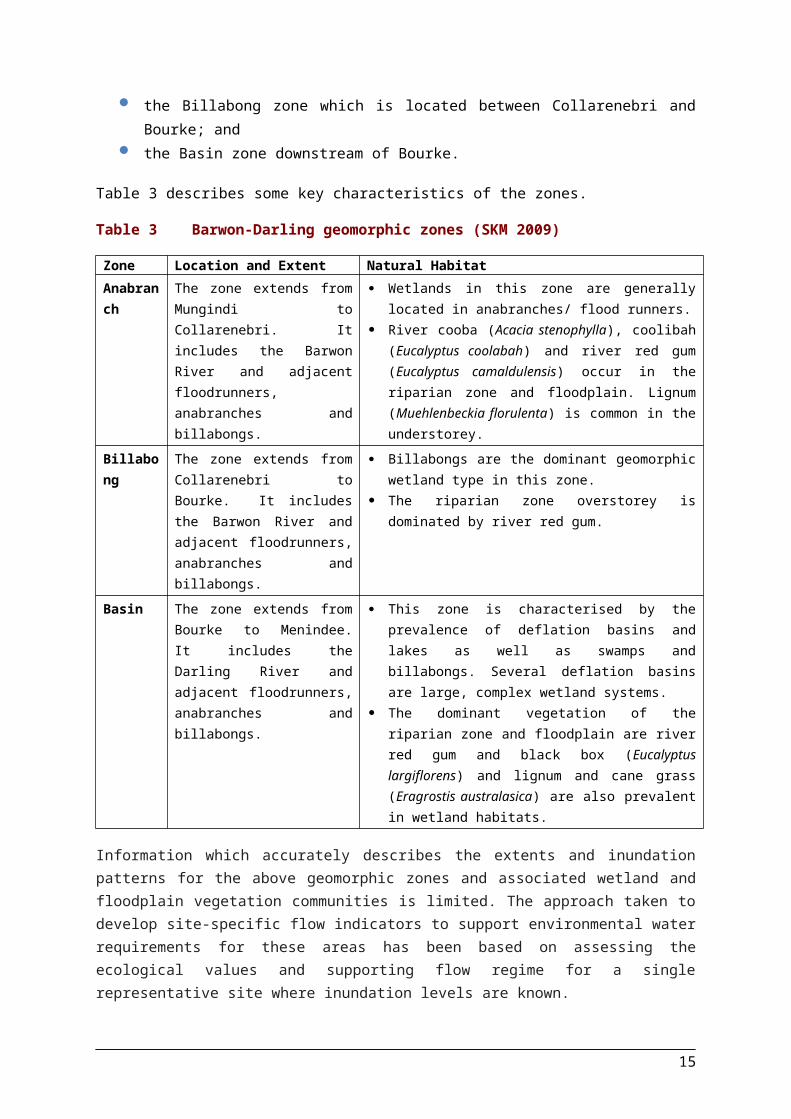
As identified in SKM (2009), the Barwon-Darling River between Mungindi and the Menindee Lakes contains 3 distinct areas:
the Anabranch zone, which extends between Mungindi to Collarenebri; the Billabong zone which is located between Collarenebri and Bourke; and the Basin zone downstream of Bourke.
Table 3 describes some key characteristics of the zones.
Table 3 Barwon-Darling geomorphic zones (SKM 2009)
Zone Location and Extent Natural HabitatAnabranch The zone extends from Mungindi to
Collarenebri. It includes the Barwon River and adjacent floodrunners, anabranches and billabongs.
Wetlands in this zone are generally located in anabranches/ flood runners.
River cooba (Acacia stenophylla), coolibah (Eucalyptus coolabah) and river red gum (Eucalyptus camaldulensis) occur in the riparian zone and floodplain. Lignum (Muehlenbeckia florulenta) is common in the understorey.
Billabong The zone extends from Collarenebri to Bourke. It includes the Barwon River and adjacent floodrunners, anabranches and billabongs.
Billabongs are the dominant geomorphic wetland type in this zone.
The riparian zone overstorey is dominated by river red gum.
Basin The zone extends from Bourke to Menindee. It includes the Darling River and adjacent floodrunners, anabranches and billabongs.
This zone is characterised by the prevalence of deflation basins and lakes as well as swamps and billabongs. Several deflation basins are large, complex wetland systems.
The dominant vegetation of the riparian zone and floodplain are river red gum and black box (Eucalyptus largiflorens) and lignum and cane grass (Eragrostis australasica) are also prevalent in wetland habitats.
Information which accurately describes the extents and inundation patterns for the above geomorphic zones and associated wetland and floodplain vegetation communities is limited. The approach taken to develop site-specific flow indicators to support environmental water requirements for these areas has been based on assessing the ecological values and supporting flow regime for a single representative site where inundation levels are known.
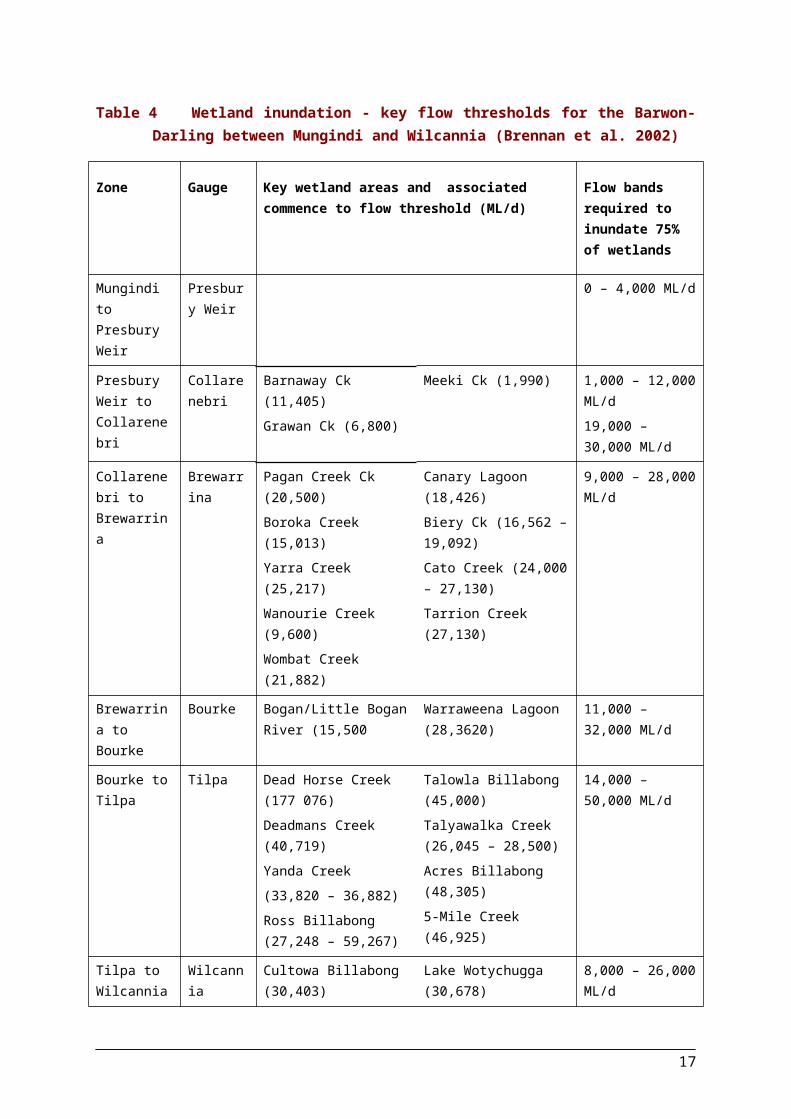
Brennan et al. 2002 identified discrete flow bands required to inundate wetlands between Mungindi and Wilcannia (Table 4). These thresholds provide an indication of the flow required to achieve bankfull discharge and lateral connectivity between the river channel and the floodplain.
10
11

Table 4 Wetland inundation - key flow thresholds for the Barwon-Darling between Mungindi and Wilcannia (Brennan et al. 2002)
Zone Gauge Key wetland areas and associated commence to flow threshold (ML/d)
Flow bands required to inundate 75% of wetlands
Mungindi to Presbury Weir
Presbury Weir
0 – 4,000 ML/d
Presbury Weir to Collarenebri
Collarenebri Barnaway Ck (11,405)
Grawan Ck (6,800)
Meeki Ck (1,990) 1,000 – 12,000 ML/d
19,000 – 30,000 ML/d
Collarenebri to Brewarrina
Brewarrina Pagan Creek Ck (20,500)
Boroka Creek (15,013)
Yarra Creek (25,217)
Wanourie Creek (9,600)
Wombat Creek (21,882)
Canary Lagoon (18,426)
Biery Ck (16,562 – 19,092)
Cato Creek (24,000 – 27,130)
Tarrion Creek (27,130)
9,000 – 28,000 ML/d
Brewarrina to Bourke
Bourke Bogan/Little Bogan River (15,500
Warraweena Lagoon (28,3620)
11,000 – 32,000 ML/d
Bourke to Tilpa Tilpa Dead Horse Creek (177 076)
Deadmans Creek (40,719)
Yanda Creek
(33,820 – 36,882)
Ross Billabong(27,248 – 59,267)
Talowla Billabong (45,000)
Talyawalka Creek(26,045 – 28,500)
Acres Billabong (48,305)
5-Mile Creek (46,925)
14,000 – 50,000 ML/d
Tilpa to Wilcannia
Wilcannia Cultowa Billabong (30,403)
Talyawalka Creek (32,492)
Twenty Seven-Mile Creek (32,334)
Lake Wotychugga (30,678)
Ten Mile Creek (33,110)
8,000 – 26,000 ML/d
29,000 – 35,000 ML/d
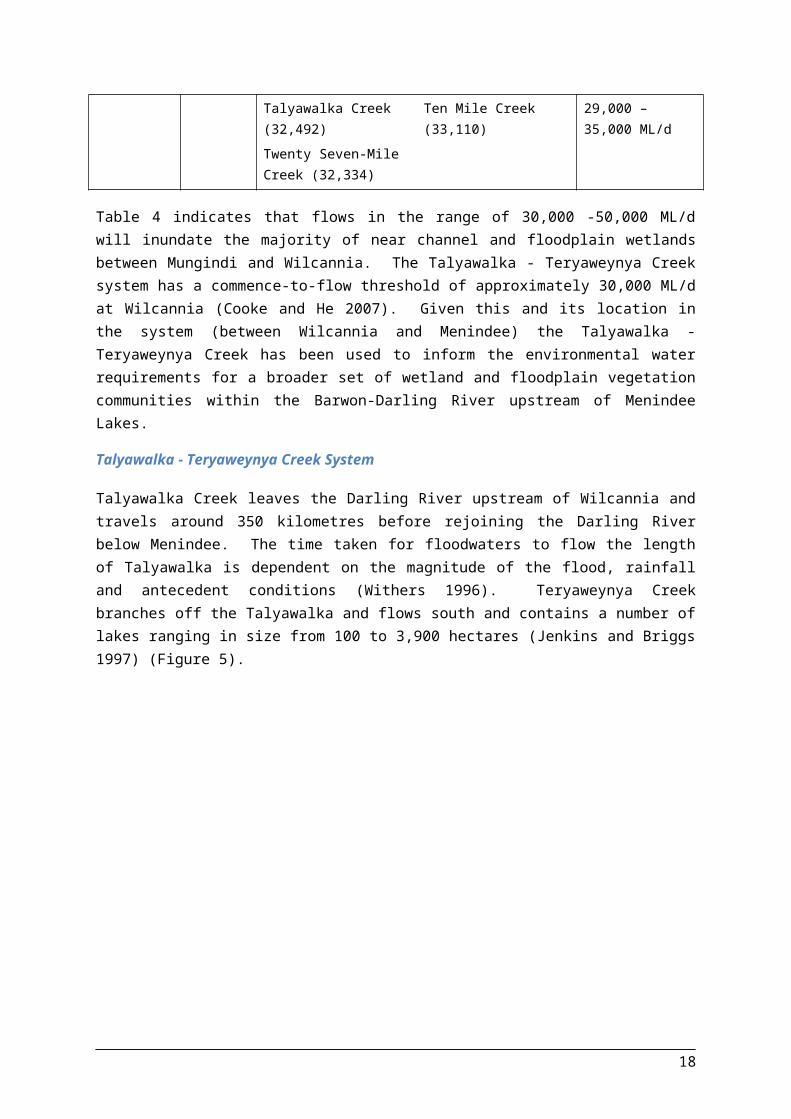
Table 4 indicates that flows in the range of 30,000 -50,000 ML/d will inundate the majority of near channel and floodplain wetlands between Mungindi and Wilcannia. The Talyawalka - Teryaweynya Creek system has a commence-to-flow threshold of approximately 30,000 ML/d at Wilcannia (Cooke and He 2007). Given this and its location in the system (between Wilcannia and Menindee) the Talyawalka - Teryaweynya Creek has been used to inform the environmental water requirements for a broader set of wetland and floodplain vegetation communities within the Barwon-Darling River upstream of Menindee Lakes.
Talyawalka - Teryaweynya Creek System
Talyawalka Creek leaves the Darling River upstream of Wilcannia and travels around 350 kilometres before rejoining the Darling River below Menindee. The time taken for floodwaters to flow the length of Talyawalka is dependent on the magnitude of the flood, rainfall and antecedent conditions (Withers 1996). Teryaweynya Creek branches off the Talyawalka and flows south and contains a number of lakes ranging in size from 100 to 3,900 hectares (Jenkins and Briggs 1997) (Figure 5).
12
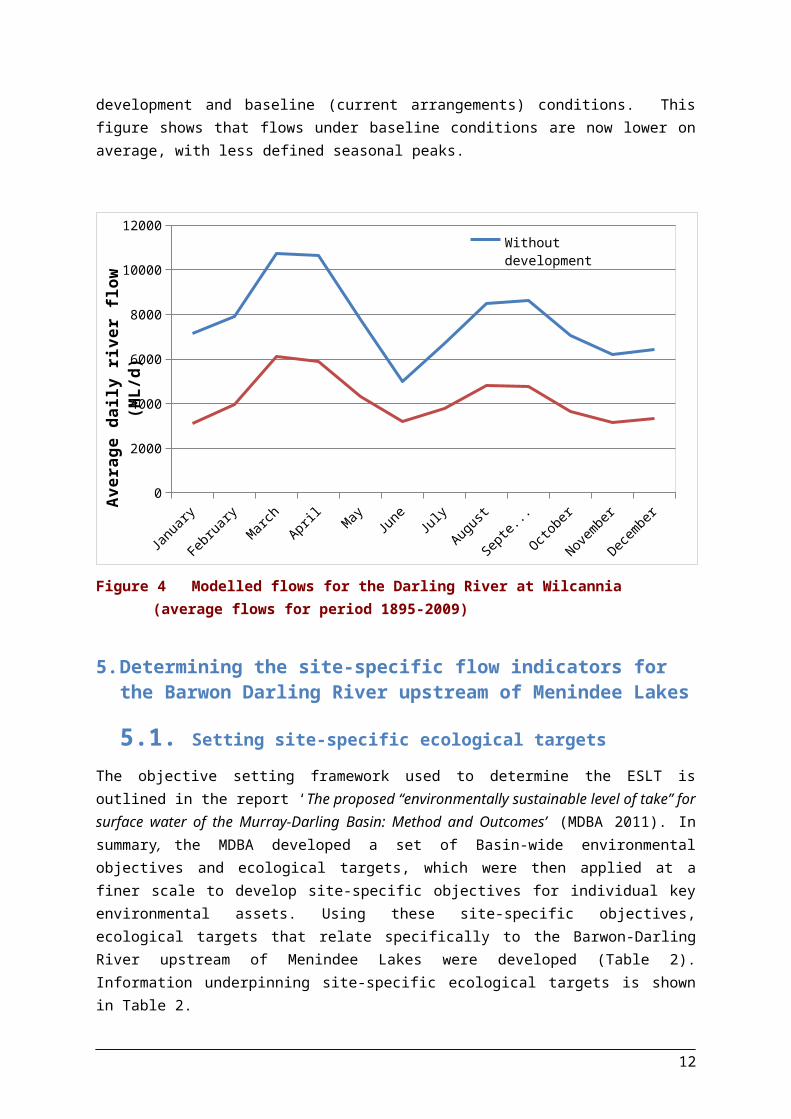
Figure 5 Location and extent of Talyawalka - Teryaweynya Creek System
13
On the edge of the Darling River floodplain north of the Talyawalka Creek lie a series of Lakes - Coombimbi, Wongalara, Coopara and Poopelloe - the overflow from these joining Talyawalka Creek (Withers 1996). These lakes are filled by Cultowa Creek with Coopara and Poopelloe Lakes also filled from Papepapinbilla Creek which connects to the Darling River upstream of Wilcannia in high flows (Withers 1996).
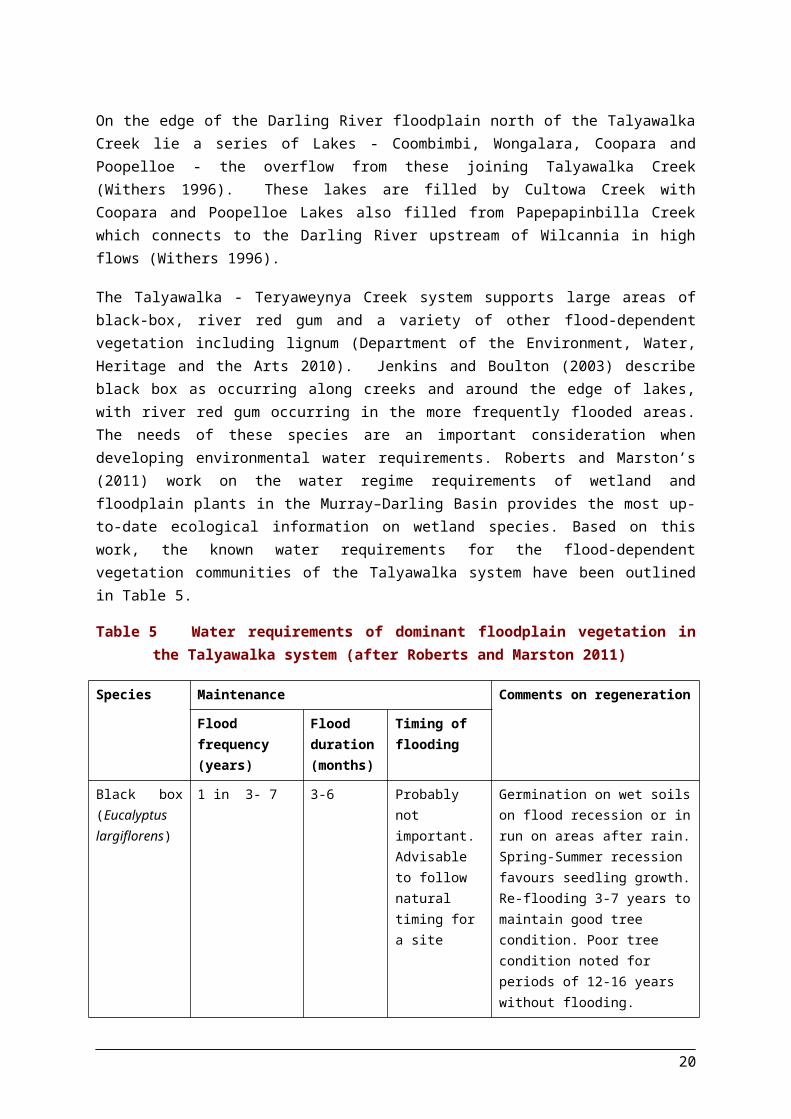
The Talyawalka - Teryaweynya Creek system supports large areas of black-box, river red gum and a variety of other flood-dependent vegetation including lignum (Department of the Environment, Water, Heritage and the Arts 2010). Jenkins and Boulton (2003) describe black box as occurring along creeks and around the edge of lakes, with river red gum occurring in the more frequently flooded areas. The needs of these species are an important consideration when developing environmental water requirements. Roberts and Marston’s (2011) work on the water regime requirements of wetland and floodplain plants in the Murray–Darling Basin provides the most up-to-date ecological information on wetland species. Based on this work, the known water requirements for the flood-dependent vegetation communities of the Talyawalka system have been outlined in Table 5.
Table 5 Water requirements of dominant floodplain vegetation in the Talyawalka system (after Roberts and Marston 2011)
Species Maintenance Comments on regeneration
Flood frequency (years)
Flood duration (months)
Timing of flooding
Black box (Eucalyptus largiflorens)
1 in 3- 7 3-6 Probably not important. Advisable to follow natural timing for a site
Germination on wet soils on flood recession or in run on areas after rain. Spring-Summer recession favours seedling growth. Re-flooding 3-7 years to maintain good tree condition. Poor tree condition noted for periods of 12-16 years without flooding.
River red gum (Eucalyptus camaldulensis) forests
1 in 1-3 5-7 More growth achieved in spring/summer
More growth after spring-summer floods. Warm, moist soil conditions best for germination and seeding growth. Flooding for 4-6 weeks duration is adequate for re-generation.
River red gum (Eucalyptus camaldulensis) woodlands
1 in 2-4 2-4 As for river red gum forests
As for river red gum forests.
Lignum (Muehlenbeckia florulenta)
Variable depending on shrub size
1 in 1-3 for large
1 in 7-10 for small
3-7 for vigorous canopy
Substantially unknown vs other species. Seedling establishment on wet soils after flooding. Brief follow-up flooding in 9-12 months would increase seedling establishment but is not critical with a duration of 4-6 weeks.
Coolibah (Eucalyptus
1 in 10-20; drought Not known (water-logging
Not expected to be important for
Germination most likely on wet soils, either following flood recession or in
14
Species Maintenance Comments on regeneration
Flood frequency (years)
Flood duration (months)
Timing of flooding
coolabah) resistant is likely to be detrimental)
trees. May be important for understorey and associated plant communities,
run-on areas after rainfall. Germination under water is unlikely to be successful.
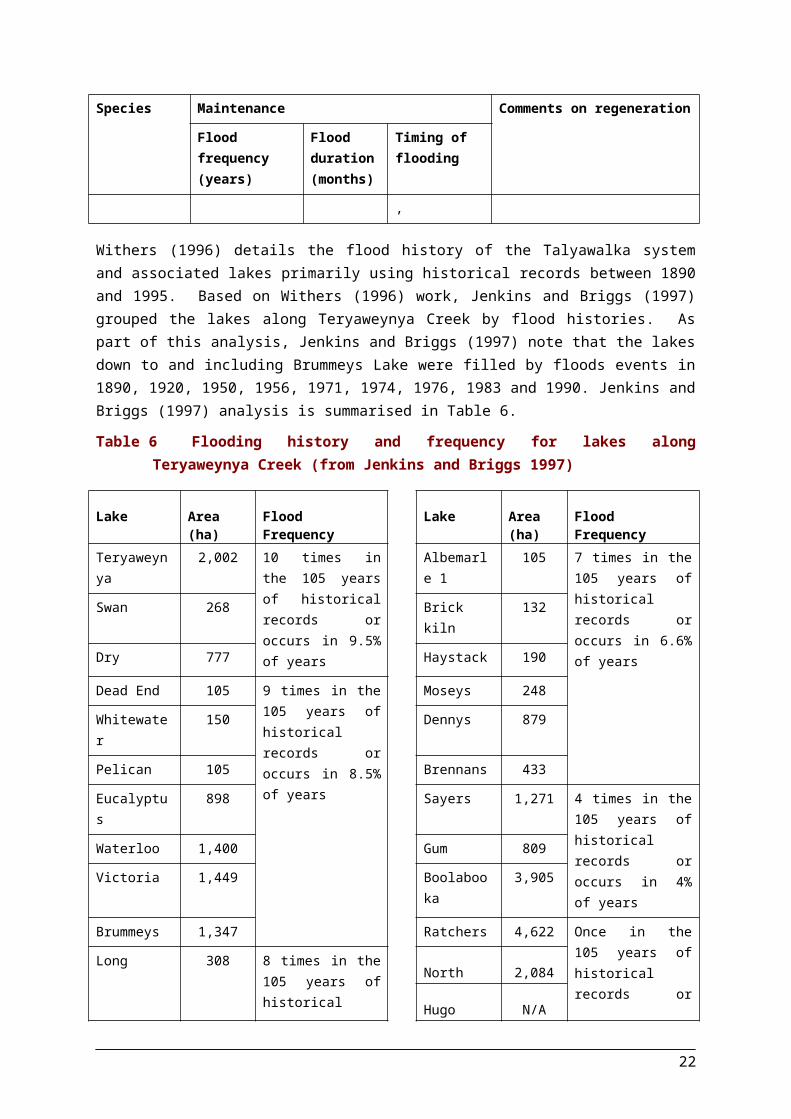
Withers (1996) details the flood history of the Talyawalka system and associated lakes primarily using historical records between 1890 and 1995. Based on Withers (1996) work, Jenkins and Briggs (1997) grouped the lakes along Teryaweynya Creek by flood histories. As part of this analysis, Jenkins and Briggs (1997) note that the lakes down to and including Brummeys Lake were filled by floods events in 1890, 1920, 1950, 1956, 1971, 1974, 1976, 1983 and 1990. Jenkins and Briggs (1997) analysis is summarised in Table 6.
Table 6 Flooding history and frequency for lakes along Teryaweynya Creek (from Jenkins and Briggs 1997)
Lake Area (ha) Flood Frequency Lake Area (ha) Flood FrequencyTeryaweynya 2,002 10 times in the 105
years of historical records or occurs in 9.5% of years
Albemarle 1 105 7 times in the 105 years of historical records or occurs in 6.6% of yearsSwan 268 Brick kiln 132
Dry 777 Haystack 190
Dead End 105 9 times in the 105 years of historical records or occurs in 8.5% of years
Moseys 248
Whitewater 150 Dennys 879
Pelican 105 Brennans 433
Eucalyptus 898 Sayers 1,271 4 times in the 105 years of historical records or occurs in 4% of yearsWaterloo 1,400 Gum 809
Victoria 1,449 Boolabooka 3,905
Brummeys 1,347 Ratchers 4,622 Once in the 105 years of historical records or occurs in less than 4% of years
Long 308 8 times in the 105 years of historical records or occurs in 7.6% of years
North 2,084
Hugo N/A
Jenkins and Boulton (2003) describe the inundation pattern of an event occurring in 1998 where Talyawalka Creek commenced to flow in late August 1998, with floodwaters reaching Teryaweynya Creek and beginning to fill Teryaweynya Lake by October. The floodwaters filled the lakes sequentially and reached Pelican Lake in November.
Based on information outlined in Jenkins and Boulton (2003) and Jenkins and Briggs (1997), gauged flows at Wilcannia (NSW Water Information site www.realtimedata.water.nsw.gov.au) for 1974, 1976, 1983, 1990 and 1998 flood events have been analysed by MDBA to determine the inflow
15
volumes required to fill the more frequently inundated parts of the system. Table 7 details the duration and inflow volume required to fill the lakes down to and including Brummeys Lake.
Table 7 Flood event analysis (1974 – 1998)
1974 Event 1976 Event 1983 Event 1990 Event 1998 Event
Duration of flow above Talyawalka system commence-to-flow (total)
57 days 88 days 75 days 141 days 73 days
Total volume of flows above Talyawalka system commence-to-flow threshold
2,331 GL 4,432 GL 2,879 GL 5,130 GL 2,783 GL
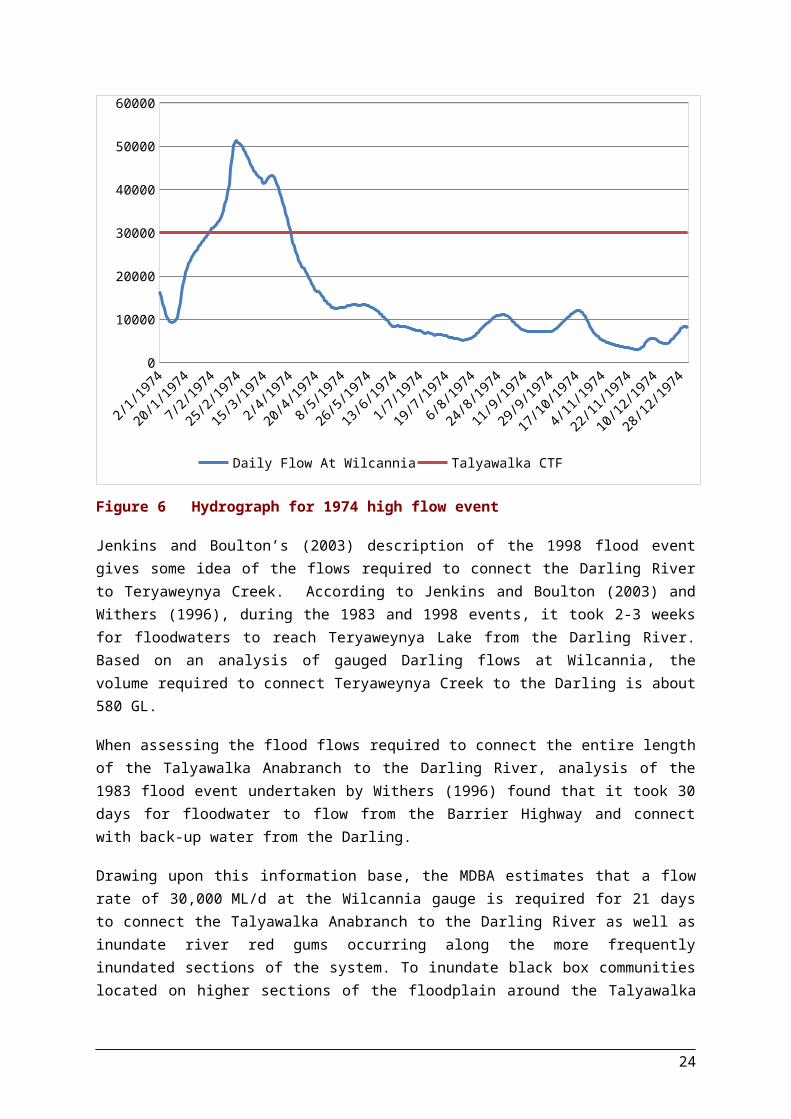
This analysis shows that the 1974 event had both the shortest duration and contained the smallest inflow volume of those analysed. The following hydrograph of the 1974 event shows the duration that gauged flows exceeded the Talyawalka system commence-to-flow (CTF) threshold (Figure 6).
Jan 1974
Feb 1974
Mar 1974
Apr 1974
May 1974
Jun 1974
Jul 1974
Aug 1974
Sep 1974
Oct 1974
Nov 1974
Dec 1974
Jan 1975
0
10000
20000
30000
40000
50000
60000
Daily Flow At Wilcannia Talyawalka CTF
Figure 6 Hydrograph for 1974 high flow event
Jenkins and Boulton’s (2003) description of the 1998 flood event gives some idea of the flows required to connect the Darling River to Teryaweynya Creek. According to Jenkins and Boulton (2003) and Withers (1996), during the 1983 and 1998 events, it took 2-3 weeks for floodwaters to reach Teryaweynya Lake from the Darling River. Based on an analysis of gauged Darling flows at Wilcannia, the volume required to connect Teryaweynya Creek to the Darling is about 580 GL.
When assessing the flood flows required to connect the entire length of the Talyawalka Anabranch to the Darling River, analysis of the 1983 flood event undertaken by Withers (1996) found that it
16

took 30 days for floodwater to flow from the Barrier Highway and connect with back-up water from the Darling.
Drawing upon this information base, the MDBA estimates that a flow rate of 30,000 ML/d at the Wilcannia gauge is required for 21 days to connect the Talyawalka Anabranch to the Darling River as well as inundate river red gums occurring along the more frequently inundated sections of the system. To inundate black box communities located on higher sections of the floodplain around the Talyawalka Anabranch, the MDBA has estimated that a flow of 30,000 ML/d at the Wilcannia gauge is required for 30 days. To inundate black box occurring along creeks and around the edge of lakes, it is estimated that a total inflow volume (above the 30,000 ML/d commence to flow threshold) of 2,350 GL is required. Given the unregulated nature of the Barwon-Darling River system, the timing of these flow indicators is unconstrained to reflect their dependence on large unregulated events.
5.2.2. Waterbirds
Kingsford et.al (1997) identified Poopelloe Lake, Talyawalka Creek and Pelican Lake within the Teryaweynya system as sites known or predicted to support 20,000 or more waterbirds. Coombimbi, Wongalara, Coopara and Poopelloe Lakes are located to the north of Talyawalka Creek (Figure 5) and are connected to the Darling River by Cultowa Creek. Cultowa Creek becomes connected when the Darling River reaches approximately 9.14 m (Withers 1996). High flows from Cultowa Creek generally take three weeks to fill Poopelloe Lake which is the largest of the four lakes (Withers 1996).
Using ratings tables for the Darling River at Wilcannia Main Channel (obtained from www.realtimedata.water.nsw.gov.au/water), 9.14 meters equates to a flow of 26,400 ML/d. Brennan et al. (2002) described the physical character and flow criteria for wetlands along the Barwon-Darling River including the Cultowa Billabong. Brennan et al. (2002) describes a commence-to-flow level for Cultowa Billabong of 30,403 ML/d.
The above information indicates that a flow of 30,000 ML/d for 21 days would fill Poopelloe Lake and provide significant opportunities for waterbird breeding.
Jenkins and Boulton (2003) described the inundation pattern of a flood event occurring in 1998 and found that these floodwaters filled the lakes surrounding Teryaweynya Creek sequentially and reached Pelican Lake. Based on observed inundation patterns, an inflow volume of 2,350 GL is required to fill the more frequently inundated parts of the system, including Pelican Lake, and in doing so provide opportunities for large scale waterbird breeding events.
5.2.3. Nutrient Cycling
The Barwon-Darling River system is characterised by variable and unpredictable patterns of high and low flows. The variable hydrology of the system has resulted in complex channel cross-sections featuring inset-floodplain surfaces (in-channel benches) that occur at multiple levels (Southwell 2008). Variable flow patterns also facilitate ecosystem processes including nutrient cycling and exchange as previously dry benches and floodplains are alternately inundated and dried.
As part of a doctoral thesis, Southwell (2008) found that in-channel benches between Walgett and Bourke acted as sediment and nutrient sinks and were an important source of dissolved nutrients.
17
As part of this study, Southwell (2008) also identified 256 individual benches along two 15-kilometre reaches. The total area of these benches was 79,620 m2.
Southwell (2008) estimated that a total of 189,612 tonnes of sediment containing 2,179 tonnes of total carbon would have been delivered to these benches during the period 1922–2000.
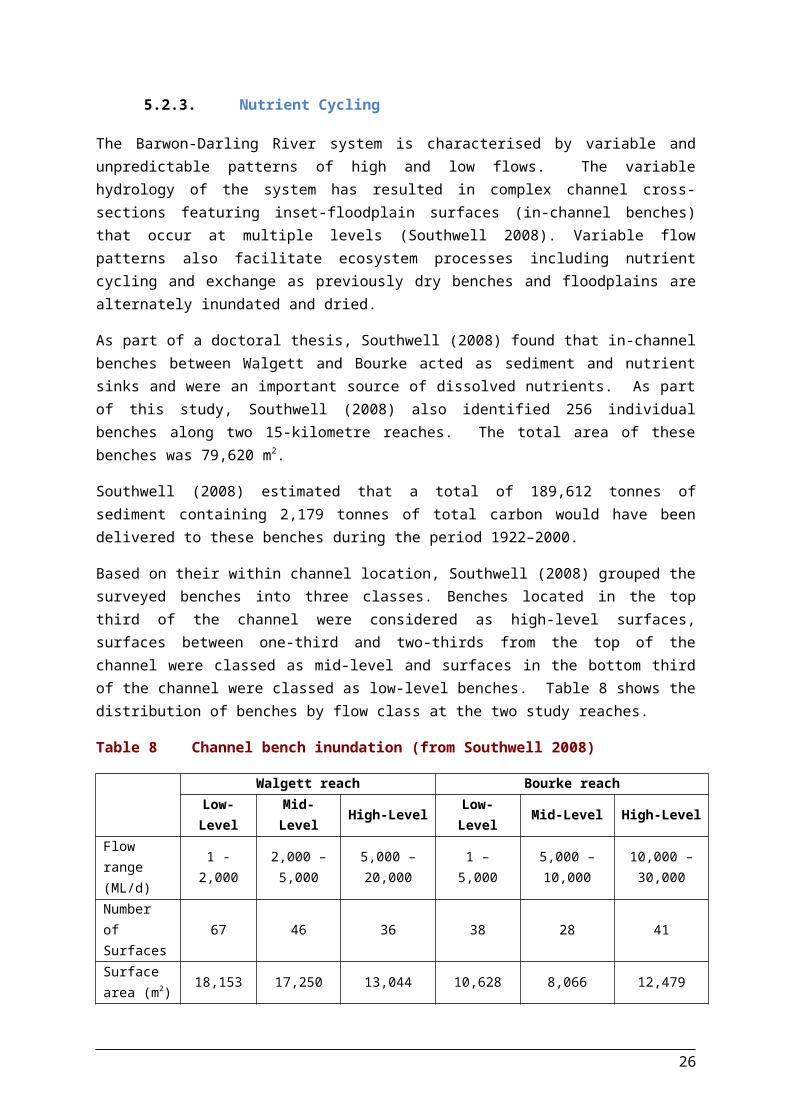
Based on their within channel location, Southwell (2008) grouped the surveyed benches into three classes. Benches located in the top third of the channel were considered as high-level surfaces, surfaces between one-third and two-thirds from the top of the channel were classed as mid-level and surfaces in the bottom third of the channel were classed as low-level benches. Table 8 shows the distribution of benches by flow class at the two study reaches.
Table 8 Channel bench inundation (from Southwell 2008)
Walgett reach Bourke reachLow-Level Mid-Level High-Level Low-Level Mid-Level High-Level
Flow range (ML/d)
1 - 2,000 2,000 – 5,000 5,000 – 20,000 1 – 5,000 5,000 – 10,000 10,000 – 30,000
Number of Surfaces
67 46 36 38 28 41
Surface area (m2)
18,153 17,250 13,044 10,628 8,066 12,479
The MDBA analysed modelled flow under without-development conditions and baseline (current) arrangements for the period 1895–2009. The daily flow time series for these two scenarios has been analysed to determine changes in the nature and frequency of events occurring within the target ranges for bench inundation (Table 9).
Table 9 Analysis of key in-channel flows under without-development and baseline (current) conditions
Gauge
Flows (ML/d) required to inundate benches
Without-development Baseline
No. of events in
model period
Average duration of each event
(days)
Average volume of each event
(ML)
No. of events in
model period
Average duration of each event
(days)
Average volume of each event
(ML)
Walgett
1 -2,000 314 31 11,416 669 28 8,844
2,000 – 5,000 217 8 23,364 233 7 21,337
5,000 – 20,000 321 12 104,282 212 12 103,365
Bourke
1 – 5,000 279 38 33,408 538 43 33,650
5,000 – 10,000 148 12 78,787 109 10 65,967
10,000 – 30,000 232 17 277,355 123 17 279,217
As shown in Table 9, the majority of the key flow ranges identified by Southwell (2008) show limited change between without-development and baseline scenarios. The exception to this is the 10,000 - 30,000 ML/d range at Bourke, where the number of events has been reduced by 47%.
18
Consequently, this flow range forms the basis of the environmental water requirement proposed for the inundation of instream benches located between Walgett and Bourke.
This analysis indicates that under without-development conditions, the average number of events per year which reach a maximum flow of between 10,000 and 30,000 ML/d is around two. The analysis also indicates that the average duration of each event is around 17 days. The MDBA has drawn on this analysis when defining the duration of the flow indicator. In addition, the durations specified have been informed by the known reproductive requirements of the conservationally significant Murray cod (see section 5.2.4). The approach used to determine the desired frequency of occurrence for these flows is described in Section 5.3.
5.2.4. Inundation of key habitat
Snags (also often called large woody debris) are important forms of aquatic habitat and periodic access to this type of habitat is an important part of the reproductive cycle for several species (NSW Department of Primary Industries 2011). For example, Murray cod and various species of gudgeons spawn adhesive eggs onto and in submerged logs (NSW Department of Primary Industries 2011).
Boys (2007) undertook fish sampling at 12 study reaches between Mungindi and Tilpa. As part of this survey a total of 5,526 fish from nine species were recorded of which 86% were native to the area. The native fish caught where predominantly bony herring (Nematalosa erebi) with moderate numbers of golden perch (Macquarie ambigua). Small numbers of conservationally significant species such as Murray cod and silver perch were also found.
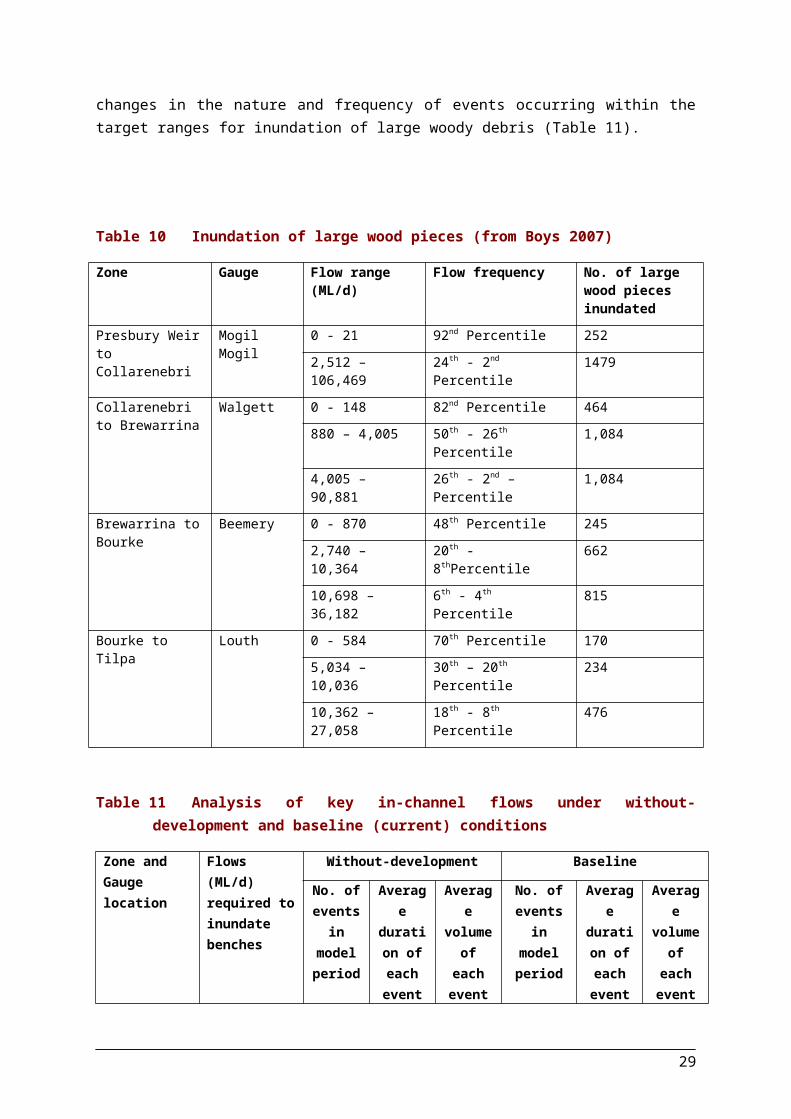
When sampling results for fish and large wood pieces were analysed, Boys (2007) found a strong association between the occurrence of Murray cod and golden perch and large wood pieces. Boys (2007) mapped the location of 7,812 large wood pieces across 12 study reaches located between Mungindi and Tilpa and estimated their commence-to-inundate height. The commence-to-inundate height for each large wood piece was converted to a discharge (ML/d) using rating tables. These discharges were grouped based on frequency of inundation and specified for four zones. Table 10 indicates the number of large wood pieces inundated for each of the key flow ranges identified by Boys (2007).
Based on an analysis of flow-pulse dynamics and large wood availability, Boys (2007) found that the largest change in large wood inundation was associated with flows occurring for 20% or less of the time. Given this, a flow of between 2,000 and 10,000 ML/d represents the range at which the largest change in large wood inundation occurs across the four zones (Table 10).
The MDBA analysed modelled flow under without-development conditions and current arrangements for the period 1895-2009. The daily flow time series for these two scenarios has been analysed to determine changes in the nature and frequency of events occurring within the target ranges for inundation of large woody debris (Table 11).
19

Table 10 Inundation of large wood pieces (from Boys 2007)
Zone Gauge Flow range (ML/d) Flow frequency No. of large wood pieces inundated
Presbury Weir to Collarenebri
Mogil Mogil 0 - 21 92nd Percentile 252
2,512 – 106,469 24th - 2nd Percentile 1479
Collarenebri to Brewarrina
Walgett 0 - 148 82nd Percentile 464
880 – 4,005 50th - 26th Percentile 1,084
4,005 – 90,881 26th - 2nd –Percentile 1,084
Brewarrina to Bourke
Beemery 0 - 870 48th Percentile 245
2,740 – 10,364 20th - 8thPercentile 662
10,698 – 36,182 6th - 4th Percentile 815
Bourke to Tilpa Louth 0 - 584 70th Percentile 170
5,034 – 10,036 30th – 20th Percentile 234
10,362 – 27,058 18th - 8th Percentile 476
Table 11 Analysis of key in-channel flows under without-development and baseline (current) conditions
Zone and Gauge location
Flows (ML/d) required to inundate benches
Without-development Baseline
No. of events in
model period
Average duration of each event (days)
Average volume of
each event (ML)
No. of events in
model period
Average duration of each event (days)
Average volume of
each event (ML)
Presbury Weir to Collarenebri gauged at Mogil Mogil
1,000 - 2,500 283 5 7,839 400 4 5,685
2,500 – 20,000 441 16 102,393 300 12 76,246
Collarenebri to Brewarrina gauged at Walgett
1,000 - 4,000 247 11 20,140 357 9 15,620
4,000 – 9,000 228 8 44,420 188 6 33,713
9,000 – 20,000 167 9 103,976 124 8 94,477
Brewarrina to Bourke gauged at Beemery
1,000 – 2,750 124 13 19,956 184 10 14,608
2,750 – 10,400 271 17 82,062 213 13 59,337
10,400 – 20,000 123 11 141,132 83 10 135,418
Bourke to Tilpa gauged at Louth
1,000 - 5,000 317 29 102,682 244 18 38,231
5,000 – 10,000 151 13 93,450 83 11 75,500
10,000 – 14,000 71 10 114,276 39 11 129,800
14,000 – 20,000 59 11 179,585 33 12 190,866
20
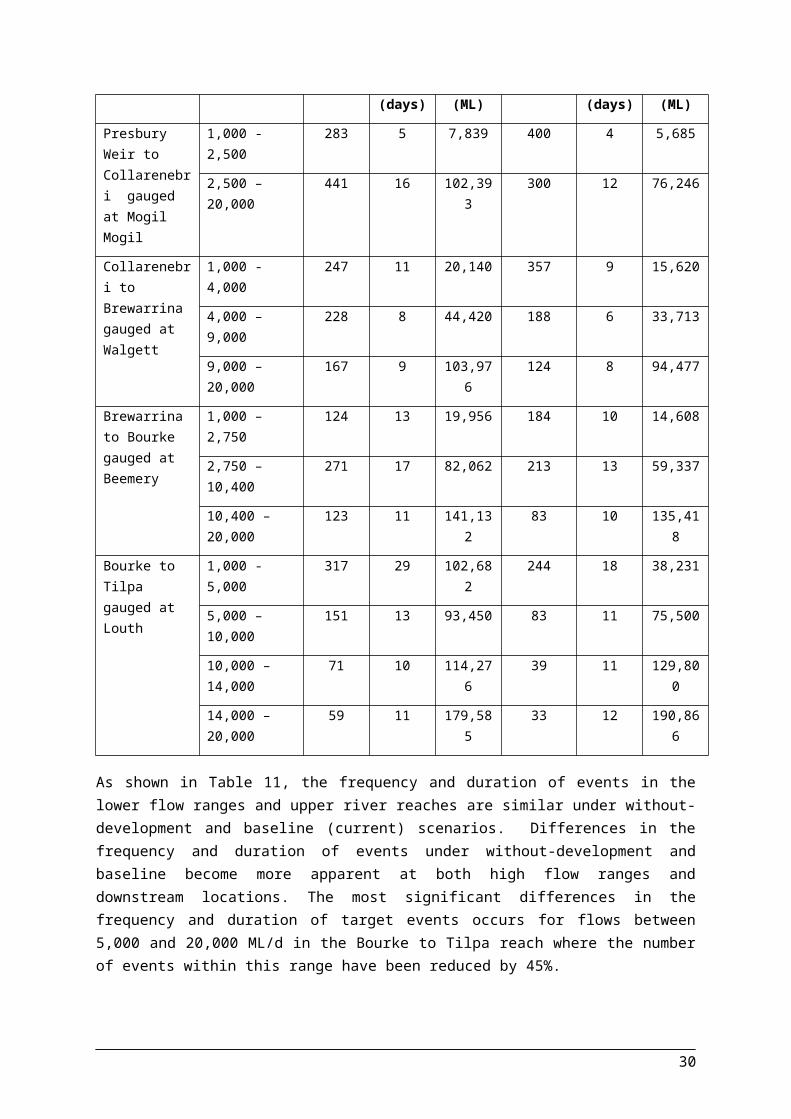
As shown in Table 11, the frequency and duration of events in the lower flow ranges and upper river reaches are similar under without-development and baseline (current) scenarios. Differences in the frequency and duration of events under without-development and baseline become more apparent at both high flow ranges and downstream locations. The most significant differences in the frequency and duration of target events occurs for flows between 5,000 and 20,000 ML/d in the Bourke to Tilpa reach where the number of events within this range have been reduced by 45%.
This analysis indicates that under without-development conditions, the average number of events per year which reach a maximum flow of between 5,000 and 20,000 ML/d is around two. The analysis also indicates that the average duration of each event is between 10 and 13 days.
As indicated above, native fish species such as the conservationally significant Murray cod spawn adhesive eggs onto and in submerged logs (NSW Department of Primary Industries 2011). Lintermans (2007) reports that Murray cod spawn in spring and early summer when water temperature exceeds about 15oC. Consistent with NSW Department of Primary Industries (2011), Lintermans (2007) reports that eggs are deposited onto hard surfaces such as logs and, rocks or clay banks with hatching occurring 5-13 days after spawning. Increasing the frequency of events with a minimum threshold of between 5,000 – 20,000 ML/d is likely to increase periodic access to large woody debris and in doing so have a positive influence on the reproductive cycle for several species.
This information was used to define site-specific flow indicators, as set out in Table 12. The flow indicators for the Louth site describe different types of in-channel flow events which exceed a minimum flow rate for a defined duration. The duration has been informed by both hydrologic and ecologic parameters. The average duration of in-channel flows under modelled without-development conditions as well as the known reproductive requirements of the conservationally significant Murray cod support the selection of a 10 day flow duration. The approach used to determine the desired frequency of occurrence for these flows is described in Section 5.3.
5.2.5. Native Fish
The Barwon-Darling River upstream of Menindee Lakes is recognised for its ability to support significant populations of native fish. The importance of this area is elevated because of the widespread decline of fish populations as shown through Sustainable Rivers Audit monitoring (Davies et al. 2008). Environmental water requirements and associated flow indicators have been developed to take into account the importance of native fish populations.
There is still debate in the scientific literature as to the relative role of various types of flows to fish community dynamics, and an understanding of the nature of ‘fish ecology’ ‘river flow’ interactions‐ are by no means clear (Humphries et al. 1999, Mallen Cooper and Stuart 2003, Graham and Harris‐ 2004; King et al. 2009). For example, it has been suggested that some fish species, such as the conservationally significant silver perch, which have been recorded in the Barwon-Darling system, require flow pulses or floods for spawning i.e. flood recruitment hypothesis (Humphries et al. 1999). Other factors such as water temperature and day lengths, or the interaction of a range of environmental variables including flow, are suggested to also be important for native fish recruitment (King et al. 2009).
Notwithstanding the ongoing debate regarding the link between hydrology and fish ecology, available evidence suggests that provision of flows that connect the river channel to the floodplain
21

(e.g. Beesley et al. 2011), as well as in-channel flow variability, are important to sustaining key ecological features such as native fish populations. Flow indicators described herein for the in-channel, bankfull and overbank elements of the flow regime are expected to be sufficient to support life-cycle and habitat requirements of native fish including provision of cues for spawning and migration and access to food sources.
5.2.6. Other biota
There is little in the way of studies in the Barwon-Darling system examining flow-ecology relationships with regard to other faunal groups. Nevertheless, the MDBA is confident that the specified environmental water requirements for various in-channel and high flow events will have valuable beneficial effects on the life-cycle and habitat requirements of amphibians, and water-dependent reptiles and invertebrates. Key ecosystem functions associated with river and floodplain wetland and lagoon connectivity will also be enhanced.
5.3. Proposed flow indicators
The site-specific flow indicators for the Barwon-Darling River upstream of Menindee Lakes are set out in Table 12 and represent an amalgam of best available information drawn from existing literature, checked against an analysis of modelled without-development and baseline flow data. Site-specific flow indicators are expressed on the Darling River at Bourke, Louth and Wilcannia. These locations are used because they are relevant to the information base and being located throughout the lower section of the system, they ensure ‘longitudinal connectivity’ of flow which is important for ecological processes.
Flow indicators as specified for various elements of the flow regime attempt to strike a balance between desirable flow threshold, duration and timing with desirable frequency and represent a variable flow regime that is consistent with the “without-development” hydrology of the site.
Generally, the flow indicator component with the greatest level of uncertainty across the Basin is the definition of the desirable frequency of flows, expressed as the proportion of years an event is required. This uncertainty is due to a number of reasons. Firstly, it is likely that there are thresholds for many plants and animals beyond which their survival or ability to reproduce is lost, but the precise details of those thresholds are mostly unknown or where there is information (for instance river red gum communities) our knowledge is evolving. Secondly, vegetation communities are located across the floodplain and would have experienced significant variability in their inundation frequency under pre-development conditions which subsequently makes specification of a single frequency metric deceptively certain. For many species and ecological communities the relationship between water provisions and environmental outcomes may not be threshold based, rather there could be a linear relationship between flow and the extent of environmental outcomes or the condition of a particular ecological species/community.
Recognising the degree of confidence in specifying a desirable frequency, ‘low–uncertainty’ and ‘high–uncertainty’ frequency of flow events have been specified (Table 12). For the low–uncertainty frequency, there is a high likelihood that the environmental objectives and targets will be achieved. The lower boundary of the desired range is referred to here as the high uncertainty frequency. This is effectively the best estimate of the threshold, based on current scientific understanding, which, if not met, may lead to the loss of health or resilience of ecological communities, or the inability of
22
species to reproduce frequently enough to sustain populations. The high–uncertainty frequencies attempt to define critical ecological thresholds. The high–uncertainty frequency is considered to indicate a level beyond which the ecological targets may not be achieved.
For the Barwon-Darling River upstream of Menindee Lakes, the proposed inundation frequencies for wetlands and vegetation communities have been informed by the requirements of the dominant vegetation communities. Roberts and Marston (2011) indicate that a flow regime for optimal growth of river red gum woodland requires flooding every two to four years. Black box occurs in areas flooded at frequencies of once in 3 to 10 years and healthy lignum shrubs require a frequency of flooding of between once every three to five years.
For waterbird breeding, in the absence of detailed studies, the MDBA has used its judgement to specify desired inundation frequencies for waterbird breeding that are consistent with the life-cycle requirements of bird species and the episodic nature of floodplain inundation events in the Barwon-Darling system.
Two key factors dictate that waterbirds do not need to breed every year on the same river system (Scott 1997). Firstly, Australian waterbirds are highly mobile and their mobility over large spatial scales is a defining characteristic (Scott 1997; Overton et al. 2009). Most of the 80 odd species of (non-vagrant) Murray-Darling Basin waterbirds that use inland wetlands have broad Australia-wide distributions and it is believed that individuals of most species are capable of dispersing at the scale of the continent (Overton et al. 2009). As such, prior to river regulation at least some individuals of the more mobile waterbird species would have been able to seek suitable conditions for successfully breeding somewhere within the Basin in most years (Scott 1997).
Secondly, it is not essential for waterbirds to breed every year to maintain sustainable populations as they are generally long-lived (Scott 1997). Waterbirds become sexually mature at the age of one to two years and have a life expectancy ranging generally from 3-4 years for ducks, up to 8 years for larger birds such as ibis (Scott 1997).
These two key factors have informed the frequency of events for site-specific flow indicators intended to support the habitat requirements of waterbirds, including provision of conditions conducive to successful breeding of colonial nesting waterbirds. Specifically, it is desirable to provide multiple opportunities for successful waterbird breeding within the range of their life expectancy.
For the flow indicators focused on nutrient cycling and connectivity the MDBA has relied on general ecological principles to inform the high and low uncertainty frequencies.
As advocated by Poff et al. (2010) the degree to which the hydrology of a system is altered from natural, indicates a decline in the integrity of the aquatic ecosystem. In working rivers such as many of those in the Basin it is not possible nor desirable to reinstate ”natural” flows, however in general scientific methods use the degree of change, from natural flows, as a measure of assessment.
As part of the Sustainable Rivers Audit (SRA), Davies et al. (2008) identified 5 categories to assess river condition and ecosystem health. In the SRA reference condition is a reconstruction of the hydrology of the system without significant human intervention (e.g. dams, irrigation development) and is equivalent to the concept of ‘without-development’ as applied in the modelling framework used by the MDBA. The classes identified in the SRA are in Table 13.
23
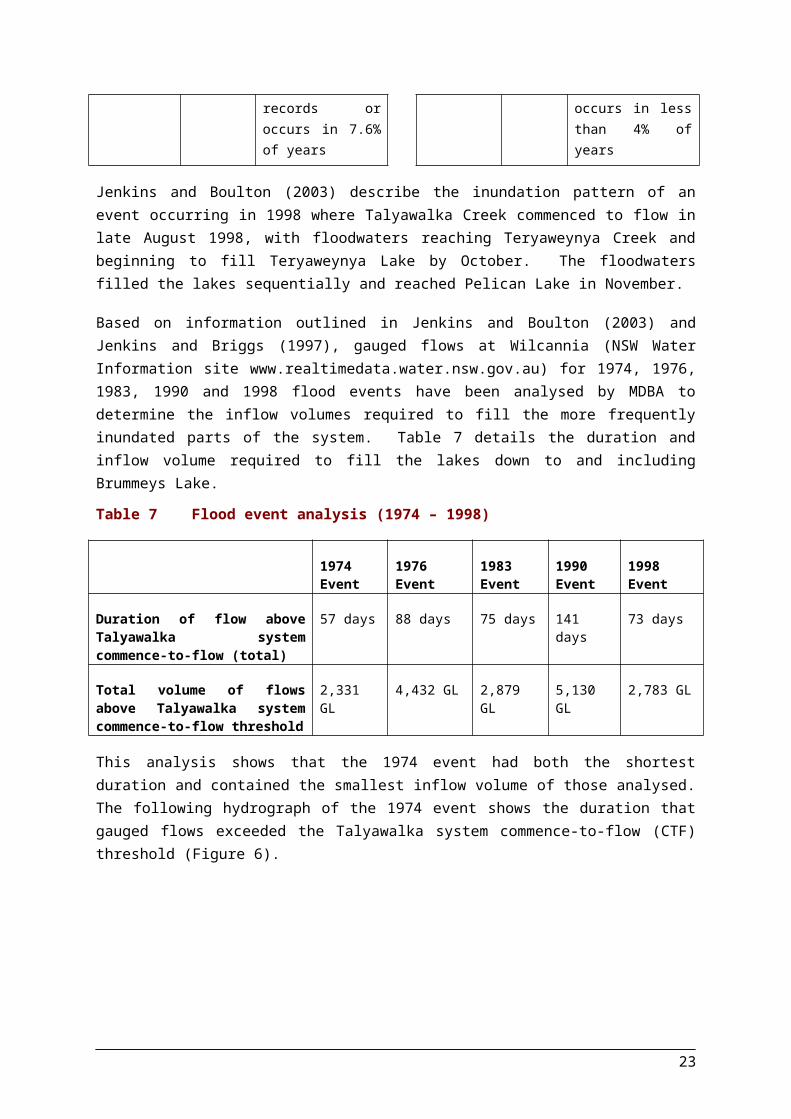
Table 12 Site-specific ecological targets and associated flow indicators for the Barwon-Darling River upstream of Menindee Lakes
Floodplain wetlands and vegetation (Talyawalka - Teryaweynya Creek system)
Site-specific ecological targets
Site-specific flow indicators Without-development and baseline event frequencies
Flow rate required
(gauged at Wilcannia -
ML/d)
Duration (minimum
continuous)Timing
Frequency – proportion of years event required
Proportion of years event occurred under modelled
without-development
conditions (%)
Proportion of years event
occurred under modelled baseline
conditions (%)Low
uncertainty (%)
Low uncertainty
(%)
Provide a flow regime which ensures the current extent of native vegetation of the riparian, floodplain and wetland communities is sustained in a healthy, dynamic and resilient condition
Provide a flow regime which supports the habitat requirements of waterbirds and is conducive to successful breeding of colonial nesting waterbirds
Provide a flow regime which supports recruitment opportunities for a range of native aquatic species (e.g. fish, frogs, turtles, invertebrates)
Provide a flow regime which supports key ecosystem functions, particularly those related to connectivity between the river and the floodplain.
30,000 21 days
Timing not constrained to reflect
that high flows are dependent on
occurrence of heavy rainfall and will be
largely unregulated events
25 20 25 14
30,000 30 days 18 15 21 12
Note: Multiplication of the flow rate by the duration and frequency (proportion of years event required) does not translate into the additional volume of water the site needs to be environmentally sustainable. This is because part of the required flow is already provided under baseline conditions. Additional environmental water required is the amount over and above the baseline flows.
24
Floodplain wetlands and vegetation (Talyawalka - Teryaweynya Creek system)
Site-specific ecological targets
Site-specific flow indicators Without-development and baseline event frequencies
Flow volume (measured as
flow at Wilcannia above 30,000
ML/d)
Timing
Frequency – proportion of years event required
Proportion of years event
occurred under modelled without-
development conditions (%)
Proportion of years event
occurred under modelled baseline
conditions (%)
Low uncertainty
(%)
High uncertainty
(%)
Provide a flow regime which ensures the current extent of native vegetation of the riparian, floodplain and wetland communities is sustained in a healthy, dynamic and resilient condition
Provide a flow regime which supports the habitat requirements of waterbirds and is conducive to successful breeding of colonial nesting waterbirds
Provide a flow regime which supports recruitment opportunities for a range of native aquatic species (e.g. fish, frogs, turtles, invertebrates)
Provide a flow regime which supports key ecosystem functions, particularly those related to connectivity between the river and the floodplain.
2,350 GL
Timing not constrained to
reflect that high flows are dependent
on occurrence of heavy rainfall and
will be largely unregulated events
10 8 13 7
Note: Multiplication of the flow by the frequency (proportion of years event required) does not translate into the additional volume of water the site needs to be environmentally sustainable. This is because part of the required flow is already provided under baseline conditions. Additional environmental water required is the amount over and above the baseline flows.
25
Nutrient Cycling
Site-specific ecological targets
Site-specific flow indicators Without-development and baseline event frequencies
Flow rate required
(measured at Bourke - ML/d)
Duration (minimum
continuous)Timing
Frequency – proportion of years event required
Proportion of years event occurred under modelled
without-development
conditions (%)
Proportion of years event
occurred under modelled baseline
conditions (%)
Low uncertainty
(%)
High uncertainty
(%)
Provide a flow regime which supports recruitment opportunities for a range of native aquatic species (e.g. fish, frogs, turtles, invertebrates)
Provide a flow regime which supports key ecosystem functions, particularly those related to connectivity between the river and the floodplain.
10,000 5 daysMinimum of 2 events in a season preferably one summer /autumn and one winter/spring
but timing not constrained
61 46 76 39
10,000 17 days 38 29 48 24
20,000 5 days 38 28 47 20
Inundation of key habitat
Site-specific ecological targets
Site-specific flow indicators Without-development and baseline event frequencies
Flow rate required
(gauged at Louth - ML/d)
Duration (minimum
continuous)Timing
Frequency – proportion of years event required
Proportion of years event occurred under modelled
without-development
conditions (%)
Proportion of years event
occurred under modelled baseline
conditions (%)Low
uncertainty (%)
Low uncertainty
(%)
Provide a flow regime which supports recruitment opportunities for a range of native aquatic species (e.g. fish, frogs, turtles, invertebrates)
5,000 10 days Minimum of 2 events in a season preferably one summer /autumn and one winter/spring
66 49 82 38
10,000 10 days 49 37 61 29
14,000 10 days 37 28 46 19
26
Site-specific ecological targets
Site-specific flow indicators Without-development and baseline event frequencies
Flow rate required
(gauged at Louth - ML/d)
Duration (minimum
continuous)Timing
Frequency – proportion of years event required
Proportion of years event occurred under modelled
without-development
conditions (%)
Proportion of years event
occurred under modelled baseline
conditions (%)Low
uncertainty (%)
Low uncertainty
(%)
Provide a flow regime which supports key ecosystem functions, particularly those related
but timing not constrained
27

Table 13 SRA ecosystem health classes
Condition of ecosystem health
Difference from reference condition
Metric
Good Near Reference Condition Greater than 80 % of reference
Moderate Moderate Difference Greater than 60% of reference
Poor Large Difference Greater than 40 % of reference
Very Poor Vary large Difference Greater than 20% of reference
Extremely Poor Extreme Difference Less than 20% of reference
It is likely that the level to which flow alteration is important will be different for different fish species, different life stages of fish species and for other biota and ecosystem functions. However there is a reasonably limited science base to draw on to set informed high- and low-uncertainty frequencies. As such, as a first step to including flow indicators for in-stream needs, the MDBA has drawn on the SRA classification and is proposing that 60% protection of key aspects of the in-stream flows as a reasonable start to identify in-stream needs. For major floodplain assets such as those described in other environmental water requirement reports, a larger information base is available to identify site-specific flow indicators.
Based on these principles the high- and low-uncertainty frequencies for the in-stream flows specified here are defined based on an analysis of modelled without-development flow with the high- and low-uncertainty frequencies set at 60% and 80% of the frequency that the specified events occurs under without-development conditions.
It is recognised that periods between inundation events are an important consideration when trying to determine ecosystem resilience or thresholds of irreversible change. When investigating the environmental water requirements for the various sites, consideration was given to specifying a maximum period between events or metrics related to maximum dry. However, the literature regarding the tolerance of various floodplain ecosystems to dry periods is limited. In addition where this information exists, recommended maximum dry intervals often conflicts with the maximum dry experienced under modelled without-development conditions.
Considering these issues, MDBA has not proposed a maximum dry period with the exception of a small number of sites across the Basin, which does not include the Barwon-Darling River upstream of Menindee Lakes. Even so, the importance of maximum dry periods and their role in maintaining ecosystem resilience is recognised. Maximum dry periods between successful events are reported for hydrological modelling associated with the ‘Barwon-Darling River upstream of Menindee Lakes’ indicator site (see MDBA 2012) despite reducing the maximum period between events not being the primary objective of the modelling process.
28
6. Flow delivery constraints
Basin wide environmental objectives have been developed within the context of being deliverable in a working river system that contains public and private storages and developed floodplains. To understand and assess the implications of key constraints on the ability to achieve flow indicators specified for the Barwon-Darling River upstream of Menindee Lakes, MDBA has drawn upon a combination of existing information (e.g. Water Sharing Plans, operating rules of water agencies, flood warning levels) and practical knowledge of river operators supported by testing using hydrological modelling.
The Barwon and Darling Rivers are largely unregulated and there is therefore no recognised operational channel capacity flow target to adhere to. Flows within the system are largely reliant on flows from upstream tributaries.
There are no major storages on the Barwon-Darling River, therefore flows within this system are largely unregulated. Tributaries are regulated to varying degrees and many are only well connected during large flows. Therefore sequencing environmental flows based on managed releases is difficult.
Recognising that the delivery of environmental flows is highly dependent on existing system constraints, the site-specific flow indicators for the Basin have been classified into three broad types (Table 14). The flow indicators for the Barwon-Darling system are generally considered achievable when delivered in combination with tributary inflows and/or unregulated flow events. They may not be achievable in every year or in some circumstances, and the duration of flows may be limited to the duration of tributary inflows.
Table 14 Site-specific flow indicators for the Barwon-Darling River upstream of Menindee Lakes and the effect of system constraints
Site-specific ecological targets Site-specific flow indicators
Floodplain wetlands and vegetation (Talyawalka - Teryaweynya Creek system - flows gauged at Wilcannia on the Darling River)
Provide a flow regime which ensures the current extent of native vegetation of the riparian, floodplain and wetland communities is sustained in a healthy, dynamic and resilient condition
Provide a flow regime which supports the habitat requirements of waterbirds and is conducive to successful breeding of colonial nesting waterbirds
Provide a flow regime which supports recruitment opportunities for a range of native aquatic species (e.g. fish, frogs, turtles, invertebrates)
Provide a flow regime which supports key ecosystem functions, particularly those related to connectivity between the river and
30,000 ML/day for a total of 21 days between January & December for 20% of years
30,000 ML/day for a total of 30 days between January & December for 15% of years
A total in-flow volume of 2350 GL (based on a minimum flow rate of 30,000 ML/d) during January & December for 8% of years
29
the floodplain.
Nutrient Cycling (flows gauged at Bourke on the Darling River)
Provide a flow regime which supports recruitment opportunities for a range of native aquatic species (e.g. fish, frogs, turtles, invertebrates).
Provide a flow regime which supports key ecosystem functions, particularly those related to longitudinal connectivity and transport of sediment, nutrients and carbon
Two events annually of 10,000 ML/day for 5 consecutive days between January& December for 45% of years
Two events annually of 10,000 ML/day for 17 consecutive days between January & December for 29% of years
Two events annually of 20,000 ML/day for 5 consecutive days between January & December for 29% of years.
Connectivity (flows gauged at Louth on the Darling River)
Provide a flow regime which supports recruitment opportunities for a range of native aquatic species (e.g. fish, frogs, turtles, invertebrates).
Provide a flow regime which supports key ecosystem functions, particularly those related to longitudinal connectivity and transport of sediment, nutrients and carbon
Two events annually of 5,000 ML/day for 10 consecutive days between January & December for 50% of years
Two events annually of 10,000 ML/day for 10 consecutive days between January & December for 38% of years
Two events annually of 14,000 ML/day for 10 consecutive days between January & December for 28% of years
Key to Table 14
Achievable under current operating conditions
Flow indicators highlighted in blue are considered deliverable as mostly regulated flows under current operating conditions.
Achievable under some conditions (constraints limit delivery at some times)
Flow indicators highlighted in yellow are considered achievable when delivered in combination with tributary inflows and/or unregulated flow events. They may not be achievable in every year or in some circumstances, and the duration of flows may be limited to the duration of tributary inflows.
Difficult to influence achievement under most conditions (constraints limit delivery at most times)
Flow indicators highlighted in brown require large flows that cannot be regulated by dams and it is not expected that these flows can currently be influenced by river operators due to the river operating constraints outlined above.
7. Summary and conclusion
30
The Barwon-Darling River upstream of Menindee Lakes is a key environmental asset within the Basin and is an important site for the determination of the environmental water requirements of the Basin. MDBA has undertaken a detailed eco-hydrological assessment of the system. Specified flow indicators are indicative of a long-term flow regime required to enable the achievement of site-specific ecological targets for in-channel environments along the Barwon-Darling River upstream of Menindee Lakes. Along with other site-specific flow indicators developed across the Basin at other hydrologic indicator sites, these environmental flow requirements were integrated within hydrological models to inform the ESLT. This process, including consideration of a range of constraints such as those outlined in Section 6, is described in further detail within the companion report on the modelling process ‘Hydrologic modelling to inform the proposed Basin Plan: Methods and results’ (MDBA 2012).
31

References
Beesley, L, Price, A, King, A, Gawne, B, Nielsen, D, Koehn, J, Meredith, S, Vilizzi, L & Hladyz, S 2011, Watering floodplain wetlands in the Murray–Darling Basin for native fish, Waterlines report, National Water Commission, Canberra.
Boys CA 2007, Fish Habitat Association in a Large Dryland River of the Murray-Darling Basin Australia. Ph.D Thesis, University of Canberra, Canberra, Australia.
Brennan, S, O’Brien, M, Thoms, M & Maher S. 2002, The physical character and flow criteria for wetlands along the Barwon-Darling River. CRC for Freshwater Ecology Technical Report to the Department of Land and Water Conservation, 60pp.
Bureau of Meteorology 2010, The Australian water resources information system, information sheet 3, viewed 22 February 2010, <www.bom.gov.au/water/about/publications/document/InfoSheet_3.pdf>.
Cheshire, KJ & Ye, Q 2008, Larval fish assemblage structure below Locks 5 and 6, in the River Murray, South Australia from 2005 to 2007: with reference to the water manipulation trials. SARDI Publication Number F2007/000705-1. SARDI Research Report Series No.175. South Australian Research and Development Institute (Aquatic Sciences), Adelaide.
Cooke, R & He, H 2007, Wilcannia–Menindee Flow Modelling, Calibration of IQQM Model for Routing flows from Wilcannia into Menindee Lakes, NSW Department of Water and Energy, Sydney.
CSIRO 2008, Water availability in the Barwon-Darling. A report to the Australian Government from the CSIRO Murray-Darling Basin Sustainable Yields Project. CSIRO, Australia. 106pp.
Davies, PE, Harris, JH, Hillman, TJ & Walker, KF 2008, Sustainable Rivers Audit Report 1: a report on the ecological health of rivers in the Murray–Darling Basin, 2004–2007, Report prepared by the Independent Sustainable Rivers Audit Group for the Murray–Darling Basin Ministerial Council, Murray–Darling Basin Commission, Canberra.
Department of the Environment, Water, Heritage and the Arts 2008, National framework and guidance for describing the ecological character of Australian Ramsar wetlands, module 2 of the national guidelines for Ramsar wetlands — implementing the Ramsar Convention in Australia, viewed 5 January 2010, www.environment.gov.au/water/publications/environmental/wetlands/module 2 framework.html‐ ‐Department of the Environment, Water, Heritage and the Arts 2010, Australian wetlands database,information sheet for Talyawalka Anabranch & Teryawynia Creek, viewed 22 April 2010,http://www.environment.gov.au/cgi-bin/wetlands/report.pl www.environment.gov.au/water/publications/environmental/wetlands/pubs/directory.pdf.
Foster, N 1999, A Preliminary Assessment of the Commence-to-flow levels of Wetlands of the Lower Namoi Valley. Department of Land and Water Conservation, Barwon Region.
32
Graham, R & Harris, JH 2004, Floodplain inundation and fish dynamics in the Murray-Darling Basin. Current concepts and future research: a scoping study. CRC for Freshwater Ecology, Canberra.
Humphries, P, King, AJ and Koehn, JD 1999, ‘Fish, flows and flood plains: links between freshwater fishes and their environment in the Murray-Darling River system, Australia’. Environmental Biology of Fishes 56, 129-151.
Jenkins, KM & Briggs, SV 1997, Wetland invertebrates and flood frequency on lakes along Teryaweynya Creek National Parks and Wildlife Service, Sydney
Jenkins, K M, & Boulton A J 2003, Connectivity in a dryland river: short-term aquatic microinvertebrate recruitment following floodplain inundation. International Journal of Ecology and Environmental Sciences 24:179-192
King, AJ, Ramsey, D, Baumgartner, L, Humphries, P, Jones, M, Koehn, J, Lyon, J, Mallen-Cooper, M, Meredith, S, Vilizzi, L, Ye, Q & Zampatti, B 2009, Environmental requirements for managing successful fish recruitment in the Murray River Valley – Review of existing knowledge, Arthur Rylah Institute for Environmental Research Technical Report Series No. 197, Department of Sustainability and Environment, Heidelberg.
Kingsford,RT, Thomas, RF & Wong, PS 1997, Significant wetlands for waterbirds in the Murray-Darling Basin. Report to the Murray Darling Basin Commission. NSW National Parks and Wildlife Service, Hurstville.
Lintermans, M. 2007, Fishes of the Murray Darling Basin: An introductory guide. Murray Darling Basin Authority, Canberra
Mallen-Cooper, M & Stuart, IG 2003, ‘Age, growth and non-flood recruitment of two potamodromous fishes in a large semi-arid/temperate river system’. River research and applications 19: 697-719.
MDBA (Murray-Darling Basin Authority) 2011, The proposed “environmentally sustainable level of take” for surface water of the Murray-Darling Basin: Method and Outcomes. Murray-Darling Basin Authority, Canberra.
MDBA (Murray-Darling Basin Authority) 2012, Hydrological modelling to inform the Basin Plan. Murray-Darling Basin Authority, Canberra.
NSW Department of Primary Industries 2007, Aquatic ecological community of the lowland Darling River, Department of Primary Industries website, viewed May 2011, <http://www.dpi.nsw.gov.au/fisheries/habitat/publications/threats/lowland-darling-aquatic-ecological-community>
NSW Department of Primary Industries 2011, Final Recommendations of the Fisheries Scientific Committee – Aquatic Ecological Community in the natural drainage system of the lowland catchment of the Darling River, Department of Primary Industries website, viewed May 2011, <http://www.dpi.nsw.gov.au/__data/assets/pdf_file/0010/208297/FR22-Darling-River-EEC.pdf>
NSW National Parks and Wildlife Service as part of the NSW Department of Environment and Climate Change 2007, Nearie Lake Nature Reserve draft plan of management, NSW Department of Environment and Climate Change , Hurstville, New South Wales.
33
Overton, IC, Colloff, MJ, Doody, TM, Henderson, B & Cuddy, SM (eds) 2009, Ecological outcomes of flow regimes in the Murray–Darling Basin, report prepared for the National Water Commission by CSIRO Water for a Healthy Country Flagship, CSIRO, Canberra.
Poff, NL, Richter, BD, Arthington, AH, Bunn, SE, Naiman, RJ, Kendy, E, Acreman, M, Apse, C, Bledsoe, BP, Freeman, MC, Henriksen, J, Jacobson, RB, Kennen, JG, Merritt, DM, O'Keefe, JH, Olden, JD, Rogers, K, Tharme, RE & Warner, A 2010, ‘The Ecological Limits of Hydrologic Alteration (ELOHA): A new framework for developing regional environmental flow standards.’ Freshwater Biology 55:147-170.
Roberts, J & Marston, F 2011, Water regime for wetland and floodplain plants. A source book for the Murray–Darling Basin. National Water Commission, Canberra.
Scott, A 1997, Relationship between waterbird ecology and environmental flows in the Murray–Darling Basin, CSIRO Land and Water technical report 5–97, Canberra.
SKM 2007, High Conservation Value Aquatic Ecosystems project identifying, categorising and‐managing HCVAE, Final report, Department of the Environment and Water Resources, 16March 2007. www.environment.gov.au/water/publications/environmental/ecosystems/hcvae.html
SKM 2009, Environmental Values and Watering Priorities for the Northern Murray Darling Basin. A report to the Australian Government, Sinclair Knight Merz, Malvern, Victoria.
Southwell MR 2008, Floodplains as Dynamic Mosaics: Sediment and Nutrient patches in a Large Lowland Riverine Landscape. PhD Thesis, University of Canberra, Canberra, Australia.
Stewardson MJ, & Gippel CJ, (2003).Incorporating Flow Variability into Environmental Flow Regimes using the Flow Events Method. River Research and Applications 19:459-472.
Thoms, M & Sheldon, F 2000, Water resource development and hydrological change in a large dryland river: the Barwon-Darling River, Australia. Journal of Hydrology, 228 (2000) p10 - 21
Thoms, MC, Sheldon, F, Roberts, J, Harris, J. & Hillman TJ 1996, Scientific panel assessment of flows for the Barwon-Darling River. Report to the Technical Services Division of the NSW Department of Land and Water Conservation, 161 pp.
Thoms, MC, Southwell, MR, McGinness, HM 2005, Water resource development and the fragmentation of floodplain river ecosystems. Geomorphology, 71, 126-138.
Withers, M 1996, The Talyawalka Creek and associated lakes. Report to NSW National Parks and Wildlife Service, Sydney.
34
Appendix A
Data used in producing hydrologic indicator site maps
Data Dataset name Sourcea
Basin Plan regions Draft Basin Plan Areas 25 May 2010 Murray–Darling Basin Authority (2010)
Dam walls/barrages GEODATA TOPO 250K Series 3 Topographic Data Geoscience Australia 2006
Gauges 100120 Master AWRC Gauges
Icon sites Living Murray Indicative Icon Site Boundaries Murray–Darling Basin Commission
(2007)
Irrigation areas Combined Irrigation Areas of Australia Dataset Bureau of Rural Sciences (2008)
Lakes GEODATA TOPO 250K Series 3 Topographic Data Geoscience Australia (2006)
Maximum wetland
extents
Wetlands GIS of the Murray–Darling Basin Series 2.0
(Kingsford)
Murray–Darling Basin Commission
(1993)
National parks/nature
reserves
Digital Cadastral Database New South Wales Department of
Lands (2007)
National parks/nature
reserves
Collaborative Australian Protected Areas Database —
CAPAD 2004
Department of the Environment, Water,
Heritage and the Arts (2004)
Nationally important
wetlands
Directory of Important Wetlands in Australia Spatial
Database
Department of the Environment, Water,
Heritage and the Arts (2001)
Ocean and landmass GEODATA TOPO 250K Series 3 Topographic Data Geoscience Australia (2006)
Ramsar sites Ramsar wetlands in Australia Department of the Environment, Water,
Heritage and the Arts (2009)
Rivers Surface Hydrology (AUSHYDRO version 1-6) Geoscience Australia (2010)
Roads GEODATA TOPO 250K Series 3 Topographic Data Geoscience Australia (2006)
SRA Zones Sustainable Rivers Audit Zones MDBA 2008
State border GEODATA TOPO 250K Series 3 Topographic Data Geoscience Australia (2006)
State forests Digital Cadastral Database New South Wales Department of
Lands (2007)
Towns GEODATA TOPO 250K Series 3 Topographic Data Geoscience Australia (2006)
Weirs Murray–Darling Basin Weir Information System Murray–Darling Basin Commission
(2001)
Weirs 2 River Murray Water Main Structures Murray–Darling Basin Authority (2008)a Agency listed is custodian of relevant dataset; year reflects currency of the data layer.
35

Appendix B
Significant species associated with the Barwon-Darling River
Species Recognised in international
agreement(s)1
Environment Protection and
Biodiversity Conservation
Act 1999 (Cwlth)
Fisheries Management
Act 2004 (NSW)
Threatened Species
Conservation Act 1995 (NSW)
Birds
Australasian bittern (Botaurus poiciloptilus)3 V
Blue-billed duck (Oxyura australia)2, 3 V
Brolga (Grus rubicundus)3 V
Caspian tern (Hydroprogne caspia)3 M
Common sandpiper (Actitis hypoleucos)3 M
Eastern great egret (Ardea modesta)3 M
Freckled duck (Stictonetta naevosa)2, 3 V
Glossy ibis (Plegadis falcinellus)3 M
Fish
Freshwater catfish (Tandanus tandanus)2 E
Murray cod (Maccullochella peelii peelii)2 V
Silver perch (Bidyanus bidyanus)2 V
Communities
Lowland Darling River aquatic ecological
community2
E
E = endangered V = vulnerable
1 Japan–Australia Migratory Bird Agreement, China–Australia Migratory Bird Agreement, or Republic of Korea – Australia Migratory Bird Agreement
2 Murray–Darling Basin Commission (n.d.)
3 NSW National Parks and Wildlife Service (2007)
36