assessment of energy storage alternatives in the … assessment of energy storage alternatives in...
TRANSCRIPT

PNNL- 23040
Assessment of Energy Storage Alternatives in the Puget Sound Energy System
Volume 1: Financial Feasibility Analysis
December 2013 Patrick Balducci, PNNL Patrick Leslie, Puget Sound Energy
Chunlian Jin, PNNL Charles Daitch, Puget Sound Energy
Di Wu, PNNL Andy Marshall, Primus Power
Michael Kintner-Meyer, PNNL


PNNL-23040
Assessment of Energy Storage Alternatives in the Puget Sound Energy System Volume 1: Financial Feasibility Analysis P Balducci, PNNL C Jin, PNNL D Wu, PNNL M Kintner-Meyer, PNNL P Leslie, Puget Sound Energy C Daitch, Puget Sound Energy A Marshall, Primus Power December 2013 Prepared for the U.S. Department of Energy under Contract DE-AC05-76RL01830 and the Bonneville Power Administration. Pacific Northwest National Laboratory Richland, Washington 99352


Executive Summary
For more than a decade, the Pacific Northwest has been capable of generating more electric energy than the region’s utilities required for meeting customer demand. Now, however, the Regional Resource Adequacy Forum’s five-year forecast indicates the region will soon reach load-resource balance. As capacity constraints loom, the percentage of renewables on the grid continues to grow, driven by renewable portfolio standards throughout the region, production tax credits and decreasing costs. In the Bonneville Power Administration region, with a total of 6 gigawatts of wind power, the need to manage the variability and intermittency of renewable energy resources has become a very real challenge, sometimes necessitating wind curtailments to sustain reliable operations. The continued increase of these renewable sources will necessitate the deployment of technologies that can address intermittency in an environmentally sustainable fashion.
Energy storage systems have the potential to improve the operating capabilities of the electricity grid. Their ability to store energy and deliver power can increase the flexibility of grid operations while providing the reliability and robustness that will be necessary in the grid of the future—one that will be able to provide for projected increases in demand and the integration of clean energy sources while being economically viable and environmentally sustainable. The technologies show promise, but it remains difficult to quantify the benefits that energy storage systems (ESS) may provide. This study is designed to add to the resources targeting this issue by providing a generalizable approach and tool for estimating the value of ESS services, as applied to a proposed ESS designed by Primus Power for application in the Puget Sound Energy (PSE) service territory.
Key Questions Addressed
The overarching goal of this study is to demonstrate and quantify the value of ESS placed close to end-users, providing a range of services that collectively enhance the flexibility, reliability, and resiliency of the grid. This assessment addresses the following set of questions:
1. Where should energy storage be sited and at what scale to maximize value in the PSE system?
2. What energy storage applications can the ESS provide and what values are derived from these services?
3. How do we build and test an energy storage control strategy to maximize value?
4. When optimized to maximize value, do the modeled benefits exceed the revenue requirements for the battery systems?
Key Lessons and Implications
This assessment of energy storage alternatives in the PSE system identified a preferred site and defined the scale for an ESS. It also examined the financial feasibility of the ESS at the preferred site by monetizing the values derived from a number of services provided to PSE and its customers. The ESS and the grid conditions in which it will operate were modeled, and an optimization tool was employed to explore tradeoffs between services and to develop an optimal control strategy. The results provide crucial insights into the practical application and financial feasibility of an ESS in the PSE system. The following five key lessons and implications can be drawn from this analysis.
iii

1 - The preferred site for an ESS is the WIN-12 circuit on Bainbridge Island and the optimal scale is 3 MW and 9-12 MWh.
Four sites were evaluated using a set of six screening criteria: results of a preliminary ESS value assessment, travel time to the site, barriers to land permitting, operational priorities, communication expense, and community interest. This screening analysis narrowed the potential sites to two: Bainbridge Island and Baker River-24 (Rockport). Bainbridge Island is located in Puget Sound and can be reached in 35 minutes from Seattle via ferry. There are two substations serving most of the island, and load on these substations is approaching maximum capacity. Baker River-24 (Rockport) is a long radial feeder in a heavily forested area located 100 miles north of PSE headquarters, which are located in Bellevue, Washington. There are frequent outages on this feeder due to the dense vegetation.
In determining the site and scale of the ESS on Bainbridge Island, the objective was to maximize value while meeting real-world constraints of PSE’s load and service territory. The power capacity sizing process sought to maximize the distribution system deferral value. Based on load forecasts at the Winslow and Murden Cove substations on Bainbridge Island, the initial analysis of peak load requirements indicated that a 4 megawatt (MW) system resulting in a nine-year deferral period was optimal. This initial conclusion, however, was later revised based on the results of a sensitivity analysis which indicates that a power capacity of 3 MW, with allowance for a shorter deferral period of eight years, would yield an additional $1.2 million in net benefits. By reducing the energy capacity of the ESS, however, PSE would incur some operational risk. If load growth exceeds forecasts, the distribution deferral period as well as the associated value could contract.
Energy requirements were defined by the shape of the peak. The top ten peak energy days for the past six years were evaluated to determine the energy requirements of the ESS based on its rated power and the shape of the peak. At 4 MW, 12 megawatt hours (MWh) of energy would address 90 percent of the events. To address all events, a 16 MWh system corresponding to the 4 MW power requirement is required. At 3 MW, 12 MWh would address all events. A 3-hour system (9 MWh) would address at least 90 percent of the events. Thus, a 4-hour energy system is required for Bainbridge Island to address all events while a 3-hour system would address more than 90 percent of the events.
To determine the precise site of the ESS on Bainbridge Island, outage data were analyzed on each distribution feeder in order to determine the circuit that would maximize the outage mitigation or islanding value. Data for each potential site were evaluated and a location near the end of the WIN-12 feeder was selected as the preferred location of an ESS.
Sizing and siting the ESS on the Baker River-24 (Rockport) site was more straightforward. Baker River-24 is a long radial feeder in a heavily forested area. The radial feeder experiences frequent outages due to dense vegetation. The standard solution being considered is an underground conversion of the feeder. The ESS could be located downstream of trouble areas and island 640 of 835 customers on the feeder. To address the needs of the population served by the feeder, an ESS of 1.85 MW / 7.4 MWh is required.
iv

2 - The total cost of a 4 MW / 16 MWh ESS for Bainbridge Island is estimated at $14.8 million; estimated cost of a 3 MW / 12 MWh ESS is $11.8 million.
Primus Power estimated the delivered cost of its ESS at $2,300 per kilowatt (kW) if deployed in 2018. PSE then performed a detailed analysis of the costs associated with siting, electrical, thermal management, site/civil, installation, communication, information technology, overheads, state sales taxes, and contingency funds. The total cost of a 4 MW ESS, including all installation and site preparation costs, is $14.8 million or $3,690 per kW on Bainbridge Island. Total costs for a 3 MW ESS on Bainbridge Island are estimated at $11.8 million. At Baker River-24 (Rockport), costs are estimated at $8.1 million or $4,384 per kW for a 1.85 MW / 7.4 MWh ESS.
3 – The results of the financial feasibility analysis are promising for Bainbridge Island but not for Baker River-24 (Rockport).
Detailed financial feasibility analyses were performed for the Primus Power ESS at two locations in the PSE system: Bainbridge Island and Baker-River-24 (Rockport). The results are promising at the Bainbridge Island site but not at Baker River-24 (Rockport). The findings suggest that under all four scenarios considered for the Bainbridge Island deployment, the proposed ESS yields positive net benefits to PSE. The base case yields a return-on-investment ratio of 1.32 and net benefits of approximately $6.5 million. Outage mitigation represents the highest value application, generating more than $10 million in present value system benefits over the 20-year life of the ESS. Note that these benefits accrue to PSE customers and do not include the costs incurred by PSE in responding to damaged lines and taking other measures to address outages. When the peaker-equivalent method is employed, the capacity value generates nearly $7 million in benefits but falls sharply to $1.4 million when the Mid-C transmission-based method of valuing capacity is employed. Mid-C is a reference to the Mid-Columbia transmission system, which delivers generation from dams along the Columbia River located between Oregon and Washington. Distribution deferral benefits are consistent across all four scenarios at $6.3 million. Balancing and arbitrage services yield the lowest values, largely due to the significant presence of hydro in the region. Arbitrage values are also low because the optimization tool debits energy costs to this service, even if the energy is used later for balancing or other applications. At Baker River-24 (Rockport), the values derived from the ESS ($3.5 million) fall far short of the $11.6 million in net present value revenue requirements.
4 – The results are sensitive to assumptions governing the valuation of capacity and outage mitigation; downsizing to a 3 MW system on Bainbridge Island could result in higher net benefits.
To explore the sensitivity of the results to varying a number of key assumptions, the research team conducted a series of sensitivity analyses. Sensitivity analysis was performed by making adjustments to seven key assumptions. Results indicated that the first sensitivity analysis (using Mid-C transmission as the basis of the capacity valuation) results in a loss of $5.4 million in value. Findings also show a fair degree of sensitivity around changes in the valuation of outage mitigation. Using a 95 percent confidence interval to parameterize balancing prices also yields significant changes in the outcome of the analysis. However, this result does not suggest that the balancing price values could be significantly different from those presented in this study. There is a large degree of variance in the balancing prices calculated from one year to the next due to changes in hydro production; however, over the 20-year operating life of the ESS, the average price should be close to the mean price used in the base case analysis. Sensitivity
v

Analysis 7 demonstrates that by using the ESS for a second round of distribution deferral, an additional $2.5 million in value could be realized. The sensitivity analysis performed around the size of the ESS for Bainbridge Island indicates that a 3 MW system could improve the value proposition by $1.2 million. The results were not sensitive with respect to the discount rate or the use of historic energy arbitrage price data.
5 – A tool for optimizing energy storage deployment was developed and provided as an executable file.
In order to evaluate different value streams, which are at times in competition with one another, an optimization tool was developed to simulate battery operation. The scheduling (hourly) and actual operation (minute by minute) of the battery was simulated for a one-year period and a control strategy defined. An executable file was developed with a simple user interface. The user can choose from 50 balancing price signals, five services, and two locations. The battery parameters can also be modified for the run. The executable file is accompanied by a series of Excel-based input files, which can easily be modified for site-specific conditions. The model takes approximately 1 minute to run and the output includes annual values by service and the number of hours the ESS is used for each service.
vi

Acknowledgments
We are grateful to Dr. Imre Gyuk, manager of the Energy Storage System Program of the U.S. Department of Energy, Office of Electricity Delivery and Energy Reliability and Mr. Terry Oliver, Chief Technology Innovation Officer of the Technology Innovation Grant Program of the Bonneville Power Administration for co-funding this project. We also wish to acknowledge the oversight and direction provided by Mrs. Melanie Smith of BPA and Mrs. Kari Nordquist of ACME Business Consulting, LLC. Finally, we are thankful to Mr. Tom Stepien of Primus Power for his leadership and insights into the operation and management of the Primus Power energy storage system.
vii


Acronyms and Abbreviations
ACE area control error BPA Bonneville Power Administration ESS energy storage system(s) IT information technology kW kilowatt(s) MW megawatt(s) MWh megawatt hour(s) NPV net present value PSE Puget Sound Energy PNNL Pacific Northwest National Laboratory ROI return on investment SOC state of charge
ix

x
Contents
Executive Summary .............................................................................................................................. iii Acknowledgments ................................................................................................................................. vii Acronyms and Abbreviations ............................................................................................................... ix 1.0 Introduction .................................................................................................................................. 1.1
1.1 Project Synopsis ................................................................................................................... 1.2 1.2 The Primus Power Energy Storage System .......................................................................... 1.2
2.0 Objectives and Scope .................................................................................................................... 2.1 3.0 Methodology and Data ................................................................................................................. 3.1
3.1 Site Selection and Sizing the Energy Storage System.......................................................... 3.1 3.2 Assessing the Value of Energy Storage Applications .......................................................... 3.6
3.2.1 Capacity Values ......................................................................................................... 3.7 3.2.2 Balancing Services .................................................................................................... 3.7 3.2.3 Arbitrage.................................................................................................................... 3.13 3.2.4 Distribution Upgrade Deferral................................................................................... 3.13 3.2.5 Outage Mitigation Benefits ....................................................................................... 3.14 3.2.6 Overview of Optimization Tool and its Application ................................................. 3.17
3.3 Estimating Energy Storage Costs and Revenue Requirements ............................................ 3.20 4.0 Results .......................................................................................................................................... 4.1
4.1 Bainbridge Island ................................................................................................................. 4.1 4.2 Baker River-24 (Rock .......................................................................................................... 4.2 4.3 Battery Use to Maximize Value ........................................................................................... 4.3
4.3.1 Analysis of Energy Storage Schedule for Maximizing Value ................................... 4.3 4.3.2 Analysis of Values for 24-hour Period ...................................................................... 4.4 4.3.3 Discussion of Application Hours and Values ............................................................ 4.5
4.4 Sensitivity Analysis .............................................................................................................. 4.7 5.0 Conclusions .................................................................................................................................. 5.1 6.0 References .................................................................................................................................... 6.1

Figures
1.1 Study Phases and Stage Gates....................................................................................................... 1.2 1.2 The Primus Power EnergyPod® ................................................................................................... 1.3 3.1 Results of Site Screening Analysis ............................................................................................... 3.2 3.2 Map of Bainbridge Island, Washington ........................................................................................ 3.3 3.3 Historic and Forecast Peak Load – Winslow + Murden Cove ...................................................... 3.4 3.4 Energy Needed to Shave Peak on Bainbridge Island .................................................................... 3.5 3.5 Map of Baker River-24 ................................................................................................................. 3.6 3.6 Illustration of Intra-Hour Balancing Signal .................................................................................. 3.9 3.7 1-minute Balancing Signal of PSE for the Month of January 2018 .............................................. 3.10 3.8 1-minute Balancing Signal of PSE in January 1st, 2018 ............................................................... 3.11 3.9 PSE Balancing Reserve Requirement for January 2018 ............................................................... 3.11 3.10 PSE Balancing Reserve Requirement for July 2018 ..................................................................... 3.12 3.11 Total Balancing Requirements for One Typical Day in August 2018 .......................................... 3.12 3.12 Hourly Energy Price in PSE for January, 2018 ............................................................................ 3.13 3.13 Forecast Load Growth ................................................................................................................. 3.14 3.14 ESS Placement on WIN-12 Circuit............................................................................................... 3.16 3.15 Optimization and Simulation Strategy .......................................................................................... 3.17 4.1 Bainbridge Island ESS Financial Feasibility Results .................................................................... 4.2 4.2 Baker River-24 Financial Feasibility Results ............................................................................... 4.3 4.3 24-hour Energy Storage Schedule for Bainbridge Island ............................................................. 4.4 4.4 Hourly Value at Bainbridge Island for 24-hour Period ................................................................. 4.5 4.5 Annual Application Hours of the Energy Storage System ........................................................... 4.6 4.6 20-year Values of the ESS Derived from Each Service ................................................................ 4.6 4.7 Sensitivity Analysis Results – Bainbridge Island ......................................................................... 4.8
Tables
3.1 Bainbridge Island Outage Data ..................................................................................................... 3.15 3.2 Bainbridge System Cost Estimate ................................................................................................. 3.21 3.3 Major Parameters Used in Estimating ESS Revenue Requirements ............................................ 3.21
xi


1.0 Introduction
For more than a decade, the Pacific Northwest has been capable of generating more electric energy than the region’s utilities required for meeting customer demand. Now, however, the Regional Resource Adequacy Forum’s five-year forecast indicates the region will soon reach load-resource balance. Looking out to 2020, a recent analysis by the Northwest Power and Conservation Council found that the planned retirement of as much as 2,000 megawatts (MW) of electric generation in Washington and Oregon may lead to a significant degradation in the reliability of the electrical system, unless the retiring generation is replaced. In addition, planned retirements in the Southwest energy market, plus more intermittent renewable resources and stricter environmental regulations may impact winter imports that the Northwest has relied on for decades. Utilities across the region will likely need to either construct new resources or support their development financially with long-term purchased power agreements.
Puget Sound Energy (PSE) has determined that market purchases remain a least-cost choice for the present, but this strategy will need to change in the future. The region’s electric surplus has kept market prices low and made transmission contracts plus short-term power purchases a more cost effective alternative for filling peak capacity need than building new generation. This has been true not just for PSE, but for other regional utilities as well. The strategy remains sound for now, but as regional resource adequacy reaches load-resource balance and moves toward capacity deficits, physical reliability risks will grow and costs will increase. The action plan in PSE’s integrated resource plan makes a number of recommendations directed at developing a strategy for reducing reliance on the energy market.
As capacity constraints loom, the percentage of renewables on the grid continues to grow, driven by renewable portfolio standards throughout the region, production tax credits and decreasing costs. The President’s clean energy goal of 80 percent renewable energy by 2050 will require further accelerated deployment of renewable resources. In the Bonneville Power Administration (BPA) region, with a total of 6 gigawatts of wind power, the need to manage variability and intermittency of renewable energy resources has become a very real challenge, sometimes necessitating wind curtailments to sustain reliable operations. The continued increase of these renewable sources will necessitate the deployment of technologies that can address intermittency in an environmentally sustainable fashion.
Energy storage systems (ESS) have the potential to improve the operating capabilities of the electricity grid. Their ability to store energy and deliver power can increase the flexibility of grid operations while providing the reliability and robustness that will be necessary in the grid of the future— one that will be able to provide for projected increases in demand and the integration of clean energy sources while being economically viable and environmentally sustainable. As a result, energy storage has received a great deal of attention in recent years. Entrepreneurs are working enthusiastically to commercialize a myriad of promising technologies, and venture capitalists and the U.S. Government are investing in this space. The technologies show promise but it remains difficult to quantify the benefits that ESS may provide. This study is designed to add to the resources targeting this issue by providing a generalizable approach and tool for estimating the value of ESS services, as applied to a proposed ESS designed by Primus Power for application in the PSE service territory.
1.1

1.1 Project Synopsis
This report presents the results of the first phase of a three-phase project scheduled for completion in 2015. The overarching objective of this study is to analyze and demonstrate the benefits of electrical energy storage on the distribution grid in the PSE system. The three phases of this study are identified in Figure 1.1 and cover the following key elements:
• Value Assessment. Working closely with PSE, determine an appropriate site and scale for an ESS in the PSE system. Identify the largest drivers for storage (e.g., distribution deferral, balancing services) and perform a financial feasibility analysis of the proposed ESS at the preferred site. Develop a control strategy for operating the ESS.
• Implementation. Develop a site-specific engineering plan for the pilot project, secure all required permits, and develop a monitoring and reporting plan. Build and commission a 0.5 MW / 2 MWh ESS, integrate the ESS into the PSE supervisory control and data acquisition control system, and train applicable personnel on the use of the ESS.
• Monitoring and Reporting. Monitor the system for responsiveness, availability, efficiency, and other key characteristics. Test different control strategies for use during at least two seasons. Collect real data on system activity and compare actual value created to estimate the values modeled in Phase 1.
Figure 1.1. Study Phases and Stage Gates
Each phase covers one year and there are stage gates set throughout the three-year study time horizon. At each stage gate, members of the research team present an overview of accomplishments and findings to date to BPA. BPA in turn determines whether to continue the project. To date, Stage Gates 0.5 and 1.0 have been cleared.
1.2 The Primus Power Energy Storage System
Redox flow batteries promise easy-to-operate, long-duration utility-scale energy storage. Over the past few decades, a number of companies and research labs have sought to turn this promise into reality with demonstration and commercial deployment at utility scale. Primus Power, with its EnergyPod®, zinc bromide flow battery technology, is one such company. The EnergyPod® is a modular and containerized energy storage system that has the capability to store up to1 MWh of energy in a 20 foot International Organization for Standardization shipping container (see Figure 1.2). Each EnergyPod® contains 14 refrigerator-sized EnergyCells, the base battery module, connected in series, which together can be discharged at up to 420 kilowatts (kW), or at 250 kW for a duration of four hours. EnergyPods® are accompanied by a PowerBox, similarly housed, which provides the connectivity, control and power conditioning for up to eight EnergyPods®.
1.2

Figure 1.2. The Primus Power EnergyPod®
The Primus EnergyCell takes a significant departure from conventional flow battery design. Three modifications highlight this departure: 1) a metal-based bipolar electrode, 2) a single-loop flow architecture that enables the elimination of the ubiquitous separator membrane in electrochemical batteries, and 3) a high conductivity bromine sequestering agent. These elements enable the EnergyPod® system to discharge at high current density, up to 200 mA/cm2, which enables more power to be discharged per area of electrode than comparable flow battery systems. High power density supports a compact product design, which allows the EnergyPods® to be sited in footprint-limited locations like densely populated urban areas or utility substations. The elements mentioned above have additional impact on the system’s performance, including:
• enabling a long service life: the separator-less stack and the metal electrode, which leverage the same materials used in 20-year dimensionally stable anodes from the chlor-alkali industry
• increasing reliability: the EnergyPod’s® separator-less stack and single flow-loop design eliminates ~50% of the components, junctions, and pumps required to build the system, which in turn reduces maintenance and the potential for leaks
• minimizing cost: together all three modifications enable a cost roadmap that draws from well-developed, global supply chains and abundant raw materials.
1.3

The components of the EnergyPod® design have garnered ten United States and three international patents. Another 30 patent applications have been filed and numerous other inventions are in the process of invention disclosure.
Primus’ EnergyCell technology has been tested by leading research institutions and energy technology leaders. Recent tests of Primus’ EnergyCell with Sandia National Laboratories demonstrated energy efficiency of 64-73 percent at discharge durations ranging from 1 to 6 hours, and discharge power ranging from 30 kW to 4 kW. The EnergyCell also showed rapid (<1 sec) and accurate response to step change charge/discharge commands, and the ability to deliver 150 percent of nameplate power for an extended period (40 minutes). Other third parties including Bosch, Sears and Raytheon have performed technical due diligence on the EnergyPod® technology leading to joint development agreements, purchase orders, or potential collaborations.
1.4

2.0 Objectives and Scope
The overarching goal of the project described in Section 1.1 is to demonstrate and quantify the value of an ESS placed close to end-users, providing a range of services that collectively enhance the flexibility, reliability, and resiliency of the grid. This assessment addresses the following set of questions:
1. Where should energy storage be sited and at what scale to maximize value in the PSE system?
2. What energy storage applications can the ESS provide and what values are derived from these services?
3. How do we build and test an energy storage control strategy to maximize value?
4. When optimized to maximize value, do the modeled benefits exceed the revenue requirements for the battery systems?
The questions above address two time scales in which storage is usually applied: short duration, which requires storage capacities of less than 30 minutes, and longer duration storage that provides charging or discharging capabilities at rated capacity for several hours (up to four hours in this case). The ESS studied here are placed in the distribution system but values are modeled at both the transmission and distribution levels. The values derived from the ESS are limited to those accruing to PSE and its customers. An assessment of system-wide benefits of a single ESS or the benefits of multiple storage devices used in a coordinated manner are topics for further research.
2.1


3.0 Methodology and Data
Pacific Northwest National Laboratory (PNNL) developed an analytical framework for evaluating the net benefits of energy storage applications in the PSE system. Key questions resolved in the development of the associated methodology included:
1. How many scenarios should be evaluated and where should the ESS be sited?
2. What is the optimal size of the ESS in terms of both power and energy capacity?
3. What energy storage applications can be included in the analysis and how can these best be evaluated?
4. What models are required and what data must be fed into them?
5. How can an energy storage control strategy be built and tested to maximize value?
The methodology outlined in this section addresses these questions and represents a generalizable approach for estimating the value of an ESS. An optimization tool, which is described in Section 3.3 but presented in more detail in Volume 2 of this report, can be accessed and used for implementing this methodology. As part of this suite of analytical tools, a financial model was also developed to evaluate the value of applications and revenue requirements associated with the ESS.
3.1 Site Selection and Sizing the Energy Storage System
From a practical standpoint, utilities seek to deploy ESS at locations that generate the greatest value to its system. Thus, siting the ESS is an important step in defining the project and determining its financial feasibility. The methodology defined in this section relies on site-specific data to measure values associated with distribution deferral and outage mitigation. Non-battery project costs must also be developed with site-specific conditions in mind. Thus, the research team engaged system planners at PSE to define locations where energy storage was likely to be of greatest value. The outcome of these discussions resulted in the definition of four potential sites:
• Bainbridge Island, located in Puget Sound, can be reached within 35 minutes from Seattle via ferry. There are three substations serving the island, and load on two of these substations is approaching maximum capacity.
• Baker River-24 (Rockport), which is a long radial feeder in a heavily forested area. The feeder is located 100 miles north of PSE headquarters, which are located in Bellevue, Washington. There are frequent outages on this feeder due to dense vegetation and it ranks as one of the ten worst performing circuits on the PSE system when using the System Average Interruption Duration Index (SAIDI) measure.
• Chico-12, a long (62-mile) poor performing radial feeder where a $10-$15 million substation is being considered. The beginning of the Chico-12 feeder is located 72 miles to the south of Bellevue, Washington. This site also ranks as one of the 10 worst performing circuits in the PSE system with respect to SAIDI.
3.1

• Crystal Mountain, a remote feeder in a heavily forested, mountainous region of the state located near a ski resort and community. Crystal Mountain is located 50-70 miles to the southeast of Bellevue, Washington.
To further examine these sites, the research team conducted a screening analysis. The four sites were evaluated using six criteria with 100 points being awarded. These criteria are identified in Figure 3.1. The value criterion, for which a maximum of 50 points were awarded, carried the highest value and was based on a preliminary assessment of the site-specific applications (distribution deferral and outage mitigation). A maximum of 20 points were assigned based on the travel time from PSE operations/maintenance centers to the site. The requirements for site preparation and permitting were used to assign 15 points. An additional 5 points were allotted for each of the final three criteria: the extent that the project aligned with key operational priorities at PSE (operational priorities), the additional expense to ensure communication with the ESS (communication expense) and the likelihood of positive community engagement.
Figure 3.1 presents the results of the site selection analysis. The two sites receiving the highest number of points were Bainbridge Island (93) and Baker River (82). Chico-12 scored poorly on all criteria with the exception of land permitting, and the ESS was deemed infeasible for addressing the needs of Crystal Mountain. Based on the outcome of the screening analysis, Bainbridge Island and Baker River were selected for further analysis.
Figure 3.1. Results of Site Screening Analysis
As shown in Figure 3.2, there are three substations located on Bainbridge Island with a looped transmission line coming in from the north. The two radial substations (Winslow and Murden Cove) have
14
Valuation
Travel time to site
Land permitting
Operational priorities
Communica-tion expense
Community interest
Bainbridge Island Baker River Chico Crystal Mountain
Total
50
93 82 570N/a
47 28
20 10 5
8 15 15
5 4 3
5 4 4
5 3 3
N/a
N/a
N/a
N/a
N/a
N/a
3.2

a combined capacity of approximately 58 MW, and peak load on these substations is expected to reach the 58 MW trigger in 2015. The solution currently proposed by PSE is the addition of a new substation on the island with a transmission loop. PSE is currently facing significant community opposition to this concept, and is considering the potential of using an ESS to defer the investment.
Figure 3.2. Map of Bainbridge Island, Washington
In sizing and siting the battery on Bainbridge Island, the objective was to define the location on PSE’s grid and the battery size to maximize value while meeting real-world constraints of PSE’s load and service territory. The sizing process seeks to maximize the substation deferral value. In defining this size, PSE analyzed winter substation loading data from 2007-2013. It then scaled peak days to a 23°F design day and added planned block loads. A system-wide peak load growth forecast was assigned to determine the peak power capacity needed and the load shape was examined to derive the system energy
3.3
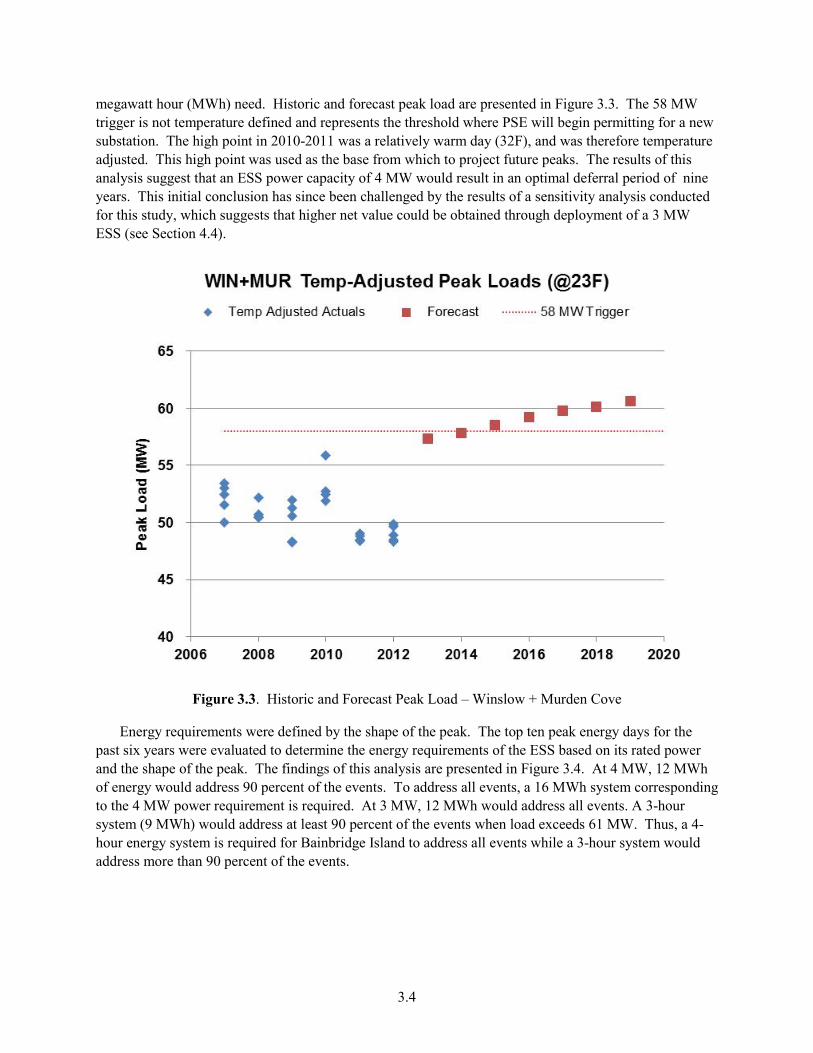
megawatt hour (MWh) need. Historic and forecast peak load are presented in Figure 3.3. The 58 MW trigger is not temperature defined and represents the threshold where PSE will begin permitting for a new substation. The high point in 2010-2011 was a relatively warm day (32F), and was therefore temperature adjusted. This high point was used as the base from which to project future peaks. The results of this analysis suggest that an ESS power capacity of 4 MW would result in an optimal deferral period of nine years. This initial conclusion has since been challenged by the results of a sensitivity analysis conducted for this study, which suggests that higher net value could be obtained through deployment of a 3 MW ESS (see Section 4.4).
Figure 3.3. Historic and Forecast Peak Load – Winslow + Murden Cove
Energy requirements were defined by the shape of the peak. The top ten peak energy days for the past six years were evaluated to determine the energy requirements of the ESS based on its rated power and the shape of the peak. The findings of this analysis are presented in Figure 3.4. At 4 MW, 12 MWh of energy would address 90 percent of the events. To address all events, a 16 MWh system corresponding to the 4 MW power requirement is required. At 3 MW, 12 MWh would address all events. A 3-hour system (9 MWh) would address at least 90 percent of the events when load exceeds 61 MW. Thus, a 4-hour energy system is required for Bainbridge Island to address all events while a 3-hour system would address more than 90 percent of the events.
3.4

Figure 3.4. Energy Needed to Shave Peak on Bainbridge Island
To determine the site of the ESS on Bainbridge Island, outage data were analyzed on each distribution feeder in order to determine the specific site that would maximize the outage mitigation or islanding value. Distribution outage data were collected for the 2010-2012 time period and transmission outage data were collected back to 2000. Data for each potential site were evaluated and the WIN-12 feeder was selected as the location of the Bainbridge site.
Sizing and locating the ESS on the Baker River-24 (Rockport) site was more straightforward. Baker River-24 is a long radial feeder in a heavily forested area. The radial feeder experiences frequent outages due to dense vegetation and is one of PSE’s least reliable circuits. The standard solution being considered is an underground conversion of the feeder. The ESS could be located downstream of trouble areas and island 640 of 835 customers on the feeder (Figure 3.5). To address the needs of the population served by the feeder an ESS of 1.85 MW / 7.4 MWh is required.
3.5

Figure 3.5. Map of Baker River-24 (Rockport)
3.2 Assessing the Value of Energy Storage Applications
Early in the development phases of the methodology, the research team considered fundamental questions concerning the timing and conceptual scale of the ESS evaluated in the study. Each of these questions affected the measurement of application values. Two timing options were considered: (a) assume the ESS is deployed in 2014 as part of the pilot project defined in Section 1.1, or (b) assume a future optimal deployment date unconstrained by the timing of the pilot project. The research team selected the second option, with 2018 serving as the analysis base year. Selection of 2018 as the base year was based on the presence of future wind integration requirements, the need for more capacity, the coincidence with five-year forecasts, and the perspective that it would take time for decisions to be integrated into the utility planning process. A similar perspective was taken in determining the scale of the project. That is, the ESS at each site was modeled based on the needs of the project, unconstrained by the 0.5 MW system proposed for the pilot.
Within the fundamental questions surrounding scenario timing and scale addressed, the research team identified various applications for which data appeared to be available and modeling approaches feasible. Of the seven applications initially identified, five were selected for further study (capacity value, balancing services, arbitrage, distribution upgrade deferral, and outage mitigation) and two were abandoned (voltage and power factor correction and emissions benefits) due to a lack of available data. Recognizing that some of these applications are in conflict with one another, an optimization tool was developed to simulate battery operations. The optimization tool was designed to build an energy system control strategy that would maximize the value derived from the ESS. The remainder of this section is dedicated to outlining the methods used in assigning values to these applications and in building the optimization tool.
3.6
3.2.1 Capacity Values
The basic assumption governing the capacity value analysis is that an ESS could offset an increment of an investment in an F-Class simple-cycle turbine with a peak winter capacity of 221 MW. For example, adding the 4 MW system on Bainbridge Island was assumed to offset a 4 MW equivalent of a peaking turbine. A detailed pro forma was built to estimate the revenue requirements for the combustion turbine. The capital cost of the turbine was estimated at $202.2 million ($915 per kW), and that value was inflated to $228.8 million for the 2018 analysis base year. Total operations and maintenance costs on the combustion turbine were estimated at $20 per kW-year and the book life of the asset was 35 years. The net present value (NPV) revenue requirements for the turbine totaled $1,616 per kW. Further assumptions were required to determine the line loss gross-up, avoided reserves and incremental capacity equivalent as follows:
• The ESS is assumed to avoid 5 percent in line losses when compared to centralized generation.
• Though the ESS is modular and resilient, PSE does not credit the system with an avoided reserve requirement.
• Given that storage does not have extended discharge capabilities, unlike a combustion turbine, it may not be as useful to PSE for both peaking events and contingency events when extended duration may be needed. With that noted, PSE performed an incremental capacity equivalent (ICE) analysis for an energy storage device with the characteristics of the Primus battery system and found the ICE to be 100 percent provided the ESS can supply four hours of energy.
Based on these assumptions, the capacity value was set at $1,697 per kW or $142.21 per kW per year.
To determine the hours when energy storage would be needed to provide capacity services, hourly PSE system-wide load forecast data were obtained for 2018. The capacity trigger was set at the peak capacity minus the power capacity of the ESS placed at each location. When the peak hourly load was forecast to exceed this value, each ESS was called upon to meet the load requirement.
An alternative to the peaker-driven basis used in two scenarios discussed later in this report is the use of Mid-C transmission contracts as the foundation of the valuation assessment. Mid-C is a reference to the Mid-Columbia transmission system, which delivers generation from dams along the Columbia River located between Oregon and Washington. In the short-run, the value of adding storage could be that PSE is enabled to shed or re-sell portions of Mid-C contracts. PSE currently relies on approximately 1,500 MW of transmission to acquire energy and capacity from the market, and holds a multitude of Mid-C transmission contracts with various termination dates. These contracts only need to be renewed for five-year terms to preserve PSE’s unilateral roll-over rights in the future. In any given year, PSE has the option to renew a portion of Mid-C capacity and reevaluate the Mid-C transmission need. This scenario does not fully account for generation costs and given the 5-year planning horizon around the decision to invest in storage, the Mid-C scenario was not selected as the base case.
3.2.2 Balancing Services
Two inputs are needed for balancing service valuation. One is the balancing service price; the other is the balancing service signal. The balancing service price was obtained for the study year 2018 by using a production cost model with the balancing reserve as one of the inputs. The balancing bids were
3.7

determined by the co-optimization. The actual balancing signal provided by the ESS varies constantly. Therefore, the balancing signal is needed to decide what the actual output of the ESS is when it provides balancing service. The rest of this section will present the stochastic methodology used to determine the balancing signal, the reserve and the results for PSE for the study year.
The power system control objective is to minimize its area control error (ACE) to the extent that it complies with North American Electric Reliability Corporation (NERC) Control Performance Standards. The “ideal” balancing signal is the signal that minimizes deviations of ACE from zero when they exceed a certain threshold:
min
)(10)(
→−≈
−+−−=−
aa
Neglected
sasa
LG
FFBIIACE
(3.1)
where I = interchange B = area frequency bias constant F = frequency ɑ = actual s = schedule Gɑ = actual generation Lɑ = actual load within the control area
Extending the generation component in the Equation 3.1,
IBsa GGG += (3.2)
where actual generation, aG , is obtained by adding hour-ahead generation schedule, sG , and the
generation required to meet intra-hour balancing requirement, IBG . The generator output is assumed to not deviate from its schedule. That is,
hafs LG _= (3.3)
where hafL _ denotes hour-ahead load forecast.
In Equation (3.1), when ACE is set to zero the intra-hour balancing signal GIB can be calculated Equation 3.4.
hafaIB LLG _−= (3.4)
When wind generation is included, wind is counted as negative load. Therefore, the equation is modified as shown in Equation 3.5.
)()( __
whaf
wahafaIB GGLLG −−−=
(3.5)
3.8

The terms in Equation (3.5), 𝐿𝐿𝑓𝑓_ℎ𝑎𝑎 and 𝐺𝐺𝑓𝑓_ℎ𝑎𝑎𝑤𝑤 , are then generated using a stationary multivariate
Markov Chain that meets all of the statistics, including the standard deviation, mean, and autocorrelation of current wind and load forecasting errors. In order to cover the uncertainty of load forecast and wind forecast errors, the Monte Carlo method has been adopted. A total of 30 Monte Carlo simulations were run to determine the balancing signal and balancing reserve requirements. The number of Monte Carlo simulations was determined based on past experience in conducting the National Assessment of Energy Storage for Grid Balancing and Arbitrage (Kintner-Meyer et al., 2013). In consideration of load and wind forecast uncertainties, 20 to 30 Monte Carlo simulations usually are sufficient.
Figure 3.6 illustrates the concept of over- and under-generation as a result of the forecasting errors for both the load and the wind energy production. The over- and under-generation is then the balancing signal, which balances generation and load and minimizes the ACE. Hence, a positive balancing signal represents under-generation, and vice versa.
Figure 3.6. Illustration of Intra-Hour Balancing Signal
The data required to determine the balancing reserve requirements are 1-minute system level load data, 1-minute system level wind generation data, and statistics of current wind and load forecast errors. PSE provided 1-minute system level load data for 2012 and the load growth factor, which is 5.8 percent from now to the study base year (2018). PSE provides balancing service for the Vantage Wind Farm, but Vantage wind generation data cannot be shared with PNNL. Vantage is located near the Wild Horse Wind Farm. Thus, PSE provided 1-minute generation data for the Wild Horse Wind Farm and Wild Horse wind generation was scaled to estimate the generation data for Vantage. The hourly forecast data of load and wind for 2012 were also provided by PSE. PNNL extracted the load forecast error based on the difference of actual load and load forecast, and the statistics of wind forecast error as well.
0 2 4 6 8 10 12 14 16 18 20 22 24Hour
Load
Under Generation
Over Generation
3.9

The balancing signal and balancing reserve requirements were estimated utilizing the wind and load datasets provided by PSE. Figure 3.7 and Figure 3.8 illustrate the resulting normalized balancing signal from one Monte Carlo simulation for the whole month of January and for January 1, 2018, respectively. This signal determined the actual output of the energy storage for every MW of balancing service bid. The outliers of the 30 Monte Carlo simulation results are removed based on BPA’s customary 99.5 percent probability bound that meets 99.5 percent of all balancing requirements. That means that 0.5 percent of all of the anticipated balancing capacity exceeds that bound. For a 100 percent probability bound, the maximum balancing requirements are likely to increase. The 24 hour incremental and decremental balancing reserve requirements for every month were obtained. Figure 3.9 and Figure 3.10 show the balancing reserve requirements of PSE for January and July 2018, respectively. The high balancing reserve requirements at around 5:00 a.m. and 6:00 a.m. in January are due to the morning load ramping up in winter time. The high balancing reserve requirements at around 10:00 p.m. and 11:00 p.m. were caused by the night load ramping down in summer time. Figure 3.11 presents total balancing requirements for one typical day in August 2018. The balancing reserve requirements served as an input for the production cost model Aurora to determine the price of the balancing signal.
Figure 3.7. 1-minute Balancing Signal of PSE for the Month of January 2018
3.10

Figure 3.8. 1-minute Balancing Signal of PSE in January 1st, 2018
Figure 3.9. PSE Balancing Reserve Requirement for January 2018
1 2 3 4 5 6 7 8 9 10 11 12 13 14 15 16 17 18 19 20 21 22 23 240
50
100
150
200
Operating Hour
PSE
RL
capa
city
, up
(MW
)
1 2 3 4 5 6 7 8 9 10 11 12 13 14 15 16 17 18 19 20 21 22 23 24-250
-200
-150
-100
-50
0
Operating Hour
RL
capa
city
, dow
n (M
W)
3.11

Figure 3.10. PSE Balancing Reserve Requirement for July 2018
Figure 3.11. Total Balancing Requirements for One Typical Day in August 2018
1 2 3 4 5 6 7 8 9 10 11 12 13 14 15 16 17 18 19 20 21 22 23 240
50
100
150
200
Operating Hour
PSE
RL
capa
city
, up
(MW
)
1 2 3 4 5 6 7 8 9 10 11 12 13 14 15 16 17 18 19 20 21 22 23 24-200
-150
-100
-50
0
Operating Hour
RL
capa
city
, dow
n (M
W)
-1500
-1000
-500
0
500
1000
1500
2000
2500
0 1 2 3 4 5 6 7 8 9 10 11 12 13 14 15 16 17 18 19 20 21 22 23
MW
Hour
3.12

3.2.3 Arbitrage
Arbitrage is the practice of taking advantage of differences between two market prices. In the context of electric energy markets, energy storage can be used to charge during low-price periods (i.e., buying electricity) in order to discharge the stored energy during periods of high prices (i.e., selling during high-priced periods). The economic reward is the price differential between buying and selling electrical energy, minus the cost of losses during the full charging/discharging cycle.
For arbitrage valuation, PSE provided the hourly energy price for the entire year of 2018. Figure 3.12 shows the hourly energy price in PSE for January, 2018. The lowest energy price is around $30 per MWh and the highest energy price is around $65 per MWh. Thus, the ESS has some opportunity to shift the demand from low-price to high-price periods to pursue arbitrage profits.
Figure 3.12. Hourly Energy Price in PSE for January, 2018
3.2.4 Distribution Upgrade Deferral
PSE has considered many options for adding additional capacity on Bainbridge Island but currently favors adding a new substation near the existing Winslow substation (see Figure 3.2). The estimated capital cost of the new 25 megavolt-ampere (MVA) substation would be $10.5 million in 2018. The deferral value is calculated as the difference in the NPV revenue requirements between building the new substation as planned by PSE versus deferring it for nine years. The revenue requirement calculation is based on a pro forma reflecting the full cost that would be incurred by PSE customers from building and operating any new capital upgrades (see Section 3.3 for a discussion of these costs).
To determine the number of deferral years, the approach outlined in Section 3.1 was used to construct the 2/1/2011 curve shown in Figure 3.13. The orange dotted line in the figure shows the 58 MW planning trigger while the green dotted line demonstrates the capacity with the 4 MW ESS added to the existing substations. Note that it would take roughly two to three years to plan, permit and construct a substation once the trigger has been reached. The figure shows that adding energy storage is forecast to defer the
$0.00
$10.00
$20.00
$30.00
$40.00
$50.00
$60.00
$70.00
1 31 61 91 121
151
181
211
241
271
301
331
361
391
421
451
481
511
541
571
601
631
661
691
721
Ener
gy P
rice
($/M
Wh)
hour
3.13

need for the new substation from 2015 to 2024. Thus, the deferral period was estimated at nine years. The revenue requirements calculations of the option that includes the deferred investment in the substation also includes a roughly $780,000 credit in avoided site, civil, and communication costs that would have been incurred in the installation of the ESS.
Figure 3.13. Forecast Load Growth (Winslow + Murden Cove Substations)
The load forecast outlined previously in this section was applied to 2012 15-minute data registered at the Winslow and Murden Cove substations. When the load exceeds the 58 MW load trigger, the ESS would be engaged to provide additional power to the system. These hours were identified and along with the value of the deferral service, input into the optimization tool outlined in Section 3.3.6.
At the Baker River-24 (Rockport) location, energy storage could be used to avoid the underground conversion of 6.3 miles of 34.5 kV feeder line. The cost of the underground conversion project is estimated at $4.4 million. The NPV revenue requirements tied to this project are estimated at $5.4 million. If storage is chosen instead of the underground conversion project, however, PSE will continue to incur costs to fix the existing lines when they are damaged. Based on historical data, these costs were estimated at $36,000 annually ($359,000 NPV) and added to the ESS case.
3.2.5 Outage Mitigation Benefits
To forecast the benefits associated with outage mitigation, historical outage events were examined at both the Bainbridge Island and Baker River-24 (Rockport) sites. These events were used to define the timing, duration, and number of customers affected by each outage. Planned or scheduled outages were removed from the data set since they typically involve very few customers and rarely would be located near the ESS where it could island them during the outage.
3.14

Events were then segregated into distribution and transmission outages. Distribution outage data on WIN-12, the preferred interconnection circuit located on Bainbridge Island, were obtained for the 2010-2012 time period, while distribution outage data for Baker River-24 (Rockport) were collected back to 2008. Transmission outage data at Bainbridge Island covered a 13-year (2000-2012) period. Baker River-24 (Rockport) transmission data were less comprehensive, covering the 2011-2012 timeframe.
From the outage data, the average annual number of outages, affected customers and durations were calculated. For example, there were, on average, 20 distribution outages and one transmission outage each year affecting the WIN-12 circuit from 2010-2012. On average, these distribution and transmission outages affected 153 and 1,168 customers, respectively. There were an average of four distribution and two transmission outages per year on the Baker River-24 (Rockport) feeder, and those outages affected an average of 839 customers. Note that PSE does not collect momentary outage data for the affected circuits.
From the population of outages covering multiple years, a number of events equal to the average annual amount (21 for Bainbridge Island and six for Baker River-24 [Rockport]) were randomly selected and scaled to represent an average year in terms of outage duration and the number of affected customers. Table 3.1 presents the timing, duration and number of affected customers for each outage selected for Bainbridge Island.
Table 3.1. Bainbridge Island (WIN-12) Outage Data
No. Date Start Time Duration (Hours) Affected Customers 1 1/2/2018 18:01:16 3.91 1 2 1/12/2018 18:22:57 1.34 3 3 1/14/2018 19:46:12 3.25 4 4 1/21/2018 7:01:00 10.00 9 5 2/14/2018 21:21:03 0.78 357 6 3/10/2018 23:29:00 1.52 1 7 3/17/2018 0:22:00 4.88 7 8 4/1/2018 14:28:13 1.19 7 9 4/2/2018 12:34:00 5.68 2 10 4/3/2018 15:01:00 4.37 1 11 6/9/2018 7:59:29 1.66 2 12 7/15/2018 18:45:00 1.85 1,168 13 9/18/2018 14:28:27 1.47 1 14 9/27/2018 9:03:39 2.04 356 15 10/24/2018 19:02:38 2.50 352 16 10/26/2018 16:27:51 1.71 2 17 10/29/2018 9:27:56 3.57 10 18 11/22/2018 18:29:26 2.75 3 19 11/26/2018 15:43:28 13.21 5 20 11/27/2018 12:09:24 4.68 1 21 12/26/2018 18:14:46 1.61 4
While the average number of affected customers per distribution outage was 153 for the entire population, the average number of customers affected by the distribution outages identified in Table 3.1 is
3.15

57. These customers represent the share of those served by the WIN-12 circuit that could feasibly be islanded during outages. To determine the share of customers who could be islanded, we assumed that the battery would be placed near the end of the circuit (Point iv in Figure 3.14). If the distribution line was damaged in Area A, the circuit could be closed off at Point i and energy provided for Areas B, C, and D (75 percent of the circuit). If Area B was damaged, the outage would be isolated at Point ii and energy would be provided for Areas C and D (50 percent). If the damage is in Area C, Area D could be isolated (25 percent). If the damage occurs in Area D, the ESS has no impact. The final step is to calculate the average share of protected customers from the four scenarios ([.75 + .50 + .25)] / 4 = .375). All customers on the circuit would be protected during transmission outages.
Figure 3.14. ESS Placement on WIN-12 Circuit
To determine the value of these outages, the affected customers were assigned to residential, commercial, and industrial classes using PSE data. All commercial and industrial customers were assumed to be small. Monetary values in the base case were assigned based on the findings of Sullivan et al. (2009), which estimated costs to customers associated with events based on customer class and outage duration. The costs presented in Sullivan et al. (2009) were inflated from 2008 to 2018 dollars based on consumer price index growth through 2013 and PSE assumptions governing cost growth from 2013 through 2018. The cost estimates used in this study covered durations of less than one hour, two to four hours, and eight to 12 hours. A polynomial trend line was used to estimate the costs associated with a one to two hour and four to eight hour event.
The outage data presented in Table 3.1 were paired with the cost data presented in Sullivan et al. (2009) to determine the monetary benefit of reducing the duration of each outage. Circuit-level load data were input into the optimization tool outlined in the next section and based on the ESS state of charge (SOC) when the outage occurred, energy from the ESS was used to reduce or eliminate the outage entirely for the islanded customers. The cost of the reduced outage was then compared to the cost of the outage at its original duration to determine the outage mitigation value. Recognizing that outage events are unpredictable, two scenarios were explored. The base case scenario assumes no foreknowledge of outage events but maintains a minimum SOC of 40 percent when not providing balancing services to ensure a minimum level of energy is available to mitigate outages. The second scenario assumes perfect foreknowledge.
The Baker River-24 (Rockport) outage analysis differs from the Bainbridge Island analysis in that the preferred alternative of placing the lines underground would eliminate distribution outages entirely. Since the ESS would only eliminate 71 percent of the distribution outages, its impact on the system would be negative when compared to the underground distribution project. Since the ESS was credited with eliminating the distribution project in the valuation analysis, the negative effects of eliminating the project must be netted out. The ESS would eliminate transmission outages that could not be addressed by burying the lines and is, therefore, credited with these gains.
WIN Sub
BatteryA B C D
i ii iii iv
3.16

In applying the approach to monetizing outage costs defined in this section, note that these costs are not incurred directly by PSE. Further, by including customer outage costs, the focus of the analysis effectively extends beyond the utility. There are outage costs directly incurred by PSE (e.g., removing a tree from a damaged line); however, these costs will be incurred in the future even with energy storage. PSE, however, does consider customer outage costs during the resource planning process. Therefore, it does place a value on extending quality service to its customers beyond minimal levels required to avoid loss claims and NERC fines. This more holistic analysis was endorsed by PSE but might not be by all utilities. Thus, this approach may require refinement based on the value individual utilities place on reliability.
3.2.6 Overview of Optimization Tool and its Application
In order to evaluate different value streams, the scheduling (hourly) and actual operation (minute by minute) of the battery was simulated for a one-year period. In scheduling, it is assumed that hourly energy and balancing service prices are available for the next 24 hours. At the beginning of each hour, an optimization problem is formulated and solved over a 24-hour period in order to capture the interdependency of battery operation between hours. The obtained current-hour base operating point (power exchange between battery and grid on the AC side) and balancing service capacity are inputs to the simulation of minute-by-minute real-time operation. In the minute by minute simulation, the amount of balancing service is first calculated for each minute. The balancing service amount is equal to the product of the balancing signal per MW and the balancing service capacity determined in the optimization. These values, together with the scheduled power exchange level, determine the actual minute-by-minute battery output. This optimization and simulation process repeats hourly, resulting in a rolling window as illustrated in Figure 3.15.
Figure 3.15. Optimization and Simulation Strategy
Due to the maximum power limit, the charging and discharging operations affect the regulation capability of the ESS. In addition, since there is only a limited amount of energy that can be stored in the
time
…
Optimization time horizon to determine base operating point for hour 1
Simulate actual operation for minute 1 in hour 1
①
②…
Optimization time horizon to determine base operating point for hour 2
Simulate actual operation for minute 1 in hour 2
①
②…
3.17

battery, battery operation in different hours is interdependent. For example, injecting more energy into the grid in one hour increases the revenue for that hour, but results in less energy to be sold in the future, which could reduce the overall revenue. Hence, the battery base operating point for each hour needs to be determined by solving a multi-hour optimization problem, as formulated in Equations 3.6a through 3.6n. In addition, the capacity value, distribution deferral, and outage mitigation services are also reflected in the optimization.
Capacity and distribution deferral value per MW is much higher than energy arbitrage and ancillary services. In addition, capacity and distribution deferral services only require the battery to meet certain power output levels during a few peak hours during a year. Therefore, they are formulated as constraints. Values from these services are estimated outside the optimization. As for outage mitigation, because neither the timing nor the duration of an outage is known when optimization is performed in the outage-without-foresight scenario, an outage does not affect the optimization process. In the outage-with-foresight scenario, the battery is scheduled to maintain full SOC before outages. Therefore, one only needs to constrain the SOC to be 1 before outages when performing optimization.
3.18

The objective expressed in (3.6a) includes revenue from energy trading and balancing services within the look-ahead window. Constraints (3.6b) and (3.6c) enforce bounds of power injection and withdrawal into/from the grid, respectively. Constraint (3.6d) is nonlinear, which ensures charging and discharging do not take place at the same time in the mathematical model. However, when η+ or η− is strictly less than 1 and λk is positive, this constraint is not necessary because it is impossible for an optimal solution with both pk
+ and pk- to be nonzero. Constraint (3.6e) expresses power transfer between the battery and grid.
Constraint (3.6f) ensures that power meets the requirement for providing capacity and distribution deferral services.
Constraint (3.6g) expresses rate of change of energy stored in the battery. Constraint (3.6h) calculates the SOC level. Constraint (3.6i) restricts the battery SOC level to be between its lower and upper bounds. Constraints (3.6j) and (3.6k) calculate balancing up and down capability, respectively. Constraints (3.6l) and (3.6m) ensure enough energy is reserved to provide balancing services. Constraint (3.6n) specifies SOC at the end of the schedule time horizon. It should be noted that l0 (when k = 1) in (3.6h) is a
3.19

parameter of this optimization, which indicates the energy stored in the battery at the beginning of each optimization window.
In the minute by minute simulation, the deviation from the base operating point is calculated for each minute as the product of the balancing signal per MW and balancing service capacity determined in the optimization. These values together with the scheduled power exchange level are used to determine the actual battery output and SOC at each minute. Once the SOC reaches the upper or lower bound, the desired output is not deployed. Therefore, the battery may fail to follow the balancing signals some of the time. In this study, the battery fails to follow balancing signals approximately 2 percent of the time. Of course, one can always increase the energy reserve εk
+ and εk- in (3.6l) and (3.6m) to improve balancing
service performance. However, this will reduce the amount of balancing services that can be provided, and therefore the balancing value from the battery. There is no extra work to simulate the capacity value and distribution deferral service in the minute by minute simulation. When an outage occurs, the battery is programmed to stop following the operation plan and start supporting the local system until the battery runs out of energy or the outage ends. The required battery output is equal to the local system load. The reduced outage duration (because of battery support) is calculated and compared with the original duration without the battery to evaluate the outage mitigation value. Finally, the SOC at the end of each hour obtained from the minute-by-minute simulation becomes the initial SOC for the next look-ahead optimization.
3.3 Estimating Energy Storage Costs and Revenue Requirements
That an ESS can be used to provide the services outlined previously in this section of the report is an important but not a singular condition to support its deployment. The value that the PSE system derives through ESS deployment must also exceed the associated revenue requirements. To examine the ESS value proposition, battery and non-battery costs were estimated at each site. Primus Power estimated the cost of its ESS, as defined in Section 1.2, at $2,300 per kW in 2018. PSE then performed a detailed analysis at each site, estimating the costs associated with siting, electrical, thermal management, site/civil, installation, communication, information technology (IT), overheads, state sales taxes, and contingency funds. PSE estimates for the Bainbridge Island ESS are presented in Table 3.2. The total cost of the ESS, including all installation and site preparation costs, is $14.8 million or $3,690 per kW. At Baker River-24 (Rockport), costs are estimated at $8.1 million or $4,384 per kW.
3.20

Table 3.2. Bainbridge System Cost Estimate
Budget Item Total Cost ($) $/kW Energy Farm Price ,200,9,200,9,200,000 2,300 Siting 25,000 6 Electrical 564,000 141 Thermal Management 283,000 71 Site/Civil 318,000 80 Installation 247,000 62 Communications 185,000 46 IT 110,000 28 Overheads 2,266,000 567 WA Sales Tax 1,057,000 264 Contingency 505,000 126 Total 14,760,000 3,690
Detailed pro formas were prepared for the ESS at each site in order to estimate total revenue requirements. The model used to support this analysis examined all initial and recurrent costs, including property and income taxes, depreciation, borrowing costs, and insurance premiums. Major parameters used in the pro formas are presented in Table 3.3. Based on these assumptions, NPV revenue requirements were estimated at $20.3 million and $11.6 million for the ESS located at Bainbridge Island and Baker River-24 (Rockport), respectively.
Table 3.3. Major Parameters Used in Estimating ESS Revenue Requirements
Parameter Total Cost System Operating Lifetime 20 years Pre-Tax Weighted Cost of Capital 7.77% Federal Income Tax Rate 35% State Revenue Tax Rate 3.8712% Property Tax Rate 0.48% Insurance Rate 0.08% Discount Rate 7.77%
3.21


4.0 Results
The methodology and data outlined in the preceding section of this report were used to address the key question of whether, when optimized to maximize value, the modeled benefits exceed the revenue requirements for the energy storage systems at Bainbridge Island and Baker River-24 (Rockport). To explore this question, four scenarios were designed and are presented in this section:
Scenario 1. Outages with no foreknowledge and Mid-C transmission-based capacity values.
Scenario 2. Outages with perfect foreknowledge and Mid-C transmission-based capacity values.
Scenario 3. Outages with no foreknowledge and the capacity value is peaker-driven.
Scenario 4. Outages with perfect foreknowledge and peaker-driven capacity value.
In addition, uncertainty was assessed around several parameters to determine the sensitivity of the results presented in this section. These parameters and the results of the sensitivity analyses are presented in Section 4.4.
4.1 Bainbridge Island
The results of the financial feasibility analysis for a 4 MW / 16 MWh ESS for Bainbridge Island are presented in Figure 4.1. The findings suggest that under all four scenarios, the proposed ESS demonstrates positive net benefits to PSE. PSE and the study authors consider Scenario 3 to be the base case. The base case yields a net return on investment (ROI) of approximately $6.5 million with an ROI ratio of 1.32.
Outage mitigation represents the highest value application, generating more than $10 million in present value system benefits over the 20-year life of the ESS. Note that these benefits accrue to PSE customers and do not include the costs incurred by PSE in responding to damaged lines and taking other measures to address outages. When the peaker-equivalent method is employed, the capacity value generates nearly $7 million in benefits but falls sharply to $1.4 million when the Mid-C transmission-based method is employed. Distribution deferral benefits are consistent across all four scenarios at $6.3 million. Balancing and arbitrage services yield the lowest values, largely due to the significant presence of low-cost hydro in the region. Arbitrage values are also low because the optimization tool debits energy costs to this service, even if the energy is used later for balancing or other applications.
4.1

Figure 4.1. Bainbridge Island ESS Financial Feasibility Results
4.2 Baker River-24 (Rockport)
The results are not as promising for the 1.85 MW / 7.4 MWh ESS at the Baker River-24 (Rockport) site. As shown in Figure 4.2, outage mitigation values are negative. The negative result occurs because the planned distribution project would eliminate 100 percent of the outages in the problem area while the ESS could island only 70.8 percent of the affected customers. Thus, the decision to install energy storage instead of placing the lines underground would result in an outage for 29.2 percent of the affected customers during each event. Thus, the ESS failed to generate positive net benefits under any of the four scenarios (see Figure 4.2).
4.2

Figure 4.2. Baker River-24 (Rockport) Financial Feasibility Results
4.3 Battery Use to Maximize Value
There are different methods for charging and discharging battery systems over time, and the total value from various applications depends on how the battery is operated. Some services are in conflict and cannot be provided simultaneously. Thus, the optimization tool described in Section 3.2.6 is used to define an optimal control strategy for battery storage. Following the optimization process, the corresponding battery benefits are then assessed. The remainder of this section discusses this process.
4.3.1 Analysis of Energy Storage Schedule for Maximizing Value
Five value streams are considered in this analysis (capacity value, balancing services, arbitrage, distribution deferral and outage mitigation). Though it is difficult to manually validate the optimal dispatch solution for the ESS, the simulation results have been reviewed to ensure they are intuitively correct. Figure 4.3 shows 1-minute output of the ESS for October 24, 2018. The top panel of the figure shows the prices of balancing up service (blue line), balancing down service (black dashed line), and the energy price (red line). Each price line is also identified in the figure. The balancing up price is zero throughout the day, so the ESS does not provide any balancing up service throughout the day. The optimization tool performs tradeoffs between the balancing down and energy services. The energy service bid is shown as a black dashed line in the middle panel. The actual output of the ESS is presented as the red line, and deviates from the initially scheduled pattern in order to provide balancing down service and in mitigating an outage at around 7:00 p.m. The bottom panel shows the SOC of the ESS. The minimum SOC of the ESS is set at 40 percent to provide sufficient energy to respond to unforeseen outages.
4.3

Figure 4.3. 24-hour Energy Storage Schedule for Bainbridge Island
4.3.2 Analysis of Values for 24-hour Period
The ESS is pursuing multiple value streams throughout each day. For the same day highlighted in the preceding section, October 24, 2018, the hourly values derived from the system are shown in Figure 4.4. During some hours, the ESS obtains both balancing down and positive energy service values. During other hours, the ESS obtains outage mitigation and energy service values. During the outage period, the ESS cannot provide balancing services because the outage event would occur upstream of the ESS and energy could not be sent through the point in the system where the damage occurs. Whenever the actual output of the ESS is negative, which means the ESS is charging, the energy service value is negative. In some hours, the net values of energy and balancing services are negative. In these cases, the benefit of providing balancing services is lower than the costs of charging the battery and the ESS is idle. In addition, whenever the value components are all zeros, the ESS is idling with zero output.
4.4

Figure 4.4. Hourly Value at Bainbridge Island for 24-hour Period
4.3.3 Discussion of Application Hours and Values
Though five value streams are available, the Bainbridge Island ESS sits idle approximately 60 percent of the time, as shown in Figure 4.5. When the ESS is not sitting idle, it most often is engaged in providing balancing (18 percent) and arbitrage (15 percent) services. The Bainbridge Island ESS is used 63 hours per year to provide the remaining services. In contrast, outage mitigation, distribution deferral and capacity provide the largest values to the ESS operator, as shown in Figure 4.6. In general, the values associated with distribution deferral, capacity and outage mitigation are therefore concentrated in a very small number of hours with very high value, so the optimization tool chooses to provide these high value services whenever possible. The main value of co-optimization is to perform tradeoffs between balancing and energy arbitrage services over most hours.
4.5

Figure 4.5. Annual Application Hours of the Energy Storage System
Figure 4.6. 20-year Values of the ESS Derived from Each Service
4.6

4.4 Sensitivity Analysis
To explore the sensitivity of the results to varying a number of key assumptions, the research team conducted a series of sensitivity analyses. Each sensitivity analysis was performed on Scenario 3 for Bainbridge Island. Sensitivity analysis was performed by making the following adjustments to the assumptions:
SA 1. Use Mid-C transmission as the basis of the capacity value.
SA 2. Reduce the size of the ESS to 3 MW.
SA 3. Vary the percentage of distribution outages mitigated by the ESS between 25 and 50 percent.
SA 4. Vary the discount rate by 1 percent.
SA 5: Use historic energy arbitrage prices, which appear more volatile than the forecast prices used in the primary analysis.
SA 6: Redeploy the battery to earn a second round of distribution deferral values.
SA 7: Use a 95 percent confidence interval on balancing service prices.
The results of each sensitivity analysis are presented in Figure 4.7. Results indicated that the first sensitivity analysis (using Mid-C transmission as the basis of the capacity valuation) results in a loss of $5.4 million in value. Sensitivity Analysis 3 shows a fair degree of sensitivity to changes in the valuation of outage mitigation. Using the 95 percent confidence interval to parameterize balancing prices also yields significant changes in the outcome of the analysis. However, this result does not suggest that the balancing price values could be significantly different from those presented in this study. There is a large degree of variance in the balancing prices calculated from one year to the next due to changes in hydro production, but over the 20-year operating life of the ESS, the average price should be close to the mean price used in the base case analysis. Sensitivity Analysis 6 demonstrates that by using the ESS for a second round of distribution deferral, an additional $2.5 million in value could be realized. The sensitivity analysis performed around the size of the ESS for Bainbridge Island indicates that a 3 MW / 12 MWh system could improve the value proposition by $1.2 million; however, by reducing the energy capacity of the ESS, PSE would incur some operational risk. If load growth exceeds forecasts, the distribution deferral period as well as the associated value could contract. The results were not sensitive with respect to the discount rate or the use of historic energy arbitrage price data.
4.7

Figure 4.7. Sensitivity Analysis Results – Bainbridge Island
4.8

5.0 Conclusions
This assessment of energy storage alternatives in the PSE system identified a preferred site and defined the scale for an ESS. It also examined the financial feasibility of the ESS at the preferred site by monetizing the values derived from a number of services provided to PSE and its customers. The ESS and the grid conditions in which it will operate were modeled and an optimization tool was employed to explore tradeoffs between services, and to develop an optimal control strategy.
The results provide crucial insights into the practical application and financial feasibility of an ESS in the PSE system. The following key lessons and implications can be drawn from this analysis:
1. After a preliminary screening analysis was conducted, Bainbridge Island and Baker River-24 (Rockport) were selected for further analysis. Based on the findings of the financial feasibility analysis, the WIN-12 circuit on Bainbridge Island was selected as the preferred site for an ESS.
2. Based on an analysis of forecast load, load shape, and energy storage services, the optimal size of the ESS on Bainbridge Island is 3 MW and 9-12 MWh.
3. Several energy storage applications were identified and methods developed for monetizing the value of each application. The findings of the financial feasibility analysis indicate that capacity value, outage mitigation, and distribution deferral values largely drive results. Thus, results are highly dependent on the location of the ESS. Balancing service and arbitrage values are less significant in the Pacific Northwest due to the presence of low-cost hydro power.
4. The total cost of the ESS on Bainbridge Island was estimated at $3,690 per kW with the delivered cost of the Primus Power Energy Pods at $2,300. An additional $1,690 per kW took the form of overhead, sales tax, and non-battery site costs, including electrical, IT, communications, and thermal management. The total cost of a 4 MW / 16 MWh ESS, including all installation and site preparation costs is $14.8 million on Bainbridge Island. Total NPV revenue requirements for the 20-year ESS are $20.3 million.
5. The proposed ESS demonstrates positive net benefits to PSE on Bainbridge Island (ROI of 1.32 and net benefits of approximately $6.5 million) but not at Baker River-24 (Rockport).
6. A tool was developed for optimizing energy storage deployment to maximize the value derived from the ESS. The tool, which is defined in Section 3.2.6, was converted into an executable file and delivered to BPA.
This report represents the first of two volumes documenting the findings and tools developed for this study. Volume 2 presents an overview of the optimization tool model structure and provides instructions for using the tool.
5.1


6.0 References
Kintner-Meyer M, P Balducci, W Colella, M Elizondo, C Jin, T Nguyen, V Viswanathan, and Y Zhang. 2013. National Assessment of Energy Storage for Grid Balancing and Arbitrage: Phase II – WECC, ERCOT, EIC. Volume 1 – Technical Analysis. Richland, WA.
Sullivan, M., Mercurio, M., and J. Schellenberg. 2009. Estimated Value of Service Reliability for Electric Utility Customers in the United States. Prepared for U.S. Department of Energy by Lawrence Berkeley National Laboratory. Berkeley, CA.
6.1


