assessment of electric cars‟ range requirements and · pdf fileassessment of electric...
TRANSCRIPT

Assessment of Electric Cars‟ Range Requirements and
Usage Patterns based on Driving Behavior recorded in
the National Household Travel Survey of 2009
A Study conducted as part of:
“3,200 Miles, Powered by the Sun”
Rob van Haaren Earth and Environmental Engineering Department, Columbia University, Fu Foundation School of Engineering
and Applied Science, 500 West 120th Street, New York, 10027 NY.
December, 2011
Contact: [email protected] Tel. +1(917)742 0095 v1.2

Electric Cars’ Range Requirements and Usage Patterns © www.solarjourneyusa.com
v1.2
Foreword
This study was conducted as part of the Solar Journey USA project, an initiative to educate the American
people about Electric Vehicles, Solar Energy and the synergy of „Sustainable Driving‟ that arises from the
two. In the summer of 2012, Garrett Fitzgerald and I aim to make a cross-country trip powered strictly by
solar energy, generated by the PV-array that we tow with us. Each day, we will recharge the batteries in
our electric car for the next leg of the trip, while giving presentations and workshops about these world-
changing technologies. Please consider a contribution to our project, as we need all the support we can
get. For more information, visit our website: www.solarjourneyusa.com.
Kind Regards,
Rob van Haaren

Electric Cars’ Range Requirements and Usage Patterns © www.solarjourneyusa.com
v1.2
Abstract
The main barrier to electrification of the car industry is the electric car‟s limited range. The fear of getting
stranded on the side of the road with an empty battery, first observed in General Motor‟s EV1 project is
named: „Range Anxiety‟. The purpose of this study is to characterize driving behavior of the United
States population (on a National and State level) and to give an overview of what percentage of trips can
be covered with a fully charged electric car. Also, this study has successfully identified factors that
influence driven distances, such as the effect of urbanity and household ethnicity. The second research
goal is to provide future research on grid integration of electric cars with a temporal outline of when
electric cars will be connected to the electricity grid. Data for this can be downloaded for free from the
website1.
1. Introduction
Over the last century, the car has become the primary means of transportation for the developed world, as
well as an icon of wealth and culture. Trillions of dollars were invested in the refueling infrastructure for
cars, which now supplies about nine million barrels of gasoline per day to the U.S. alone2. Today
however, the auto industry is at the toe-tip of the greatest transition it has ever experienced.
The automotive and oil industry are experiencing two growing forces that limit their business: 1) air
pollution prevention and 2) depletion of fuel resources. The first has evolved from a discussion about the
harmful NOx, CO and hydrocarbon emissions in the 70‟s, to a more global issue relating to the inevitable
emissions of CO2 in the combustion of hydrocarbon fuels. The emissions that impacted health were
mostly mitigated by the invention of the Three-Way-Catalyst (TWC), which successfully converts the
harmful flue gas pollutants to less harmful ones. The second limiting force has been tried to overcome by
using alternative fuels, like biomass-based (methanol/ethanol) or other fossil fuels (like the liquefaction of
coal) as a feedstock. These however have a limited capacity due to cost constraints, a high investment risk
due to the fluctuating oil price and some face ethical issues when edible food is used to make fuel.
With these limiting forces and no tangible solutions on the horizon for combustion-powered vehicles,
engineers started (re)implementing a variety of propulsion systems that require other energy sources than
oil. Virtually all of them depend on electric motors as the apparatus to drive the wheels. Believed to be
the most promising configuration is the Battery Electric Vehicle (BEV), a configuration that has been
around since the invention and implementation of the internal combustion engine (ICE) into cars. At the
end of the 19th century, the electric car was actually more popular than the gasoline powered car.
However, because of their limited range and the availability of cheap gasoline, the electric car lost the
head-to-head competition with its gasoline counterpart. Now, the electric car is on its way back, with
many car manufacturers adopting this „retro‟ propulsion system.
Still, the main barrier to electrification of the car industry is the electric car‟s limited range. The fear of
getting stranded on the side of the road with an empty battery, first observed in General Motor‟s EV1-
project is named: „Range Anxiety‟3. Besides this barrier on the consumer‟s side, electricity grid operators
and independent researchers have expressed their concerns with the additional load from electric cars on
the grid, especially during peak hours on hot summer days4,5,6
. This study aims to provide insights into
1 http://www.solarjourneyusa.com/EVdistanceAnalysis.php
2 U.S. Energy Information Administration. (2010). Annual Petroleum & Other Liquids. July 28th, 2011.
Retrieved from http://www.eia.gov/dnav/pet/pet_cons_psup_dc_nus_mbblpd_a.htm 3 Acello, R. (1997, September 1). Getting into Gear with the Vehicle of the Future. San Diego Business Journal.
San Diego. 4 IRC ISO/RTO Council, & KEMA. (2010). Assessment of Plug-in Electric Vehicle Integration with ISO / RTO
Systems. Retrieved from http://www.isorto.org/atf/cf/%7B5B4E85C6-7EAC-40A0-8DC3-

Electric Cars’ Range Requirements and Usage Patterns © www.solarjourneyusa.com
v1.2
these issues by characterizing driving behavior in the United States using a dataset published by the
Federal Highway Administration of the U.S. Department of Transportation. The hypothesis is that people
overestimate the EV-range that they find necessary for their daily driven needs. All data and results are
available from the website1 and can be used as a backbone for further research on range requirements and
grid integration of electric vehicles.
In the first part of this study, a statistical analysis is conducted on the distances driven by the U.S.
population. The results are projected on typical range bins seen in the portfolio of electric cars that are
available as of 2011. The second part covers car usage patterns on an hourly basis for weekdays and
weekends, which are in turn used to assess when cars are connected to the grid and available for charging.
This may benefit Vehicle-to-Grid (V2G) studies and other Smart-Grid initiatives.
Research Questions
Part 1: Driving Range Requirements (on both National and State level)
A. What is the distribution of distance driven for individual car trips?
B. What is the distribution of daily driven distance for a single vehicle if it is used on that day?
C. How far do people commute to work by car?
D. What household characteristics affect the answers to the above questions (urban/rural)?
Part 2: Usage Patterns for grid integration
A. From all cars surveyed, at what time during the weekday/weekend are they being driven?
B. For how many trips are cars used during the weekday/weekend?
C. When are cars used for commuting during the weekdays?
Before the methodology and results are covered, some background around EV implementation phases is
given, which will introduce the range bins used in the results. Then, a more detailed description is given
on „Range Anxiety‟, experienced by current and future EV-owners.
2. The Implementation of Electric Vehicles
The electrification of cars is happening in phases, with gradually increasing electric/combustion power
capacity ratios. This benefits the adoption of the electric car, as consumers can get used to the technology
and adapt in small steps.
In the first phase, hybrid electric vehicles (HEV) came into the picture, allowing people to get the feel of
small bits of electric driving. The Toyota Prius (1997) was the first widely available HEV, with a
revolutionary mileage of ~50 mpg. The ICE is turned off when waiting for a traffic light and initial
acceleration is done using the electric motor. The batteries are primarily charged by „regenerative
braking‟, which uses the electric motor as a generator (or: „dynamo‟) while braking. Naturally, these
applications boost mileage more for city driving than highway driving. Then, engine size decreased while
battery size and electric motor power increased, again enhancing mileage. Some models even allow short
003829518EBD%7D/IRC_Report_Assessment_of_Plug-in_Electric_Vehicle_Integration_with_ISO-
RTO_Systems_03232010.pdf 5 Pacific Gas and Electric Company. (2009). “The Perfect Storm for Electric Vehicle Market Growth in
California” Smart Grid Workshop. California Public Utilities Commission Smart Grid Rulemaking. San Francisco. 6 Papavasiliou, A., Lee, A., Kaminsky, P., Sidhu, I., Tenderich, B., & Oren, S. (2008). Electric Power Supply
and Distribution for Electric Vehicle Operations. Retrieved from
http://cet.berkeley.edu/dl/EV2Grid_FinalREVISED.pdf

Electric Cars’ Range Requirements and Usage Patterns © www.solarjourneyusa.com
v1.2
distances of Full-Electric drive under low-load conditions like for driving in residential areas (EV-mode
for Toyota Prius, 2010).
The second phase is currently in its take off phase: Plug-in Hybrid Electric Vehicles (PHEV), which for
the first time allows the driver to use another energy source besides gas, namely electricity from the grid.
The all-electric range is sufficient for most trips, and for extended trips the engine automatically turns on
to power the electric motor when the battery is depleted. The one major drawback of a full EV‟s (range) is
therefore taken out of the equation, while retaining emissions- and cost benefits of full-electric driving.
Some car manufacturers have decided to leapfrog this step (Nissan and likely BMW) and started building
BEVs right away. The Nissan LEAF is the first commercially available BEV after General Motors‟ EV1
was terminated in 2002. The BEV can be considered the final stage of the electrification of the
automotive industry. From that point on, the further environmental improvements that can be made are
cleaning the electricity source (less coal, more renewables) and improving the range of the vehicles.
The range is the BEV‟s major apparent drawback at this time, with its effect on the driver termed as
„Range Anxiety‟. One interesting idea to overcome that is put in practice by the company Better Place,
where BEVs can swap batteries instead of charging them. This allows the driver to „refuel‟ his EV in
about a minute, virtually eliminating the whole range issue of EVs, given enough of these swapping
stations exist.
The use and benefits of the second and third stage configurations is subject to the user‟s driving behavior
and it is therefore important to investigate what users‟ range requirements are for an electric vehicle of
some sort.
3. On „Range Anxiety‟
The fear of getting stranded on the side of the road with an electric car from running out of battery charge
has been termed „Range Anxiety‟. Range anxiety was first introduced when drivers of the General
Motors‟ EV1 experienced fear to drive distances near the rated EV range of their vehicle (First gen. EV1:
100 miles, Second gen.: 140 miles). Now it is the major concern for people when considering an EV.
With range of EVs so important to drivers, it has been added to the list of car specifications like
Horsepower, 0-60 in …, etc. In the following, the technological cause of range anxiety will be explained,
namely battery energy density and their recharge times. After that, some surveys about EV range
requirements will be discussed.
3.1 Battery development is key
The low specific energy of the battery pack compared to gasoline (~0.25 kWh/kg vs ~13 kWh/kg) is the
most important factor in range limitations. Numerous battery chemistries have been explored for use in
EVs, each with their own advantages and disadvantages in cycle life, energy density, specific power and
safety. The battery chemistries currently used in electric cars are mostly from the Li-ion family: LiCoO2,
LiFePO4, LiMn2O4, Li(NiCo)O2 as well as Nickel-Metal Hydride (NiMH).
To achieve a 200+ miles range, the Tesla Roadster carries 992 lbs of Li-ion batteries (this includes other
electrical components), which is more than a third of the total vehicle weight. That same range would take
around 58 lbs of gasoline for a 30 mpg ICE car. Battery technology is in great development though, with
a „technology pull‟ force from the consumer electronics industry, demanding longer battery life from
lighter and smaller cells. Consequently, the Li-ion energy density for batteries has increased from 88

Electric Cars’ Range Requirements and Usage Patterns © www.solarjourneyusa.com
v1.2
Wh/kg (1991) to 280 Wh/kg (2011). There is a theoretical limit to the specific energy of all Li-ion battery
types (ranges from 1-3 kWh/kg for the common types), but we are still far from that number.
In a recent poll by Deloitte7, 80% of the U.S. participants of the survey want a range of 100 miles or more
from an electric car. Around 60% of them want to be able to drive at least 200 miles before a recharge and
37% expects a range of 300 miles or more… In the results presented later, we will show how often people
actually drive that far on a single day.
But do people know the range of the gasoline car they are driving today?8 Of course, it only takes 10
minutes to fill up a gas tank, but it would be interesting to compare it to what people expect from electric
cars. Table 1 shows the range of the top-10 best-selling cars in the United States (in 2010). Four out of ten
vehicles have a range lower than 300 miles, with the Ford Fusion AWD FFV having the lowest range:
223 miles.
Table 1: Driving range of the 10 best-selling cars in the United States, for the year 2010. In case of multiple models, the
version with the shortest range is picked. Source: www.fueleconomy.gov
Ranking 2010 Model Range (miles)
1 Ford F150 Pickup 4WD 374
2 Chevrolet Silverado 4WD 491
3 Toyota Camry 383
4 Honda Accord 383
5 Toyota Corolla 297
6 Honda Civic 285
7 Nissan Altima 378
8 Ford Fusion AWD FFV 223
9 Honda CR-V 317
10 Dodge Ram 1500 Pickup 234
Many people are not affected by the range they get with their gasoline car. After all, refueling is quick,
simple and possible virtually anywhere. Electric vehicles however, take longer to recharge: depending on
the method, full recharge times range from typically 30 minutes (80% quick-charge9) to 48 hours (slowest
wall-outlet charge for Tesla Roadster10
).
To illustrate the difference between „recharging‟ a gasoline car and an electric car, we can make an
interesting comparison by deriving the rate at which energy is transferred into the vehicle during
refueling/recharging:
A full 13.5 gallon tank of a 2009 Ford Focus holds about 1.7 GJ of calorific energy in the form of
gasoline. Assuming you fill it up in 2 minutes, that‟s a rate of 14,000 kW. Believe it or not, that is the
peak electricity consumption of almost 2,500 households. Electric cars are different: the several charging
methods provide power ratings anywhere between 1.92 kW (standard US household outlet) and 62.5 kW
7 Deloitte. (2011). “Gaining traction: Will consumers ride the electric vehicle wave?” . Retrieved from
http://www.deloitte.com/assets/Dcom-Global/Local Assets/Documents/Manufacturing/Deloitte EV Survey
Summary Findings China US Europe Japan April 2011 _ Final.pdf 8 „What‟s your gasoline car‟s range?‟ – www.solarchargeddriving.com
9 http://www.wired.com/autopia/2009/08/nissan-electric-leaf/
10 http://www.teslamotors.com/goelectric/charging

Electric Cars’ Range Requirements and Usage Patterns © www.solarjourneyusa.com
v1.2
(DC fast-charging) for the Nissan LEAF. An innovative charging method procured by the company
„Better Place‟, swaps batteries instead of recharging them. According to the firm, the batteries are
swapped in little over a minute11
. Assuming 25 kWh batteries, that is a recharge rate of 1,500 kW (see
Figure 1).
Figure 1: Energy transfer during refueling/recharging in kW. For fuel, the calorific energy transfer of a 2-minute, 13.5
gallon fill-up was assumed. Note that the y-axis is on a logarithmic scale.
Because gasoline cars waste a much higher proportion of the energy that was transferred to them, it would
be more interesting to see how many miles are „recharged‟ per unit of time. Figure 2 shows the „effective
charging rate‟ in miles per minute for different charging methods. Of course, the number of miles driven
from 1 kWh or 1 gallon of gasoline depends on where those miles are driven (highway or city) as will be
shown later, but for now we can assume the single EPA rating for the EV range.
11
http://www.betterplace.com/the-solution-switch-stations

Electric Cars’ Range Requirements and Usage Patterns © www.solarjourneyusa.com
v1.2
Figure 2: Effective charging rates in miles per minute for the different methods.
3.2 Surveys on Range Anxiety
Surveys have been conducted around „range anxiety‟ and the implementation of (PH)EVs. The statistical
correctness of this type of studies should be carefully reviewed, as same-topic questions from multiple
studies show very different answers. Causes of this could be a selection bias (people who do not care
about EVs are less likely to take the survey), the use of cluster sampling (surveys spread through
networks like Facebook are likely to cover younger age-groups) or simply the way questions and perhaps
multiple choice answers are formulated. From a pool of seven surveys, the two below were selected as the
best-described and reported. Their results are briefly summarized below.
Accenture (PH)EV survey 2011
Accenture conducted a survey on consumer preferences regarding electrified vehicles in 13 countries,
during December 2010 and January 201112
. Random participants were chosen, representing gender, age
and income groups according to the general populations‟ distributions (n = 7003). Very interesting from
this particular study was the observed difference in opinions on the subject between countries.
For example, the question: „Are you in favor of electric vehicles (plug-in hybrid electric vehicles and full
electric vehicles) replacing conventional cars over time?‟ was answered with: „Yes, I am very much in
favor of this‟ by 86% of Chinese participants (highest of all) and only 41% of the Dutch (lowest of all).
Average over all countries was 60%.
The question: „Would you consider electric vehicles (plug-in hybrid electric vehicles or full electric
vehicles) as an option for your next car purchase?‟ was answered with „Certainly‟ or „Probably‟ by 95%
of Chinese and 41% of Dutch respondents, again the two extreme countries (average: 58%).
When asking about the favored range of an EV: „How many kilometers would you like to be able to drive
with a fully charged battery in order to consider an electric vehicle for your next purchase?‟, people
12
http://www.accenture.com/SiteCollectionDocuments/PDF/Resources/Accenture_Plug-
in_Electric_Vehicle_Consumer_Perceptions.pdf

Electric Cars’ Range Requirements and Usage Patterns © www.solarjourneyusa.com
v1.2
responded that they require at least 272 miles (437 km) of range on average. This is a very interesting
figure, compared to their self-estimated average driven distance of 32 miles. As will be shown later, the
272 miles is even beyond the full-tank range of some of the top-10 sold conventional cars.
Another interesting finding is that only 30% of the participants regard their understanding of (PH)EVs as
„enough‟ to consider electric cars when making a decision on their next car purchase. This figure ranges
from 20% to 44% over all countries.
This shows that there is a lot to be done in terms of public education on the topic of electric cars.
Accenture even states that their interpretation is that some people in this category overstate their level of
knowledge.
Electric Cars’ Range Requirements and Usage Patterns © www.solarjourneyusa.com
v1.2
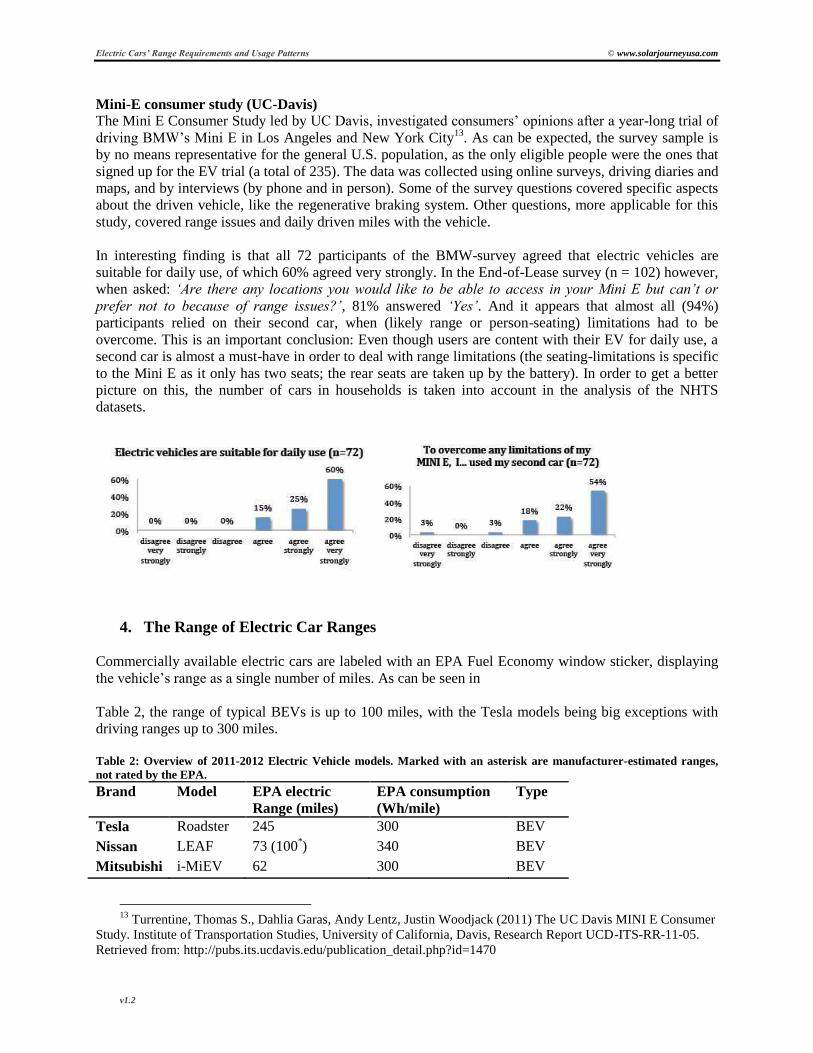
Mini-E consumer study (UC-Davis)
The Mini E Consumer Study led by UC Davis, investigated consumers‟ opinions after a year-long trial of
driving BMW‟s Mini E in Los Angeles and New York City13
. As can be expected, the survey sample is
by no means representative for the general U.S. population, as the only eligible people were the ones that
signed up for the EV trial (a total of 235). The data was collected using online surveys, driving diaries and
maps, and by interviews (by phone and in person). Some of the survey questions covered specific aspects
about the driven vehicle, like the regenerative braking system. Other questions, more applicable for this
study, covered range issues and daily driven miles with the vehicle.
In interesting finding is that all 72 participants of the BMW-survey agreed that electric vehicles are
suitable for daily use, of which 60% agreed very strongly. In the End-of-Lease survey (n = 102) however,
when asked: „Are there any locations you would like to be able to access in your Mini E but can‟t or
prefer not to because of range issues?‟, 81% answered „Yes‟. And it appears that almost all (94%)
participants relied on their second car, when (likely range or person-seating) limitations had to be
overcome. This is an important conclusion: Even though users are content with their EV for daily use, a
second car is almost a must-have in order to deal with range limitations (the seating-limitations is specific
to the Mini E as it only has two seats; the rear seats are taken up by the battery). In order to get a better
picture on this, the number of cars in households is taken into account in the analysis of the NHTS
datasets.
4. The Range of Electric Car Ranges
Commercially available electric cars are labeled with an EPA Fuel Economy window sticker, displaying
the vehicle‟s range as a single number of miles. As can be seen in
Table 2, the range of typical BEVs is up to 100 miles, with the Tesla models being big exceptions with
driving ranges up to 300 miles.
Table 2: Overview of 2011-2012 Electric Vehicle models. Marked with an asterisk are manufacturer-estimated ranges,
not rated by the EPA.
Brand Model EPA electric
Range (miles)
EPA consumption
(Wh/mile)
Type
Tesla Roadster 245 300 BEV
Nissan LEAF 73 (100*) 340 BEV
Mitsubishi i-MiEV 62 300 BEV
13
Turrentine, Thomas S., Dahlia Garas, Andy Lentz, Justin Woodjack (2011) The UC Davis MINI E Consumer
Study. Institute of Transportation Studies, University of California, Davis, Research Report UCD-ITS-RR-11-05.
Retrieved from: http://pubs.its.ucdavis.edu/publication_detail.php?id=1470

Electric Cars’ Range Requirements and Usage Patterns © www.solarjourneyusa.com
v1.2
Chevrolet Volt 35 (electric) 360 PHEV
Fisker Karma 32 (electric) 650 PHEV
Ford Focus 100*
- BEV
Tesla Model S 160/230/300*
- BEV
Coda Sedan 120*
- BEV
Smart ED 70-80*
- BEV
Because of various factors influencing the range of electric vehicles, it would have been much more
appropriate to display a range or ranges instead of giving that single number. This paragraph aims to
provide more insight into how actual range might differ from labeled range and it shows how significantly
they may differ. Before we go into that, we will describe the method which is used by the EPA to
determine EV ranges.
4.1 The SAE-J1634 test procedure
The range of electric vehicles is determined by the Environmental Protection Agency (EPA), following a
test procedure by the Society of Automotive Engineers called „Electric Vehicle Energy Consumption and
Range Test Procedure‟, or: SAE-J1634. The procedure is similar to that used for determining gasoline
cars‟ mileage, except it includes some additional practices specific to BEVs and PHEVs, regarding the
battery charge, operating temperature and calculations for the range and mileage (mpge, explained below).
The testing is conducted as follows: the electric vehicle is fully charged, parked overnight, and then the
following day driven over successive drive cycles until the battery becomes discharged and can no longer
follow the driving cycle. Some vehicles enter „limp-home‟ mode when the battery is almost empty
(limited velocity to maximize the leftover range to reach a recharge point) and this rule implies that the
EPA does not add this reserve to the vehicle‟s range label. After, the vehicle is recharged with a normal
AC source and the energy consumption determined by dividing the kWh AC consumption by the miles
driven.
The EPA currently applies the „5-cycle‟ method, which includes five city and highway driving cycles
(FTP, HFET, US06, SC03, Cold FTP; the same cycles used for establishing mpg-ratings for conventional
cars). In order to calculate mileage and range estimates, weighting factors are applied to the results of
each of the driving cycles14
. The same document states that the estimate also incorporates an additional
30% adjustment factor „to more accurately reflect the energy consumption and driving range that
customers can expect to achieve in the real world‟. In other words, the range found in the tests is adjusted
with a factor of 0.7.
14
Environmental Protection Agency. (2011). EPA Test Procedures for Electric Vehicles and Plug-in Hybrids
(draft summary). Fuel. Washington, DC. Retrieved from
http://www.smidgeindustriesltd.com/leaf/EPA/EPA_test_procedure_for_EVs-PHEVs-1-13-2011.pdf
Electric Cars’ Range Requirements and Usage Patterns © www.solarjourneyusa.com
v1.2
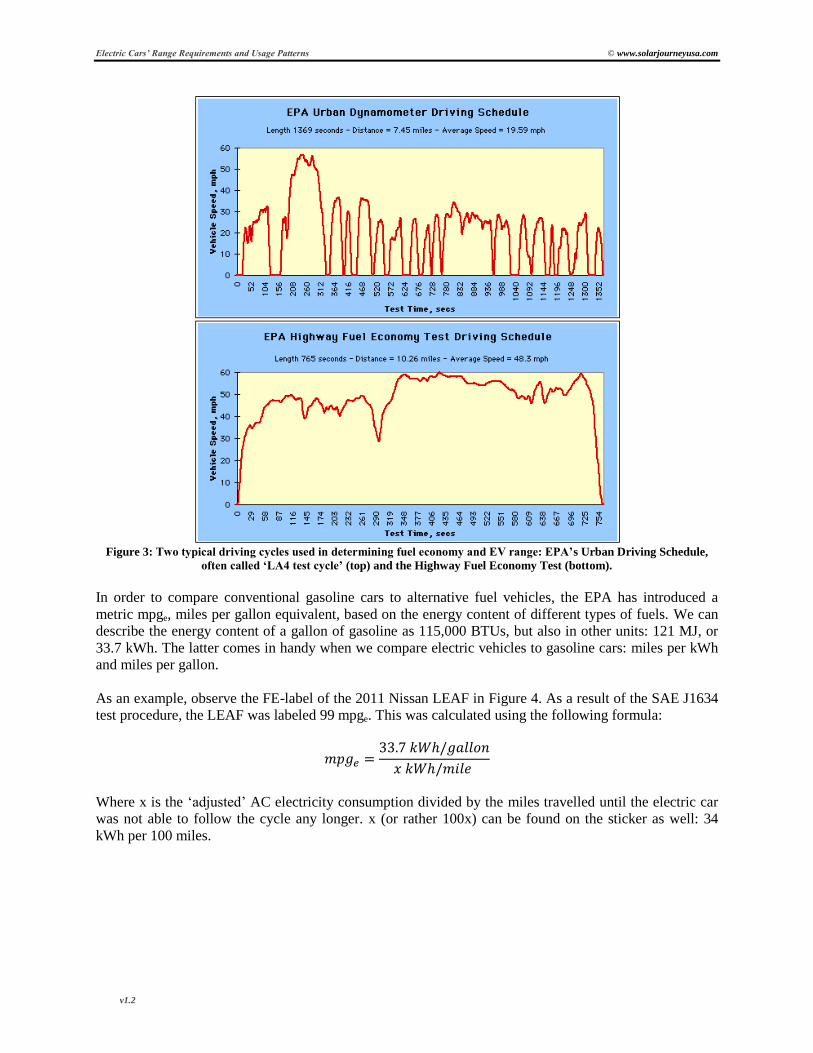
Figure 3: Two typical driving cycles used in determining fuel economy and EV range: EPA‟s Urban Driving Schedule,
often called „LA4 test cycle‟ (top) and the Highway Fuel Economy Test (bottom).
In order to compare conventional gasoline cars to alternative fuel vehicles, the EPA has introduced a
metric mpge, miles per gallon equivalent, based on the energy content of different types of fuels. We can
describe the energy content of a gallon of gasoline as 115,000 BTUs, but also in other units: 121 MJ, or
33.7 kWh. The latter comes in handy when we compare electric vehicles to gasoline cars: miles per kWh
and miles per gallon.
As an example, observe the FE-label of the 2011 Nissan LEAF in Figure 4. As a result of the SAE J1634
test procedure, the LEAF was labeled 99 mpge. This was calculated using the following formula:
Where x is the „adjusted‟ AC electricity consumption divided by the miles travelled until the electric car
was not able to follow the cycle any longer. x (or rather 100x) can be found on the sticker as well: 34
kWh per 100 miles.

Electric Cars’ Range Requirements and Usage Patterns © www.solarjourneyusa.com
v1.2
Figure 4: EPA Fuel Economy sticker for the Nissan LEAF.
Based on the displayed mpge values of city and highway, the range would be between 78 and 68 miles,
respectively. However, LEAF drivers have achieved ranges of up to 132 miles on a single charge15
. The
difference is probably a result of the 30% adjustment the EPA factors in. Nissan states a range for their
LEAF between 62 and 138 miles, giving scenarios with some more insight into the driving conditions:
- Ideal driving conditions (138 miles): Constant 38 mph, climate control off.
- Suburban on a nice day (105 miles): average 24 mph, climate control off.
- EPA LA4 test cycle (100 miles): Top speed 56.7 mph, average 19.59 mph, climate control off.
- Highway in the summer (70 miles): average 55 mph, 95 degrees outside.
- Cross-town commute on a hot day (68 miles): average 49 mph, 110 degrees outside.
- Winter, urban stop-and-go (62 miles): average 15 mph, cockpit heating high.
In Figure 5, the range scenarios are plotted together with the labeled EPA Fuel Economy range. It shows
that the worst-case scenario range (winter, urban stop-and-go) is 15% below the EPA labeled sticker
value.
Figure 5: Range scenarios of the 2011 Nissan LEAF and the vehicle‟s EPA Fuel Economy sticker value (highlighted).
Given the LEAF‟s battery capacity of 25 kWh, the DC electricity consumption varies from 180 to 400
Wh/mile in these scenarios, over a factor of two different. With such a variety in possible ranges, it hardly
15
http://blogs.insideline.com/roadtests/2011/05/2011-nissan-leaf-driving-it-to-the-bitter-end.html

Electric Cars’ Range Requirements and Usage Patterns © www.solarjourneyusa.com
v1.2
makes sense to put a single number on an EV. Especially considering that the above scenarios are based
on brand new batteries and thus do not take into account battery degradation. For future drivers, this
uncertainty in expected range may be addressed by estimating EV consumption based on temperature and
GPS readings from trips made in conventional gasoline cars (like an EV simulator; see „Discussion &
Future Research‟).
Figure 6 shows the EPA fuel economy sticker for the 2011 Tesla Roadster, displaying a 245 miles range
on a single charge. The range is so much higher than the LEAF‟s 73 miles due to a bigger battery (56
kWh vs. 24 kWh) and better energy efficiency (300 Wh/mile vs. 340 Wh/mile). The record range driven
in a Tesla Roadster (347.2 miles16
) is 42% higher than the EPA range, compared to the LEAF‟s record
range 132 miles, an 81% increase of the EPA label value. The interesting thing is that the LEAF record
was set at a higher constant velocity than the Roadster (35 mph vs. 25 mph). Perhaps the LEAF has
higher ancillary loads compared to the Roadster.
The new Model S, which will be released mid-2012, has three battery options (40, 60 and 85 kWh) and
has estimated ranges of 160, 230 and 300 miles at 55 mph (note the relative difference between the
battery capacities and range). Assuming the Model S EPA range resembles the manufacturer‟s estimates,
the 15%-rule would yield a range of at least 136, 196 and 255 miles, respectively. Applying the same
1.42:1 record-to-EPA ratio from the Roadster, maximum ranges lie at approximately 227, 327 and 426
miles.
Figure 6: Fuel Economy window sticker of the Tesla Roadster.
4.2 Energy losses for EVs at constant driving velocity
It is useful to look more closely into where the battery electricity is going and what factors play a major
role in the vehicle‟s energy consumption. A good backbone for this is a blog post of Tesla Motor‟s CTO,
JB Straubel. He broke down the different end uses of the battery capacity consumed at different constant
driving velocities for the Tesla Roadster17
.
16
http://thephoenixsun.com/archives/11976 17
http://www.teslamotors.com/blog/roadster-efficiency-and-range

Electric Cars’ Range Requirements and Usage Patterns © www.solarjourneyusa.com
v1.2
Figure 7: Tesla Roadster energy losses in Wh/mile taken from the battery. Source: Straubel, JB; "Roadster Efficiency
and Range" 2.
As shown in Figure 7, Straubel reported Wh/mile losses for Aerodynamics, Drivetrain, Tires and
Ancillary systems at different constant velocities for the Roadster. Aerodynamic losses are the major
factor in the high velocity regime (>50 mph), as air friction is proportional to V2. Every doubling of
velocity quadruples the amount of Wh/mile in aerodynamic losses. At lower velocities the drivetrain is
responsible for the majority of losses. To investigate power usage, we can convert these Wh/mile values
to power (W) by multiplying each value with its respective velocity (in mi/h).

Electric Cars’ Range Requirements and Usage Patterns © www.solarjourneyusa.com
v1.2
Figure 8: Power usage versus speed for the Tesla Roadster. Data source: Straubel, JB; "Roadster Efficiency and Range" 2
Power loss groups can have a fixed and speed-dependent component. Ancillary systems only have a fixed
component, as for example power usage of the A/C or audio system is independent of speed. All other
losses are reportedly speed-dependent, and all except the aerodynamic losses have some fixed component
to it (notice the steep slopes in Figure 7 at < 5 mph). In the following, the loss groups, ordered by
importance, are briefly described and their dependency on velocity is discussed:
Aerodynamics
Aerodynamic losses are important especially at high velocities. The force of air friction on an object is a
vector pointing in the opposite direction of movement and it has a magnitude of FD:
In applying this equation to a car, is the air density, V is the velocity of the car (relative to the air), A is
its frontal area and Cd is the drag coefficient depending on the shape of the vehicle (the Roadster is
reported to have a CD of 0.3518
). We can aggregate all of the constants into , and multiply with V to
find power losses from aerodynamics:
Fitting this curve to Straubel‟s data, we get = 3.45*10-4
(for power in kW). As is evident from this
equation, the estimated range on a vehicle is highly dependent on the velocity at which it is driven.
18
http://green.autoblog.com/2009/03/26/tesla-model-s-50-000-ev-sedan-seats-seven-300-mile-range-0-6/

Electric Cars’ Range Requirements and Usage Patterns © www.solarjourneyusa.com
v1.2
Drivetrain
Drivetrain losses are any losses resulting from the process of converting energy in the battery into torque
at the wheels of the car. These include losses in the inverter, the three-phase AC induction motor, gears,
etc. Compared to the aerodynamics, drivetrain losses are more difficult to derive from simple physics
equations, as the performance of the various subsystems of the vehicle need to be individually modeled.
However, we can consider this as a black box and fit polynomial to the data published by Mr. Straubel:
Constant represents the power usage of the complete drivetrain system when the car is not moving,
which becomes 0.375 kW. Coefficients , , and become 4*10-6
, 5*10-4
and 0.0293,
respectively.
Tires
The primary cause of rolling resistance is the effect of „hysteresis‟: the energy required for deforming the
tire‟s shape is bigger than the energy of recovery. For this reason, it is advised to regularly check the tire
pressure of your car, as soft tires exhibit more hysteresis than hard tires. The power required to overcome
the rolling resistance is a function of the normal force (weight carried by the tire) and the coefficient of
rolling resistance ( ), and is proportional to velocity :
Low rolling-resistance tires have < 0.0075, and the normal force is the curbed weight gravitational
forces of the vehicle that the specific tire is carrying. With a 35/65 front/rear weight distribution for the
Roadster, a of 0.0075 and a curbed weight of 1,235 kg, one rear wheel carries approx. 4 kN, and
for that single wheel becomes ~650 Watts at 50 mph. All wheels together would result in a power
loss of about 2 kW, which is slightly lower than the 2.8 kW according to Straubel.
Ancillary systems
Ancillary losses are considered „all other‟ electrical loads in the vehicle. Examples are user-related
systems like climate control, external lights, and audio, as well as systems necessary to regulate battery
temperature. In equation form for ancillary load on the battery:
All of the above are independent of velocity and therefore show up as a constant power usage in Figure 8.
The shown there was reported to be 0.18 kW by Straubel. However, it is important to note that the
Air Condition (AC) system was assumed off. According to a report by NREL, an electric car‟s AC system
can result in a significant range reduction19
. With a peak AC electrical load of 3 kW, the study found a
18-38% range reduction on four different driving cycles, with the highest reduction at low velocity
driving. Here, we assume that the EV has a mid-size 2 kW peak electrical load AC installed.
Also, the Tesla features a 300 Watt (peak) sound system, which could appreciably contribute to power
consumption, especially if the driver is a fan of any hard-rock or metal band.
Lights are not expected to be a big contributor to power consumption, as efficient LED lights are used in
new vehicles. Here it is assumed that the maximum power consumption of internal & external lights is
equal to 80 Watts.
It is concluded that may vary between 0.2-2.2 kW, mostly depending on the size and use of climate
control. This may not seem a significant load in Figure 8, but it is when considering low driving speeds:
19
Farrington, R. and Rugh, J., (2000). Impact of Vehicle Air-Conditioning on Fuel Economy, Tailpipe
Emissions, and Electric Vehicle Range. Retrieved from http://www.nrel.gov/docs/fy00osti/28960.pdf

Electric Cars’ Range Requirements and Usage Patterns © www.solarjourneyusa.com
v1.2
energy consumption per mile at 20 mph would almost double, therefore cutting range in little over half
compared to the AC turned off (see Figure 9). Owners of EVs should therefore be wary of stop-and-go
traffic on hot summer days. Better turn on a small fan or set the AC to a moderate temperature (e.g. 85 F
when ambient temperature is 110 F). Manufacturers of EVs can minimize the load on air conditioning by
taking measure to decrease the heat gain from the sun. Examples are: using light colors in the vehicle‟s
interior to increase the overall cabin albedo, special IR-reflective glazing and high R-value insulation
around the compartment.
Figure 9: Effect of air-conditioning load on driving range of the Tesla Roadster. The red line represents a constant 2 kW
load, as simulated by NREL4. Total battery capacity is 55 kWh. Data source: Straubel, JB; "Roadster Efficiency and
Range" 2.
4.3 Energy losses at varying velocities
The above factors were only quantified at constant driving velocities. However, real driving conditions
include acceleration and braking, respectively increasing and decreasing kinetic energy of the vehicle. In
the following, it will be briefly shown how aggressive driving affects energy consumption and range.
Kinetic energy in the vehicle is stored as linear and rotational kinetic energy, where linear kinetic energy
is the movement of the total car in its direction and rotational energy is stored in the rotating parts of the
vehicle (primarily the wheels). The equations for these are as follows:

Electric Cars’ Range Requirements and Usage Patterns © www.solarjourneyusa.com
v1.2
where is the total mass of the vehicle (in kg) and is the velocity (in m/s). Rotational kinetic energy
for any rotating object is of a similar form:
with the inertia of the rotating object (gears, wheels) and the radial velocity (in radians/s), which is
proportional to with one gear. Typically, rotational kinetic energy is only 5-10% of the total kinetic
energy stored in a car. Because it is easier to find the total mass of the car than the inertia of its wheels
and interior rotating gears, it is assumed that the total .
Using this relation, we can get an idea of the energy required to accelerate to a certain velocity (and the
energy that needs to be dissipated to bring the car to a halt), without taking into account the other losses
that were described above. Like with aerodynamic losses, we will explain that it makes sense to keep your
velocity as constant as possible. Figure 10 shows the kinetic energy stored in a 1,235 kg car like the Tesla
Roadster, at different velocities. The kinetic energy stored in the car at 90 mph is about 0.3 kWh, or about
0.5% of the total battery capacity on board.
Figure 10: The kinetic energy stored in a car with curb weight of 1,235 kg as a function of driving speed. To account for
rotational kinetic energy, the total kinetic energy is assumed 1.05 times the linear kinetic energy.
Even though an electric car is capable of regenerative braking (recover some of the kinetic energy and
store it in the battery), most of the energy is lost as heat in the disc brakes when you stomp down hard on
the brake pedal. To illustrate the difference in energy consumption for aggressive versus calm driving,
consider the following example:
A Tesla Roadster (1,235 kg) is driving 1 mile behind a truck, both travelling at 50 mph on a long, single-
lane road. The aggressive Tesla driver accelerates to 80 mph and 2 minutes later decelerates back to 50
when he reaches the truck, because he can‟t pass the vehicle. A smart driver would accelerate to 54 mph
and go back to 50 when he reaches the truck (~15 minutes later). Earlier, we learned that the aggressive

Electric Cars’ Range Requirements and Usage Patterns © www.solarjourneyusa.com
v1.2
driver will have a higher energy consumption per mile because of his high velocity, but now we focus on
the acceleration and braking.
The battery capacity the aggressive driver consumes from accelerating is 140/0.8 = 180 Wh (80% battery-
to-wheel efficiency and = 140 Wh to accelerate from 50 to 80 mph), of which he gets 40 Wh back
(assuming a 30% regenerative braking recovery efficiency for braking hard). Besides the additional losses
from driving at a higher velocity, he will use an additional 100 Wh for his acceleration and braking. The
smart driver will only use 18 Wh on his 50-54 mph acceleration and gets about 7 Wh back during braking
(now assuming 50% efficiency), yielding a total energy use of 11 Wh, or about a tenth of what the
aggressive driver is using. Again, this does not take into account the savings from driving at a lower
velocity.
The above example shows how careful and anticipative driving can help increase efficiency and driving
range. To maximize your range with your driving behavior:
- aim to keep your speed between 15-25 mph (but within safety limits);
- hold your velocity constant. Use cruise-control if you have it;
- prevent unnecessary hard braking and quick acceleration (anticipate!).
4.4 Other range influencing factors
In the last two paragraphs, we looked at how driving behavior influences energy consumption and
possible range. Energy consumption in Wh/mile was shown to increase with driving velocity above 25
mph and aggressive braking and accelerating. Also, the use of climate control affects range significantly,
especially at low traveling speeds. There are some other factors that the user often cannot control, but that
will affect driving range:
- Driving route: hills may reduce range significantly;
- Battery State-of-Charge: a „full charge‟ does not always mean that the batteries are 100%
charged;
- Battery age: batteries degrade over time as a function of Depth-of-Discharge (DoD) and the
number of cycles. Exposure to extreme temperatures is also known to accelerate degradation;
- Temperature: low ambient temperatures reduce the full charge capacity of the battery.
These factors are beyond the scope of this study and further research is needed to address them in more
detail. Perhaps an equation can be developed that estimates range by incorporating all factors that
influence range (planned GPS driving route, ambient temperature, use of A/C, battery age, and vehicle
characteristics like curb weight, aerodynamic properties, tire pressure).
5. Methodology
To characterize driving behavior of the U.S. population, a dataset of the National Household Travel
Survey 2009 was used (released Jan. 2010). The National Household Travel Survey (NHTS) provides
information to assist transportation planners and others who need comprehensive data on travel and
transportation patterns in the United States20
. 150,147 households completed the NHTS between March
2008 and May 2009 and contributed data on four levels: household, person, vehicle and travel day. The
data is organized in these four tables, although key variables occur in multiple tables to simplify analysis.
Especially important to this study are the travel day and person tables, which include information about
the covered distance on trips and the distance people commute to work.
20
U.S. Department of Transportation. (2010). National Household Travel Survey of 2009. 2009 NHTS.
Retrieved August 2011, from http://nhts.ornl.gov/index.shtml
Electric Cars’ Range Requirements and Usage Patterns © www.solarjourneyusa.com
v1.2
The NHTS data was collected with Computer Assisted Telephone Interviewing (CATI) technology that
randomly dialed telephone numbers from a list of registered landline phone numbers. Besides that, the
computer assigned the responding households a specific date as their „Travel Day‟ on which the
household members had to report all trips made using any type of transportation mode. Participants were
asked to record trips in a Travel Diary that was sent to the household prior to their Travel Day. Each
household received a reminder call the day before the assigned Travel Day. More information about the
survey process can be found in the 2009 NHTS User‟s Guide21
.
The dataset was downloaded from the NHTS website and imported into SPSS 1822
. Before the analyses
were run, the data tables were preprocessed as described in the following paragraph.
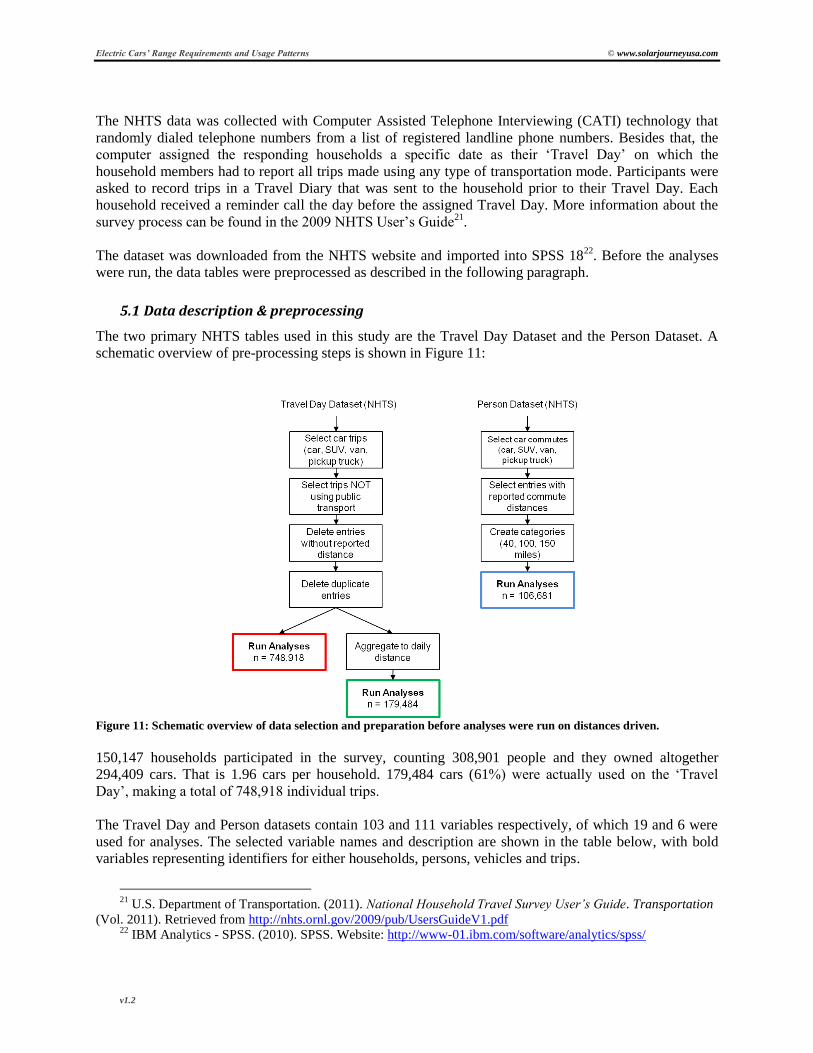
5.1 Data description & preprocessing
The two primary NHTS tables used in this study are the Travel Day Dataset and the Person Dataset. A
schematic overview of pre-processing steps is shown in Figure 11:
Figure 11: Schematic overview of data selection and preparation before analyses were run on distances driven.
150,147 households participated in the survey, counting 308,901 people and they owned altogether
294,409 cars. That is 1.96 cars per household. 179,484 cars (61%) were actually used on the „Travel
Day‟, making a total of 748,918 individual trips.
The Travel Day and Person datasets contain 103 and 111 variables respectively, of which 19 and 6 were
used for analyses. The selected variable names and description are shown in the table below, with bold
variables representing identifiers for either households, persons, vehicles and trips.
21
U.S. Department of Transportation. (2011). National Household Travel Survey User‟s Guide. Transportation
(Vol. 2011). Retrieved from http://nhts.ornl.gov/2009/pub/UsersGuideV1.pdf 22
IBM Analytics - SPSS. (2010). SPSS. Website: http://www-01.ibm.com/software/analytics/spss/

Electric Cars’ Range Requirements and Usage Patterns © www.solarjourneyusa.com
v1.2
Travel Day Dataset
Variable Description
TDCASEID Trip Number
HOUSEID HH eight-digit ID number
HHVEHCNT Count of HH vehicles
HHSTATE* State HH location
MSACAT* MSA category for the HH home address
URBRUR* Household in urban/rural area
URBANSIZE* Size of urban area in which home address is located
URBAN* Home address in urbanized area
PERSONID Person ID number
VEHID Vehicle ID number
TRIPPURP* General Trip Purpose
TRAVDAY* Travel day - day of week
TRPTRANS Transportation mode used on trip
WHYFROM* Trip purpose for previous trip
WHYTO* Travel day purpose of trip
WHYTRP1S* Trip purpose summary
PUBTRANS Respondent Used Public Transportation on trip
STRTTIME Trip START time in military
ENDTIME Trip END time in military
TRPMILES Calculated Trip distance converted into miles
WTTRDFIN Final travel day weight
Person Dataset
Variable Description
HOUSEID HH eight-digit ID number
PERSONID Person ID number
TIMETOWK Minutes to go from home to work last week
WRKTRANS Transportation mode to work last week
HH_RACE* Race of HH respondent
WTPERFIN Final person weight
Independent control variables
Some control variables were identified and their effect on dependent variables was quantified. For
example, there is a significant difference between the average trip distances for households in either an
urban or rural area. Similarly, car usage patterns greatly depend on whether the travel day is a weekday or
in the weekend.
Weighting factors
The weighting factors WTTRDFIN, WTHHFIN and WTPERFIN are used to account for sample
representativeness in each of the three datasets: Travel Day, Household and Person. Cases that are rare in
the dataset compared to their occurrence in the Census are weighted heavier than abundant cases that are
relatively rare in the population. For example, wealthier families may be less likely to take part in the
NHTS and could therefore be underrepresented. To compensate for this, wealthy families participating
are given a higher WTHHFIN than others. Similarly, WTPERFIN in the Person dataset may compensate
for a certain age-group that is underrepresented. For all weighting factors, Census data is used as a
baseline.

Electric Cars’ Range Requirements and Usage Patterns © www.solarjourneyusa.com
v1.2
5.2 Analyses
5.2.1 Cars per household
As was shown in Paragraph 3.2, the large majority of Mini-E drivers (94%) used their gasoline car when
„EV limitations‟ had to be overcome. With 100% of the participants agreeing that “EVs are suitable for
daily use”, it seems that they learned how to deal with the vehicle‟s range limitations by simply taking
their gasoline car for longer trips. Thus, an important factor in the integration of EVs is the presence of an
alternative conventional car in households, so that they can be used for long range trips. It is hypothesized
that the implementation of sub-100-mile range EVs is more difficult in households that do not own one or
more gasoline cars on the side. So how many cars do U.S. households typically own? Fortunately, this
was part of the NHTS 2009. From the Vehicles dataset, cars, SUVs, vans and pickup trucks were counted
per household ID and weighted with „WTHHFIN‟. The number of households without cars was
calculated as: the total number of households included in the NHTS minus the unique household IDs
found in the Vehicles dataset (which owned at least one car). The results were plotted in a pie-diagram.
5.2.2 Driven distance per vehicle
In order to find the driven distance per vehicle, some data entries in the travel day table had to be refined.
Since every person-trip is listed in that table, duplicate entries occur when two or more household
members were on a trip in the same vehicle. One of the duplicates remained in the dataset, while the
other(s) were deleted.
Then, the entries with the same vehicle ID‟s were aggregated (summed) on trip distance to find the daily
driven distance per car. This is important because it is very likely that cars will only be charged at home,
at least until the EV charging infrastructure is more established at destinations like workplaces and
grocery stores. Because a significant difference was found in driven distance between urban and rural
households, results are displayed for both groups separately.
5.2.3 Commuting distance
Because of the fixed distance of daily commutes, and the high likelihood of charging stations being
installed at parking places for employees, it is useful to find out the distribution of commuting distances.
From all people surveyed, 106,681 commute to work by car. The commuting distance distribution is
derived from the variable DISTTOWK from the Person dataset.
5.2.4 Car usage patterns
The variables STRTTIME, ENDTIME and TRAVDAY were used to create a car usage distribution from
the Travel Day dataset. For each minute of the day, binary variables were created (bin0001 to bin1440)
which were coded „1‟ if the vehicle was used during that minute and „0‟ if not. The resulting usage
patterns can be of value to electric grid planners for the expected rise in system load by Electric Vehicles.
Because daily usage patterns are different for weekdays and weekends, multiple characterizations were
performed. The car usage pattern analysis is done for 1) weekdays and 2) weekends. It is important to
make this categorization because of obvious differences in usage patterns for weekdays and weekends.
Before the results could be presented, some data preparation had to be done:
- The total number of cars is defined as: the sum of all cars, SUVs, vans and pick-up trucks
recorded in the NHTS „Vehicle‟ dataset for households that had their travel day in one of the

Electric Cars’ Range Requirements and Usage Patterns © www.solarjourneyusa.com
v1.2
above categories (total: 294,409 cars). This number includes cars of households that did not use
their car on the travel day.
- 1440 variables were created for every minute of the day, coded as „bin0001‟ to „bin1440‟. The
bins were applied to the Travel Day-dataset where only trips with cars were selected
(N=748,918). Each trip will have values of „1‟ in the bins that lie between the start- and end-time
of a trip. For example, if a car trip has STRTTIME = 7:10 and ENDTIME = 7:45, bin0431
through bin0465 are assigned value „1‟.
- Finally, a „Frequencies‟ syntax was run to count car usage over all minutes of the day, and the
results were inverted to display cars „parked‟ (thus: possibly connected to a charging station)
instead of cars being driven.
6. Results
6.1 Cars per Household
As was discussed before, it is important to take into account how many vehicles a household owns when
studying the implementation of EV‟s. An electric car is more easily integrated when the household has a
conventional car available for trips that go beyond the range of the EV. Households without this luxury
are more likely to consider a vehicle equipped with a range-extender (like a PHEV).
In Figure 12, a pie-diagram is shown of the breakdown of „cars per household‟ from the Vehicles dataset,
weighted by „WTHHFIN‟. Again, only cars, vans, SUVs and pickup trucks were selected from the dataset
(294,409 out of 307,956 vehicles).
Figure 12: Number of total cars, vans, SUVs and pickup trucks per household based on 150,147 household surveyed in
the NHTS 2009.
From the households that own at least one car, 64% own two or more cars. Members of these households
could possibly plan for limited range of an electric car by simply assigning the gasoline car (or PHEV) to
people with the need for extended range that day. The question arises whether both cars drive more than
the EV‟s range, but this is something for future research.

Electric Cars’ Range Requirements and Usage Patterns © www.solarjourneyusa.com
v1.2
6.2 Driven distance per vehicle
Now that we found out how many cars households have available, we can assess the travelled distance per
vehicle from the Travel Day dataset. The length of individual trips, as well as the total travelled distance
per vehicle-day was investigated. The latter is important because electric cars are likely to be charged at
least once during the day (over night, at home). Because a significant difference is found between driving
patterns of urban and rural households, results were also displayed for both groups separately.
6.2.1 Individual trip distance
The relative occurrence of individual car trips (one way) was found to rapidly decrease with trip distance
beyond 3 miles. In fact, almost 10% of all 748,918 recorded individual car trips were shorter than a mile.
Figure 13 shows a histogram with 1-mile bins for distance. There is some inaccuracy in the graph, since it
appears that participants tend to round up their reported distance to 5 mile increments.
Figure 13: Individual trip distance distribution from 748,918 car trips recorded in the 2009 NHTS. Each trip is weighted
with variable „WTTRDFIN‟.
Plotting the distribution of trips over a Cumulative Distribution Function (Figure 14) gives an indication
of the percentage of one-way trips that can be covered by electric vehicles with a range equal to the
number on the x-axis. However, underlying trip characteristics like driving speed and the use of climate
control can significantly affect electricity consumption (paragraph 4). These factors are not recorded in
the dataset and the use of the graph is therefore limited.

Electric Cars’ Range Requirements and Usage Patterns © www.solarjourneyusa.com
v1.2
Figure 14: Cumulative distribution of driven miles per trip from 748,918 car trips recorded in the 2009 NHTS. A thick
red interpolation line is drawn to hide participants‟ rounding evident in Figure 13.
The graph shows that 95% of trips are shorter than 30 miles, and 99% is below 70 miles. The weighted
average trip distance is 9.4 miles. Vehicles owned by urban households averaged 8.5 miles and rural
vehicles averaged 12.1 miles.
Overall, trips for errands, meals and school are shortest (See Table 3). Trips for recreation and work are
on average the longest, with means of 15.4 and 12.1 miles, respectively. As expected, differences are
found between urban and rural households: Car trips to work were found to be (weighted) 3.5 miles
longer for rural households (14.8 miles) compared to urban (11.2 miles). Another interesting difference is
trips to not so widely distributed services like doctors/dentists, which accounted for 2% of all recorded
trips: urban cars used for this purpose travel only 8.9 miles on average, while people from rural
households tend to travel almost twice as far (16.7 miles) for these services.
Table 3: Overview of purposes of car trips recorded in the NHTS 2009. Means and 95th percentile distances are given for
urban, rural and all trips weighted.
Trip Purpose All trips Urban HH (weighted) Rural HH (weighted)
Unweighted count
(%)
Mean
(mi)
Percentile 95
(mi)
Mean
(mi)
Percentile 95
(mi)
Mean
(mi)
Percentile 95
(mi)
Home 34% 9.3 30 8.2 28 12.7 39
Work 13% 12.1 36 11.2 35 14.8 41
School 4% 7 24 6.3 20 9.4 30
Medical 2% 10.7 34 8.9 27 16.7 50
Errands 22% 6.1 20 5.3 17 8.7 30
Social/Recreational 9% 15.4 50 15.2 50 15.8 55

Electric Cars’ Range Requirements and Usage Patterns © www.solarjourneyusa.com
v1.2
Family/Obligations 3% 11 35 10 31 13.8 43
Transport
someone
5% 7.8 26 7.1 23 10.6 34
Meals 7% 7 22 6.7 20 8.2 30
Other 0% 15.3 47 16 48 13.2 45
As was mentioned before, significant differences between States can be found for driven distances. It is
hypothesized that driving distances are influenced by the:
- State being bound by regions where cars cannot go (e.g. water);
- State‟s size (e.g. DC);
- number of single dwellings (typically agricultural States);
- ratio of urban/rural households, or population density in general.
Studying the impact of these different factors is beyond the scope of this study and perhaps material for
further research, but several interesting States can be identified where driven car distances differ
significantly from the U.S. mean. One good example is Hawaii, where the State‟s biggest island Hawai‟i
measures 90 miles from tip to tip. The highly populated islands are O‟ahu and Maui, both measure around
45 miles from tip to tip. The longest highway on the Island of Maui is about 60 miles long, looping
around the island. From the 1,226 car trips recorded in the NHTS, 99% was shorter than 30 miles and the
mean distance was 5.95 miles. Besides the favorable distances in Hawaii for the integration of EV‟s, the
economics also make sense, as gas prices are the highest found in all of the United States.
The District of Columbia also shows low trip distances, averaging 6.5 miles, as the whole DC area is
„urban‟ and counts only 61 square miles. The only contributor to long car trips would be those that have
destinations in neighboring States, for instance commutes to Baltimore, Maryland or perhaps trips to
Philadelphia.
6.2.2 Daily driven distance
The one-way trip distance distribution may not be a good indicator of the necessary range for an electric
car. This is especially true for the first years of implementation, as the charging infrastructure for EVs is
limited to Level 1 and Level 2 chargers at the owners‟ homes. For this reason, daily driven distances for
vehicles were calculated, assuming the EVs will be charged overnight. Trip distances were summed for
unique Vehicle IDs and plotted in the same histogram (Figure 15) and cumulative distribution graphs
(Figure 16). Note that the graphs do not include cars that were not used on the Travel Day.
Cars that were used on their Travel Day in the NHTS made an average of 4.2 trips, yielding a weighted
average daily distance of 39.5 miles. The distribution of the total driven distance on the Travel Day is
depicted in Figure 15.

Electric Cars’ Range Requirements and Usage Patterns © www.solarjourneyusa.com
v1.2
Figure 15: Distribution of daily driven distance for U.S. household cars if the car is used that day. Data source: NHTS
2009
With car trips aggregated for the Travel Day, 93% of all vehicle-days show a total distance below 100
miles and only 1.5% is above 200 miles. It is important to note that only vehicle-days are included where
the cars were used that day. As was mentioned before, 39% of cars owned by the participating households
were not used on the Travel Day.
Figure 16: Cumulative distribution curve for daily driven distance by cars that were used on the Travel Day (representing
61% of all cars owned by the participating households). Data source: NHTS 2009.
Electric Cars’ Range Requirements and Usage Patterns © www.solarjourneyusa.com
v1.2
Again, a significant difference was found between daily driven distance of urban and rural household
owned vehicles. Urban vehicles used on the Travel Day averaged 36.5 miles and rural vehicles averaged
48.6 miles.
Vehicles from Hawaii and District of Columbia showed 99.0% and 98.1% of daily driven distances below
100 miles, with averages of 24.5 and 24.3 miles per vehicle-day. Alabama, Kansas, Missouri and
Montana showed the highest driven distances per vehicle-day, with averages between 48 and 49 miles.
New York, California and Texas averaged 34.8, 36.2 and 41.0 miles, respectively.
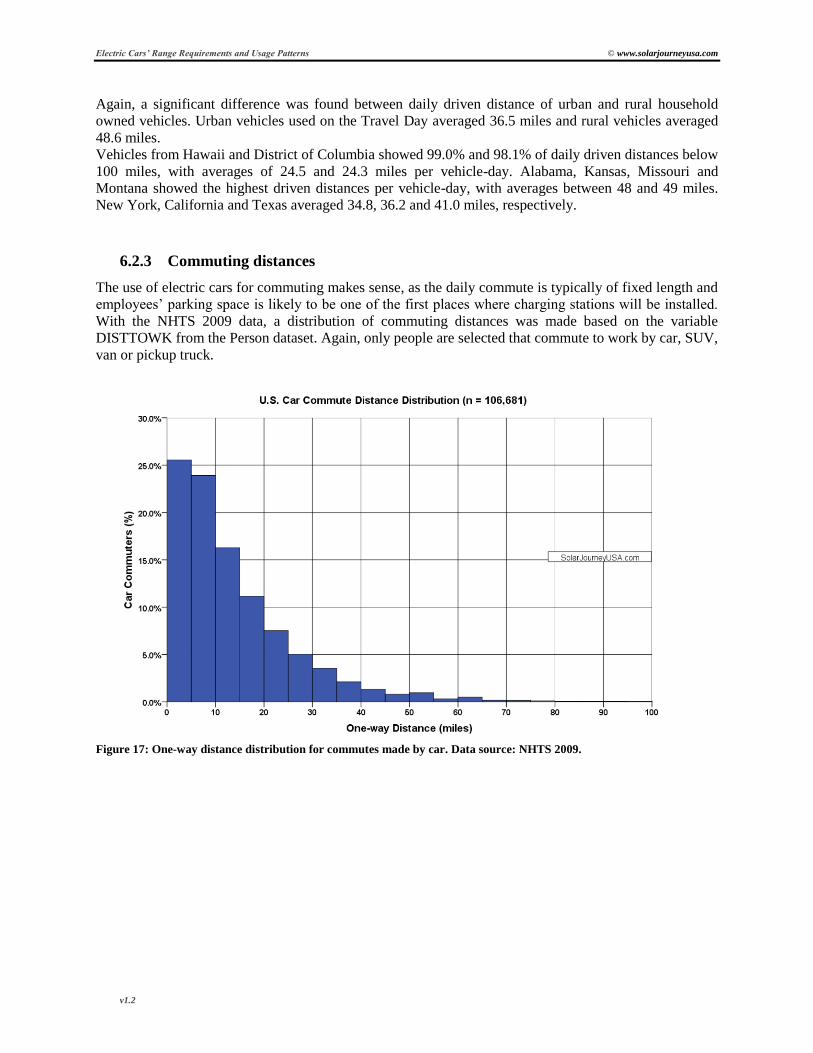
6.2.3 Commuting distances
The use of electric cars for commuting makes sense, as the daily commute is typically of fixed length and
employees‟ parking space is likely to be one of the first places where charging stations will be installed.
With the NHTS 2009 data, a distribution of commuting distances was made based on the variable
DISTTOWK from the Person dataset. Again, only people are selected that commute to work by car, SUV,
van or pickup truck.
Figure 17: One-way distance distribution for commutes made by car. Data source: NHTS 2009.

Electric Cars’ Range Requirements and Usage Patterns © www.solarjourneyusa.com
v1.2
Figure 18: Cumulative distance distribution for commutes made by car. Data source: NHTS 2009.
As can be seen from Figure 18, approximately 95% of car commuters in the U.S. travel less than 40 miles
to work (the weighted average is 13.6 miles). Weighted averages for States vary from 7 miles (Alaska,
North & South Dakota) to 22 miles (Mississippi), although the sample sizes of these States (around 200)
yields a ~10% error on a 95% confidence interval.
6.3 Car Usage Patterns
Electric cars are expected to have a significant impact on the electricity grid when they reach high
penetration levels. An electric car that drives an average 40 miles per day will take approximately 14 kWh
to recharge23
. This additional load would increase average U.S. household electricity consumption
(11,496 kWh/year24
) by ~50%. The time at which this additional load is required from the grid is of great
importance, as generators and transmission lines are limited to a certain capacity. With the results
presented below, follow up studies can be done on EV grid integration and necessary capacity upgrades to
maintain reliability of electricity supply (data can be downloaded from the website25
).
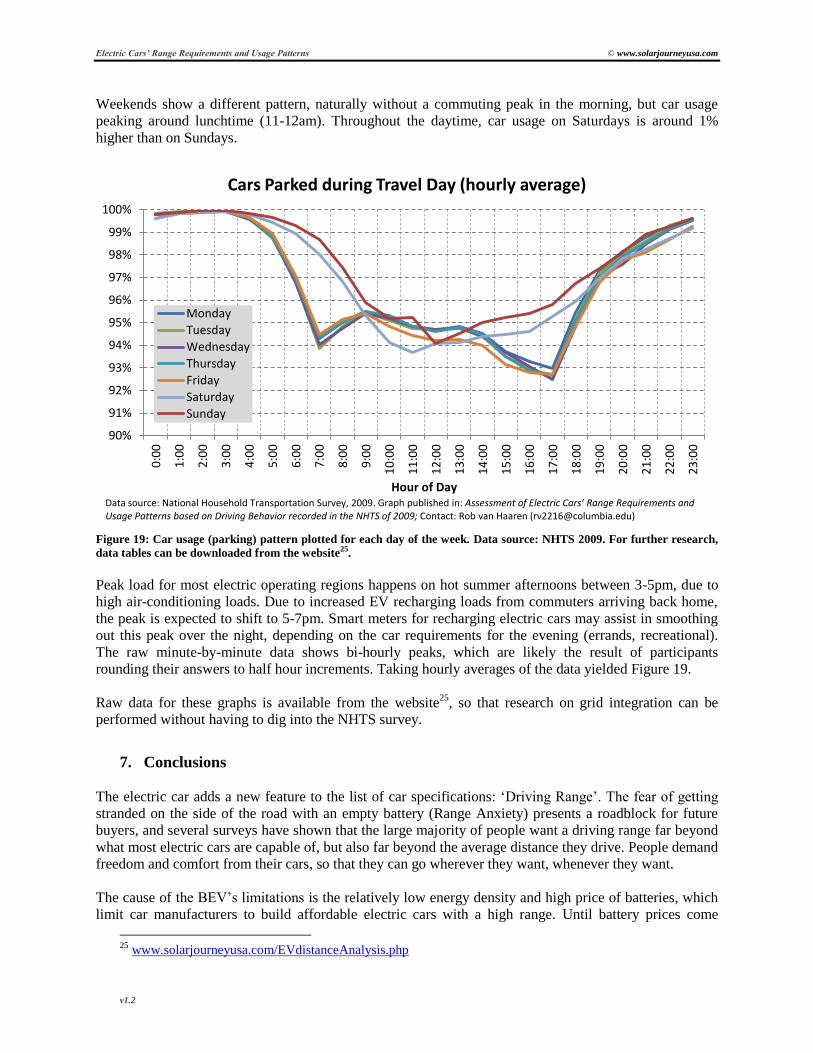
In Figure 19, car usage patterns are displayed for each day of the week. The results are based on the car
trips recorded in the NHTS Travel Day dataset, and the total number of cars owned by the surveyed
households (294,409 cars, of which 61% were used on the Travel Day). For each day, around 42,000 cars
are included. For each minute of the day, the number of cars in use is evaluated. Car usage ramps up on
weekdays at around 4am, increasing to ~6% at 7:30am. After the morning commute, it dips back down to
4.5% at 9:30am. During the day, usage gradually increases to its daily peak (7%) at 5pm. In the evening,
usage falls down steadily to 3.5% at 8pm and 1% at 10pm.
23
Based on Nissan LEAF consumption figure: 340 Wh/mile 24
http://205.254.135.7/tools/faqs/faq.cfm?id=97&t=3
Electric Cars’ Range Requirements and Usage Patterns © www.solarjourneyusa.com
v1.2
Weekends show a different pattern, naturally without a commuting peak in the morning, but car usage
peaking around lunchtime (11-12am). Throughout the daytime, car usage on Saturdays is around 1%
higher than on Sundays.
Figure 19: Car usage (parking) pattern plotted for each day of the week. Data source: NHTS 2009. For further research,
data tables can be downloaded from the website25.
Peak load for most electric operating regions happens on hot summer afternoons between 3-5pm, due to
high air-conditioning loads. Due to increased EV recharging loads from commuters arriving back home,
the peak is expected to shift to 5-7pm. Smart meters for recharging electric cars may assist in smoothing
out this peak over the night, depending on the car requirements for the evening (errands, recreational).
The raw minute-by-minute data shows bi-hourly peaks, which are likely the result of participants
rounding their answers to half hour increments. Taking hourly averages of the data yielded Figure 19.
Raw data for these graphs is available from the website25
, so that research on grid integration can be
performed without having to dig into the NHTS survey.
7. Conclusions
The electric car adds a new feature to the list of car specifications: „Driving Range‟. The fear of getting
stranded on the side of the road with an empty battery (Range Anxiety) presents a roadblock for future
buyers, and several surveys have shown that the large majority of people want a driving range far beyond
what most electric cars are capable of, but also far beyond the average distance they drive. People demand
freedom and comfort from their cars, so that they can go wherever they want, whenever they want.
The cause of the BEV‟s limitations is the relatively low energy density and high price of batteries, which
limit car manufacturers to build affordable electric cars with a high range. Until battery prices come
25
www.solarjourneyusa.com/EVdistanceAnalysis.php
90%
91%
92%
93%
94%
95%
96%
97%
98%
99%
100%
0:0
0
1:0
0
2:0
0
3:0
0
4:0
0
5:0
0
6:0
0
7:0
0
8:0
0
9:0
0
10
:00
11
:00
12
:00
13
:00
14
:00
15
:00
16
:00
17
:00
18
:00
19
:00
20
:00
21
:00
22
:00
23
:00
Hour of Day
Cars Parked during Travel Day (hourly average)
Monday
Tuesday
Wednesday
Thursday
Friday
Saturday
Sunday
Data source: National Household Transportation Survey, 2009. Graph published in: Assessment of Electric Cars’ Range Requirements and Usage Patterns based on Driving Behavior recorded in the NHTS of 2009; Contact: Rob van Haaren ([email protected])

Electric Cars’ Range Requirements and Usage Patterns © www.solarjourneyusa.com
v1.2
down, range anxiety remains a major hurdle for buyers. Plug-in Hybrid Electric Vehicles (PHEV) do not
have this problem, as they allow the driver to get more acquainted with the concept of electric driving,
while having the comfort of „unlimited range‟.
Range anxiety is especially problematic because the range of an electric car is greatly affected by driving
velocity, aggressive driving, as well as the use of climate control. Actual range may be ±40% of the
displayed range by the manufacturer26
. The use of different drive cycles allows for the derivation of
multiple energy consumption figures and range estimates, but these are not communicated to the public;
instead, a single number is used. The inclusion of a „±x miles‟ metric in the EV driving range
specifications and more education on this topic are strongly recommended in the implementation process
of Electric Vehicles.
This study attempted to give more insights into the distance people (or: vehicles) drive, using the National
Household Travel Survey of 2009. From this resourceful dataset, it was found that 61% of all
participating cars, SUVs, vans and pickup trucks were used on the Travel Day. For individual trips, 95%
is below 30 miles and 99% is below 70 miles. When driven distance is aggregated over the whole day, it
is found that ~95% is below 120 miles and 99% is below 250 miles. Car commuting distances were found
to average 12.6 miles nationally, with 95% below 40 miles and 99% shorter than 60 miles. Assuming the
electric car is charged overnight only, a Nissan LEAF with a 62-138 mile range would be able to satisfy
83-95% of all travel days, depending on driving conditions as described before. A 2011 Tesla Roadster
would be able to satisfy >98.5% of travel days, assuming a minimum range of 0.85 times the EPA-labeled
range.
Great variation was found over all States. Vehicles owned by households in districts constraint by area
like Hawaii and District of Columbia were found to be driven shorter distances than others (~24 miles per
day, compared to a National average of 39.5 miles per day). On the other hand, States with primarily rural
areas and a large fraction of the population living in single dwellings or small towns (typically in the
Midwest) averaged higher driven distances (up to 49 miles per day).
Perhaps the most important conclusion is that the majority of U.S. households have the luxury to simply
pick their gasoline car in case they plan on a long trip. 64% of households that own one or more cars have
the luxury of owning a gasoline car besides their future EV (assuming the EV replaces a gasoline car).
Think of it as owning both a two-seater and a sedan: would you choose the two-seater if you‟re picking
up three friends to go watch the football game? We‟ve seen that 39% of all cars are not even used on the
Travel Day. This gives rise to a new research question: „From all cars owned by members of a household,
how many vehicles drive beyond a distance of x miles on the Travel Day?‟
Car usage patterns were also derived from the NHTS dataset. The percentage of cars parked during the
day was found to differ between weekdays and weekends, with a minimum of 93% (5pm) and 94%
(11am-12pm), respectively. The results presented in this paper can be useful to grid operators in assessing
additional load from EVs connected to their system. Together with the distribution of driven distances,
charging patterns can be derived and applied to models of future load scenarios in electric grid systems.
Population density maps can be used to derive the locations of this additional demand in the grid. All data
presented in this paper is available for download from the website25
. Also, requests for State-specific data
or other inquiries can be sent to [email protected].
26
According to Nissan, their LEAF has a range of 100 miles, but different scenarios yield a range of 62-138
miles (Paragraph 4.1).

Electric Cars’ Range Requirements and Usage Patterns © www.solarjourneyusa.com
v1.2
8. Discussion & Future Research
Although the results presented in this paper are good indicators for driving behavior of a large population,
they cannot be applied to individual people or households. Besides that, driving velocity, use of climate
control and other range influencing factors were not captured by the survey and these were shown to
greatly influence range.
Further research will focus on expanding the car usage patterns, by specifying parking spots (home,
workplace) which are likely to adapt charging stations early on in the implementation process. This will
increase accuracy of electricity load prediction.
In terms of range analysis, an average driving velocity may help in estimating consumption. Trips of
longer distance are likely to take place on highways, therefore effectively increasing energy consumption
per mile (as shown in section 4). Average velocity can be derived from the NHTS database as distance
and duration are recorded for each trip. Also, additional analyses may be done on households with more
than one car, as simple decisions may be made on: „who takes the electric car today?‟, to assure that trips
with a range beyond the EV‟s driving range are made by the gasoline car in the family.
Another useful expansion on Section 4 of this paper would be to build a personal „EV range-assessment
tool‟. A Smartphone or GPS-device may be used to collect people‟s car coordinates during trips, of which
the data can be used to estimate velocity and acceleration for each timestamp and consequently the EV
battery consumption of the whole trip. Additional data that can be used in this model would be:
- Temperature (to estimate use of climate control);
- Elevation differences (to estimate potential energy necessary to climb hills);
- Wind velocity and direction (may add significantly to energy consumption).
This tool may help future car-buyers to assess whether an EV would fit their needs, and what range the
vehicle needs to have. Also, it could estimate the payback time for the EV or PHEV and for the people
who are interested, the reduction in their carbon footprint.
9. Acknowledgements
I want to thank Sander A. Mann for the discussions and brainstorm sessions we had during the start-up of
this study. Ik hoop je snel weer in NYC te mogen begroeten!

Electric Cars’ Range Requirements and Usage Patterns © www.solarjourneyusa.com
v1.2
10. Appendices
Below are the tables for the „EV distance assessment‟ of the study. They are organized by a) Single Trip
Distances, b) Daily Driven Distances and c) Car Commuting Distances.
Feel free to contact me (Rob van Haaren: [email protected]) if you want a specific assessment done
for a State of your interest or any other request, question or comment.
Appendix A: Single Trip Distances
Tables and graphs:
Single trips: Weighted means and standard deviations for urban & rural:
Report
TRPMILES
URBRUR Mean N Std. Deviation
NA 11.00 313651 .00
Urban 8.55 2.E11 23.84
Rural 12.09 6.E10 23.85
Total 9.40 2.E11 23.90
Single trips: Unweighted means and standard deviations:
Report
TRPMILES
URBRUR Mean N Std. Deviation
NA 11.00 2 .00
Urban 8.19 533065 23.15
Rural 11.48 215851 24.71
Total 9.14 748918 23.66

Electric Cars’ Range Requirements and Usage Patterns © www.solarjourneyusa.com
v1.2
Urban:
Rural:

Electric Cars’ Range Requirements and Usage Patterns © www.solarjourneyusa.com
v1.2
Example State: California Trip Distance Distribution:
Single State Range classification: What percentage of (weighted) trips are below x miles?
Range Category (x miles)
40 100 150 >150
Row N % Row N % Row N % Row N %
HHSTATE AK 98.2% 1.3% .1% .5%
AL 95.1% 4.0% .8% .1%
AR 96.5% 3.2% .3% .0%
AZ 97.9% 1.6% .4% .2%
CA 96.7% 2.7% .3% .2%
CO 97.9% 1.5% .3% .3%
CT 94.9% 4.6% .5% .1%
DC 98.3% 1.5% .1% .0%

Electric Cars’ Range Requirements and Usage Patterns © www.solarjourneyusa.com
v1.2
DE 96.1% 3.2% .6% .0%
FL 97.2% 2.3% .2% .2%
GA 96.1% 3.1% .4% .4%
HI 99.6% .4% .0% .0%
IA 97.0% 2.5% .3% .2%
ID 97.5% 2.4% .0% .0%
IL 97.6% 2.1% .1% .2%
IN 96.9% 2.7% .2% .2%
KS 95.2% 2.9% 1.1% .8%
KY 96.9% 2.3% .3% .5%
LA 96.9% 2.3% .0% .8%
MA 96.0% 3.1% .5% .5%
MD 95.9% 3.1% .3% .7%
ME 95.2% 3.7% .3% .7%
MI 97.4% 2.2% .1% .3%
MN 97.3% 1.9% .4% .3%
MO 96.3% 2.9% .2% .6%
MS 93.9% 5.4% .5% .2%
MT 96.8% 2.2% .2% .8%
NC 96.7% 2.5% .3% .4%
ND 95.9% 2.6% 1.4% .1%
NE 96.3% 3.2% .2% .2%
NH 95.7% 3.6% .7% .0%
NJ 95.3% 3.7% .4% .6%
NM 98.0% 1.3% .2% .5%
NV 97.8% 1.1% 1.0% .0%
NY 97.3% 2.2% .2% .3%
OH 97.0% 2.4% .3% .3%
OK 95.9% 2.5% 1.0% .7%
OR 98.0% 1.3% .4% .3%
PA 97.1% 2.0% .3% .5%
RI 96.7% 2.5% .2% .5%
SC 97.1% 2.4% .3% .2%
SD 95.8% 3.3% .3% .7%
TN 96.7% 2.5% .3% .5%

Electric Cars’ Range Requirements and Usage Patterns © www.solarjourneyusa.com
v1.2
TX 96.9% 2.5% .3% .4%
UT 96.9% 2.8% .1% .2%
VA 96.6% 2.8% .3% .3%
VT 96.3% 3.2% .3% .3%
WA 96.7% 2.8% .4% .1%
WI 96.1% 3.0% .5% .5%
WV 94.2% 4.9% .4% .5%
WY 95.2% 3.6% .8% .3%
Single State (weighted) trip distance mean, unweighted count, 99th
percentile and 95th
percentile.
Trip Miles
Mean
Unweighted
Count Percentile 99 Percentile 95
HHSTATE AK 6.4565149278 1369 50.0000000000 18.0000000000
AL 11.8892547986 2145 86.0000000000 38.0000000000
AR 9.3967919583 1320 65.0000000000 34.0000000000
AZ 9.5640557474 35669 77.0000000000 25.0000000000
CA 8.6994105335 105237 70.0000000000 30.0000000000
CO 8.7281454131 1711 60.0000000000 26.0000000000
CT 10.3827435608 1451 90.0000000000 40.0000000000
DC 6.5201425801 721 43.0000000000 30.0000000000
DE 9.6832771877 1324 90.0000000000 35.0000000000
FL 8.9707590552 73627 64.0000000000 30.0000000000
GA 10.6676826044 36419 72.0000000000 34.0000000000
HI 5.9527530485 1226 30.0000000000 18.0000000000
IA 8.2608614473 20316 75.0000000000 30.0000000000
ID 7.1562515914 1383 52.0000000000 25.0000000000
IL 8.3818185429 4321 55.0000000000 30.0000000000
IN 8.6939605110 18029 65.0000000000 30.0000000000
KS 10.9361783060 1505 141.000000000
0
36.0000000000
KY 10.2643821032 1291 65.0000000000 34.0000000000
LA 9.8715676782 1540 91.0000000000 25.0000000000

Electric Cars’ Range Requirements and Usage Patterns © www.solarjourneyusa.com
v1.2
MA 10.1471788316 2051 94.0000000000 34.0000000000
MD 11.7393552688 1698 100.000000000
0
37.0000000000
ME 10.4736916959 1465 100.000000000
0
38.0000000000
MI 8.3403790998 3572 60.0000000000 27.0000000000
MN 8.5227669188 1728 90.0000000000 28.0000000000
MO 10.8324348468 2156 75.0000000000 30.0000000000
MS 11.3549073953 1215 98.0000000000 43.0000000000
MT 9.2435898582 1388 91.0000000000 25.0000000000
NC 10.2209415717 56047 80.0000000000 30.0000000000
ND 8.3260371285 1434 106.000000000
0
35.0000000000
NE 8.9174344788 7297 70.0000000000 32.0000000000
NH 10.9550810593 1356 70.0000000000 37.0000000000
NJ 10.5429493638 2983 102.000000000
0
38.0000000000
NM 8.0353398878 1227 70.0000000000 25.0000000000
NV 8.4184852611 1298 115.000000000
0
23.0000000000
NY 8.5250174840 76875 67.0000000000 30.0000000000
OH 9.3978280193 3819 70.0000000000 30.0000000000
OK 10.2335734011 1294 146.000000000
0
31.0000000000
OR 7.6030322881 1396 65.0000000000 23.0000000000
PA 9.4271316291 4081 80.0000000000 30.0000000000
RI 8.6723347838 1286 62.0000000000 30.0000000000
SC 9.8119415427 26696 70.0000000000 30.0000000000
SD 9.4346690909 9796 87.0000000000 34.0000000000
TN 10.3222398690 12419 76.0000000000 31.0000000000
TX 9.7391467929 113506 75.0000000000 30.0000000000
UT 7.6610730387 1507 50.0000000000 26.0000000000
VA 9.9987824427 76870 71.0000000000 31.0000000000
VT 9.6545908222 8408 69.0000000000 33.0000000000
WA 8.5724345401 2053 59.0000000000 28.0000000000
WI 9.7717472377 8865 95.0000000000 34.0000000000

Electric Cars’ Range Requirements and Usage Patterns © www.solarjourneyusa.com
v1.2
WV 11.2008267784 1075 75.0000000000 42.0000000000
WY 8.5952480287 1453 110.000000000
0
38.0000000000
Single trip purpose and distance characteristics:
Trip Miles
Mean Unweighted Count Percentile 95 Percentile 99
WHYTRP1S Home 9.3 258097 30.0 66.0
Work 12.1 95554 36.0 70.0
School/Daycare/Religious 7.0 28364 24.0 50.0
Medical/Dental Services 10.7 16503 34.0 90.0
Shopping/Errands 6.1 163502 20.0 51.0
Social/Recreational 15.4 67215 50.0 200.0
Family personal business 11.0 24883 35.0 112.0
Transport Someone 7.8 40833 26.0 64.0
Meals 7.0 51152 22.0 65.0
Other 15.3 2358 47.0 200.0

Electric Cars’ Range Requirements and Usage Patterns © www.solarjourneyusa.com
v1.2
Appendix B: Daily Distances
Unweighted frequency of trips with one member of the household on board (= driver) and the
number of household members on board of all these trips.
Indicator of each last matching case as Primary
Frequency Percent Valid Percent Cumulative Percent
Valid Passenger members 201311 20.2 20.2 20.2
One member 796861 79.8 79.8 100.0
Total 998172 100.0 100.0
Unweighted means, counts and standard deviations of urban and rural vehicles for daily distance
graphs:
Report
Daily Miles Driven
URBRUR Mean N Std. Deviation
-9 22.00 156825 .00000
Urban 36.48 41493288622 60.86
Rural 48.58 14096513066 62.29
Total 39.55 55589958513 61.45
Weighted Daily Distance distribution by State: What percentage of days do cars drive below x
miles?
Range Category (x miles)
40 100 150 >150
Row N % Row N % Row N % Row N %
HHSTATE AK 81.7% 12.9% 2.7% 2.7%
AL 56.1% 32.2% 7.2% 4.5%
AR 64.0% 25.5% 7.1% 3.5%
AZ 70.4% 22.8% 3.7% 3.1%
CA 70.4% 23.2% 3.9% 2.5%
CO 74.4% 21.5% 1.6% 2.5%
CT 63.1% 26.2% 6.4% 4.3%
DC 76.5% 21.4% 2.0% .1%
DE 65.5% 23.7% 6.7% 4.1%
FL 69.6% 24.8% 3.4% 2.3%
GA 62.6% 29.8% 4.7% 2.9%
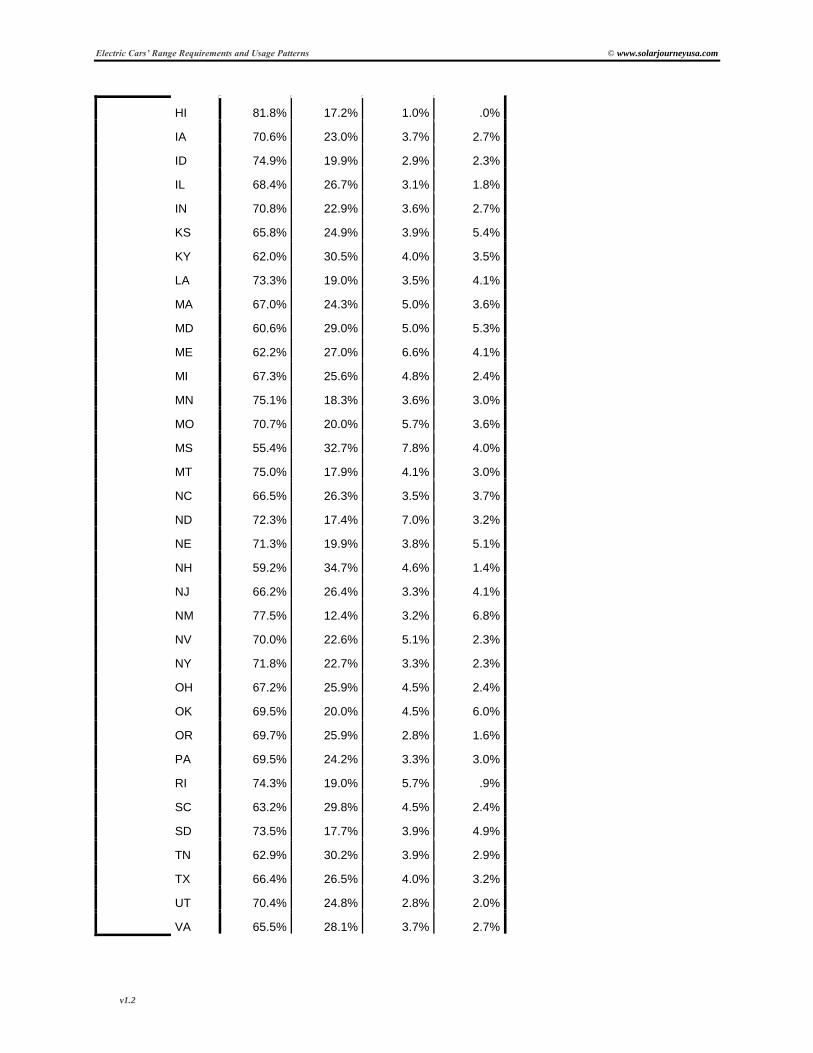
Electric Cars’ Range Requirements and Usage Patterns © www.solarjourneyusa.com
v1.2
HI 81.8% 17.2% 1.0% .0%
IA 70.6% 23.0% 3.7% 2.7%
ID 74.9% 19.9% 2.9% 2.3%
IL 68.4% 26.7% 3.1% 1.8%
IN 70.8% 22.9% 3.6% 2.7%
KS 65.8% 24.9% 3.9% 5.4%
KY 62.0% 30.5% 4.0% 3.5%
LA 73.3% 19.0% 3.5% 4.1%
MA 67.0% 24.3% 5.0% 3.6%
MD 60.6% 29.0% 5.0% 5.3%
ME 62.2% 27.0% 6.6% 4.1%
MI 67.3% 25.6% 4.8% 2.4%
MN 75.1% 18.3% 3.6% 3.0%
MO 70.7% 20.0% 5.7% 3.6%
MS 55.4% 32.7% 7.8% 4.0%
MT 75.0% 17.9% 4.1% 3.0%
NC 66.5% 26.3% 3.5% 3.7%
ND 72.3% 17.4% 7.0% 3.2%
NE 71.3% 19.9% 3.8% 5.1%
NH 59.2% 34.7% 4.6% 1.4%
NJ 66.2% 26.4% 3.3% 4.1%
NM 77.5% 12.4% 3.2% 6.8%
NV 70.0% 22.6% 5.1% 2.3%
NY 71.8% 22.7% 3.3% 2.3%
OH 67.2% 25.9% 4.5% 2.4%
OK 69.5% 20.0% 4.5% 6.0%
OR 69.7% 25.9% 2.8% 1.6%
PA 69.5% 24.2% 3.3% 3.0%
RI 74.3% 19.0% 5.7% .9%
SC 63.2% 29.8% 4.5% 2.4%
SD 73.5% 17.7% 3.9% 4.9%
TN 62.9% 30.2% 3.9% 2.9%
TX 66.4% 26.5% 4.0% 3.2%
UT 70.4% 24.8% 2.8% 2.0%
VA 65.5% 28.1% 3.7% 2.7%

Electric Cars’ Range Requirements and Usage Patterns © www.solarjourneyusa.com
v1.2
VT 65.3% 27.4% 4.7% 2.6%
WA 71.3% 23.7% 3.5% 1.5%
WI 70.0% 22.6% 3.3% 4.1%
WV 64.7% 28.0% 3.1% 4.2%
WY 76.7% 13.8% 3.7% 5.8%
Weighted distribution of daily driven distances over all categories (all vehicles)
RANGECAT
Frequency Percent Valid Percent
Cumulative
Percent
Valid 40 37885667746 68.2 68.2 68.2
100 13827890763 24.9 24.9 93.0
150 2216368746 4.0 4.0 97.0
>150 1660031259 3.0 3.0 100.0
Total 55589958513 100.0 100.0
Daily Miles Driven
Mean Percentile 95 Percentile 99 Count
HHSTATE AK 28.82 102.00 235.22 123992050
AL 48.13 134.00 285.00 918564707
AR 40.82 123.00 181.00 476167337
AZ 41.13 112.00 250.00 1205115585
CA 36.22 109.00 217.00 6291615996
CO 34.99 96.00 250.00 1053474405
CT 44.09 148.56 246.00 703968086
DC 24.27 65.67 146.00 55315499
DE 42.56 139.06 214.00 172775602
FL 36.77 104.56 213.00 3419087581
GA 43.67 118.00 309.00 1775825743
HI 24.53 56.00 107.00 238294312
IA 35.06 119.22 233.00 601593530
ID 32.10 100.56 183.22 279249839
IL 35.89 98.00 186.00 2324711562
IN 36.02 112.00 201.00 1248972869
KS 48.40 150.00 647.50 563475259

Electric Cars’ Range Requirements and Usage Patterns © www.solarjourneyusa.com
v1.2
KY 40.69 131.00 235.00 867527977
LA 43.99 124.00 267.00 826184984
MA 39.44 121.00 214.00 1205148321
MD 47.10 150.00 236.00 1013595214
ME 46.97 138.00 330.00 265779633
MI 39.27 120.00 205.00 1933126088
MN 35.03 120.00 289.00 1007053406
MO 48.91 122.11 575.00 1208244233
MS 48.89 120.00 280.00 511076390
MT 39.71 130.00 669.11 212660717
NC 42.67 120.00 292.00 1761786667
ND 35.94 112.33 217.00 123169964
NE 38.86 164.00 245.11 358448247
NH 43.66 104.00 253.00 274129695
NJ 44.92 120.00 620.00 1631553530
NM 39.26 197.00 273.00 342232681
NV 36.69 126.56 236.00 426605130
NY 34.76 105.00 220.00 2629552689
OH 39.57 119.00 278.00 2222528759
OK 46.88 190.00 472.00 640813392
OR 36.91 93.00 193.44 687265765
PA 38.67 105.00 282.00 2340685496
RI 33.87 115.00 141.33 199929115
SC 41.28 114.00 248.00 863018418
SD 38.97 129.44 372.00 158612032
TN 43.44 119.00 315.00 1205697472
TX 41.00 118.00 264.00 4355822096
UT 35.90 99.56 160.22 464458402
VA 40.08 114.00 233.00 1505269940
VT 39.40 120.00 238.67 124398620
WA 34.44 96.00 192.61 1213066655
WI 39.55 132.00 276.00 1105960831
WV 43.89 117.89 261.00 342095678
WY 37.66 152.89 334.00 110260313

Electric Cars’ Range Requirements and Usage Patterns © www.solarjourneyusa.com
v1.2
Daily Miles Driven
Mean Percentile 95 Percentile 99 Count
HHSTATE AK 29.72 87.00 180.00 306
AL 39.68 116.00 240.00 521
AR 37.84 123.00 175.89 321
AZ 34.34 91.00 232.22 8495
CA 36.07 108.00 220.00 25264
CO 38.16 111.00 284.00 402
CT 42.99 141.56 246.00 339
DC 21.89 65.67 146.00 177
DE 39.16 118.00 214.00 302
FL 35.86 104.00 230.00 17956
GA 42.65 126.00 298.11 8858
HI 24.34 62.22 127.00 299
IA 34.15 116.00 270.00 4733
ID 33.15 112.00 186.56 314
IL 35.83 111.00 239.00 996
IN 35.95 108.56 211.00 4351
KS 42.68 137.11 288.00 334
KY 42.43 135.00 307.00 317
LA 45.88 126.11 267.00 352
MA 36.45 118.00 216.00 505
MD 44.10 132.00 244.00 430
ME 44.33 138.00 267.00 342
MI 38.94 127.00 226.00 802
MN 36.56 121.00 289.00 411
MO 42.20 122.00 370.44 498
MS 44.47 124.00 315.00 286
MT 37.79 131.00 300.00 319
NC 38.95 114.00 261.00 13401
ND 37.52 147.33 255.00 331
NE 33.55 96.00 300.00 1708
NH 44.54 121.00 318.00 331
NJ 39.01 110.00 237.00 712
NM 34.53 153.22 273.00 281

Electric Cars’ Range Requirements and Usage Patterns © www.solarjourneyusa.com
v1.2
NV 35.43 126.56 210.00 317
NY 37.62 116.00 235.22 18339
OH 37.96 106.67 236.00 888
OK 44.21 165.00 320.00 291
OR 34.10 103.56 193.44 313
PA 36.47 102.00 288.56 1000
RI 36.08 115.00 180.00 307
SC 38.69 110.00 278.00 6363
SD 32.45 104.00 266.00 2277
TN 42.41 123.00 300.00 3027
TX 41.18 123.00 290.00 26711
UT 37.09 108.00 351.00 334
VA 39.26 120.00 255.00 18985
VT 40.50 122.00 259.00 2072
WA 35.87 107.67 224.00 488
WI 40.12 140.00 293.00 2161
WV 45.78 165.00 290.00 286
WY 40.29 165.00 400.00 331

Electric Cars’ Range Requirements and Usage Patterns © www.solarjourneyusa.com
v1.2
Appendix C: Car Commuting Distances
Note: Only commuting distances are included where people drive with their car to work.
Statistic metrics describing weighted car commute distribution (unweighted count= 106,681):
Statistics
DISTTOWK
N Valid 113437855
Missing 0
Mean 13.57
Median 10.00
Mode 5.00
Percentiles 95 38.00
99 63.00
Frequency table of car commuting distance:
DISTTOWK
Frequency Percent Valid Percent
Cumulative
Percent
Valid .1111 221736 .2 .2 .2
.2222 609795 .5 .5 .7
.3333 229964 .2 .2 .9
.4444 312079 .3 .3 1.2
.5555 1291823 1.1 1.1 2.3
.6666 134470 .1 .1 2.5
.7777 376337 .3 .3 2.8
.8888 55425 .0 .0 2.8
.9999 43206 .0 .0 2.9
1.0000 4516964 4.0 4.0 6.9
1.1110 66589 .1 .1 6.9
1.2221 6646 .0 .0 6.9
1.3332 100080 .1 .1 7.0
1.4443 10444 .0 .0 7.0
1.5554 106663 .1 .1 7.1
1.6665 318636 .3 .3 7.4
1.7776 7141 .0 .0 7.4

Electric Cars’ Range Requirements and Usage Patterns © www.solarjourneyusa.com
v1.2
1.8887 32179 .0 .0 7.4
1.9998 5078 .0 .0 7.4
2.0000 6579308 5.8 5.8 13.2
2.1109 2259 .0 .0 13.2
2.2220 18155 .0 .0 13.3
2.3331 139 .0 .0 13.3
2.4442 1825 .0 .0 13.3
2.5553 4762 .0 .0 13.3
2.6664 5355 .0 .0 13.3
2.7775 83413 .1 .1 13.3
2.8886 507 .0 .0 13.3
2.9997 4673 .0 .0 13.4
3.0000 7347634 6.5 6.5 19.8
3.1108 411 .0 .0 19.8
3.2219 207 .0 .0 19.8
3.3330 4227 .0 .0 19.8
3.4441 783 .0 .0 19.8
3.5552 890 .0 .0 19.8
3.6663 3866 .0 .0 19.8
3.7774 434 .0 .0 19.8
3.8885 33849 .0 .0 19.9
3.9996 104 .0 .0 19.9
4.0000 6409961 5.7 5.7 25.5
4.3329 49 .0 .0 25.5
4.4440 12181 .0 .0 25.5
4.5551 83 .0 .0 25.5
4.6662 1448 .0 .0 25.5
4.7773 206 .0 .0 25.5
4.9995 19080 .0 .0 25.5
5.0000 7590960 6.7 6.7 32.2
5.2217 591 .0 .0 32.2
5.3328 872 .0 .0 32.2
5.4439 83 .0 .0 32.2
5.5550 1205 .0 .0 32.2
5.6661 904 .0 .0 32.2
5.7772 4558 .0 .0 32.2

Electric Cars’ Range Requirements and Usage Patterns © www.solarjourneyusa.com
v1.2
5.8883 294 .0 .0 32.2
6.0000 5514128 4.9 4.9 37.1
6.1105 4386 .0 .0 37.1
6.5549 247 .0 .0 37.1
6.6660 476 .0 .0 37.1
6.7771 617 .0 .0 37.1
7.0000 5747043 5.1 5.1 42.2
7.1104 285 .0 .0 42.2
7.2215 3150 .0 .0 42.2
7.3326 237 .0 .0 42.2
7.4437 696 .0 .0 42.2
7.7770 1511 .0 .0 42.2
7.8881 15 .0 .0 42.2
7.9992 918 .0 .0 42.2
8.0000 5192864 4.6 4.6 46.8
8.1103 180 .0 .0 46.8
8.3325 12414 .0 .0 46.8
8.5547 369 .0 .0 46.8
8.9991 365 .0 .0 46.8
9.0000 3047007 2.7 2.7 49.5
9.1102 1002 .0 .0 49.5
9.4435 457 .0 .0 49.5
9.6657 2212 .0 .0 49.5
9.7768 122 .0 .0 49.5
10.0000 6354909 5.6 5.6 55.1
10.5545 1201 .0 .0 55.1
10.6656 89 .0 .0 55.1
11.0000 2405656 2.1 2.1 57.2
11.2211 184 .0 .0 57.2
11.4433 476 .0 .0 57.2
11.6655 1114 .0 .0 57.2
12.0000 4806222 4.2 4.2 61.4
12.4432 819 .0 .0 61.4
12.5543 93 .0 .0 61.4
12.7765 145 .0 .0 61.4
13.0000 2753020 2.4 2.4 63.9

Electric Cars’ Range Requirements and Usage Patterns © www.solarjourneyusa.com
v1.2
13.5542 49 .0 .0 63.9
13.7764 11850 .0 .0 63.9
13.8875 171 .0 .0 63.9
13.9986 1793 .0 .0 63.9
14.0000 2118578 1.9 1.9 65.7
14.9985 38 .0 .0 65.7
15.0000 5537242 4.9 4.9 70.6
16.0000 1772522 1.6 1.6 72.2
16.1095 631 .0 .0 72.2
16.6650 508 .0 .0 72.2
17.0000 2186710 1.9 1.9 74.1
17.6649 83 .0 .0 74.1
18.0000 2286792 2.0 2.0 76.1
18.5537 1577 .0 .0 76.1
19.0000 873066 .8 .8 76.9
20.0000 3692910 3.3 3.3 80.1
21.0000 1162725 1.0 1.0 81.2
22.0000 1717337 1.5 1.5 82.7
22.9977 87 .0 .0 82.7
23.0000 1098755 1.0 1.0 83.7
24.0000 869532 .8 .8 84.4
25.0000 2762210 2.4 2.4 86.9
26.0000 971183 .9 .9 87.7
27.0000 843056 .7 .7 88.5
27.7750 558 .0 .0 88.5
28.0000 746047 .7 .7 89.1
29.0000 385117 .3 .3 89.5
30.0000 2234496 2.0 2.0 91.4
31.0000 269144 .2 .2 91.7
32.0000 794393 .7 .7 92.4
33.0000 442378 .4 .4 92.8
34.0000 284295 .3 .3 93.0
34.4410 1368 .0 .0 93.0
35.0000 1306376 1.2 1.2 94.2
36.0000 275936 .2 .2 94.4
37.0000 335228 .3 .3 94.7

Electric Cars’ Range Requirements and Usage Patterns © www.solarjourneyusa.com
v1.2
38.0000 351875 .3 .3 95.0
39.0000 138204 .1 .1 95.1
40.0000 840433 .7 .7 95.9
41.0000 174095 .2 .2 96.0
42.0000 302707 .3 .3 96.3
43.0000 127113 .1 .1 96.4
44.0000 88508 .1 .1 96.5
45.0000 564883 .5 .5 97.0
46.0000 71086 .1 .1 97.0
47.0000 126831 .1 .1 97.2
48.0000 95879 .1 .1 97.2
49.0000 50675 .0 .0 97.3
50.0000 842264 .7 .7 98.0
51.0000 43756 .0 .0 98.1
52.0000 72267 .1 .1 98.1
53.0000 73699 .1 .1 98.2
54.0000 65407 .1 .1 98.2
55.0000 161867 .1 .1 98.4
56.0000 100078 .1 .1 98.5
57.0000 42510 .0 .0 98.5
58.0000 44624 .0 .0 98.6
59.0000 19602 .0 .0 98.6
60.0000 357193 .3 .3 98.9
61.0000 35732 .0 .0 98.9
62.0000 75862 .1 .1 99.0
63.0000 79244 .1 .1 99.1
64.0000 12930 .0 .0 99.1
65.0000 122946 .1 .1 99.2
66.0000 12994 .0 .0 99.2
67.0000 30699 .0 .0 99.2
68.0000 22343 .0 .0 99.2
69.0000 9142 .0 .0 99.2
70.0000 117250 .1 .1 99.3
71.0000 10760 .0 .0 99.4
72.0000 22180 .0 .0 99.4
73.0000 20382 .0 .0 99.4
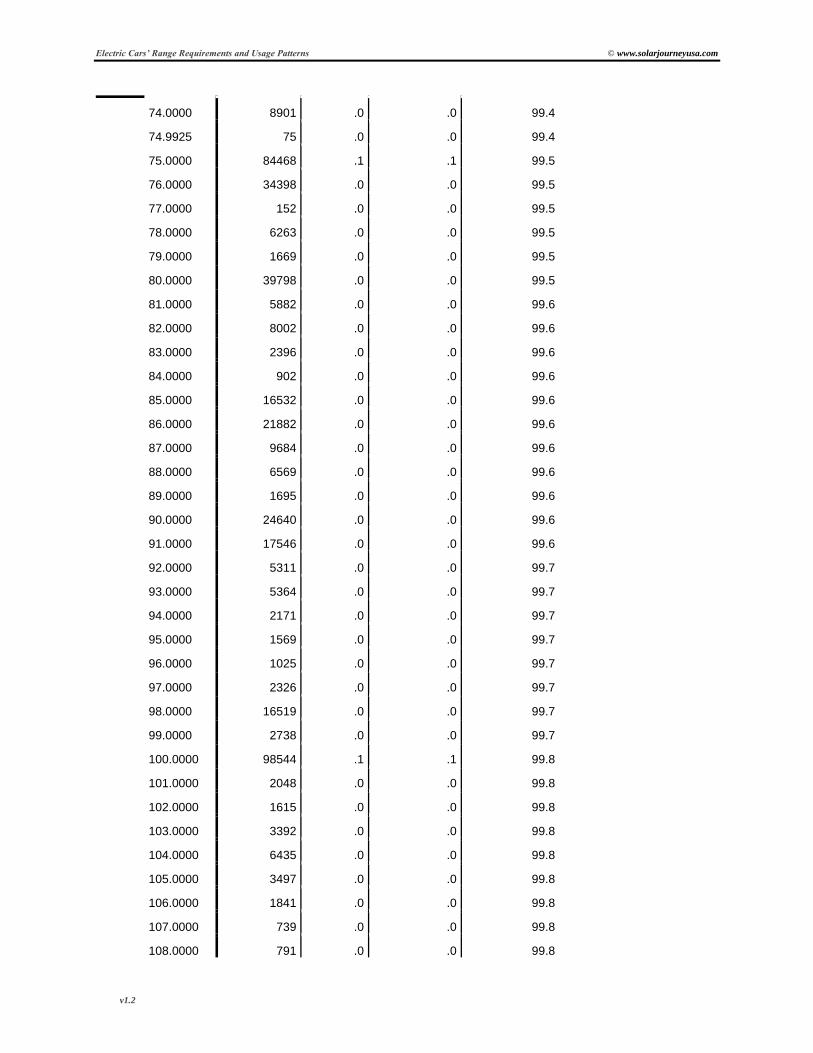
Electric Cars’ Range Requirements and Usage Patterns © www.solarjourneyusa.com
v1.2
74.0000 8901 .0 .0 99.4
74.9925 75 .0 .0 99.4
75.0000 84468 .1 .1 99.5
76.0000 34398 .0 .0 99.5
77.0000 152 .0 .0 99.5
78.0000 6263 .0 .0 99.5
79.0000 1669 .0 .0 99.5
80.0000 39798 .0 .0 99.5
81.0000 5882 .0 .0 99.6
82.0000 8002 .0 .0 99.6
83.0000 2396 .0 .0 99.6
84.0000 902 .0 .0 99.6
85.0000 16532 .0 .0 99.6
86.0000 21882 .0 .0 99.6
87.0000 9684 .0 .0 99.6
88.0000 6569 .0 .0 99.6
89.0000 1695 .0 .0 99.6
90.0000 24640 .0 .0 99.6
91.0000 17546 .0 .0 99.6
92.0000 5311 .0 .0 99.7
93.0000 5364 .0 .0 99.7
94.0000 2171 .0 .0 99.7
95.0000 1569 .0 .0 99.7
96.0000 1025 .0 .0 99.7
97.0000 2326 .0 .0 99.7
98.0000 16519 .0 .0 99.7
99.0000 2738 .0 .0 99.7
100.0000 98544 .1 .1 99.8
101.0000 2048 .0 .0 99.8
102.0000 1615 .0 .0 99.8
103.0000 3392 .0 .0 99.8
104.0000 6435 .0 .0 99.8
105.0000 3497 .0 .0 99.8
106.0000 1841 .0 .0 99.8
107.0000 739 .0 .0 99.8
108.0000 791 .0 .0 99.8

Electric Cars’ Range Requirements and Usage Patterns © www.solarjourneyusa.com
v1.2
109.0000 115 .0 .0 99.8
110.0000 10047 .0 .0 99.8
111.0000 4573 .0 .0 99.8
112.0000 445 .0 .0 99.8
113.0000 440 .0 .0 99.8
114.0000 2591 .0 .0 99.8
115.0000 3115 .0 .0 99.8
116.0000 246 .0 .0 99.8
117.0000 11145 .0 .0 99.8
118.0000 868 .0 .0 99.8
119.0000 430 .0 .0 99.8
120.0000 22521 .0 .0 99.8
121.0000 4430 .0 .0 99.8
122.0000 1788 .0 .0 99.8
124.0000 379 .0 .0 99.8
125.0000 11690 .0 .0 99.9
>125 Rest .1 .1 100.0
Total 113437855 100.0 100.0
Weighted Mean, 95th percentile and 99
th percentile of distance to commute to work by State:
DISTTOWK (miles)
Mean Percentile 95 Percentile 99
Unweighted
Count
HHSTATE AK 7.4824 24.0000 45.0000 228
AL 19.5608 50.0000 91.0000 294
AR 15.1937 36.0000 104.0000 181
AZ 12.6065 30.0000 65.0000 4854
CA 13.6707 40.0000 70.0000 14796
CO 12.9874 35.0000 60.0000 237
CT 13.2196 35.0000 87.0000 217
DC 9.6452 35.0000 40.0000 95
DE 12.5252 35.0000 75.0000 172
FL 12.9138 35.0000 60.0000 9267

Electric Cars’ Range Requirements and Usage Patterns © www.solarjourneyusa.com
v1.2
GA 16.2197 45.0000 70.0000 5103
HI 8.6320 27.0000 36.0000 180
IA 12.1108 38.0000 60.0000 3261
ID 9.6558 29.0000 45.0000 165
IL 12.8642 35.0000 50.0000 597
IN 12.5838 39.0000 61.0000 2784
KS 13.1190 35.0000 90.0000 209
KY 15.2169 50.0000 150.0000 185
LA 11.7221 41.0000 60.0000 212
MA 14.5051 46.0000 60.0000 313
MD 15.7638 42.0000 50.0000 292
ME 12.6941 40.0000 61.0000 205
MI 14.7553 50.0000 60.0000 463
MN 14.1781 36.0000 63.0000 273
MO 13.7313 35.0000 60.0000 288
MS 22.0347 65.0000 100.0000 150
MT 10.0599 34.0000 60.0000 199
NC 14.0728 36.0000 70.0000 7669
ND 7.3877 30.0000 47.0000 237
NE 12.2022 30.0000 42.0000 1203
NH 14.9794 37.0000 62.0000 223
NJ 15.1583 42.0000 75.0000 436
NM 10.5457 37.0000 40.0000 134
NV 9.9717 25.0000 60.0000 193
NY 12.9754 36.0000 62.0000 11393
OH 12.9374 33.0000 56.0000 538
OK 12.4100 35.0000 63.0000 189
OR 10.0530 25.0000 50.0000 189
PA 12.1452 32.0000 59.0000 632
RI 14.0635 45.0000 60.0000 182
SC 13.9825 36.0000 65.0000 3476
SD 8.8979 30.0000 56.0000 1676
TN 14.0456 37.0000 51.0000 1814
TX 13.9517 37.0000 65.0000 15884
UT 12.4468 47.0000 50.0000 205

Electric Cars’ Range Requirements and Usage Patterns © www.solarjourneyusa.com
v1.2
VA 15.0975 40.0000 65.0000 11683
VT 14.5857 40.0000 90.0000 1381
WA 10.6950 30.0000 54.0000 297
WI 12.4670 35.0000 60.0000 1469
WV 17.1131 47.0000 60.0000 149
WY 9.8139 40.0000 100.0000 209
Overview of weighted range categories for commuting: What percentage of people drives to
work over a distance shorter than x miles? (note the „unweighted count‟ column in the table
above for sample representativeness):
Range Category (miles)
40 100 150 >150
Row N % Row N % Row N % Row N %
HHSTATE AK 98.0% 2.0% .0% .0%
AL 88.9% 10.8% .3% .0%
AR 95.1% 3.9% 1.0% .0%
AZ 97.7% 2.1% .1% .0%
CA 94.3% 5.3% .3% .1%
CO 95.5% 4.5% .0% .0%
CT 96.2% 3.1% .7% .0%
DC 95.2% 4.8% .0% .0%
DE 97.2% 2.8% .1% .0%
FL 96.0% 3.9% .1% .0%
GA 93.0% 6.3% .5% .2%
HI 100.0% .0% .0% .0%
IA 95.9% 3.8% .3% .0%
ID 98.3% 1.7% .0% .0%
IL 95.9% 4.0% .0% .1%
IN 95.2% 4.7% .1% .0%
KS 97.0% 2.3% .7% .0%
KY 92.1% 6.5% .0% 1.4%
LA 94.4% 5.4% .0% .1%
MA 94.2% 5.6% .1% .0%
MD 94.4% 5.6% .0% .0%
ME 94.2% 5.8% .0% .0%

Electric Cars’ Range Requirements and Usage Patterns © www.solarjourneyusa.com
v1.2
MI 92.8% 7.0% .2% .0%
MN 95.5% 4.1% .0% .4%
MO 95.8% 4.2% .0% .0%
MS 82.9% 15.3% 1.3% .5%
MT 96.0% 4.0% .0% .0%
NC 95.9% 3.8% .2% .1%
ND 97.9% 2.1% .0% .0%
NE 97.8% 1.5% .0% .6%
NH 95.3% 4.7% .0% .0%
NJ 93.3% 5.8% .8% .1%
NM 96.5% 3.5% .0% .0%
NV 98.3% 1.7% .0% .0%
NY 95.6% 4.1% .1% .1%
OH 96.8% 3.2% .0% .0%
OK 95.7% 3.6% .7% .0%
OR 98.7% 1.1% .0% .2%
PA 96.5% 3.0% .6% .0%
RI 94.2% 5.3% .0% .5%
SC 95.9% 3.8% .2% .2%
SD 96.9% 2.9% .0% .2%
TN 95.5% 4.4% .0% .1%
TX 95.5% 4.1% .2% .2%
UT 95.0% 5.0% .0% .0%
VA 94.1% 5.6% .1% .2%
VT 94.4% 5.1% .0% .5%
WA 97.6% 2.4% .0% .0%
WI 96.6% 3.0% .3% .0%
WV 87.0% 12.7% .0% .4%
WY 94.8% 4.2% 1.1% .0%