assessment of demand response & advanced metering: staff report
TRANSCRIPT

2012
Assessment of Demand Response and Advanced Metering
Staff Report
Federal Energy Regulatory Commission
December 2012
The opinions and views expressed in this staff report do not necessarily represent those of the
Federal Energy Regulatory Commission, its Chairman, or individual Commissioners, and are
not binding on the Commission.
ACKNOWLEDGEMENTS
Federal Energy Regulatory Commission Staff Team
David Kathan, Team Lead
Robin Aldina
Michael P. Lee
Lisa Medearis
Pamela Sporborg
Michael Tita
Dean Wight
Andy Wilkerson
Z, INC. Team
French Kreger (Z, INC.)
Valerie Richardson (DNV-KEMA)
Will Gifford (DNV-KEMA)
Christopher Elsner (Z, INC.)

2012 Assessment of Demand Response and Advanced Metering Federal Energy Regulatory Commission i
TABLE OF CONTENTS
Executive Summary .................................................................................................................. 1 Chapter 1. Introduction ............................................................................................................ 3
Preparation of This Year’s Report ........................................................................................ 3 Demand Response and Advanced Metering Survey ............................................................. 4 Report Organization .............................................................................................................. 4 Regions in This Report ......................................................................................................... 5
Chapter 2. Advanced Metering Infrastructure ......................................................................... 7
Definition of Advanced Metering ......................................................................................... 7 Advanced Metering Penetration ........................................................................................... 8
Analytical Approach ..........................................................................................................8 Survey Findings .................................................................................................................8
Customer Accessibility of Advanced Metering Data ......................................................... 13 Developments and Issues in Advanced Metering ............................................................... 14
Status of the Advanced Metering Deployments Funded by the American Recovery
and Reinvestment Act .................................................................................................15
Green Button Initiative ....................................................................................................15 Expanded Customer Service Offerings ............................................................................15 Use of Advanced Metering Data for Non-Billing Applications ......................................16
Opt-Out Programs ............................................................................................................17 Chapter 3. Demand Response ................................................................................................ 21
Definition of Demand Response ......................................................................................... 21 Survey Results .................................................................................................................... 22
Analytical Approach ........................................................................................................22
Summary of Report Findings ...........................................................................................22
Demand Response Activities at the FERC ......................................................................... 36 Commission Demand Response Activities ......................................................................36
Other Demand Response Developments and Issues ........................................................... 42
National Forum on the National Action Plan on Demand Response ...............................42 U.S. Department of Energy-Sponsored Consumer Behavior Studies ..............................42
NERC Demand Response Data Collection ......................................................................43 Summer 2012 Demand Response Deployments ..............................................................44
Selected State Activities ..................................................................................................45 Barriers to Demand Response ............................................................................................. 49
Chapter 4. Smart Grid Developments Supporting Demand Response .................................. 51 Demand Response-Related Smart Grid Standards Development ....................................... 51
Demand Response Activities within the NIST/SGIP Process .........................................51
Smart Grid Demonstration Program ................................................................................... 54 Appendix A: Section 1252 of the Energy Policy Act of 2005 ................................................ 57
Appendix B: Acronyms and Abbreviations ........................................................................... 61 Appendix C: Glossary ............................................................................................................. 63 Appendix D: 2012 FERC Survey Method .............................................................................. 73
Background ......................................................................................................................... 73 Development of the FERC Survey and Sampling Design .................................................. 73 The Survey Population ........................................................................................................ 75
Federal Energy Regulatory Commission 2012 Assessment of Demand Response and Advanced Metering ii
FERC Survey Methodology ................................................................................................ 75
Working with the Data ........................................................................................................ 76 Advanced Metering ..........................................................................................................76 Demand Response ............................................................................................................77
Eliminating Double-Counting in Wholesale Demand Response ........................................ 78 Appendix E: FERC Survey Respondents ............................................................................... 81 Appendix F: Demand Response Programs and Services at Responding Entities ................... 99 Appendix G: Data for Figures in Report............................................................................... 107
Advanced Metering ........................................................................................................... 107
Demand Response ............................................................................................................. 108 Appendix H: Adjustment Methodology for FERC-731 Survey ........................................... 115
Self-Selection Assessment Subsample ............................................................................. 116 Assessment of Past Designs .............................................................................................. 117
2012 Self-Selection Bias Assessment Design................................................................... 117 Survey Response Rates ..................................................................................................... 118
Self-Selection Bias Assessment ........................................................................................ 118
LIST OF TABLES
Table 2-1. Entities with the five largest 2010 to 2012 increases in reported advanced
meters ................................................................................................................ 9 Table 2-2. Estimated advanced metering penetration by region and customer class ............. 11
Table 2-3. Estimated penetration of advanced metering by state in 2008 – 2012 .................. 12 Table 3-1. Demand response program types in the 2012 FERC Survey ................................ 21 Table 3-2. Reported potential peak reduction in Megawatts by program type and state ........ 28
Table 3-3. Reported plans for new demand response programs and time-based
rates/tariffs ...................................................................................................... 32 Table D-1. Survey Population for the 2012 FERC Survey ..................................................... 75
LIST OF FIGURES
Figure 1-1. NERC regions. ....................................................................................................... 6 Figure 2-1. Estimated advanced metering penetration nationwide reported in FERC
Surveys 2006, 2008, 2010, and 2012 ................................................................ 8 Figure 2-2. Estimated advanced metering penetration nationwide in 2006, 2008, 2010
and 2012 FERC Surveys ................................................................................. 10 Figure 2-3. Estimated advanced metering penetration by type of entity in 2006, 2008
and 2010, and 2012 FERC Surveys ................................................................ 14
Figure 2-4. Reported numbers of customers and communication methods for advanced
metering by customer class ............................................................................. 14
Figure 3-1. Total reported potential peak reduction in the 2006 through 2012 FERC
Surveys ............................................................................................................ 23 Figure 3-2. Reported potential peak reduction by customer class in 2006, 2008, 2010
and 2012 .......................................................................................................... 23 Figure 3-3. Reported potential peak reduction by Independent System Operators and
Regional Transmission Operators in 2010 and 2012 ...................................... 25
2012 Assessment of Demand Response and Advanced Metering Federal Energy Regulatory Commission iii
Figure 3-4. Reported potential peak reduction by region and customer class for the
2010 and 2012 FERC Surveys ........................................................................ 25 Figure 3-5. Reported potential peak reduction by program type and by customer class
in 2012 FERC Survey ..................................................................................... 27
Figure 3-6. Reported actual peak reduction by NERC region between 2010 and 2012
FERC Survey years ......................................................................................... 30 Figure 3-7. 2012 FERC Survey reported potential and actual peak reduction by region ....... 30 Figure 3-8. Estimated potential peak reduction by region and customer class in 2010
and 2012 .......................................................................................................... 31
Figure 3-9. Estimated potential peak reduction by entity type and customer class in
2010 and 2012 ................................................................................................. 32 Figure 3-10. Number of entities reporting interruptible/curtailable rates by region and
type of entity in 2010 and 2012 ...................................................................... 33
Figure 3-11. Reported number of customers enrolled in direct load control programs by
region and type of entity in 2010 and 2012 .................................................... 34
Figure 3-12. Number of entities reporting residential time-of-use rates by region and
type of entity in 2010 and 2012 ...................................................................... 35
Figure 3-13. Reported number of residential customers enrolled in time-of-use rates by
region and entity type in 2010 and 2012 ......................................................... 35 Figure 3-14. Number of entities reporting retail real-time pricing by region and entity
type in 2010 and 2012 ..................................................................................... 36

2012 Assessment of Demand Response and Advanced Metering Federal Energy Regulatory Commission 1
EXECUTIVE SUMMARY
In the past year, significant progress has been achieved for both wholesale and retail
electricity demand response and advanced metering, supported by the actions of state
regulators, federal regulators and federal funding under the American Recovery and
Reinvestment Act, the development of interoperability standards, and efforts of industry and
customers. According to information provided by survey respondents to the Federal Energy
Regulatory Commission (FERC) 2012 Demand Response and Advanced Metering Survey,
the potential demand response resource contribution from all U.S. demand response
programs is estimated to be nearly 72,000 megawatts (MW), or about 9.2 percent of U.S.
peak demand. This is an increase of about 13,000 MW from the 2010 FERC Survey. The
regions with the largest estimated demand response capability are the Midwest-to-Mid-
Atlantic region, the Southeast, and the Upper Midwest. With regard to advanced metering,
penetration reached approximately 22.9 percent in 2011 in the United States, compared to
approximately 8.7 percent in the 2010 FERC Survey (covering calendar year 2009). Florida,
Texas, and the West have advanced meter penetrations exceeding 30 percent. As in previous
surveys, electric cooperatives have the largest penetration, nearly 31 percent, among
categories of organizations.
More than 1,900 entities responded to the voluntary FERC survey and many made
themselves available for follow-up questions. FERC staff greatly appreciates the responses
and assistance in completing the information for this Report.

Federal Energy Regulatory Commission 2012 Assessment of Demand Response and Advanced Metering 2
2012 Assessment of Demand Response and Advanced Metering Federal Energy Regulatory Commission 3
CHAPTER 1. INTRODUCTION
The Energy Policy Act of 2005 (EPAct 2005) requires the FERC to prepare and publish an
annual report on the penetration of advanced metering and demand response programs in the
electric power industry in the United States. This data is to be divided and presented by
region, and the information is to cover all types of electric consumers.
EPAct 2005 expressly requires that the Commission’s annual report identify and review:
(A) saturation and penetration rates of advanced meters and communications
technologies, devices, and systems;
(B) existing demand response programs and time-based rate programs;
(C) the annual resource contribution of demand resources;
(D) the potential for demand response as a quantifiable, reliable resource for regional
planning purposes;
(E) steps taken to ensure that, in regional transmission planning and operations,
demand resources are provided equitable treatment as a quantifiable, reliable
resource relative to the resource obligations of any load-serving entity,
transmission provider, or transmitting party; and
(F) regulatory barriers to improved customer participation in demand response, peak
reduction, and critical period pricing programs.
This Report is the fourth annual comprehensive report based on a first-of-its-kind survey of
demand response and advanced metering. The first report was published in August 2006,
Assessment of Demand Response and Advanced Metering.1 Since 2006, Commission staff
has published a series of annual reports assessing demand response and advanced metering in
the U.S. In support of these reports, the FERC staff has conducted comprehensive
nationwide surveys every other year. In intervening years reports consist of updates based on
publicly-available information and discussions with market participants and industry experts.
Commission staff published its most recent annual report in November 2011.2
Preparation of This Year’s Report
In preparing this report, Commission staff undertook several activities, the most significant
being the preparation and release of the Demand Response and Advanced Metering Survey
(2012 FERC Survey). Commission staff also reviewed relevant literature and recent
developments on advanced metering, demand response programs, and time-based rates. As
with past surveys, the 2012 FERC Survey gathers data for the previous calendar year, 2011.
1 FERC, Assessment of Demand Response & Advanced Metering: Staff Report, Docket No. AD06-2, August 7,
2006, available at http://www.ferc.gov/industries/electric/indus-act/demand-response/dem-res-adv-
metering.asp. 2 FERC, Assessment of Demand Response & Advanced Metering: Staff Report, November 2011. The annual
reports are available at http://www.ferc.gov/industries/electric/indus-act/demand-response/dem-res-adv-
metering.asp.

Federal Energy Regulatory Commission 2012 Assessment of Demand Response and Advanced Metering 4
Demand Response and Advanced Metering Survey
The 2012 FERC Survey was conducted in the spring months of 2012 and requested
information from 3,349 entities in all 50 states,3 representing all aspects of the electricity
delivery industry: investor-owned utilities, municipal utilities, rural electric cooperatives,
power marketers, state and federal agencies, and other demand response providers.4 The
survey sought the following: (a) general information about the entity responding to the
survey, including contact information, customer size, and electricity demand and
consumption; (b) the number of advanced meters and their use; (c) existing demand response
and time-based rate programs, including their current level of resource contribution; and (d)
plans for future demand response program offerings. Like the 2010 Survey, the 2012 FERC
Survey combined advanced metering and demand response questions into one survey form.
The FERC staff also made efforts to enhance the clarity of instructions and definitions for the
2012 FERC Survey.
More than 1,978 entities responded to the 2012 FERC Survey, representing a response rate of
over 59 percent. This is an increase from the 2010 FERC Survey response rate of 52 percent.
Information gathered through the 2012 FERC Survey serves as the basis for this report’s
estimates of the market penetration5 of advanced metering, demand response resource
contributions, and current demand response and time-based rate programs. This report also
utilizes results from the 2010, 2008 and 2006 FERC Surveys to assess trends in advanced
metering deployment and demand response in the U.S.
Report Organization
The Introduction (Chapter 1) of this report describes the report’s structure, along with a
brief overview of the 2012 Survey methodology and key findings. The following chapters
provide the information required by EPAct 2005 section 1252(e)(3).
Advanced Metering Infrastructure (Chapter 2) presents survey results on the penetration
of advanced metering nationally, regionally, by type of utility, customer class, and by state.
This chapter also discusses the key new developments, issues, and trends in the deployment
and adoption of advanced metering. The chapter concludes with a description of major
challenges and issues for advanced metering in the U.S.
Demand Response (Chapter 3) presents survey results on demand response programs
(including time-based rate programs), and provides the regional and national distribution of
these programs. The chapter also includes estimates of the overall size of demand response
resources in the U.S. Chapter 3 then reviews demand response trends and developments at
the national and state level, and identifies several key trends in demand response. This
chapter also reviews Commission demand response activities and steps that have been taken
to ensure comparable treatment of demand response in regional transmission planning.
3 Later in the process it was determined that 15 of these entities were either out of business or not in a relevant
business. 4 Appendices D and H include detailed information on the survey and sample design. Appendix E lists the
respondents to the survey. 5 Penetration, for the purposes of this report, refers to the ratio of advanced meters to all installed meters.
2012 Assessment of Demand Response and Advanced Metering Federal Energy Regulatory Commission 5
Finally, Chapter 3 concludes with a summary of potential barriers to demand response, as
identified by various sources.
Smart Grid Standards Development (Chapter 4) is a new section in this report series, and
provides an overview of work underway to develop and implement smart grid
interoperability standards that help support demand response.
This report also includes eight appendices that provide reference material and additional
detail on the survey data and responses. Appendix A provides the statutory language in
section 1252 of EPAct 2005. Appendix B lists the acronyms used in this report. Appendix
C contains a glossary of the key terms used in this report and the 2012 survey. Appendix D
provides additional detail on the 2012 FERC Survey and survey response rates. Appendix E
lists the entities who responded to the 2012 FERC Survey. Appendix F lists the entities that
reported operating demand response programs in the 2012 survey. Appendix G provides
data tables associated with each of the figures in this report. Appendix H describes the
estimation methods used in this report.
Regions in This Report
As in past reports, Staff is presenting the results of the 2012 Survey by NERC region. NERC
(North American Electric Reliability Council) is an international nonprofit organization
certified by the FERC as the electric reliability organization for the U.S. The 2012 FERC
Survey uses NERC’s eight regional divisions to better identify trends and align regulatory
and industry geographical units. The regional entities are:
Florida Reliability Coordinating Council (FRCC)
Midwest Reliability Organization (MRO)
Northeast Power Coordinating Council (NPCC)
ReliabilityFirst Corporation (RFC)
SERC Reliability Corporation (SERC)
Southwest Power Pool (SPP)
Texas Reliability Entity (TRE)
Western Electricity Coordinating Council (WECC)
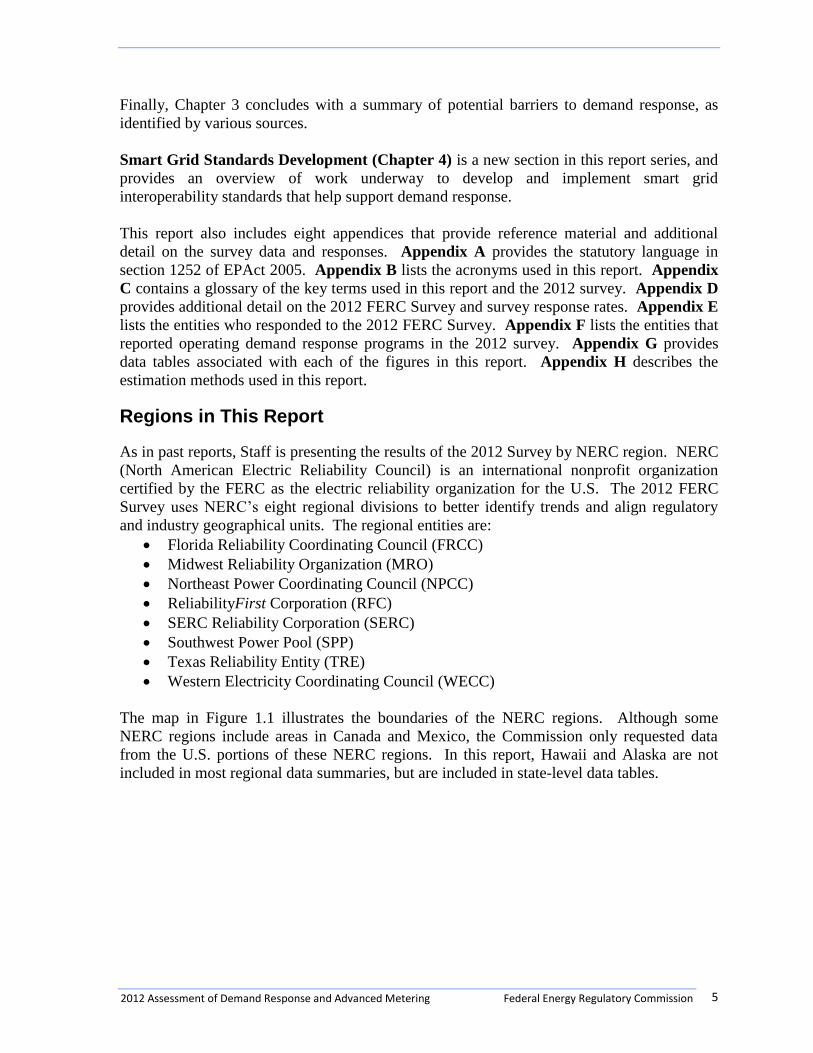
The map in Figure 1.1 illustrates the boundaries of the NERC regions. Although some
NERC regions include areas in Canada and Mexico, the Commission only requested data
from the U.S. portions of these NERC regions. In this report, Hawaii and Alaska are not
included in most regional data summaries, but are included in state-level data tables.

Federal Energy Regulatory Commission 2012 Assessment of Demand Response and Advanced Metering 6
Figure 1-1. NERC regions.
FRCC - Florida Reliability Coordinating Council
MRO - Midwest Reliability Organization
NPCC - Northeast Power Coordinating Council
RFC - ReliabilityFirst Corporation
SERC - SERC Reliability Corporation
SPP - Southwest Power Pool
TRE - Texas Reliability Entity
WECC - Western Electricity Coordinating Council
Source: North American Electric Reliability Corporation, July 2012.
2012 Assessment of Demand Response and Advanced Metering Federal Energy Regulatory Commission 7
CHAPTER 2. ADVANCED METERING INFRASTRUCTURE
This chapter reports on the first topic in EPAct 2005 section 1252(e)(3):
(A) saturation and penetration rates of advanced meters and communications
technologies, devices and systems.
The information presented is divided into the following three sections and is based on the
2012 FERC Survey, with comparisons to previous FERC Surveys (as appropriate) to
demonstrate trends in advanced metering deployment on a regional basis, by type of entity,
and by customer type.6
Definition of Advanced Metering
Advanced Metering Penetration
Developments and Issues in Advanced Metering
All figures and tables are labeled “Estimated…” This indicates that additional information
was used in conjunction with 2012 FERC Survey data to improve the accuracy of Staff’s
estimates. A detailed description of these estimation methods can be found in Appendix H.
Definition of Advanced Metering
For the 2012 FERC Survey, FERC staff used the following definition of advanced meters:
Advanced Meters: Meters that measure and record usage data at hourly intervals or
more frequently, and provide usage data to both consumers and energy companies at
least once daily. Data are used for billing and other purposes. Advanced meters
include basic hourly interval meters, meters with one-way communication, and real-
time meters with built-in two-way communication capable of recording and
transmitting instantaneous data.
Several respondents to the 2012 FERC Survey provided lower advanced meter counts than in
previous FERC Surveys. Respondents that reported large declines were contacted for
explanation. During these calls, staff learned anecdotally that many of the reported declines
were due to respondents reclassifying their responses based on a better understanding of the
survey’s “advanced meter” definition. For example, many respondents had installed meters
with advanced metering capability, but were still in the process of programming the software
and establishing the infrastructure to allow for communication on a daily basis.
Consequently, these installed meters did not meet the advanced meter definition.
6 A full database of survey responses is available at
http://www.ferc.gov/industries/electric/indus-act/demand-response/dem-res-adv-metering.asp.
Federal Energy Regulatory Commission 2012 Assessment of Demand Response and Advanced Metering 8
Advanced Metering Penetration
This section describes the analytical approach used in the 2012 FERC Survey and provides
summary findings.
Analytical Approach
Commission Staff estimates of advanced metering penetration in the U.S. are primarily based
on the 2012 FERC Survey data. However, the 2012 advanced metering data was
supplemented by past FERC Survey data and survey data from the Energy Information
Administration’s Annual Electric Power Industry Report (i.e., Form EIA-861 survey data)7
for this report. In contrast to previous years, the 2012 estimation methods both fill in missing
data and correct for reporting errors. A detailed explanation of these estimation methods can
be found in Appendix H.
Survey Findings
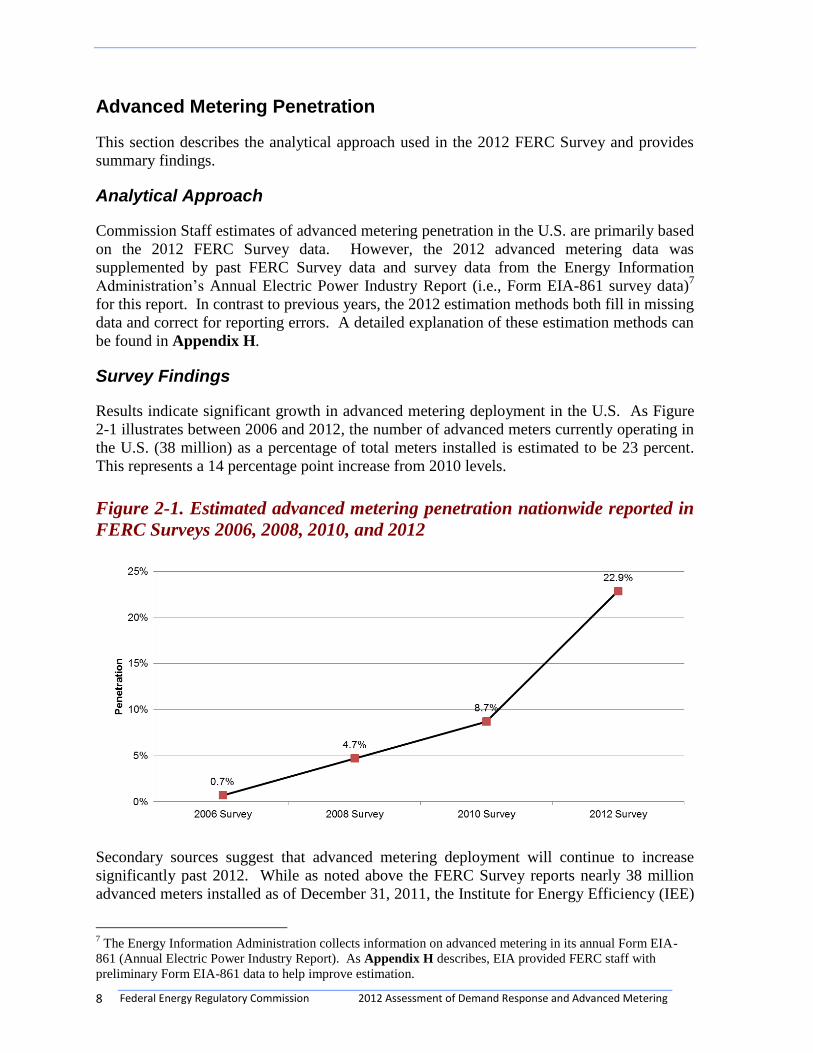
Results indicate significant growth in advanced metering deployment in the U.S. As Figure
2-1 illustrates between 2006 and 2012, the number of advanced meters currently operating in
the U.S. (38 million) as a percentage of total meters installed is estimated to be 23 percent.
This represents a 14 percentage point increase from 2010 levels.
Figure 2-1. Estimated advanced metering penetration nationwide reported in
FERC Surveys 2006, 2008, 2010, and 2012
Secondary sources suggest that advanced metering deployment will continue to increase
significantly past 2012. While as noted above the FERC Survey reports nearly 38 million
advanced meters installed as of December 31, 2011, the Institute for Energy Efficiency (IEE)
7 The Energy Information Administration collects information on advanced metering in its annual Form EIA-
861 (Annual Electric Power Industry Report). As Appendix H describes, EIA provided FERC staff with
preliminary Form EIA-861 data to help improve estimation.

2012 Assessment of Demand Response and Advanced Metering Federal Energy Regulatory Commission 9
projects that a total of 65 million advanced meters will be deployed by 2015.8 In addition,
recipients of U.S. Department of Energy Smart Grid Investment Grants report adding almost
1 million advanced meters over the first and second quarters of 2012.9
The following tables and figures in this chapter provide detailed information on the estimated
38 million advanced meters operating in the U.S. by geographic region, customer class, and
ownership category. Table 2-1 below lists the respondents with the five largest increases in
advanced meters from 2010 to 2012 (ranked by the size of the increase in reported advanced
meters).
Table 2-1. Entities with the five largest 2010 to 2012 increases in reported
advanced meters
The advanced metering deployments shown in Table 2-1 are currently in the middle to late
stages of deployment. The funding for these advanced metering deployments were primarily
subject to state commission-approved cost recovery. For example, the California Public
Utility Commission authorized two of the state’s primary investor-owned utilities, Southern
California Edison and Pacific Gas and Electric, to replace conventional meters with advanced
meters.10
Southern California Edison expects to complete its deployment of approximately 5
million advanced meters by the end of 2012, and reports that this deployment was
approximately 78 percent complete as of January 2012.11
Pacific Gas and Electric reports
installing nearly 4.7 million advanced meters as of November 2011, and expects to complete
its advanced meter rollout by mid-2013.12
8 Institute for Electric Efficiency, Utility-Scale Smart Meter Deployments, Plans, & Proposals, May 2012,
available at http://www.edisonfoundation.net/iee/Documents/IEE_SmartMeterRollouts_0512.pdf. 9 SmartGrid.gov, Advanced Metering Infrastructure and Customer Systems, available at
http://www.smartgrid.gov/recovery_act/deployment_status/ami_and_customer_systems. 10
California Public Utilities Commission, The Benefits of Smart Meters, available at
http://www.cpuc.ca.gov/PUC/energy/Demand+Response/benefits.htm. 11
California Public Utilities Commission, California Division of Ratepayer Advocates, Case Study of Smart
Meter System Deployment: Recommendations for Ensuring Ratepayer Benefits, March 2012, available at
http://www.dra.ca.gov/uploadedFiles/Content/Energy/Management_and_Conservation/Smart_Meters/SmartMet
erSystemDeploymentReportMar2012FinalDraft_wcover_Public.pdf. 12
PG&E, SmartMeter™ Program Data, 12/13/2011, available at
http://www.pge.com/includes/docs/pdfs/myhome/customerservice/meter/smartmeter/SmartMeterProgramData_
12-13-11.pdf.
Entity Name
NERC
Region State
2010
Advanced
Meters
2012
Advanced
Meters
Advanced Meter
Increase
Advanced Metering
Penetration
Southern California Edison WECC CA 147,645 3,740,640 3,592,995 75.2%
Florida Power & Light Company FRCC FL 202,510 2,675,479 2,472,969 58.8%
Pacific Gas and Electric Company WECC CA 2,085,712 4,508,036 2,422,324 88.7%
Oncor Electric Delivery Company TRE TX 662,774 2,664,462 2,001,688 83.5%
Puget Sound Energy, Inc. WECC WA 7,432 1,900,306 1,892,874 99.9%
Federal Energy Regulatory Commission 2012 Assessment of Demand Response and Advanced Metering 10
2006 Survey 0.6% 0.5% 0.7% 3.0% 1.2% 0.4% 0.1% 0.0% 0.0% 0.1%
2008 Survey 3.7% 2.1% 9.0% 5.8% 5.8% 5.1% 10.4% 1.6% 0.0% 0.3%
2010 Survey 15.3% 14.1% 13.4% 8.9% 8.0% 6.7% 5.0% 2.1% 1.2% 0.7%
2012 Survey 14.6% 42.4% 38.6% 15.2% 22.0% 10.4% 32.5% 0.2% 0.0% 5.3%
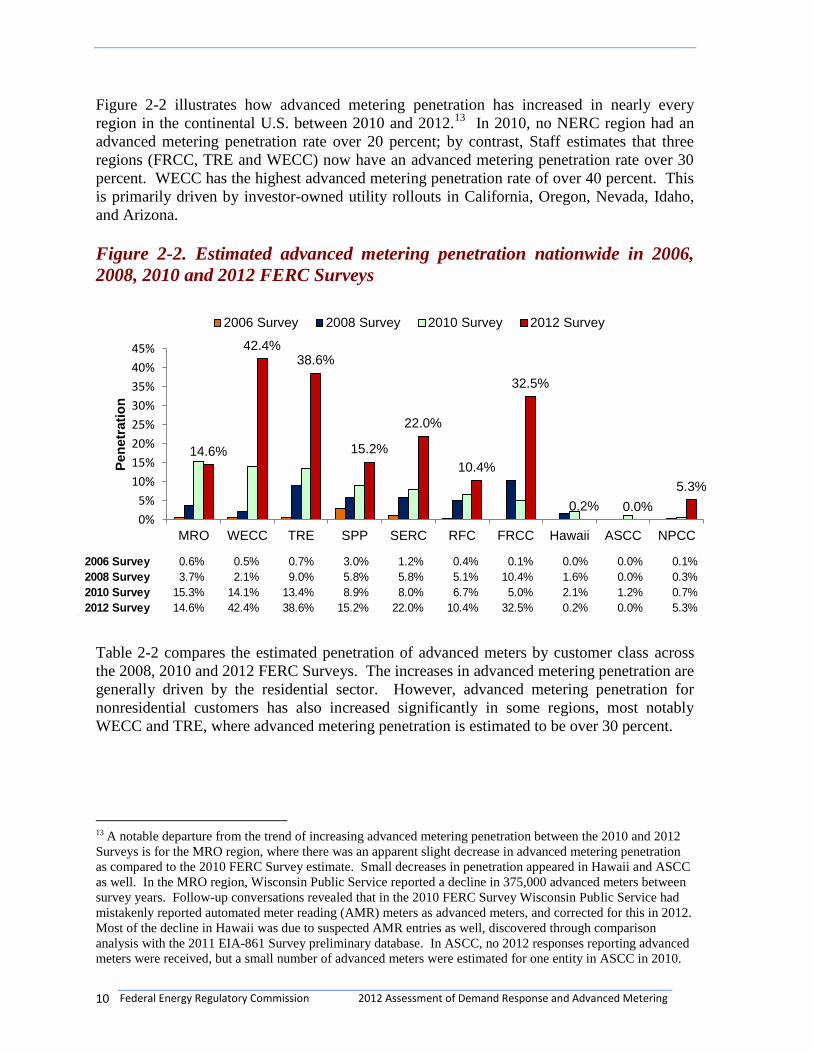
Figure 2-2 illustrates how advanced metering penetration has increased in nearly every
region in the continental U.S. between 2010 and 2012.13
In 2010, no NERC region had an
advanced metering penetration rate over 20 percent; by contrast, Staff estimates that three
regions (FRCC, TRE and WECC) now have an advanced metering penetration rate over 30
percent. WECC has the highest advanced metering penetration rate of over 40 percent. This
is primarily driven by investor-owned utility rollouts in California, Oregon, Nevada, Idaho,
and Arizona.
Figure 2-2. Estimated advanced metering penetration nationwide in 2006,
2008, 2010 and 2012 FERC Surveys
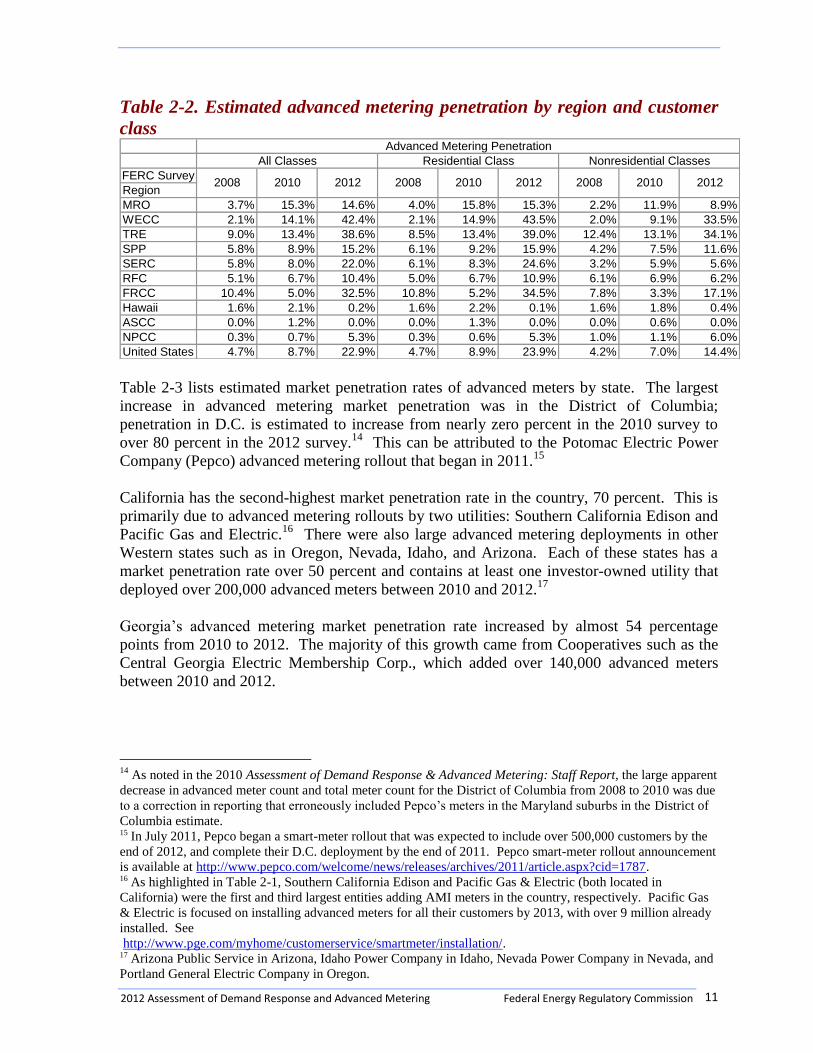
Table 2-2 compares the estimated penetration of advanced meters by customer class across
the 2008, 2010 and 2012 FERC Surveys. The increases in advanced metering penetration are
generally driven by the residential sector. However, advanced metering penetration for
nonresidential customers has also increased significantly in some regions, most notably
WECC and TRE, where advanced metering penetration is estimated to be over 30 percent.
13 A notable departure from the trend of increasing advanced metering penetration between the 2010 and 2012
Surveys is for the MRO region, where there was an apparent slight decrease in advanced metering penetration
as compared to the 2010 FERC Survey estimate. Small decreases in penetration appeared in Hawaii and ASCC
as well. In the MRO region, Wisconsin Public Service reported a decline in 375,000 advanced meters between
survey years. Follow-up conversations revealed that in the 2010 FERC Survey Wisconsin Public Service had
mistakenly reported automated meter reading (AMR) meters as advanced meters, and corrected for this in 2012.
Most of the decline in Hawaii was due to suspected AMR entries as well, discovered through comparison
analysis with the 2011 EIA-861 Survey preliminary database. In ASCC, no 2012 responses reporting advanced
meters were received, but a small number of advanced meters were estimated for one entity in ASCC in 2010.
14.6%
42.4% 38.6%
15.2%
22.0%
10.4%
32.5%
0.2% 0.0%
5.3%
0%
5%
10%
15%
20%
25%
30%
35%
40%
45%
MRO WECC TRE SPP SERC RFC FRCC Hawaii ASCC NPCC
Pen
etr
ati
on
2006 Survey 2008 Survey 2010 Survey 2012 Survey
2012 Assessment of Demand Response and Advanced Metering Federal Energy Regulatory Commission 11
Table 2-2. Estimated advanced metering penetration by region and customer
class
Table 2-3 lists estimated market penetration rates of advanced meters by state. The largest
increase in advanced metering market penetration was in the District of Columbia;
penetration in D.C. is estimated to increase from nearly zero percent in the 2010 survey to
over 80 percent in the 2012 survey.14
This can be attributed to the Potomac Electric Power
Company (Pepco) advanced metering rollout that began in 2011.15
California has the second-highest market penetration rate in the country, 70 percent. This is
primarily due to advanced metering rollouts by two utilities: Southern California Edison and
Pacific Gas and Electric.16
There were also large advanced metering deployments in other
Western states such as in Oregon, Nevada, Idaho, and Arizona. Each of these states has a
market penetration rate over 50 percent and contains at least one investor-owned utility that
deployed over 200,000 advanced meters between 2010 and 2012.17
Georgia’s advanced metering market penetration rate increased by almost 54 percentage
points from 2010 to 2012. The majority of this growth came from Cooperatives such as the
Central Georgia Electric Membership Corp., which added over 140,000 advanced meters
between 2010 and 2012.
14
As noted in the 2010 Assessment of Demand Response & Advanced Metering: Staff Report, the large apparent
decrease in advanced meter count and total meter count for the District of Columbia from 2008 to 2010 was due
to a correction in reporting that erroneously included Pepco’s meters in the Maryland suburbs in the District of
Columbia estimate. 15 In July 2011, Pepco began a smart-meter rollout that was expected to include over 500,000 customers by the
end of 2012, and complete their D.C. deployment by the end of 2011. Pepco smart-meter rollout announcement
is available at http://www.pepco.com/welcome/news/releases/archives/2011/article.aspx?cid=1787. 16 As highlighted in Table 2-1, Southern California Edison and Pacific Gas & Electric (both located in
California) were the first and third largest entities adding AMI meters in the country, respectively. Pacific Gas
& Electric is focused on installing advanced meters for all their customers by 2013, with over 9 million already
installed. See
http://www.pge.com/myhome/customerservice/smartmeter/installation/. 17 Arizona Public Service in Arizona, Idaho Power Company in Idaho, Nevada Power Company in Nevada, and
Portland General Electric Company in Oregon.
FERC Survey
Region
MRO 3.7% 15.3% 14.6% 4.0% 15.8% 15.3% 2.2% 11.9% 8.9%
WECC 2.1% 14.1% 42.4% 2.1% 14.9% 43.5% 2.0% 9.1% 33.5%
TRE 9.0% 13.4% 38.6% 8.5% 13.4% 39.0% 12.4% 13.1% 34.1%
SPP 5.8% 8.9% 15.2% 6.1% 9.2% 15.9% 4.2% 7.5% 11.6%
SERC 5.8% 8.0% 22.0% 6.1% 8.3% 24.6% 3.2% 5.9% 5.6%
RFC 5.1% 6.7% 10.4% 5.0% 6.7% 10.9% 6.1% 6.9% 6.2%
FRCC 10.4% 5.0% 32.5% 10.8% 5.2% 34.5% 7.8% 3.3% 17.1%
Hawaii 1.6% 2.1% 0.2% 1.6% 2.2% 0.1% 1.6% 1.8% 0.4%
ASCC 0.0% 1.2% 0.0% 0.0% 1.3% 0.0% 0.0% 0.6% 0.0%
NPCC 0.3% 0.7% 5.3% 0.3% 0.6% 5.3% 1.0% 1.1% 6.0%
United States 4.7% 8.7% 22.9% 4.7% 8.9% 23.9% 4.2% 7.0% 14.4%
Advanced Metering Penetration
2010 2012 2008 2010 20122008 2010 2012 2008
All Classes Residential Class Nonresidential Classes

Federal Energy Regulatory Commission 2012 Assessment of Demand Response and Advanced Metering 12
Table 2-3. Estimated penetration of advanced metering by state in 2008 –
201218
Several advanced metering rollouts occurred in tandem with new time-of-use demand
response programs. For example, Oklahoma added over 450,000 advanced meters between
the 2010 and 2012 FERC Surveys, largely from the advanced metering deployments by the
18
As noted elsewhere in this Report, entities revised what meters they included as being consistent with the
definition of AMI used for this report.
State AMI meters Total meters Penetration AMI meters Total meters Penetration AMI meters Total meters Penetration
DC 1,348 809,412 0.2% 2 275,554 0.0% 248,133 285,046 87.1%
CA 170,896 14,595,958 1.2% 2,475,896 14,837,434 16.7% 10,459,477 14,836,734 70.5%
ID 105,933 769,963 13.8% 198,370 803,576 24.7% 530,655 802,440 66.1%
GA 342,772 4,537,717 7.6% 514,403 4,401,623 11.7% 3,013,541 4,599,392 65.5%
AZ 96,727 2,810,224 3.4% 847,177 2,915,712 29.1% 1,646,410 2,977,092 55.3%
NV 10,835 1,292,331 0.8% 24,378 1,255,950 1.9% 717,220 1,299,632 55.2%
AL 139,972 2,774,764 5.0% 127,092 2,467,741 5.2% 1,397,672 2,604,431 53.7%
DE 0 438,020 0.0% 10,433 455,926 2.3% 310,890 593,583 52.4%
OR 39,797 1,890,423 2.1% 478,897 1,896,717 25.2% 960,151 1,874,339 51.2%
ME 426 780,748 0.1% 20,315 796,691 2.5% 671,036 1,372,735 48.9%
TX 868,204 10,870,895 8.0% 1,284,179 11,013,153 11.7% 5,948,975 16,987,336 35.0%
OK 161,795 1,875,325 8.6% 215,462 2,028,522 10.6% 703,091 2,071,552 33.9%
FL 765,406 9,591,363 8.0% 490,150 9,644,617 5.1% 3,052,570 9,771,192 31.2%
SD 41,191 475,477 8.7% 41,122 432,632 9.5% 109,586 440,774 24.9%
WY 12,268 318,282 3.9% 14,437 303,272 4.8% 70,650 308,024 22.9%
PA 1,443,285 6,036,064 23.9% 1,493,201 6,152,994 24.3% 1,623,982 7,753,238 20.9%
TN 60,385 3,160,551 1.9% 252,341 2,761,758 9.1% 724,469 3,738,153 19.4%
WI 117,577 3,039,830 3.9% 757,688 3,418,498 22.2% 562,861 3,107,700 18.1%
MI 73,948 5,311,570 1.4% 269,933 4,865,396 5.5% 738,702 4,859,675 15.2%
ND 33,336 375,473 8.9% 42,875 445,164 9.6% 61,329 407,033 15.1%
NC 143,093 4,771,479 3.0% 385,884 4,847,336 8.0% 644,811 4,832,250 13.3%
MS 3 1,454,275 0.0% 97,344 1,511,958 6.4% 201,877 1,584,994 12.7%
AR 168,466 1,488,124 11.3% 14,578 1,529,065 1.0% 162,181 1,559,849 10.4%
NH 260 763,683 0.0% 391 755,770 0.1% 76,864 743,454 10.3%
SC 114,619 2,373,047 4.8% 312,894 2,445,044 12.8% 246,526 2,417,863 10.2%
MO 204,498 3,098,055 6.6% 506,416 3,072,893 16.5% 299,375 3,061,397 9.8%
KY 105,460 2,161,142 4.9% 273,663 2,523,833 10.8% 313,094 3,353,259 9.3%
OH 28,042 5,544,353 0.5% 289,970 6,290,618 4.6% 638,167 7,267,087 8.8%
NE 8,630 970,774 0.9% 19,290 999,353 1.9% 83,342 977,513 8.5%
IN 61,551 3,115,205 2.0% 148,129 3,355,485 4.4% 275,821 3,342,734 8.3%
IA 46,407 1,714,774 2.7% 58,092 1,576,475 3.7% 124,975 1,623,036 7.7%
KS 61,423 1,426,832 4.3% 62,626 1,467,092 4.3% 110,628 1,452,858 7.6%
MN 37,071 2,542,113 1.5% 108,232 2,602,360 4.2% 203,717 2,709,254 7.5%
CO 39,873 2,246,184 1.8% 111,330 2,403,001 4.6% 183,658 2,446,657 7.5%
VA 6,448 3,965,584 0.2% 175478 3,663,525 4.8% 201,014 3,706,158 5.4%
CT 5,838 1,600,768 0.4% 1,967 1,625,758 0.1% 101,267 2,044,906 5.0%
MD 8 1,938,948 0.0% 4,189 2,483,628 0.2% 108,881 2,856,999 3.8%
MT 8,979 549,136 1.6% 27,470 577,745 4.8% 20,101 563,920 3.6%
IL 112,410 5,701,533 2.0% 286,568 6,099,158 4.7% 196,150 6,138,749 3.2%
MA 3,907 3,077,679 0.1% 20,831 3,150,098 0.7% 70,729 3,384,865 2.1%
WA 69,377 2,987,355 2.3% 128,857 3,298,781 3.9% 74,252 4,009,332 1.9%
UT 37 1,056,718 0.0% 20,046 1,083,069 1.9% 18,250 1,069,087 1.7%
LA 44,103 2,186,249 2.0% 53,848 2,245,066 2.4% 37,691 2,325,796 1.6%
NM 20,776 904,861 2.3% 54,250 1,015,058 5.3% 68,975 4,533,949 1.5%
AK 18 315,419 0.0% 3,835 316,289 1.2% 4,045 295,821 1.4%
NY 12,778 7,811,335 0.2% 28,664 9,313,776 0.3% 23,756 9,063,297 0.3%
NJ 9,866 3,900,716 0.3% 25,744 3,953,683 0.7% 13,768 6,062,487 0.2%
HI 6,550 405,228 1.6% 8,713 411,232 2.1% 737 484,479 0.2%
RI 148 480,135 0.0% 2,381 506,379 0.5% 210 477,183 0.0%
VT 20,755 375,202 5.5% 31,293 379,139 8.3% 128 398,300 0.0%
WV 10 1,183,513 0.0% 7,039 1,033,802 0.7% 280 1,051,585 0.0%
2008 2010 2012

2012 Assessment of Demand Response and Advanced Metering Federal Energy Regulatory Commission 13
Oklahoma Gas and Electric (OG&E). OG&E has stated that it is interested in delaying the
need for constructing additional generation facilities until 2020; therefore, OG&E is working
to combine smart grid technology (including advanced meters) with dynamic pricing to help
manage demand and achieve this goal.19
OG&E is using a combination of state and federal
funding to complete this dual advanced metering/demand response program.20
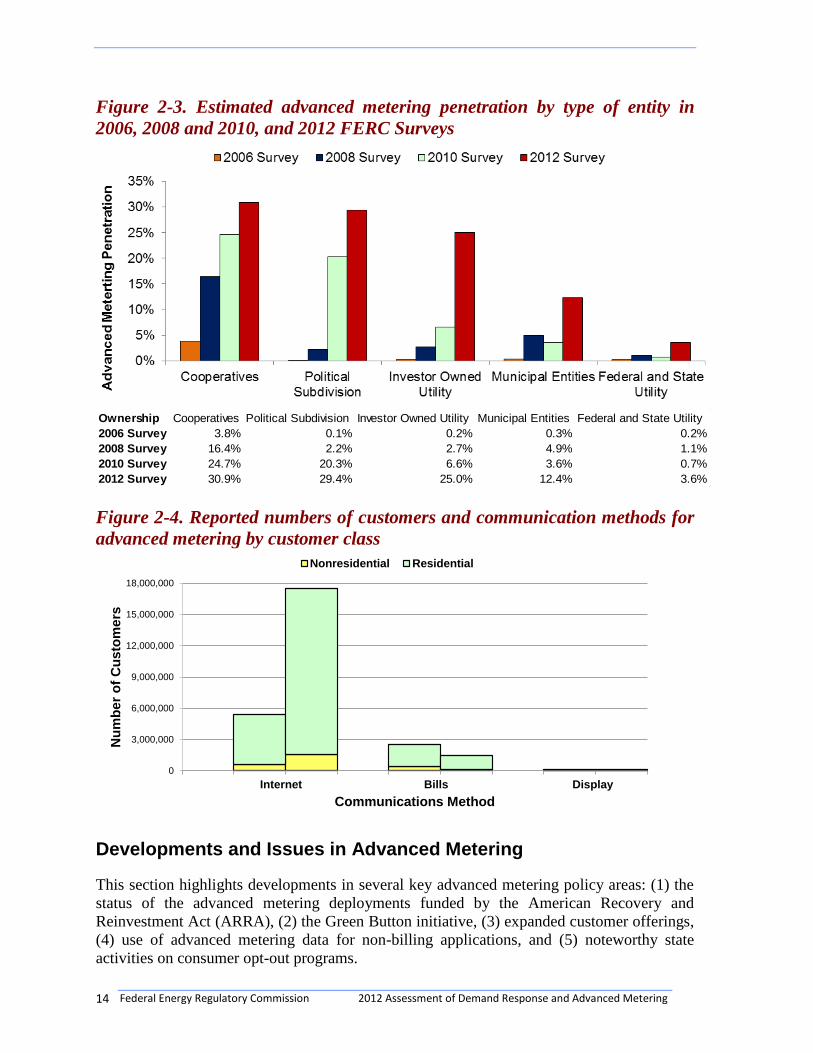
Figure 2-3 provides the estimated national penetration rate of advanced metering by entity
type. Advanced metering penetration increased for each entity type between 2010 and 2012.
Cooperatives still had the highest penetration with 31 percent. However, advanced metering
penetration for other entity types, such as political subdivisions21
and investor-owned
utilities, are reaching similar levels, with 29 percent and 25 percent market penetration
respectively.
The growth in the political subdivision category was driven by Salt River Project, which was
responsible for over 84 percent of the total advanced meters for this entity type. Salt River
Project was the recipient of federal Smart Grid Investment Grant (SGIG) funding to help
double its advanced metering meter penetration rate between 2010 and 2012; the SGIG
project also used time-of-day pricing to allow customers to better monitor and manage their
energy consumption.22
Customer Accessibility of Advanced Metering Data
The 2010 and 2012 FERC Surveys asked respondents with demand response or time-based
rate programs to categorize the ways in which their customers are capable of receiving
detailed energy usage data: over the internet, on their bills or invoices, or via a display unit
(e.g., an in-home display). Figure 2-4 illustrates that internet-based access has become the
dominant medium for customers to retrieve their energy usage data. In 2010, an estimated
5.4 million customers (both residential and nonresidential) were capable of using the internet
to access information on their energy use. That number increased significantly to 17.5
million customers by 2012, becoming the dominant means of accessing energy usage
information.
19 Oklahoma Gas & Electric, Second Year Preliminary Results Confirm Smart Technology Helps Reduce Peak
Energy Use, 1/24/2012 press release, available at http://phx.corporate-ir.net/phoenix.zhtml?c=106374&p=irol-
newsArticle&ID=1652157&highlight=. 20
Ibid. 21
Political Subdivisions include public utility districts, irrigation districts, and associations like the Salt River
Project. 22 Salt River Project added over 300,000 AMI meters between 2010 and 2012, and was a significant contributor to
the estimated penetration of 30 percent for its entity type. Its rollout was driven by funding from U.S.
Department of Energy, and its plan to install one million meters for its customers. Salt River Project smart
meter information is available at http://www.srpnet.com/electric/home/millionmeters.aspx.
Federal Energy Regulatory Commission 2012 Assessment of Demand Response and Advanced Metering 14
Figure 2-3. Estimated advanced metering penetration by type of entity in
2006, 2008 and 2010, and 2012 FERC Surveys
Figure 2-4. Reported numbers of customers and communication methods for
advanced metering by customer class
Developments and Issues in Advanced Metering
This section highlights developments in several key advanced metering policy areas: (1) the
status of the advanced metering deployments funded by the American Recovery and
Reinvestment Act (ARRA), (2) the Green Button initiative, (3) expanded customer offerings,
(4) use of advanced metering data for non-billing applications, and (5) noteworthy state
activities on consumer opt-out programs.
Ownership Cooperatives Political Subdivision Investor Owned Utility Municipal Entities Federal and State Utility
2006 Survey 3.8% 0.1% 0.2% 0.3% 0.2%
2008 Survey 16.4% 2.2% 2.7% 4.9% 1.1%
2010 Survey 24.7% 20.3% 6.6% 3.6% 0.7%
2012 Survey 30.9% 29.4% 25.0% 12.4% 3.6%
0
3,000,000
6,000,000
9,000,000
12,000,000
15,000,000
18,000,000
Internet Bills Display
Nu
mb
er
of
Cu
sto
me
rs
Communications Method
Nonresidential Residential
2012 Assessment of Demand Response and Advanced Metering Federal Energy Regulatory Commission 15
Status of the Advanced Metering Deployments Funded by the American Recovery and Reinvestment Act
The ARRA provided $4.5 billion in awards for smart grid deployment programs,23
and a
portion of that funding provided matching grants for advanced metering development. The
SGIG program has funded investments in advanced meters, networks, and hardware that
enable two-way communications between consumers and their electricity providers.
According to U.S. Department of Energy data, it has invested $2.8 billion in advanced
metering as of June 2012, and SGIG recipients have deployed and are operating 10.3 million
advanced meters. A total of 15.5 million advanced meters are planned to be deployed under
the ARRA program, and over two-thirds of these planned meters have been installed as of
September 30, 2012.24
Green Button Initiative
The Green Button Initiative is an effort for utilities to voluntarily provide retail electricity
customers with easily accessible and up-to-date data on their electricity usage. The initiative
began in September 2011 when U.S. Chief Technology Officer Aneesh Chopra challenged
the electric industry to provide customers access to their energy usage information
electronically in a user-friendly format.25
Since launching the Green Button Initiative in
January 2012, 35 utilities have committed to participate,26
which will provide 27 million
households in 17 states27
and the District of Columbia access to their energy usage
information.28
In a statement of support, the National Association of Regulatory Utility
Commissioners (NARUC) stated, “Voluntary efforts like the Green Button Initiative will
have a positive impact on both our electricity prices and the environment, and we salute the
States and utilities that are pursuing these developments.”29
Expanded Customer Service Offerings
Efforts to standardize the format of energy usage information and protect customer privacy30
have fostered the rapid development of new applications to further engage and inform
customers. Among these new offerings are home energy reports, customized alerts or
notifications, and improved management software. Advanced metering data makes it
possible for utilities and third-party service providers to offer customers these new and
23
U.S. Department of Energy, 2010 Smart Grid System Report, February 2012, p. 7, available at
http://energy.gov/oe/downloads/2010-smart-grid-system-report-february-2012. 24
Smartgrid.gov, Advanced Metering Infrastructure and Customer Systems, available at
http://www.smartgrid.gov/recovery_act/deployment_status/ami_and_customer_systems. 25
Aneesh Chopra, “Modeling a Green Energy Challenge after a Blue Button,” Office of Science and
Technology Policy, The White House, September 2011, available at
http://www.whitehouse.gov/blog/2011/09/15/modeling-green-energy-challenge-after-blue-button. 26
See http://www.whitehouse.gov/sites/default/files/microsites/ostp/energy_datapalooza_fact_sheet.pdf for
more information. 27
Arkansas, California, Illinois, Indiana, Kentucky, Louisiana, Maryland, Massachusetts, Michigan, North
Carolina, Ohio, Oklahoma, Pennsylvania, Tennessee, Texas, Virginia, and West Virginia, as well as the District
of Columbia. 28
See: Green Button, Adopters, available at http://www.greenbuttondata.org/greenadopt.html. 29
National Association of Regulatory Utility Commissioners, “NARUC Applauds States, Utilities for ‘Green
Button’ Efforts,” March 23, 2012 press release, available at http://www.naruc.org/News/default.cfm?pr=306. 30
See, e.g., the NAESB Energy Service Provide Interface (see Chapter 4).

Federal Energy Regulatory Commission 2012 Assessment of Demand Response and Advanced Metering 16
innovative products and services which are designed to help customers save money, qualify
for incentives, and consume electricity more efficiently.
For example, the U.S. Department of Energy sponsored an “Apps for Energy” contest in
April 2012 that offered $100,000 to software developers who created the best new apps to
help customers utilize Green Button electricity usage data.31
The winning application was
submitted by Leafully, which created a program that compares a customer’s energy usage to
the number of trees needed to offset the pollution created by that electricity consumption.32
Other companies used social media and peer comparison/competition to promote awareness
of energy consumption. For example, Opower recently partnered with Facebook and the
National Resources Defense Council to launch an application that allows customers to post
their electric usage data online and compare it to others with similarly-sized homes.33
Use of Advanced Metering Data for Non-Billing Applications
In addition to expanded service offerings, data derived from advanced metering allows
utilities to help tackle long-standing issues such as outage management, power and voltage
quality, overloaded customer services and overheating meter sockets. For example,
advanced meters have the ability to provide “last gasp” messages. As soon as an advanced
meter experiences an outage, an internal battery can provide enough power to transmit an
outage message back to the utility. These messages can be actively monitored, or fed into an
outage management system to determine the extent of outages and assist in dispatching the
necessary resources. In addition to facilitating timely outage responses, advanced meters can
reduce unnecessary service calls. For example, if a customer calls to report an outage, a call
center representative can attempt to contact the customer’s meter to determine immediately if
the customer has power. This ability of advanced meters to detect outages proved valuable
for several utilities on the East Coast during the restoration efforts following Hurricane
Sandy in October 2012.34
Many advanced meters also have the ability to sense the meter’s
internal temperature, related to its ability to maintain accuracy over its operating temperature
range. This can be used to detect overheating conditions within the meter.
Advanced metering systems can also open up new ways of monitoring voltage throughout an
electric distribution system; this can improve operational control and efficiency. Voltage
typically varies across a distribution circuit, and to ensure that voltage is consistently within
the allowable band (usually 114 to 126 volts), utilities have traditionally relied on
engineering models to identify potential points in a circuit where voltage may fall outside the
allowable range. Voltage levels outside allowable ranges can reduce customers’ service
quality and compromise the reliability of grid components such as transformers. However,
since advanced meters provide data more frequently than traditional meters, a utility can
monitor voltage levels using actual data throughout the circuit, rather than using engineering
31
U.S. DOE, Challenge.gov, Apps for Energy, available at http://appsforenergy.challenge.gov/. 32
Leafully, What is Leafully?, available at https://www.leafully.com/tour/. 33
Opower, Your electricity use vs Similar homes, available at https://social.opower.com/explore/ 34
For example, see http://www.technologyreview.com/view/506711/smart-meters-help-utility-speed-sandy-
restoration/ for a description of how advanced meters helped Potomac Electric Power, and see
http://www.greentechmedia.com/articles/read/a-smart-meter-in-the-superstorm for a description of how
advanced metering helped Philadelphia Electric.
2012 Assessment of Demand Response and Advanced Metering Federal Energy Regulatory Commission 17
model estimates. Controlling voltage more precisely can also help utilities and consumers
save energy; these conservation voltage reduction programs are also known as “Volt-Var.”
Opt-Out Programs
Some consumers are concerned about the privacy of customer data, cybersecurity, failure
rates, and overheating,35
as well as possible adverse health effects from radio frequency
emissions if the communications method uses radio frequencies. Because of these concerns,
many consumer groups endorse opportunity for individual customers to forgo, or “opt-out,”
of advanced meter installations at their own premises.
State regulatory bodies are considering whether to permit opt-out programs, and are coming
to varying conclusions. When evaluating an opt-out program, a state typically balances
consumer concerns regarding advanced meters against the system cost-saving benefits of
universal use in an area. Some groups argue that opt-out programs are not efficient, since
having both analog and digital systems in one area could reduce a utility’s ability to automate
functions such as meter reading, billing, and outage detection.36
Utilities also incur
additional administrative costs to accommodate customers that opt out of advanced metering;
for example, the utility might need to maintain meter reading trucks and additional staff to
support the non-advanced metering customers.37
Therefore, to maximize the potential
system benefits of advanced metering, and to avoid additional administrative costs, some
states have been hesitant to allow opt-out provisions in advanced metering deployment
programs. For example, the Idaho Public Utilities Commission recently dismissed a
consumer request to allow opting out of advanced meter installations, citing the potential
costs of an opt-out program.38
Another issue concerning opt-out programs is how to allocate the extra cost of manually
reading individual meters if some consumers choose not to use an advanced meter. The costs
of an opt-out program could be allocated to (1) all rate payers in a service territory, (2) only
the customers that choose to opt out, or (3) some combination of the two. For example, the
Maine Public Utilities Commission39
and the California Public Utilities Commission40
35
See: Maryland Public Service Commission, Notice of Opportunity to Comment, To: Service List for Case
Nos. 9207, 9208, 9294, available at http://webapp.psc.state.md.us/Intranet/Casenum/caseform_new.cfm? ;
Pennsylvania Public Utility Commission, Re: AMI Meter Deployment Inquiries: Commission staff August 24,
2012 data request, and PECO’s September 7, 2012 responses; Gregory Karp, “ComEd confirms smart meters
involved in ‘small fires’” Chicago Tribune, August 2012, available at http://articles.chicagotribune.com/2012-
08-30/business/chi-comed-confirms-smart-meters-involved-in-small-fires--20120830_1_smart-meters-comed-
customers-poor-connection. 36
See: “The Opt-Out Challenge,” Electric Light & Power, March/April 2012, available at
http://www.elp.com/index/current-issue/electric-light-power/volume--90/issue-02.html; Institute for Electric
Efficiency, The Cost and Benefits of Smart Meters for Residential Customers, July 2011, p. 4, Available at:
http://www.edisonfoundation.net/iee/Documents/IEE_BenefitsofSmartMeters_Final.pdf. 37
Ibid 38
Meters that opt-out need to be individually read by a meter reader. See Idaho Public Utilities Commission,
Formal Complaint Objecting to Installation of AMI Meters, Case No. IPC-E-12- 04, Order No. 32500, available
at
http://www.puc.idaho.gov/internet/cases/elec/IPC/IPCE1204/ordnotc/20120327FINAL_ORDER_NO_32500.P
DF. 39
Maine Public Utilities Commission, Docket No. 2010-345, et al., Request for Commission Investigation in
Pursuing the Smart Meter Initiative, et al., Order (Part I), and Order (Part II), May 19, 2011 and June 22, 2011,
Federal Energy Regulatory Commission 2012 Assessment of Demand Response and Advanced Metering 18
recently approved opt-out programs where the costs were assigned only to customers
choosing to opt out, on a tiered basis. The California and Maine programs offer differing
opt-out fees under a variety of options, ranging from maintaining a traditional analog meter
to simply having the wireless capabilities removed from an advanced meter.41
Some other
states do not permit utilities to charge opt-out fees. For example, Vermont enacted
legislation eliminating opt-out fees in May 2012, and also required that any advanced meter
already installed be removed without charge if the customer requests this option.42
However, to date customer participation rates in opt-out programs have been low. For
example, less than one percent of Pacific Gas and Electric customers have opted out of
advanced meter deployments.43
Portland General Electric experienced an even lower opt-out
rate; only 4 out of 720,000 customers chose to opt out.44
These early advanced metering
deployment results indicate that opt-out provisions support individuals’ ability to make a
choice, while only an insignificant number of customers have actually decided to opt out.45
The debate surrounding opt-out programs continues, and several states continue to assess the
feasibility of implementing opt-out programs. For example, the California Public Utilities
Commission began a second phase of proceedings in June 2012 to reexamine the opt-out
issue and may consider extending an opt-out option to customer groups such as local
governments and residents of apartment buildings/condominiums.46
The second phase will
also address the possibility that the Americans with Disabilities Act prohibits that
Commission from charging opt-out fees for customers who have an analog meter for medical
reasons. In addition, the Maryland Public Service Commission issued an interim order in
available at https://mpuc-cms.maine.gov/CQM.Public.WebUI/Common/CaseMaster.aspx?CaseNumber=2010-
00345. 40
California Public Utilities Commission, Decision Modifying Decision 08-09-039 and Adopting an Opt-Out
Program for Southern California Edison Company’s Edison SmartConnect Program, Decision 12-04-018,
Issued April 30, 2012, available at http://docs.cpuc.ca.gov/PUBLISHED/FINAL_DECISION/165307.htm. 41
On July 12, 2012, the Maine Law Court issued a decision that vacated the portion of Maine Public Utilities
Commission’s dismissal of a complaint pertaining to health and safety concerns associated with advanced meter
usage in the Central Maine Power Company (CMP) service territory. The Maine PUC subsequently issued an
order staying disconnection of CMP customers until the conclusion of an investigation. See: Maine Public
Utilities Commission, Docket No. 2010-345, et al., Request for Commission Investigation in Pursuing the
Smart Meter Initiative, et al., Order Staying Disconnection of CMP Customers for Failure to Pay Opt-Out Fees,
August 8, 2012 42
Vermont State Legislature, The Vermont Legislative Bill Tracking System, Senate Bill No. 214, An Act
Relating to the Vermont Energy Act of 2012, Enacted May 18, 2012, available at
http://www.leg.state.vt.us/database/status/summary.cfm?Bill=S.0214&Session=2012. 43
United Telecom Council, Smart Meter Opt-Out – The Policies and Impacts, 9/27/2012 Webinar, as reported
by intelligentutility, Few and fewer opting out of smart meters, September 30, 2012, available at http://www.intelligentutility.com/article/12/09/few-and-fewer-opting-out-smart-meters. 44
ibid. 45
Eric Lightner, Director of the Federal Smart Grid Task Force, DOE Office of Electricity Delivery and Energy
Reliability, Roundtable 2 – Policymakers Talk, June 26, 2012. 46
California Public Utilities Commission, Application of Pacific Gas and Electric Company for Approval of
Modifications to its SmartMeter™ Program and Increased Revenue Requirements to Recover the Costs of the
Modifications: Assigned Commissioner’s Ruling Amending Scope of Proceeding to Add a Second Phase,
Application No. 11-03-014, Enacted June 8, 2012, available at http://docs.cpuc.ca.gov/efile/RULC/168362.pdf.
2012 Assessment of Demand Response and Advanced Metering Federal Energy Regulatory Commission 19
May 2012 directing utilities to refrain from installing or activating advanced meters until a
permanent course of action is determined.47
Texas48
and Nevada49
have also been assessing
the feasibility of opt-out programs.
47
Maryland Public Service Commission, Case No. 9207: In the Matter of Potomac Electric Power Company and
Delmarva Power and Light Company Request for the Deployment of Advanced Meter Infrastructure, and Case
No. 9208: In the Matter of Baltimore Gas and Electric Company for Authorization to deploy a Smart Grid
Initiative and to Establish a Surcharge Mechanism for the Recovery of Costs, Order No. 84926: Interim Order
Regarding “Opt-out” Option for Smart Meters, May 25, 2012, available at
http://webapp.psc.state.md.us/Intranet/Casenum/submit_new.cfm?DirPath=C:\Casenum\9200-
9299\9207\Item_203\&CaseN=9207\Item_203. 48
Public Utilities Commission of Texas, Project, Control No. 40190, Item 382: PUC Proceeding to Evaluate the
Feasibility of Instituting a Smart Meter Opt-Out Program, available at
http://interchange.puc.state.tx.us/WebApp/Interchange/application/dbapps/filings/pgControl.asp?TXT_UTILIT
Y_TYPE=A&TXT_CNTRL_NO=40190&TXT_ITEM_MATCH=1&TXT_ITEM_NO=&TXT_N_UTILITY=
&TXT_N_FILE_PARTY=&TXT_DOC_TYPE=ALL&TXT_D_FROM=&TXT_D_TO=&TXT_NEW=true. 49
Public Utilities Commission of Nevada, Application of Nevada Power Company d/b/a NV Energy and Sierra
Pacific Power Company d/b/a NV for approval of proposed trial Non-Standard Metering Option riders and
changes to existing rules and schedules associated with implementation of the NSMO riders, Docket No. 12-
05003, Filled May 2012.

Federal Energy Regulatory Commission 2012 Assessment of Demand Response and Advanced Metering 20

2012 Assessment of Demand Response and Advanced Metering Federal Energy Regulatory Commission 21
CHAPTER 3. DEMAND RESPONSE
This chapter addresses the second and third topics in EPAct 2005 section 1252(e)(3):
(B) Existing demand response programs and time-based rate programs, and
(C) The annual resource contribution of demand resources.
This chapter presents results of the 2012 FERC Survey on demand response programs,
including comparisons to previous FERC Survey results, and has three sections:
Definition of Demand Response
Survey Results
Demand Response Developments at the FERC, and Barriers to Demand Response
Definition of Demand Response
The definition of demand response used in the survey and this report is:
Demand Response: Changes in electric use by demand-side resources from their
normal consumption patterns in response to changes in the price of electricity, or to
incentive payments designed to induce lower electricity use at times of high
wholesale market prices or when system reliability is jeopardized.
The demand response program types and definitions in the 2012 FERC Survey conform to
those used by NERC’s Demand Response Availability Data System (DADS). This common
terminology allows for some comparison with the DADS data. Table 4.1 contains the
program classifications included in the 2012 Survey. Definitions for each of the
classifications can be found in the Appendix C glossary.
Table 3-1. Demand response program types in the 2012 FERC Survey
Incentive-Based Programs Time-Based Programs Demand Bidding and Buyback Direct Load Control Emergency Demand Response Interruptible Load Load as Capacity Resource Non-Spinning Reserves Regulation Service Spinning Reserves
Critical Peak Pricing with Control Critical Peak Pricing Peak Time Rebate Real-Time Pricing Time-of-Use Pricing System Peak Response Transmission
Tariff
Note: The 2012 FERC Survey also included an “Other” category for demand response program types that were not classified in either the Incentive-based DR Programs or Time-based Programs classifications.

Federal Energy Regulatory Commission 2012 Assessment of Demand Response and Advanced Metering 22
Survey Results
Analytical Approach
Reported and estimated data on demand response and time-based rate programs are presented
below. As with prior year Reports, the approach taken was to gather information via survey
and to also supplement the data with Form EIA-861 data to report “annual resource
contribution” as required in EPAct Section 1252(e)(3)(C). Values that are labeled as
“reported” reflect the peak reduction (potential and actual) reported by entities in their survey
responses. Values labeled as “estimated” represent an estimate of U.S. total peak reduction,
and were derived using supplemental FERC and Form EIA-861 data, along with statistical
methods, to fill in missing data. A detailed explanation of these estimation methods can be
found in Appendix H.
Both reported and estimated demand response peak reduction are adjusted to minimize
double-counting. Appendix D describes the methods Staff used to address double counting
in the peak reduction data in more detail.
Summary of Report Findings
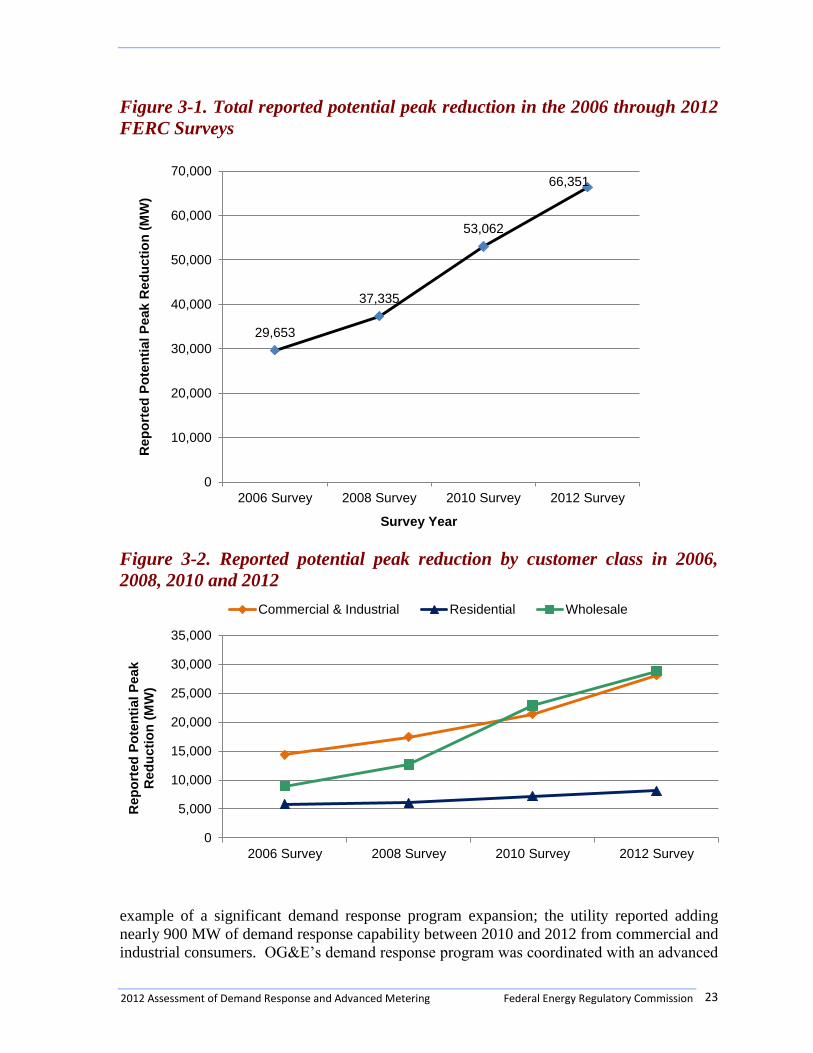
According to FERC Survey data, reported potential peak reduction in the U.S. increased from
2010 to 2012 by more than 10,000 MW, from 53,062 to 66,351 MW in 2012. This
represents a 25 percent increase in reported potential peak reductions from demand response.
Figure 3-1 illustrates a steady national increase in demand response capability50
across all
FERC survey years.
While demand response capability in the U.S. has steadily increased over the past few years,
the key contributors to this trend vary across customer class, ownership type, and program
type. The following sections summarize the 2012 FERC Survey findings on demand
response.
Growth in Reported Potential Peak Reduction by Customer Class
Growth in reported potential peak reduction from 2006 to 2012 occurred among all customer
classes, as illustrated in Figure 3-2.
Growth in Commercial and Industrial Potential Peak Reduction
Reported potential peak reductions by commercial and industrial customers increased by 31
percent, the largest increase of the three customer classes. This increase is due to new and
expanded demand response programs, along with improved reporting of existing programs in
the 2012 survey.51
The Oklahoma Gas and Electric (OG&E) time-of-use program is one
50
The terms “demand response capability” and “potential peak reduction” are used synonymously in this report. 51
For example, the 2012 response for TVA indicates a significant increase in TVA’s potential peak reduction
from 2010. The apparent increase is because certain potential peak reductions reported in 2012 existed in 2010
but were not reported for TVA’s programs in the 2010 FERC Survey. Similarly, the large changes in potential
peak reduction from 2010 to 2012 for The Detroit Edison Company and Progress Energy Florida can be
attributed to unreported 2010 data, rather than new program offerings or increased enrollment.
2012 Assessment of Demand Response and Advanced Metering Federal Energy Regulatory Commission 23
Figure 3-1. Total reported potential peak reduction in the 2006 through 2012
FERC Surveys
Survey Year
Figure 3-2. Reported potential peak reduction by customer class in 2006,
2008, 2010 and 2012
example of a significant demand response program expansion; the utility reported adding
nearly 900 MW of demand response capability between 2010 and 2012 from commercial and
industrial consumers. OG&E’s demand response program was coordinated with an advanced
29,653
37,335
53,062
66,351
0
10,000
20,000
30,000
40,000
50,000
60,000
70,000
2006 Survey 2008 Survey 2010 Survey 2012 Survey
Rep
ort
ed
Po
ten
tial
Peak R
ed
ucti
on
(M
W)
0
5,000
10,000
15,000
20,000
25,000
30,000
35,000
2006 Survey 2008 Survey 2010 Survey 2012 Survey
Rep
ort
ed
Po
ten
tial
Peak
Red
ucti
on
(M
W)
Commercial & Industrial Residential Wholesale

Federal Energy Regulatory Commission 2012 Assessment of Demand Response and Advanced Metering 24
metering deployment (see Chapter 2), and as a result, OG&E reported over 1,700 new
commercial and industrial participants in its time-of-use rate program.52
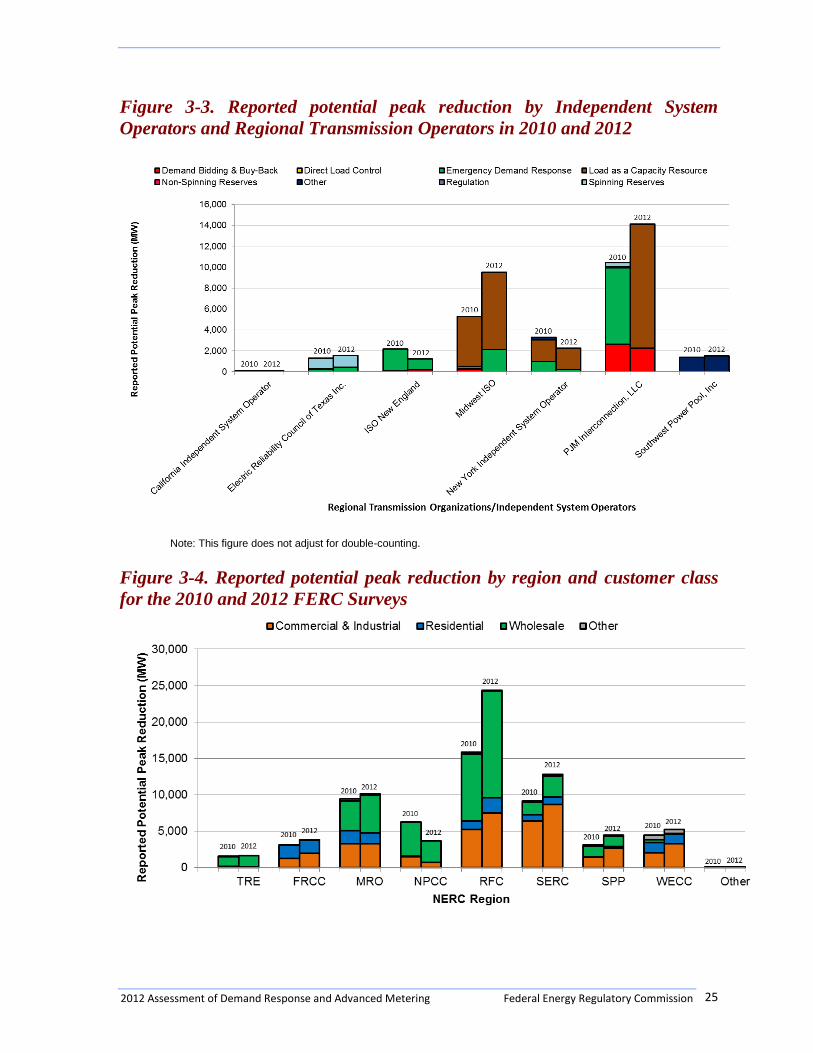
Growth in Wholesale Potential Peak Reduction
Reported potential peak reduction for wholesale entities53
grew by 26 percent, from 22,884
MW in 2010 to 28,807 MW in 2012. Increased enrollment of demand response resources in
PJM Interconnection, LLC (PJM) and Midwest Independent Transmission System Operator
(Midwest ISO) largely drove this increase, as illustrated in Figure 3-3.54
Figure 3-3 also shows a marked shift in the composition of wholesale demand response
programs. Between 2010 and 2012, the reported potential peak reductions associated with
emergency demand response programs decreased and load as a capacity resource increased,
especially in the PJM and the Midwest ISO markets.
Growth in Residential Potential Peak Reduction
Reported potential peak reduction associated with residential customers grew by 13 percent,
from 7,189 MW in 2010 to 8,134 MW in 2012. Seventy percent of this increase is
attributable to investor-owned utilities’ demand response programs. For residential
customers, direct load control and time-based rates programs had the largest increases in
reported potential peak reduction. For example, Baltimore Gas and Electric reported a
significant increase in its residential direct load control program, from 272 MW of potential
peak reduction in 2010 to 763 MW in 2012.55
Reported Potential Peak Reduction by Region
Nearly every region in the U.S. increased its reported potential peak reduction between 2010
and 2012, as illustrated in Figure 3-4. ReliabilityFirst Corporation (RFC) remained the
region with the most reported potential peak reduction; RFC reported of 24,381 MW of
potential peak reduction in 2012, an increase of 8,517 MW from 2010. Most of this reported
growth is due to increased participation by demand response resources in PJM’s forward
capacity market.
52
Smartgrid.gov: Recovery Act Smart Grid Programs, Case Studies, Reducing Peak Demand to Defer Power
Plant Construction in Oklahoma, August 2011, available at
http://energy.gov/sites/prod/files/Case%20Study%20-%20Oklahoma%20Gas%20and%20Electric%20-
%20Reducing%20Peak%20Demand%20to%20Defer%20Power%20Plant%20Construction%20-
%20August%202011.pdf. 53
Wholesale entities include ISOs, RTOs, curtailment service providers, wholesale power marketing agencies
such as the Bonneville Power Administration, the Tennessee Valley Authority, generation and transmission
corporations and joint action agencies that serve member companies, and wholesale electric marketers. 54
Figure 3-3 shows the information provided by the ISOs and RTOs in 2010 and 2012 in their responses to the
2012 FERC Survey. This figure does not reflect any adjustments to eliminate double counting of potential peak
reductions reported by both retail entities and an ISO or RTO. 55
Baltimore Gas and Electric deployed its direct load control program during a PJM-initiated emergency on a
very hot day in July of 2011 and later measured the impact at approximately 600 MW. See
http://webapp.psc.state.md.us/Intranet/Casenum/submit_new.cfm?DirPath=C:\Casenum\9100-
9199\9154\Item_214\&CaseN=9154\Item_214.
2012 Assessment of Demand Response and Advanced Metering Federal Energy Regulatory Commission 25
Figure 3-3. Reported potential peak reduction by Independent System
Operators and Regional Transmission Operators in 2010 and 2012
Note: This figure does not adjust for double-counting.
Figure 3-4. Reported potential peak reduction by region and customer class
for the 2010 and 2012 FERC Surveys
Federal Energy Regulatory Commission 2012 Assessment of Demand Response and Advanced Metering 26
SERC Reliability Corporation became the second largest NERC region for reported potential
peak reduction, by adding 3,655 MW; this represents a 40 percent increase from 2010.
Combined, SERC and RFC account for over 55 percent of the total U.S. reported potential
peak reduction in 2012.
In the Northeast Power Coordinating Council (NPCC), the reported potential peak reduction
declined by 40 percent between 2010 and 2012. A key driver for this drop in the reported
potential peak reduction is due to significant declines in the amount of potential peak
reduction reported by several key entities in New York.
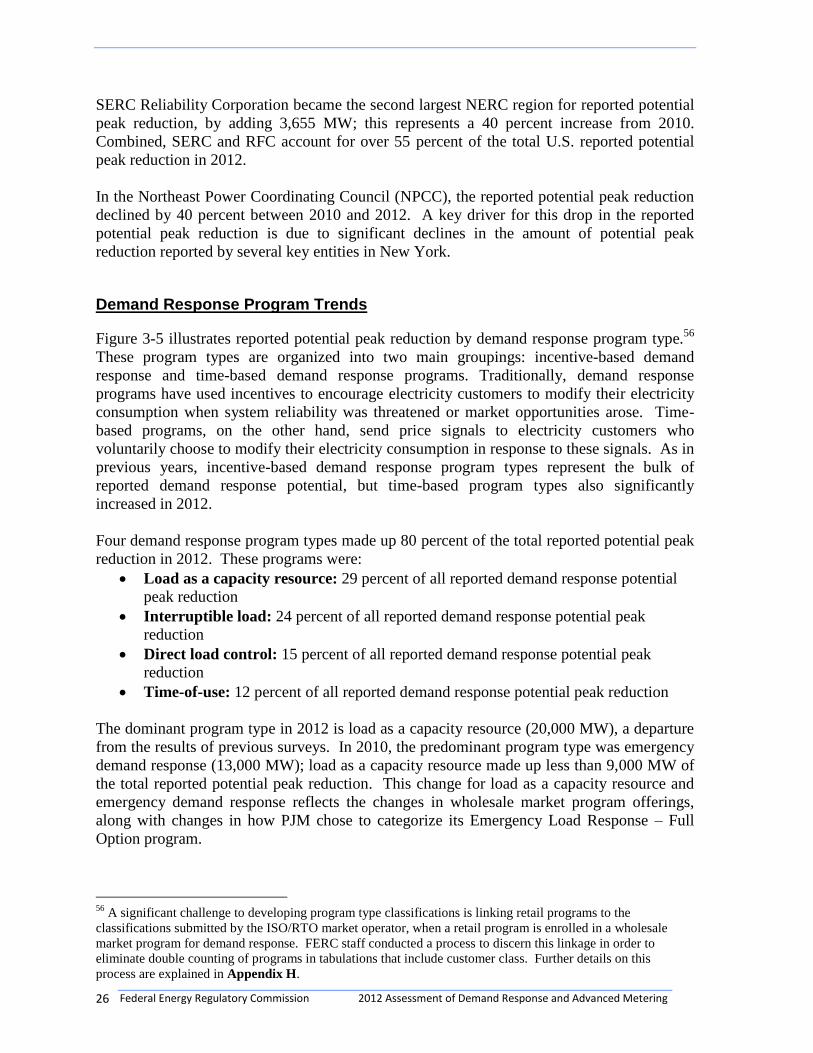
Demand Response Program Trends
Figure 3-5 illustrates reported potential peak reduction by demand response program type.56
These program types are organized into two main groupings: incentive-based demand
response and time-based demand response programs. Traditionally, demand response
programs have used incentives to encourage electricity customers to modify their electricity
consumption when system reliability was threatened or market opportunities arose. Time-
based programs, on the other hand, send price signals to electricity customers who
voluntarily choose to modify their electricity consumption in response to these signals. As in
previous years, incentive-based demand response program types represent the bulk of
reported demand response potential, but time-based program types also significantly
increased in 2012.
Four demand response program types made up 80 percent of the total reported potential peak
reduction in 2012. These programs were:
Load as a capacity resource: 29 percent of all reported demand response potential
peak reduction
Interruptible load: 24 percent of all reported demand response potential peak
reduction
Direct load control: 15 percent of all reported demand response potential peak
reduction
Time-of-use: 12 percent of all reported demand response potential peak reduction
The dominant program type in 2012 is load as a capacity resource (20,000 MW), a departure
from the results of previous surveys. In 2010, the predominant program type was emergency
demand response (13,000 MW); load as a capacity resource made up less than 9,000 MW of
the total reported potential peak reduction. This change for load as a capacity resource and
emergency demand response reflects the changes in wholesale market program offerings,
along with changes in how PJM chose to categorize its Emergency Load Response – Full
Option program.
56
A significant challenge to developing program type classifications is linking retail programs to the
classifications submitted by the ISO/RTO market operator, when a retail program is enrolled in a wholesale
market program for demand response. FERC staff conducted a process to discern this linkage in order to
eliminate double counting of programs in tabulations that include customer class. Further details on this
process are explained in Appendix H.
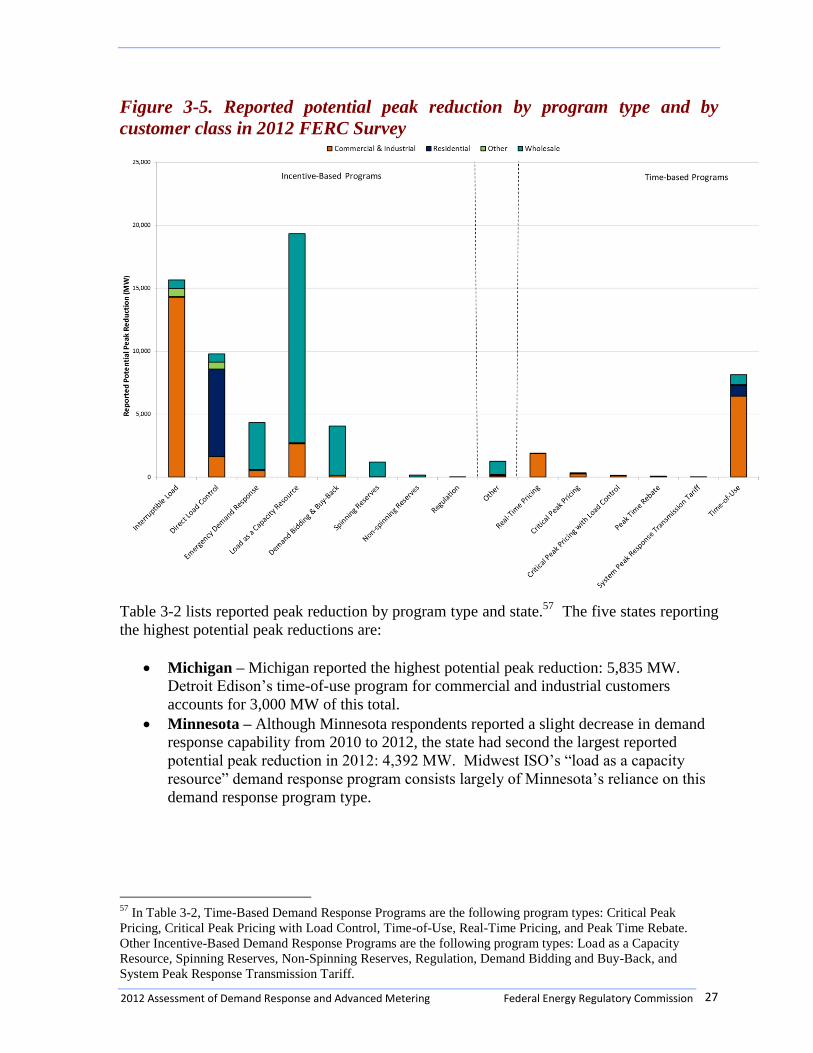
2012 Assessment of Demand Response and Advanced Metering Federal Energy Regulatory Commission 27
Figure 3-5. Reported potential peak reduction by program type and by
customer class in 2012 FERC Survey
Table 3-2 lists reported peak reduction by program type and state.
57 The five states reporting
the highest potential peak reductions are:
Michigan – Michigan reported the highest potential peak reduction: 5,835 MW.
Detroit Edison’s time-of-use program for commercial and industrial customers
accounts for 3,000 MW of this total.
Minnesota – Although Minnesota respondents reported a slight decrease in demand
response capability from 2010 to 2012, the state had second the largest reported
potential peak reduction in 2012: 4,392 MW. Midwest ISO’s “load as a capacity
resource” demand response program consists largely of Minnesota’s reliance on this
demand response program type.
57
In Table 3-2, Time-Based Demand Response Programs are the following program types: Critical Peak
Pricing, Critical Peak Pricing with Load Control, Time-of-Use, Real-Time Pricing, and Peak Time Rebate.
Other Incentive-Based Demand Response Programs are the following program types: Load as a Capacity
Resource, Spinning Reserves, Non-Spinning Reserves, Regulation, Demand Bidding and Buy-Back, and
System Peak Response Transmission Tariff.
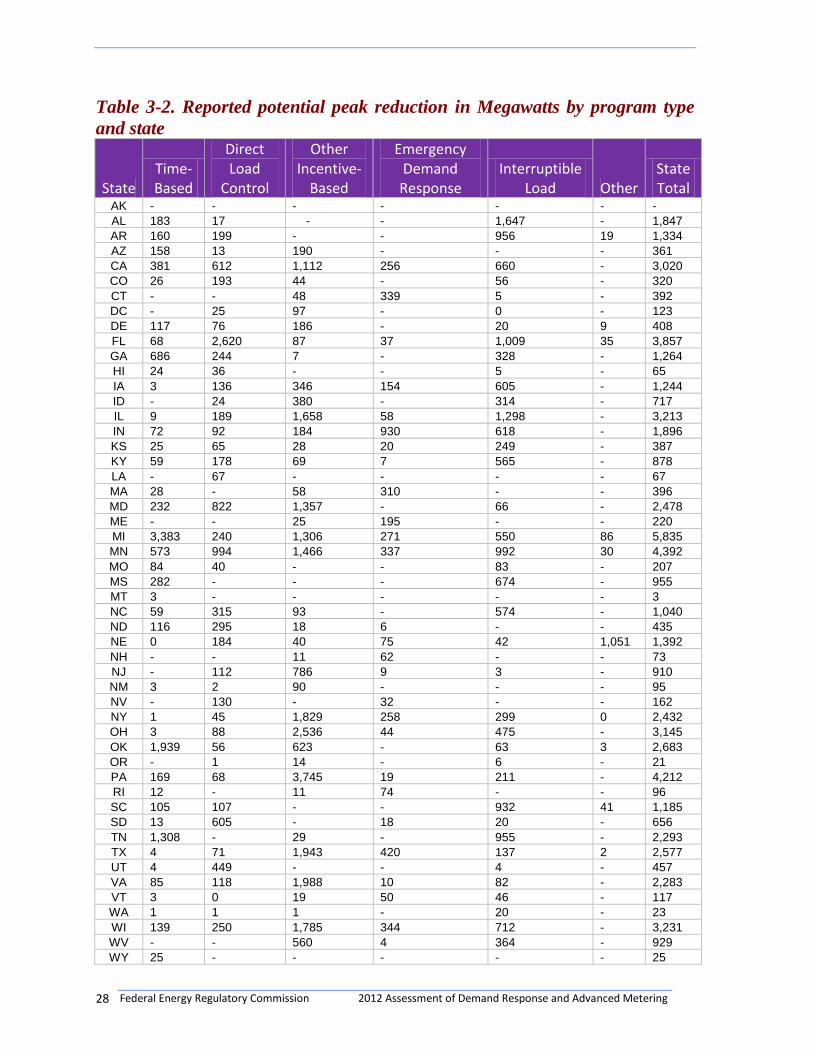
Federal Energy Regulatory Commission 2012 Assessment of Demand Response and Advanced Metering 28
Table 3-2. Reported potential peak reduction in Megawatts by program type
and state
State Time-Based
Direct Load
Control
Other Incentive-
Based
Emergency Demand Response
Interruptible Load Other
State Total
AK - - - - - - -
AL 183 17 - - 1,647 - 1,847
AR 160 199 - - 956 19 1,334
AZ 158 13 190 - - - 361
CA 381 612 1,112 256 660 - 3,020
CO 26 193 44 - 56 - 320
CT - - 48 339 5 - 392
DC - 25 97 - 0 - 123
DE 117 76 186 - 20 9 408
FL 68 2,620 87 37 1,009 35 3,857
GA 686 244 7 - 328 - 1,264
HI 24 36 - - 5 - 65
IA 3 136 346 154 605 - 1,244
ID - 24 380 - 314 - 717
IL 9 189 1,658 58 1,298 - 3,213
IN 72 92 184 930 618 - 1,896
KS 25 65 28 20 249 - 387
KY 59 178 69 7 565 - 878
LA - 67 - - - - 67
MA 28 - 58 310 - - 396
MD 232 822 1,357 - 66 - 2,478
ME - - 25 195 - - 220
MI 3,383 240 1,306 271 550 86 5,835
MN 573 994 1,466 337 992 30 4,392
MO 84 40 - - 83 - 207
MS 282 - - - 674 - 955
MT 3 - - - - - 3
NC 59 315 93 - 574 - 1,040
ND 116 295 18 6 - - 435
NE 0 184 40 75 42 1,051 1,392
NH - - 11 62 - - 73
NJ - 112 786 9 3 - 910
NM 3 2 90 - - - 95
NV - 130 - 32 - - 162
NY 1 45 1,829 258 299 0 2,432
OH 3 88 2,536 44 475 - 3,145
OK 1,939 56 623 - 63 3 2,683
OR - 1 14 - 6 - 21
PA 169 68 3,745 19 211 - 4,212
RI 12 - 11 74 - - 96
SC 105 107 - - 932 41 1,185
SD 13 605 - 18 20 - 656
TN 1,308 - 29 - 955 - 2,293
TX 4 71 1,943 420 137 2 2,577
UT 4 449 - - 4 - 457
VA 85 118 1,988 10 82 - 2,283
VT 3 0 19 50 46 - 117
WA 1 1 1 - 20 - 23
WI 139 250 1,785 344 712 - 3,231
WV - - 560 4 364 - 929
WY 25 - - - - - 25
2012 Assessment of Demand Response and Advanced Metering Federal Energy Regulatory Commission 29
Pennsylvania -- Pennsylvania reported an increase in reported potential peak
reduction in 2012 to 4,212 MW, largely from increased demand response
participation in PJM’s forward capacity market through the Emergency Load
Response program.
Florida – Florida continues to have a large reported potential peak reduction, and
Florida’s demand response capability is provided primarily by utilities’ interruptible
load and direct load control programs.
Wisconsin – Wisconsin’s reported potential peak reduction is primarily from a
Midwest ISO program called “Load Modifying Resources.”
Three other states had large increases in reported potential peak reduction between the 2010
and 2012: Michigan, Tennessee, and Oklahoma. These increases were due primarily to the
demand response programs of Detroit Edison, the Tennessee Valley Authority, and
Oklahoma Gas and Electric, respectively.
Actual Peak Reduction
In addition to providing information on reported potential peak reductions, survey
respondents also provided information on actual (or realized) peak reductions that occurred
in 2011 from demand response programs.58
The actual peak reductions from demand
response resources for the 2010 and 2012 FERC Surveys are presented by region in Figure 3-
6 below. The 2012 FERC Survey respondents identified a total of 20,256 MW of actual peak
reductions from demand response resources, representing use of 31 percent of the total
reported potential peak reduction. This represents an increase from the 2010 Survey in actual
peak reductions from demand response.
Figure 3-7 compares the 2012 reported potential peak reduction to actual peak reduction by
region. While RFC reported the highest potential peak reduction, it reported using only 15
percent of this potential.59
Every other NERC region used at least 25 percent of its potential
demand response capability; NPCC realized 85 percent and TRE 90 percent of its reported
potential peak reduction.
Estimated Potential Peak Reduction by Region
The above values for reported potential peak reduction likely understate the total potential
peak reduction capability in the U.S. because not all those surveyed responded and for other
reasons. Therefore, staff took steps to estimate the potential peak reduction of non-
responding entities, using FERC Survey data and other sources of information, such as Form
EIA-861 data.60
The result is called the estimated potential peak reduction, in contrast to the
reported potential peak reduction presented above.
58 As a means of confirming the data, if the actual demand response peak reduction was larger than the reported
potential peak reduction, the reported potential peak reduction was set equal to the actual demand response peak
reduction. 59
The ratio in RFC was low because no actual peak reductions from demand response resources were reported by the
two of the largest programs in the RFC region – Detroit Edison’s commercial and industrial time-of-use
program and Commonwealth Edison’s commercial and industrial interruptible load program. The RFC actual-
to-potential ratio for the remaining programs reported was 45 percent. 60
The estimation methodology is described in Appendices D and H.

Federal Energy Regulatory Commission 2012 Assessment of Demand Response and Advanced Metering 30
Figure 3-6. Reported actual peak reduction by NERC region between 2010
and 2012 FERC Survey years
Figure 3-7. 2012 FERC Survey reported potential and actual peak reduction
by region
Figure 3-8 compares the estimated potential peak reduction by NERC region and customer
class between 2010 and 2012. Total estimated potential peak reduction is 71,654 MW, an
increase of almost 13,000 MW from 2010. RFC remained the region with highest estimate
of potential peak reduction, with a total of 25,356 MW in 2012, an increase of 8,025 MW
from the estimated 2010 potential peak reduction.
0
500
1,000
1,500
2,000
2,500
3,000
3,500
4,000
TRE FRCC MRO NPCC RFC SERC SPP WECC Other
Rep
ort
ed
Actu
al
Peak
Red
ucti
on
(M
Ws)
NERC Regions
2010 Actual peak Reduction 2012 Actual Peak Reduction

2012 Assessment of Demand Response and Advanced Metering Federal Energy Regulatory Commission 31
Figure 3-8. Estimated potential peak reduction by region and customer class
in 2010 and 2012
Figure 3-9 presents the estimated potential peak reduction by entity type and customer
class across the 2010 and 2012 surveys. Investor-owned utilities remained the entity type
with the largest estimated potential peak reduction, 27,476 MW in 2012. Commercial and
industrial customers accounted for 75 percent of the estimated potential peak reduction for
investor-owned utility demand response programs. ISO and RTO programs’ estimated
potential peak reduction increased by 20 percent to 25,489 MW in 2012.61
Federal and state
entities added an estimated 4,600 MW of estimated potential peak reduction between 2010
and 2012.
Plans for New Demand Response Programs
FERC Survey respondents were asked to “Provide your entity’s near- and long-term plans for
new demand response programs and time-based rates/tariffs.” Table 3-3 summarizes these
responses for three time periods. Direct load control programs were the dominant planned
program type, followed by time-of-use rates programs and interruptible programs for all
three time periods. The three main and roughly equal contributors to new demand response
planned for 2012 comes from direct load control, interruptible load, and load as a capacity
resource. For programs beginning in 2013 and 2014, 80 percent of the planned demand
response from new programs was reported to come from an interruptible program or load as
a capacity resource program.
61
The estimated potential peak reductions attributed to RTO/ISO programs were reduced according to the
methodology described in Appendix D to eliminate double-counting of retail demand response programs
enrolled in wholesale market programs.

Federal Energy Regulatory Commission 2012 Assessment of Demand Response and Advanced Metering 32
Figure 3-9. Estimated potential peak reduction by entity type and customer
class in 2010 and 2012
Table 3-3. Reported plans for new demand response programs and time-based
rates/tariffs
Participation in Demand Response Programs
This section discusses the reported participation of entities and customers in four specific
types of demand response program: Interruptible Load, Direct Load Control, Time-of-Use,
During Calendar Year 2012
During Calendar Years
2013 and 2014
During Calendar Years
2015 through 2017
Program Type
Number of
Programs
Potential Peak
Reduction (MW)
Number
of
Programs
Potential
Peak
Reduction
(MW)
Number
of
Programs
Potential
Peak
Reduction
(MW) Direct Load Control 489 4,579 38 884 18 291
Interruptible Load 20 5,842 15 9,696 6 211
Critical Peak Pricing with Controls 3 1 1 31 2 1
Load as Capacity Resource 9 5,906 5 9,837 - -
Spinning Reserves 3 370 4 747 2 350
Non-Spinning Reserves 4 281 4 667 2 185
Emergency Demand Response 9 1,243 8 1,658 - -
Regulation Service 2 60 1 75 - -
Demand Bidding and Buyback 4 - - - - -
Time-of-Use Pricing 40 373 27 24 18 7
Critical Peak Pricing 8 12 12 15 9 14
Real-Time Pricing 3 - 5 125 6 1
Peak Time Rebate 7 64 5 3 1 -
System Peak Response Transmission Tariff 1 5 - - 3 5
Other 7 222 6 691 2 101
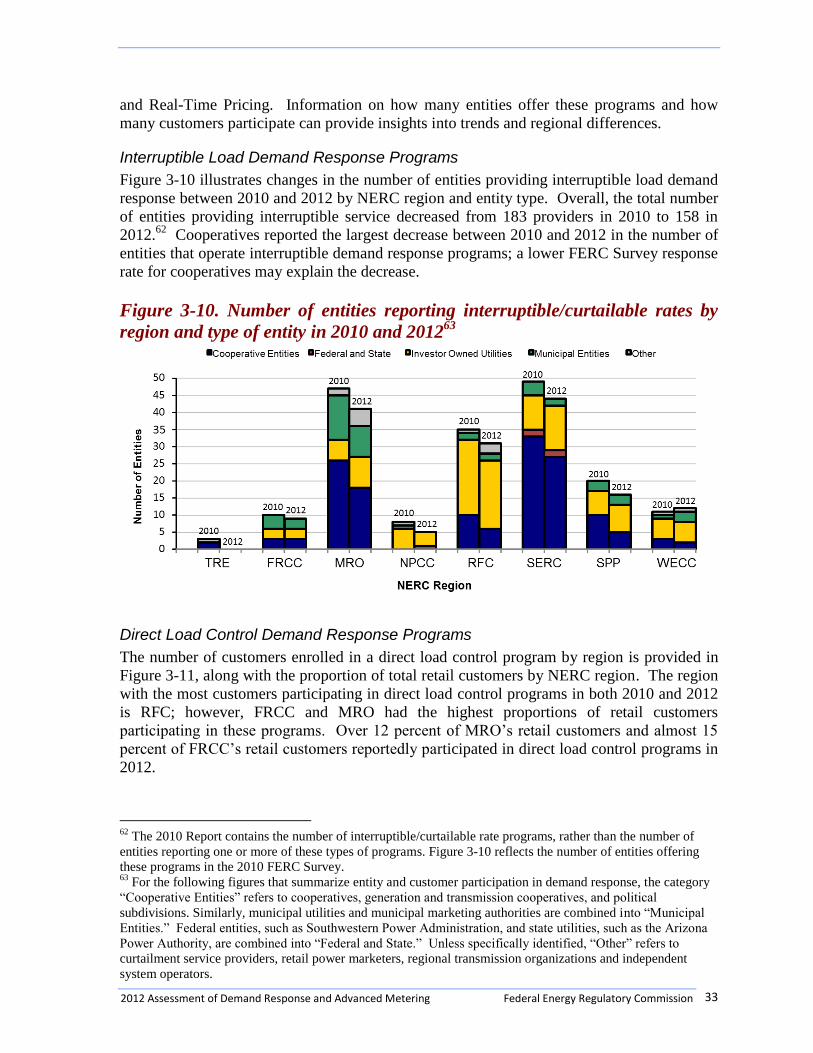
2012 Assessment of Demand Response and Advanced Metering Federal Energy Regulatory Commission 33
and Real-Time Pricing. Information on how many entities offer these programs and how
many customers participate can provide insights into trends and regional differences.
Interruptible Load Demand Response Programs
Figure 3-10 illustrates changes in the number of entities providing interruptible load demand
response between 2010 and 2012 by NERC region and entity type. Overall, the total number
of entities providing interruptible service decreased from 183 providers in 2010 to 158 in
2012.62
Cooperatives reported the largest decrease between 2010 and 2012 in the number of
entities that operate interruptible demand response programs; a lower FERC Survey response
rate for cooperatives may explain the decrease.
Figure 3-10. Number of entities reporting interruptible/curtailable rates by
region and type of entity in 2010 and 201263
Direct Load Control Demand Response Programs
The number of customers enrolled in a direct load control program by region is provided in
Figure 3-11, along with the proportion of total retail customers by NERC region. The region
with the most customers participating in direct load control programs in both 2010 and 2012
is RFC; however, FRCC and MRO had the highest proportions of retail customers
participating in these programs. Over 12 percent of MRO’s retail customers and almost 15
percent of FRCC’s retail customers reportedly participated in direct load control programs in
2012.
62
The 2010 Report contains the number of interruptible/curtailable rate programs, rather than the number of
entities reporting one or more of these types of programs. Figure 3-10 reflects the number of entities offering
these programs in the 2010 FERC Survey. 63
For the following figures that summarize entity and customer participation in demand response, the category
“Cooperative Entities” refers to cooperatives, generation and transmission cooperatives, and political
subdivisions. Similarly, municipal utilities and municipal marketing authorities are combined into “Municipal
Entities.” Federal entities, such as Southwestern Power Administration, and state utilities, such as the Arizona
Power Authority, are combined into “Federal and State.” Unless specifically identified, “Other” refers to
curtailment service providers, retail power marketers, regional transmission organizations and independent
system operators.
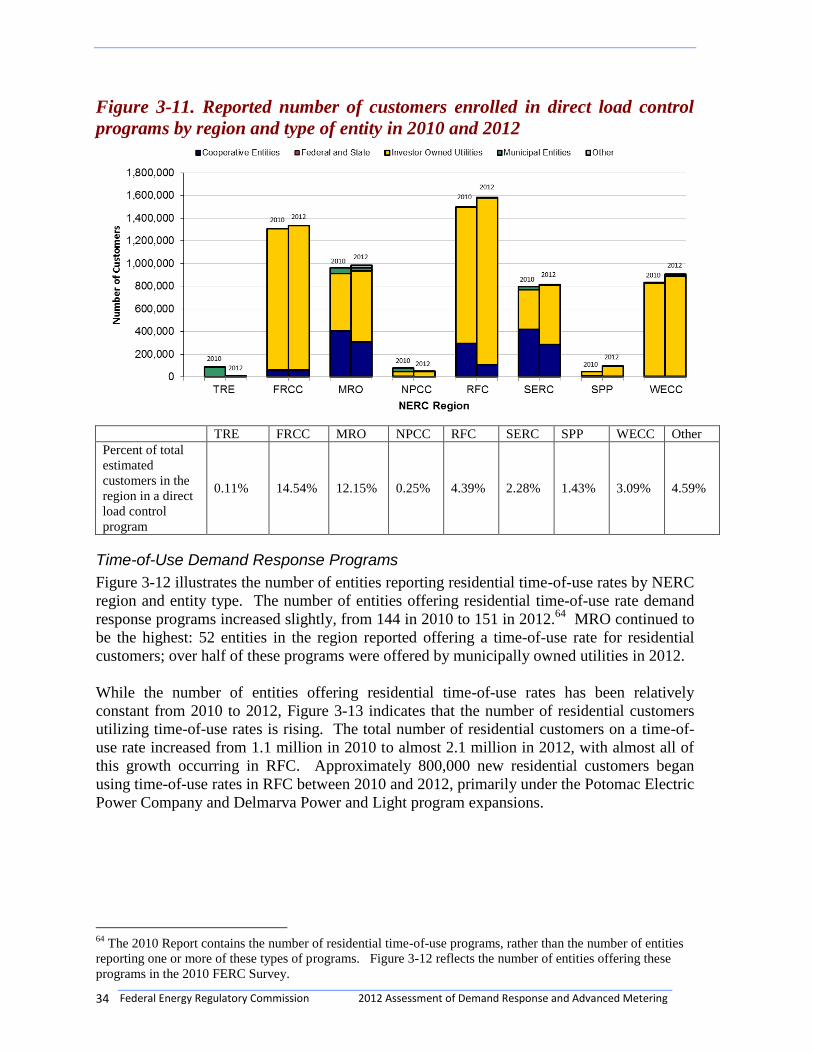
Federal Energy Regulatory Commission 2012 Assessment of Demand Response and Advanced Metering 34
Figure 3-11. Reported number of customers enrolled in direct load control
programs by region and type of entity in 2010 and 2012
TRE FRCC MRO NPCC RFC SERC SPP WECC Other
Percent of total
estimated
customers in the
region in a direct
load control
program
0.11% 14.54% 12.15% 0.25% 4.39% 2.28% 1.43% 3.09% 4.59%
Time-of-Use Demand Response Programs
Figure 3-12 illustrates the number of entities reporting residential time-of-use rates by NERC
region and entity type. The number of entities offering residential time-of-use rate demand
response programs increased slightly, from 144 in 2010 to 151 in 2012.64
MRO continued to
be the highest: 52 entities in the region reported offering a time-of-use rate for residential
customers; over half of these programs were offered by municipally owned utilities in 2012.
While the number of entities offering residential time-of-use rates has been relatively
constant from 2010 to 2012, Figure 3-13 indicates that the number of residential customers
utilizing time-of-use rates is rising. The total number of residential customers on a time-of-
use rate increased from 1.1 million in 2010 to almost 2.1 million in 2012, with almost all of
this growth occurring in RFC. Approximately 800,000 new residential customers began
using time-of-use rates in RFC between 2010 and 2012, primarily under the Potomac Electric
Power Company and Delmarva Power and Light program expansions.
64
The 2010 Report contains the number of residential time-of-use programs, rather than the number of entities
reporting one or more of these types of programs. Figure 3-12 reflects the number of entities offering these
programs in the 2010 FERC Survey.

2012 Assessment of Demand Response and Advanced Metering Federal Energy Regulatory Commission 35
Figure 3-12. Number of entities reporting residential time-of-use rates by
region and type of entity in 2010 and 2012
Figure 3-13. Reported number of residential customers enrolled in time-of-
use rates by region and entity type in 2010 and 2012
The large increase in time-of-use participation in the RFC region illustrates a shift from
previous FERC Survey trends. In previous years, WECC was the dominant time-of-use
demand response region; however, residential time-of-use program customers in WECC
increased only slightly between the two survey years, to just over 775,000 customers (about
2.7 percent of all WECC customers).
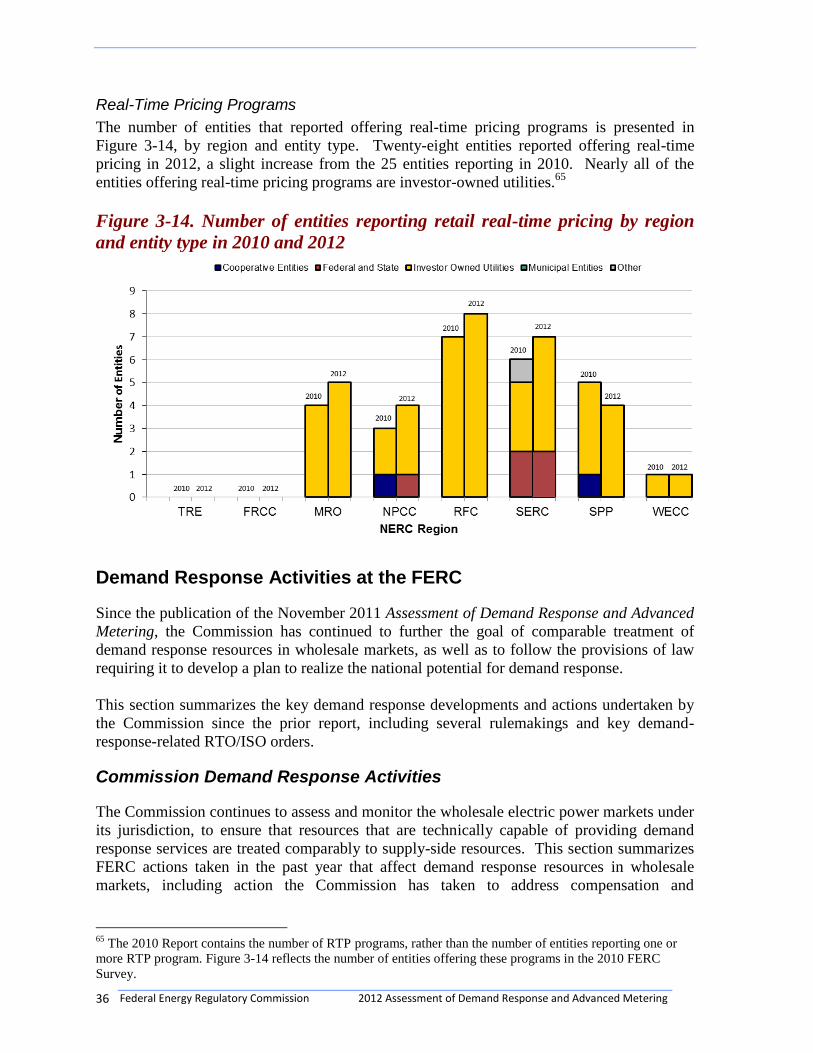
Federal Energy Regulatory Commission 2012 Assessment of Demand Response and Advanced Metering 36
Real-Time Pricing Programs
The number of entities that reported offering real-time pricing programs is presented in
Figure 3-14, by region and entity type. Twenty-eight entities reported offering real-time
pricing in 2012, a slight increase from the 25 entities reporting in 2010. Nearly all of the
entities offering real-time pricing programs are investor-owned utilities.65
Figure 3-14. Number of entities reporting retail real-time pricing by region
and entity type in 2010 and 2012
Demand Response Activities at the FERC
Since the publication of the November 2011 Assessment of Demand Response and Advanced
Metering, the Commission has continued to further the goal of comparable treatment of
demand response resources in wholesale markets, as well as to follow the provisions of law
requiring it to develop a plan to realize the national potential for demand response.
This section summarizes the key demand response developments and actions undertaken by
the Commission since the prior report, including several rulemakings and key demand-
response-related RTO/ISO orders.
Commission Demand Response Activities
The Commission continues to assess and monitor the wholesale electric power markets under
its jurisdiction, to ensure that resources that are technically capable of providing demand
response services are treated comparably to supply-side resources. This section summarizes
FERC actions taken in the past year that affect demand response resources in wholesale
markets, including action the Commission has taken to address compensation and
65
The 2010 Report contains the number of RTP programs, rather than the number of entities reporting one or
more RTP program. Figure 3-14 reflects the number of entities offering these programs in the 2010 FERC
Survey.

2012 Assessment of Demand Response and Advanced Metering Federal Energy Regulatory Commission 37
measurement and verification as well as Commission actions in response to RTO and ISO
proposals related to demand response.
Commission Rulemakings on Demand Response Issues
NAESB Wholesale Demand Response Measurement and Verification NOPR
In April 2012, the Commission issued a Notice of Proposed Rulemaking (NOPR) to amend
its regulations to incorporate by reference NAESB’s business practice standards on the
measurement and verification of demand response and energy efficiency resources that
participate in organized wholesale electricity markets. The proposed demand response
measurement and verification standards would add specificity to existing standards in several
areas, including meter data reporting, advanced notification, telemetry, and meter accuracy.
The Commission requested comments on whether the proposed demand response
measurement and verification standards are sufficiently detailed to provide transparent
measurement and verification across regions, and whether greater detail or conformity across
regions would be appropriate. By contrast, the proposed energy efficiency measurement and
verification standards would provide more substantial detail than the demand response
standards to ensure effective evaluation of the performance of energy efficiency products and
services. The proposed wholesale energy efficiency standards include four measurement and
verification methodologies, as well as a mechanism for resource providers to propose, and
organized markets to consider, alternative approaches.66
Comments on the NOPR were
received on July 30, 2012 and the Commission is evaluating those comments.
Order No. 745 Compliance Orders
Order No 745,67
issued in March 2011, requires that RTOs and ISOs pay demand response
resources participating in the day-ahead and real-time wholesale energy markets the
locational marginal price (LMP) when two conditions are met: demand response resource are
capable of balancing supply and demand in the wholesale energy markets, and dispatching
and paying LMP to demand response resources is cost-effective as determined by a net
benefits test. All six ISOs and RTOs, have made filings to comply with Order No. 745.
Commission orders approving the compliance filings of PJM, ISO-New England (ISO-NE),
and the Midwest ISO are discussed below. Commission proceedings on the compliance
filings for the California ISO (CAISO), New York ISO (NYISO), and SPP remain open at
the time of this writing.
PJM Order No. 745 Compliance (Docket No. ER11-4106)
PJM submitted its Order No. 745 compliance filing in July 2011. In its compliance filing,
PJM proposed to revise its existing compensation methods for participants in PJM’s
Economic Load Response programs from LMP less applicable avoided generation and
transmission charges in all hours to LMP in hours when a net benefits test is passed. PJM
also proposed changes to (1) rules governing self-scheduling, (2) the customer baseline load
methodology used to measure demand reductions in the energy and ancillary services
66
Standards for Business Practices and Communication Protocols for Public Utilities, 139 FERC ¶ 61,041
(2012). 67
Demand Response Compensation in Organized Wholesale Energy Markets, Order No. 745, 76 FR 16,658
(Mar. 24, 2011), FERC Stats. & Regs. ¶ 31,322 (2011) (Order No. 745), order on reh’g, 137 FERC ¶ 61,215
(2011).

Federal Energy Regulatory Commission 2012 Assessment of Demand Response and Advanced Metering 38
markets, and (3) how the costs for demand response are allocated. On December 15, 2011,
the Commission accepted PJM’s filing, subject to an additional compliance filing.68
The
Commission found that PJM’s proposed tariff revisions went beyond what was required to
comply with Order No. 745, which applies only if a demand response resource has the
capability to balance supply and demand and if dispatch of the demand response resource is
cost-effective as determined by a net benefits test. PJM submitted another compliance filing
in March 2012 in response to the December order, which was accepted by the Commission in
June 2012.69
ISO-New England Order No. 745 Compliance (Docket No. ER11-4336)
ISO-NE submitted its Order No. 745 compliance filing and proposed tariff revisions in
August 2011. As part of its compliance filing, ISO-NE proposed (1) a net benefits test that
established a threshold price for submitting demand response bids, (2) adjustments to its
current baseline calculation methodology for measuring demand reductions, and (3)
allocating costs hourly in proportion to the ISO-NE Real-Time Load Obligation70
on a
system-wide basis. ISO-NE proposed implementing these changes in two stages that would
fully integrate demand response resources into its energy market by June 2016. The
Commission accepted ISO-NE’s Order No. 745 compliance filing in January 2012,71
subject
to a further compliance filing. ISO-NE submitted this second compliance filing in March
2012, which was accepted by the Commission in May 2012.72
Midwest ISO Order No. 745 Compliance (Docket Nos. ER12-1266 and ER11-4337)
The Midwest ISO submitted its Order No. 745 compliance filing in August 2011. It
proposed to establish a monthly Net Benefits Price Threshold. The Midwest ISO also
proposed to pay the applicable LMP to cost-effective demand response resources that clear
either the day-ahead or real-time energy market. Additionally, the Midwest ISO proposed to
allocate the costs associated with compensating demand resources in the real-time energy
market to market participants located within the reserve zone of demand response resources
that either purchase energy and benefit from reduced LMPs or serve load and avoid selling
energy to retail customers at a loss. The Midwest ISO proposed to allocate any remaining
costs to all load-serving entities systemwide on a pro rata load ratio share basis. The
Commission accepted this compliance filing in part and rejected it in part in December
2011.73
The Midwest ISO submitted its second Order No. 745 compliance filing in March
2012; d the Commission accepted the Midwest ISO’s Order No. 745 compliance filing in
July 2012.74
Order No. 719 Compliance Orders
The Commission issued Order No. 719 in October 2008 to improve the operation of
organized wholesale electric power markets in several areas: (1) demand response, including
68
PJM Interconnection, L.L.C., 137 FERC ¶ 61,216 (2011). 69
PJM Interconnection, L.L.C., 139 FERC ¶ 61,256 (2012). 70
Real-Time Load Obligation refers to the total load serving entities’ MWh load obligation of market
participants at each location during a given hour of operation. See ISO-NE Tariff, section III.3.2.1(b)(i). 71
ISO New England Inc., 138 FERC ¶ 61,042 (2012). 72
ISO New England Inc., Docket No. ER11-4336-005 (May 29, 2012) (delegated letter order) 73
Midwest Indep. Transmission Sys. Operator, Inc., 137 FERC ¶ 61,212 (2011) (Order No. 745 Compliance
Order). 74
Midwest ISO. 140 FERC 61,059 (2012).
2012 Assessment of Demand Response and Advanced Metering Federal Energy Regulatory Commission 39
pricing during periods of operating reserve shortage; (2) long-term power contracting; (3)
market-monitoring policies; and (4) the responsiveness of RTOs and ISOs to their customers
and other stakeholders.75
Several compliance filings associated with Order No. 719
implementation were submitted and approved in 2012, and details on PJM and Midwest
ISO’s filings are provided below.
PJM Order No. 719 Compliance—Scarcity Pricing (Docket No. ER09-1063-004)
PJM submitted an Order No. 71976
compliance filing and proposed tariff changes addressing
shortage pricing requirements in June 2010, and the Commission accepted the changes in
April 2012.77
PJM proposed numerous tariff changes, including changes to PJM’s demand
response programs, based on its analysis that PJM’s existing shortage pricing provisions fail
to satisfy the shortage pricing requirements of Order No. 719. The Commission accepted
PJM’s tariff revisions and found that PJM’s proposed pricing reforms would encourage
existing demand response and generation resources to continue to provide supplies during
shortage conditions, because these resources will be eligible to receive the prevailing energy
and reserve market clearing price. In addition, the Commission found that PJM’s proposal
would (1) increase the accuracy of market clearing prices during shortage conditions, (2)
minimize the need for out-of-market payments, and (3) provide clearer price signals to both
demand response and generation resources.78
Midwest ISO Order No. 719 Compliance (Docket Nos. ER12-1265 and ER09-1049)
The Midwest ISO submitted its initial Order No. 719 compliance filing in April 2009. In this
filing, MISO stated that its existing market design satisfied the requirements of Order No.
719 regarding both (1) the participation of demand response resources in ancillary services
markets,79
and (2) price formation during periods of operating reserve shortages.80
The
Midwest ISO submitted an additional filing in October 2009 that proposed tariff revisions to
allow the participation of aggregators of retail customers (ARCs) in Midwest ISO’s markets.
The Commission accepted both Midwest ISO compliance filings in December 2011, subject
to a further compliance filing. The Midwest ISO submitted its final Order No. 719
compliance filing in March 2012,81
proposing tariff revisions regarding the provision of
ancillary services by demand response resources, including measurement and verification
protocols82
and tariff revisions regarding the registration, information sharing, credit, and
75
Wholesale Competition in Regions with Organized Electric Markets, Order No. 719, FERC Stats. & Regs. 
31,281 (2008) (Order No. 719), order on reh’g, Order No. 719-A, FERC Stats. & Regs. ¶ 31,292 (2009), order
on reh’g, Order No. 719-B, 129 FERC ¶ 61,252 (2009). 76
Wholesale Competition in Regions with Organized Electric Markets, Order No. 719, 73 Fed. Reg. 64,100
(Oct. 28, 2008), FERC Stats. & Regs. ¶ 31,281, at P 165, et seq. (2008), order on reh’g, Order No. 719-A,
FERC Stats. & Reg. ¶ 31,292 (2009), FERC Stats. & Regs. ¶ 31,292 (2009), order on reh’g, Order No. 719-B,
129 FERC ¶ 61,252 (2009). 77
PJM Interconnection L.L.C., 139 FERC ¶ 61,057 (2012). 78
PJM Interconnection, L.L.C., 139 FERC ¶ 61,057 (2012). 79
MISO April 2009 Compliance Filing, Transmittal Letter at 6-9, 11-12. 80
Id. at 20-25. 81
MISO March 14, 2012 Compliance Filing, Docket No. ER12-1265-000 (March 2012 Compliance Filing);
MISO March 23, 2012 Amended Compliance Filing, Docket No. ER12-1265-001 (March 2012 Amended
Filing). 82
MISO March 2012 Compliance Filing, Transmittal Letter at 2-6.
Federal Energy Regulatory Commission 2012 Assessment of Demand Response and Advanced Metering 40
other requirements for ARCs. The Midwest ISO proposed to compensate ARCs at the
LMP.83
The Commission accepted these proposed changes in July 2012.
Other Commission Demand Response Orders
In addition to rulemakings, the Commission also approved several revisions to RTO/ISO
tariffs related to demand response resources in regional organized wholesale markets. The
follow briefly describes these revisions and Commission actions.
California ISO Flexible Ramping Constraint (Docket No. ER12-50)
The CAISO proposed tariff changes to implement a flexible ramping constraint in October
2011 so as to provide CAISO with sufficient ramping capability to match real-time supply
with real-time demand. The CAISO plans to procure this flexible ramping capability from
committed, flexible generation resources, proxy demand resources, and participating load
resources. The Commission accepted and suspended the proposed tariff changes in
December 2011 to establish hearing and settlement judge procedures.84
CAISO is continuing
to work on developing a new flexible ramping product.
California ISO Regulation Energy Management (Docket No. ER11-4353)
In August 2011, CAISO submitted proposed revisions to its tariff to implement regulation
energy management. Regulation energy management allows energy storage resources or
demand response to provide regulation service. Under the proposal, scheduling coordinators
for non-generator resources within CAISO’s balancing authority area may choose to use
regulation energy management if they require regulation resources. The Commission
accepted CAISO’s proposal in November 2011.85
Midwest ISO’s Extended Locational Marginal Price Algorithm (Docket No. ER12-668)
The Midwest ISO filed proposed revisions to its tariff in December 2011 to improve the
accuracy of pricing in its energy and operating reserve markets by allowing more resources,
including emergency demand resources, to set the LMP in the day-ahead and real-time
energy markets as well as the market clearing price in the day-ahead and real-time operating
reserve markets. The Commission accepted Midwest ISO’s proposal in July 2012, subject to
further compliance filings.86
PJM Price Responsive Demand (Docket No. ER11-4628)
PJM filed proposed tariff changes in September 2011 to support the development of price
responsive demand, an initiative for end-use customers to vary their load in response to
wholesale electricity prices. PJM proposed to incorporate this demand responsiveness by
allowing load serving entities (and other market participants), with the approval of their
relevant regulatory authorities, to commit to reducing loads to specified levels when prices
rise during emergency conditions. The mechanism is designed to allow the installed capacity
requirement of load serving entities to be reduced to reflect the lowered need for peaking
83
Id. at 7-16. 84
California Independent System Operator Corporation, 137 FERC ¶ 61,191 (2011). 85
California Independent System Operator Corporation, 137 FERC ¶ 61,165 (2011). 86
Midwest ISO., 140 FERC ¶ 61,067 (2012).
2012 Assessment of Demand Response and Advanced Metering Federal Energy Regulatory Commission 41
capacity due to price responsive demand commitments. Following a staff technical
conference on this proposal, the Commission accepted PJM’s filing effective May 15, 2012,
subject to further compliance.87
PJM Targeted Sub-Zonal Dispatch (Docket No. ER12-1372)
PJM filed tariff revisions in March 2012 to support sub-zonal dispatch, and recognize the
expanded selection of demand resource products. Sub-zonal dispatch would allow PJM to
dispatch a targeted set of demand response resources to address localized emergency events,
rather than calling on the full set of demand resources available within a zone. To implement
sub-zonal dispatch, PJM also proposed requiring demand response providers to have the
capability to receive electronic dispatch signals from PJM. PJM proposed that responses to
sub-zonal dispatch be voluntary at first, with no penalty for non-performance. After a two-
year transition period, PJM proposed assessing compliance charges for inadequate response
to sub-zonal dispatch only if the sub-zone is defined and posted the day before the Load
Management event. The Commission accepted PJM’s proposed tariff revisions, which were
effective June 1, 2012.88
PJM Regulation-Only CSPs (Docket No. ER12-1430)
PJM filed proposed tariff changes in April 2012 to expand the opportunity for demand
response providers and end-use customers to participate in PJM’s frequency regulation
market. PJM’s proposed changes would create an “Economic Load Response Regulation
Only Registration” to (1) simplify the aggregation process for regulation-only resources; (2)
allow two different demand response providers in the PJM Economic Load Response
Program to provide demand response services to the same end-use customer, where one
demand response provider provides regulation service; and (3) allow equipment-specific load
data, rather than load data for an entire facility, to be submitted to verify that the regulation
service that cleared the market was actually provided. The Commission accepted these tariff
revisions in June 2012.89
PJM M&V Changes (Docket No. ER11-3322)
PJM filed proposed changes to its tariff in April 2011 to clarify how the performance of
demand response capacity resources is measured during emergency dispatch and
performance verification testing. PJM stated that its current rules allowed curtailment
service providers to offset some customers’ underperformance with the “excess”
performance of other end-use customers in its portfolio, and argued that this type of
aggregation gives the appearance of a greater supply of capacity. PJM proposed to modify
the reference point of capacity demand response load reductions so that each end-use
customer’s actual load reduction results in a metered load that is less than the customer’s
peak demand (i.e., the peak contribution identified by PJM). After a technical conference on
the subject, the Commission accepted PJM’s proposal in November 2011 requiring PJM to
submit a compliance filing to modify and clarify its proposal.90
87
PJM Interconnection L.L.C., 139 FERC ¶ 61,115 (2012). 88
PJM Interconnection L.L.C., 139 FERC ¶ 61,165 (2012). 89
PJM Interconnection L.L.C., 139 FERC ¶ 61,172 (2012). 90
PJM Interconnection L.L.C., 137 FERC ¶ 61,108 (2011).

Federal Energy Regulatory Commission 2012 Assessment of Demand Response and Advanced Metering 42
Other Demand Response Developments and Issues
In addition to FERC rulemakings and RTO/ISO demand response initiatives, several
noteworthy developments and activities occurred within and outside government. The
following summarizes (1) the National Forum on the National Action Plan on Demand
Response, (2) ARRA-funded consumer behavior studies, (3) the NERC DADS program, (4)
demand response events during the summer of 2012, and (5) selected state activities.
National Forum on the National Action Plan on Demand Response
Over the past year, the U.S. Department of Energy, with support from Commission staff,
conducted a National Forum on the National Action Plan on Demand Response.91
Working
groups comprised of national demand response experts and practitioners are preparing
reports that identified knowledge and research gaps in four areas (cost-effectiveness,
measurement and verification, program design and delivery, and modeling and tools) and the
actions needed to help implement the action items included in the National Action Plan on
Demand Response.
U.S. Department of Energy-Sponsored Consumer Behavior Studies
The ARRA includes funding and support for nine utility-sponsored consumer behavior
studies as part of ARRA’s SGIG program. The SGIG studies are designed to assess
customer acceptance and adoption of time-based electricity rates and enabling technologies,
such as advanced metering.92
The studies, carried out in nine states and varying in size from
500 to 60,000 participants, assess consumer usage of a variety of technologies, such as web
portals, in-home displays, and programmable communicating thermostats. The SGIG studies
also examine several rate structures, from simple time-of-use rates, to more complex critical
peak pricing plans, with some combinations offered on either an opt-in or opt-out basis. The
consumer behavior studies began in 2010 and are scheduled to end in 2014. SGIG recipients
are required to publish mid-term and final reports on the findings of their studies. As of July
2012, mid-term reports from Marblehead Municipal Light Department and Oklahoma Gas
and Electric (OG&E) were published, along with a final SGIG consumer behavior report
from OG&E. OG&E’s final SmartStudy Together report suggests that customers are open to
the program’s new technology and time-based pricing schedules, especially programmable
communicating thermostats and variable peak pricing with a critical peak component. Final
results from the remaining SGIG consumer behavior studies are expected between 2012 and
2014.
91
For more information on the National Action Plan on Demand Response, see National Action Plan on
Demand Response, Federal Energy Regulatory Commission, June 2010;
http://www.ferc.gov/industries/electric/indus-act/demand-response/dr-potential.asp, and FERC and DOE Staff,
Implementation Proposal for the National Action Plan, July 2011, available at http://www.ferc.gov/legal/staff-
reports/07-11-dr-action-plan.pdf. 92
Smart Grid Investment Grant Program, Project Information: Consumer Behavior Studies, Information
available at http://www.smartgrid.gov/recovery_act/project_information?keys=&project%5B%5D=15.
2012 Assessment of Demand Response and Advanced Metering Federal Energy Regulatory Commission 43
NERC Demand Response Data Collection
NERC developed a regular data reporting system for demand response resources to measure
their contribution to reliability more precisely. NERC’s Demand Response Availability Data
System (DADS) collects and analyzes semiannual data from several categories of industry
participants,93
and reporting entities are required to submit information for a specified
reporting period about (1) individual demand response programs, and (2) each event for
which demand response was deployed for reliability purposes.
NERC is implementing DADS in four distinct phases:
Phase I was completed in 2010 and served as a pilot stage for establishing the
mechanism of data collection and metrics for data analysis. It featured information
on reliability-based programs that are dispatchable and controllable.
Phase II (the current phase of the DADS program) is mandatory94
for programs that
have been in service for one year or longer and have 10 MW or more of enrolled
resources.
Phase III is expected to begin in the summer of 2013 and will add voluntary reporting
of non-controllable economic demand response programs such as time-of-use rates
and critical peak pricing.
Phase IV will require reporting of all demand response resources. It is projected to
begin in 2014.
The first results of the DADS program were published in NERC’s 2012 State of Reliability
Report. 95
The report featured Phase II DADS data collected over the summer 2011 reporting
period (April 1 – September 30, 2011). From data reported by 133 entities, NERC estimates
an average of 53,005 MW of reliability demand response capacity throughout all the NERC
regions of the United States and Canada.96
NERC also reports there were 664 demand
response events called during the summer 2011 reporting period, with an average sustained
response period of 2 hours and 51 minutes.
The NERC State of Reliability Report also summarized DADS data by NERC region and
program type. The ReliabilityFirst Corporation (RFC) region had the largest demand
response capacity, with 24,386 MW registered. NERC also reported that the Interruptible
Load and Direct Load Control were the most prevalent program types, accounting for 32
percent and 26 percent of all programs respectively.
93
Responsible Entities include: Balancing Authorities, Distribution Providers, Load-Serving Entities, and
Purchasing-Selling Entities that are Registered NERC Entities. See the NERC Reliability Functional Model for
more detail, available at http://www.nerc.com/page.php?cid=2%7C247%7C108. 94
DADS data reporting is mandatory for all entities on the NERC Compliance Registry, through Section 1600
data requests. See http://www.nerc.com/files/DADS%20Quick%20Facts.pdf for more information. See also
https://www.midwestiso.org/Library/Repository/Meeting%20Material/Stakeholder/DRWG/2011/20111003/201
11003%20DRWG%20Item%2005%20DADS%20September%20Training%20Presentation.pdf for a discussion
of NERC’s authority under 18 C.F.R. Section 39.2(d). 95
North American Electric Reliability Corporation, 2012 State of Reliability Report, May 2012, available at
http://www.nerc.com/files/2012_SOR.pdf. 96
The Western Electricity Coordinating Council, the Midwest Reliability Organization, and the Northeast
Power Coordinating Council cover areas of the U.S. and Canada.

Federal Energy Regulatory Commission 2012 Assessment of Demand Response and Advanced Metering 44
Summer 2012 Demand Response Deployments
This section provides a brief overview of major summer 2012 demand response deployments
by region, along with links to additional data on summer 2012 demand response events.
According to the National Oceanic Atmospheric Administration (NOAA), summer 2012 was
one of the hottest summers on record for the U.S.97
Above-average temperatures drove high
peak electricity loads and large deployments of demand response resources across the
country.
PJM reported several large deployments of demand response resources in June and July
2012. It estimated 17,148 MW in reductions from its economic demand response program
over the month of June,98
and PJM also issued hot weather alerts for June 20-21 instructing
generators and transmission owners to defer unnecessary maintenance on plants and power
lines.99
In July, PJM reported large demand response deployments from July 2-8 and July
16-18. PJM deployed economic demand response resources from July 2-8; however, no
emergency demand response was dispatched over this one-week period.100
PJM again
utilized economic demand response resources on July 16, and a mix of economic and
emergency demand response resources from July 17-18. In the largest deployment on July
18, PJM estimates that over 2,500 MW of economic and emergency demand response
resources was deployed.101
The largest overall economic demand response responses in PJM
primarily came from Virginia, Pennsylvania, and New Jersey in June-July 2012.102
PJM did
not report any large demand response deployments during August.
New York ISO (NYISO) called upon demand response resources in June and July 2012.
NYISO called upon reliability demand response resources several times during June 20-
22.103
The New York Power Authority (NYPA) also deployed demand resources
participating in its Peak Reduction program for the first time on June 20, reducing hourly
peak loads in New York City up to 30 MW.104
In July, NYISO utilized reliability demand
response resources on July 18, and a mix of economic and reliability demand response
97
State of the Climate Report, July 2012, available at http://www.ncdc.noaa.gov/sotc/. 98
Load Response Activity Report, August 2012, available at http://pjm.com/markets-and-operations/demand-
response/~/media/markets-ops/dsr/2012-dsr-activity-report-20120810.ashx. 99
Energy Assurance Daily, June 20, 2012, available at http://www.oe.netl.doe.gov/docs/eads/ead062012.pdf. 100
PJM Estimated Demand Response Activity July 2 – 8, 2012 Report, available at http://pjm.com/markets-and-
operations/demand-response/~/media/markets-ops/demand-response/pjm-hot-days-report-for-july-2-july-8-
2012.ashx. 101
PJM Estimated Demand Response Activity July 16 – 18, 2012 Report, available at http://pjm.com/markets-
and-operations/demand-response/~/media/markets-ops/demand-response/pjm-hot-days-report-july-16-18-
2012.ashx. 102
Load Response Activity Report, August 2012, available at http://pjm.com/markets-and-operations/demand-
response/~/media/markets-ops/dsr/2012-dsr-activity-report-20120810.ashx. 103
NYISO-Called Events & Tests, August 2, 2012, available at
http://www.nyiso.com/public/webdocs/products/demand_response/general_info/Historic_EDRP_and_SCR_Act
ivation_Information.pdf. 104
NYPA press release, June 20, 2012, available at
http://www.nypa.gov/NYPAPressCenter/PressRelease/News/Hot%20Weather%20Leads%20to%20NYPAs%20
Activation%20of%20Demand%20Response%20Program%20to%20Lower%20Electricity%20Use%20in%20N
YC.html.

2012 Assessment of Demand Response and Advanced Metering Federal Energy Regulatory Commission 45
resources on July 17.105
NYISO did not report any large demand response deployments
during August.
In contrast to the Mid-Atlantic region, operators in the Midwest and New England primarily
met summer heat wave loads through non-demand resources. For example, the Midwest ISO
declared an emergency event on July 17 (which gave the Midwest ISO the option to utilize
emergency demand response resources), but wind generation unexpectedly increased by
about 200 MW shortly afterwards. As a result of this increase in supply, combined with
changing weather conditions and voluntary conservation efforts, the Midwest ISO did not
have to turn to emergency demand response resources.106
ISO New England also did not
report calling on demand response resources from June to August 2012, although the ISO
called upon Real-Time Price Response Loads several times in late May.107
While the California ISO (CAISO) did not have any demand response deployments during
summer 2012, the ISO did issue several Flex Alerts in August 2012. Flex Alert is a CAISO
program that encourages California consumers to voluntarily conserve electricity and shift
demand to off-peak hours when the ISO issues an alert. CAISO reports that its Flex Alert
program led to significant voluntary reductions. For example, CAISO estimates that a Flex
Alert issued on August 10 resulted in nearly 1,000 MW in load reductions. PG&E, one of
the three large investor-owned utilities in California, estimates that over half of these
reductions came from PG&E’s voluntary demand response programs.108
Selected State Activities
State-regulated demand response activities over the past year have primarily focused on
evaluating applications for large-scale rollouts of new time-based electricity pricing
programs. States such as Arizona, California, and Maryland, as well as Arkansas, Oklahoma,
Illinois, Idaho, Colorado, and Connecticut, have examined the issue of time-based rates, and
many customers in these states are having their first experiences with these time-varying
rates. The following section details developments in program rollouts in these nine states,
and provides a spotlight on retail demand response programs in Texas.
Time-Based Pricing
Time-based pricing programs provide customers with economic incentives to shift
consumption away from periods of increased demand,109
giving an opportunity to save
energy expenditures. In addition, shifts in consumption may reduce the need to construct
105
NYISO-Called Events & Tests, August 2, 2012, available at
http://www.nyiso.com/public/webdocs/products/demand_response/general_info/Historic_EDRP_and_SCR_Act
ivation_Information.pdf. 106
Summer Heat Wave, MISO Market Subcommittee Presentation, August 7, 2012, available at
https://www.midwestiso.org/Library/Repository/Meeting%20Material/Stakeholder/MSC/2012/20120807/20120
807%20MSC%20Item%2002b%202012%20Summer%20Heat%20Wave.pdf. 107
See http://www.iso-
ne.com/calendar/month.action?date=20120501&cats=18,19,20&type=2&link=yes&filter=off 108
PG&E press release, available at http://www.pgecurrents.com/2012/08/17/pge-customers-heed-the-call-to-
conserve/. 109
Incentives include actual incurred electricity prices, a pre-specified incentive payment, or the customer’s
response to an emergency alert.
Federal Energy Regulatory Commission 2012 Assessment of Demand Response and Advanced Metering 46
new power plants to meet increasing peak demand periods. Time-based pricing programs
include a range of rate structures, such as critical peak pricing, critical peak rebates, real-time
pricing, and variable peak pricing. A number of states and utilities took actions to implement
time-based pricing programs in the past year. The Energy Information Administration (EIA)
reports that twenty-nine states have adopted time-based pricing requirements, have
requirements pending, or are studying these rate structures.110
In Arizona, an estimated one-third of the residential customers of Arizona Public Service and
Salt River Project have voluntarily chosen to participate in one of their utility’s time-of-use
programs.111
Both Arizona Public Service and Salt River Project offer web portals with user-
friendly language to assist customers in making rate decisions, and offer features that allow
residential customers to compare their rate options so that interested customers may choose
the most cost-efficient rate program.112
Arizona Public Service provides graphical
comparisons of amounts paid under each available rate,113
and Salt River Project provides
customers with a web-based interactive tool that asks a series of questions so customers can
choose a plan that fits their lifestyles.114
California is another state facilitating customer participation in dynamic pricing programs: all
three investor-owned utilities in California plan to offer a dynamic pricing option to all
customers by the end of 2012.115
The California investor-owned utilities have had default
time-of-use and critical peak pricing rates for their large commercial and industrial customers
for several years, and while a law referred to as Senate Bill 645 currently prevents defaulting
residential customers to these rates, efforts are being made to expedite the transition of
residential customers to dynamic pricing plans “subject to resolution of pending proceedings
and legal resolution of SB 695 provisions.”116
The California Public Utilities Commission
110
EIA, Table 3 Existing or Pending Legislative or Regulatory Activity for Demand Response, available at
http://www.eia.gov/analysis/studies/electricity/pdf/smartggrid.pdf. 111
King, Chris, “Why energy consumers love VOLUNTARY dynamic pricing,” eMeter: Smart Grid Watch,
March 18, 2011, available at http://www.emeter.com/smart-grid-watch/2011/why-energy-consumers-love-
voluntary-dynamic-pricing/. 112
See: APS, Residential Rate Comparison, available at
https://www.aps.com/main/services/demos/RateComparisonAudio.htm; SPR, Choose your price plan & save on
electric bills, available at http://www.srpnet.com/prices/home/ChooseYourPricePlan.aspx. 113
Ibid 114
Schwartz, Judith, “Salt River Project: The Persistence of Choice,” A National Town Meeting on Demand
Response and Smart Grid, ADS Conference Presentation, June 28, 2012, available at
http://www.demandresponsetownmeeting.com/presentations/. 115
California Public Utilities Commission, Public Utilities Code Section 748 Report to the Governor and
Legislature on Actions to Limit Utility Cost and Rate Increases, May 2012, available at
http://www.cpuc.ca.gov/NR/rdonlyres/339C0DD6-0298-4BC7-AAD9-
A27779AA43D4/0/2012SB695ReporttoGovernorandLegislatureFinalv2.pdf. 116
For example, see California Public Utilities Commission, Proceeding A.10-08-005: Application of Pacific
Gas and Electric Company for Approval to Defer Consideration of Default Residential Time-Variant Pricing
until Its Next General Rate Case Phase 2 Proceeding, or in the Alternative for Approval of its Proposal for
Default Residential Time-Variant Pricing and For Recovery of Incremental Expenditures Required for
Implementation (U39E), available at
http://delaps1.cpuc.ca.gov/CPUCProceedingLookup/f?p=401:1:392034754001701::NO:RP:: Proceeding A.10-
07-009: In the Matter of the Application of San Diego Gas & Electric Company (U902E) for Approval of its
Proposals for Dynamic Pricing and Recovery of Incremental Expenditures Required for Implementation;
available at http://delaps1.cpuc.ca.gov/CPUCProceedingLookup/f?p=401:1:1372938263824701::NO:RP:
Proceeding A.11-06-007: Application of Southern California Edison Company (U338E) To Establish Marginal

2012 Assessment of Demand Response and Advanced Metering Federal Energy Regulatory Commission 47
recently authorized portions of the investor-owned utilities’ programs’ dynamic pricing
requests for 2012 through 2014 as part of the utilities’ demand response programs and budget
proposals.117
Maryland is also active in implementing dynamic pricing programs. The Maryland Public
Service Commission approved applications from Baltimore Gas and Electric and Potomac
Electric Power Company to offer peak time rebate programs. The Baltimore Gas and
Electric program was approved for rollout in June 2013, while Potomac Electric Power
Company planned to offer its program to over 5,000 customers in July 2012.118
Both
programs will be available on an opt-in basis to customers who have advanced meters
installed.
Several other states also examined and approved dynamic pricing programs and rates. These
include:
Arkansas and Oklahoma. The Arkansas Public Service Commission and the
Oklahoma Corporation Commission have each allowed the Oklahoma Gas and
Electric Company to offer residential customers variable peak pricing rates on an opt-
in basis.119,
120
Illinois. In Illinois, both Ameren Utilities and Commonwealth Edison Company have
received approval from the Illinois Commerce Commission to establish residential
real-time pricing programs.121
Idaho. The Idaho Public Utilities Commission approved a voluntary Idaho Power
dynamic pricing program, initially proposed for 1,200 customers. After Idaho Power
submits a report on its 2012 results, the program may be expanded to additional
customers in 2013.122
Costs, Allocate Revenues, Design Rates, and Implement Additional Dynamic Pricing Rates, available at
http://delaps1.cpuc.ca.gov/CPUCProceedingLookup/f?p=401:1:1372938263824701::NO:RP:. 117
The decision authorized thee-year budgets of approximately $191.9 million for PG&E, $196.3 million for
SCE and $65.8 million for SDG&E. 118
Maryland Public Service Commission, In the Matter of Baltimore Gas and Electric Company for
Authorization to Deploy a Smart Grid Initiative and To Establish a Surcharge for the Recovery of Cost, Case
No. 9208, Order No. 84925, Item 143, Issued May 24, 2012, available at:
http://webapp.psc.state.md.us/Intranet/home.cfm; and Maryland Public Service Commission, In the Matter of
Potomac Electric Power Company and Delmarva Power and Light Company Request for the Deployment of
Advanced Metering Infrastructure, Case No. 9207, Item 207, Order No. 84966, Issued June 8, 2012, available
at: http://webapp.psc.state.md.us/Intranet/home.cfm. 119
Oklahoma Corporation Commission, Standard Pricing Schedule: R-VPP Residential Variable Peak Pricing
Program, Docket No. PUD 201000016, Order No. 575500, Approved May 2010, available at
http://www.oge.com/Documents/OK/3.50%20R-VPP.pdf. 120
Arkansas Public Service Commission, Oklahoma Gas and Electric Company Residential Variable Peak
Pricing, Docket No. 10-067-U. Order No. 6, Approved June 2011, available at
http://www.oge.com/Documents/ARK/2011%20Arkansas%20Docket%2010-067-U/R-VPP%206-6-2011.pdf. 121
Illinois Commerce Commission, Real Time Pricing, available at
http://www.icc.illinois.gov/Electricity/RTP.aspx. 122
Idaho Public Utilities Commission, Case No. IPC-E-12-05: In the Matter of the Application of Idaho Power
Company for Approval of Modifications to Schedules 1, 4, and 5 Implementing a Time Variant Pricing Plan,
Federal Energy Regulatory Commission 2012 Assessment of Demand Response and Advanced Metering 48
Colorado. In April 2011, the Colorado Public Utilities Commission (CPUC) closed a
docket on exploring the issues related to smart grid and advanced metering by issuing
a decision that included conclusions and next steps for the state.123
In this document,
the CPUC noted that one of the primary benefits of advanced meters is to provide a
platform for dynamic pricing.
Connecticut. In Connecticut, all electric distribution companies must offer voluntary
critical peak pricing or real-time pricing programs for all customer classes.124
As a
result, the Connecticut Public Utilities Regulatory Authority has approved variable
peak pricing rates for customers of both the Connecticut Light and Power
Company125
and the United Illuminating Company.126
Texas Retail Demand Response
The Public Utility Commission of Texas has developed a process to integrate the deployment
of advanced metering with competitive demand response retail service markets. After an
electric utility installs an advanced meter, residential customers in Texas have the option to
choose demand response services and compatible technologies from a number of competing
companies. Eligible demand response service providers include both retail energy providers
and vendors of third-party products and services.127
Third-party providers that participate in
Texas’ program have noted that they must engage and educate consumers on the benefits of
demand response technology.
The Public Utility Commission of Texas, ERCOT, and interested stakeholders are also
working on reducing barriers to increased demand response participation among advanced
metering customers.128,129
Through a series of workshops, stakeholders are examining a
Order No 32499, March 27, 2012, available at:
http://www.puc.idaho.gov/orders/recent/Final_Order_No_32499.pdf. 123
Colorado Public Utilities Commission, In the Matter of the Investigation of the Issues Related to Smart Grid
and Advanced Metering Technologies: Order Stating Conclusions and Next Steps, Adopted March 2011,
available at https://www.dora.state.co.us/pls/efi/EFI_Search_UI.Show_Decision?p_session_id=&p_dec=13836. 124
See: Connecticut Public Utilities Regulatory Authority, Docket No. 03-07-02RE11: Application of the
Connecticut Light and Power Company to Amend its Rate Schedule – Review of VPP Tariffs, September 21,
2011 Decision, available at
http://www.dpuc.state.ct.us/dockhist.nsf/8e6fc37a54110e3e852576190052b64d/d72d04fcf84696c18525795800
5bd05a?OpenDocument. 125
Ibid. 126
Connecticut Public Utilities Regulatory Authority, Docket No. 05-06-04RE04: Application of The United
Illuminating Company To Increase Its Rates and Charges, – Public Act 07-242, Seasonal Rates, Non
Generation-Related Time-of-Use Pricing and Related Rate Design Issues, September 28, 2008, Final Decision,
available at
http://www.dpuc.state.ct.us/dockhist.nsf/8e6fc37a54110e3e852576190052b64d/17989d79124999ea852575230
0524e43?OpenDocument. 127
See: ERCOT, Demand Side Working Group (DSWG), AMI’s Next Frontier Workshop, Agenda Item
#6:Technology/Product Providers Perspectives, August 30, 2011, available at
http://ercot.com/calendar/2011/08/20110830-DSWG. 128
ERCOT, Demand Side Working Group (DSWG), AMIT-DSWG Workshop, ‘AMI’s Next Frontier: Demand
Response Part 2’, December 16, 2011, available at http://ercot.com/calendar/2011/12/20111216-DSWG.

2012 Assessment of Demand Response and Advanced Metering Federal Energy Regulatory Commission 49
broad variety of potential barriers, including (1) the short duration of retail contracts (e.g., 12
or 24 months) that may not allow retail demand response providers to recover product and
service costs, (2) the lack of regulatory requirements for retail energy providers to offer
specific products, (3) limited third-party access to data, and (4) the reliability of
communication networks.
Barriers to Demand Response
Demand-response can be accomplished through a variety of means and ways. As evidenced
by the activities described above, the federal government, the Commission, and state and
local governments have made progress on removing barriers to customer participation in
demand response. Nevertheless, and depending on the type of demand-response to be
pursued, several outstanding barriers remain.
Limited Number of Retail Customers on Time-Based Rates. Previous
Commission staff annual reports highlighted the low number of retail customers who
purchase electricity based on time-based rates. While there is progress, without an
expanded implementation of time-based rates across the U.S., the development of
new technologies and programs and the fulfillment of the nation’s demand response
potential may be slowed.
Measurement and Cost-Effectiveness of Reductions. While the lack of
consistency in the measurement and verification of demand reductions and the lack of
demand responsive-specific cost-effectiveness tools remain as barriers, significant
progress to reduce these barriers occurred in the past year. NAESB completed some
work on measurement and verification and the Commission issued a Notice of
Proposed Rulemaking in April proposing to adopt the Phase II wholesale demand
response measurement and verification standards. Furthermore, changes to the
measurement and verification of demand response in organized wholesale energy and
ancillary markets indicate movement toward more consistency across the various
RTOs. Finally, focused review of these two issues is occurring within the National
Forum on the National Action Plan on Demand Response.
Lack of Uniform Standards for Communicating Demand Response Pricing,
Signals and Usage Information. Communications to and interactions with demand
response resources and end-use devices are typically based on company- and
technology-specific proprietary protocols and techniques. The lack of common
information models and protocols resulted in the potential for duplicative systems and
inefficient transfer of pricing and usage information between parties. As discussed in
Chapter 4, recent standards development work being led by the National Institute of
Standards and Technology and the Smart Grid Interoperability Panel should help
remove this barrier, if industry embraces and utilities these standards.
Lack of Customer Engagement. Customers need to be effectively educated and
informed about demand response and smart grid opportunities. Effective outreach
129
Public Utility Commission of Texas, PUCT Project 34610: Implementation Project Relating to Advanced
Metering, available at http://www.puc.state.tx.us/industry/projects/electric/34610/34610.aspx.
Federal Energy Regulatory Commission 2012 Assessment of Demand Response and Advanced Metering 50
and communication are needed to explain demand response, time-based pricing and
smart grid investments and the impacts of these at the customer level. Otherwise,
customers may respond negatively to actions taken by their electric providers, e.g.,
the deployment of advanced meters. As the experiences of Oklahoma Gas and
Electric and Arizona Public Service demonstrate, successful customer engagement
efforts can be used to support smart grid investments, thereby promoting customer
support. The efforts of the Smart Grid Consumer Collaborative to draw upon best
practices may prove helpful.130
Lack of Demand Response Forecasting and Estimation Tools. As the National
Action Plan on Demand Response identified, “new tools and methods should be
developed to directly incorporate demand response into dispatch algorithms and
resource planning models,” and “to forecast and model the capability of demand
resources to adjust consumption in near real-time.”131
Current planning and
forecasting tools are not sufficiently robust to model adequately the capability of
demand response to serve as an alternative to building new generation and
transmission and to act as a resource to alleviate transmission congestion. The efforts
sponsored by U.S. Department of Energy to develop interconnection-wide plans that
include demand side resources may help address this need. In addition, the National
Forum on the National Action Plan on Demand Response is examining other
modeling needs. The National Forum effort is inventorying existing demand
response tools and models, and is identifying needed modeling and tools.
130
Consumer engagement is a key topic for the Smart Grid Consumer Collaborative (SGCC). See SGCC,
Consumer Engagement, available at http://smartgridcc.org/category/consumer-engagement. 131
FERC, National Action Plan on Demand Response, June 2010, pp. 75-76.

2012 Assessment of Demand Response and Advanced Metering Federal Energy Regulatory Commission 51
CHAPTER 4. SMART GRID DEVELOPMENTS SUPPORTING DEMAND
RESPONSE
This chapter reports on two key smart grid developments that support the further
development of demand response resources: (1) the development of new communications
and demand response standards by the National Institute of Standards and Technology’s
Smart Grid Interoperability Panel, and (2) the Smart Grid Demonstration Program sponsored
by the U.S. Department of Energy.
Demand Response-Related Smart Grid Standards Development
In Title XIII of the Energy Independence and Security Act of 2007 (EISA), Congress
addressed the need for standards for communication and interoperability of the grid to
enable, among other things, the incorporation of demand response and demand-side
resources into grid operations. 132
EISA directed the National Institute of Standards and
Technology (NIST) to coordinate the development of a framework to achieve
interoperability of smart grid devices and systems, including protocols and model
standards for information management.133
In turn, NIST set up the Smart Grid
Interoperability Panel (SGIP), a public-private consensus-based organization, to coordinate
standards development with input from a broad range of smart grid stakeholders.134
In 2009, the Commission issued a Smart Grid Policy Statement that identified demand
response as one of four key functional priorities for smart grid interoperability standards
development.135
In the Policy Statement, the Commission reiterated that demand response
can play a important role in integrating variable sources of renewable generation, and in
maintaining system security in constrained areas.136
NIST agreed that demand response is a
priority for interoperability standards development, and has devoted considerable resources
to this effort.137
The following section reviews the progress of the SGIP efforts.
Demand Response Activities within the NIST/SGIP Process
The NIST Framework and Roadmap for Smart Grid Interoperability, Release 2.0 states the
following:
“…the SGIP focuses on two principal areas where value can be added:
Analysis of cross-functional area applications. Such applications often require
coordination between one or more technologies, and this coordination introduces
132
Public Law No. 110-140, 121 Stat. 1492, 1783-84, codified at 15 U.S.C. 17381 et seq. (2007). 133
EISA sec. 1305(a), codified at 15 U.S.C. 17385(a). 134
NIST Framework and Roadmap for Smart Grid Interoperability Standards, Release 2.0, at page 142. 135
Federal Energy Regulatory Commission, Smart Grid Policy, 128 FERC ¶ 61,060 (2009). The other three
functional priorities are wide-area situational awareness, energy storage, and electric transportation. The
Commission also identifies two cross-cutting priorities, namely cyber security and communication and
coordination across inter-system interfaces. 136
Id., at P 74. 137
NIST Framework and Roadmap for Smart Grid Interoperability Standards, Release 1.0.

Federal Energy Regulatory Commission 2012 Assessment of Demand Response and Advanced Metering 52
issues and requirements beyond the original scope of the technology or
technologies.
Coordination among all groups which must complement each other on the
resolution of a gap or overlap in Smart Grid technologies.
The first of these focus areas, Analysis, is provided by the SGIP through the working group
structure, primarily through the Domain Expert Working Groups. The second of these focus
areas, Coordination, is provided by the SGIP through the origination and oversight of the
Priority Action Plan (PAP) groups.”138
NIST and the SGIP established the following Priority Action Plans for demand response. As
the name suggests PAPs are created when the SGIP determines there is a need for
interoperability coordination on some urgent issue.”139
Standardized demand response information and signals;
Standardized energy usage information;
Wholesale demand response communication protocols; and
Facility-level communication standards.
A number of standards related to demand response have received supermajority support
within the SGIP,140
or have made major strides to develop new standards, as described in the
following sections.
Standardized demand response information and signals
Recognizing the need for electricity providers to be able to communicate demand response
and distributed energy resources signals (e.g., price, information on system conditions, and
dispatch instructions) with each other and with customers, the SGIP sponsored several PAPs
to develop common protocols for communicating (1) price information, (2) demand response
signals, and (3) equipment status for demand response and distributed energy resources.141
Two standards development organizations, the Organization for the Advancement of
Structured Information Standards (OASIS) and NAESB, did much of the standards
development work, in collaboration with the PAP working groups.
The OpenADR Alliance, a diverse group of utilities, independent system operators,
regulators, demand response providers, and controls suppliers is currently testing various
forms of the OpenADR 2.0 standard.
138
Supra at page 143. 139
Id., at page 150. 140
When smart grid standards are supported by a supermajority, they are included in SGIP’s Catalog of
Standards. The Catalog of Standards is a compendium of standards and practices considered to be relevant for
the development and deployment of an interoperable Smart Grid, Information on the Catalog of Standards is
available at http://collaborate.nist.gov/twiki-sggrid/bin/view/SmartGrid/SGIPCatalogOfStandards. 141
PAP 3 (Develop Common Specification for Price and Product Definition) facilitated the development of the
OASIS Energy Market Information Exchange (eMIX) standard. PAP 4 (Develop Common Schedule
Communication Mechanism for Energy Transactions) helped produce the OASIS WS-Calendar standard. PAP
9 (Standard Demand Response and Distributed Energy Resources Signals) facilitated the development of the
OASIS Energy Interoperation standard and OpenADR 2.0. For more information on the SGIP PAP process, see
http://collaborate.nist.gov/twiki-sggrid/bin/view/SmartGrid/WebHome.
2012 Assessment of Demand Response and Advanced Metering Federal Energy Regulatory Commission 53
Standardized energy usage information
In recognition of the importance of energy usage information to the smart grid, and the lack
of a common, standardized approach, the SGIP established PAP 10 (Standard Energy Usage
Information). The associated working group had the mission to develop a standardized
information model for energy usage and to develop business rules for authorizing access to
this usage information. Without these efforts, software developers and utilities would each
need to develop customized, one-off solutions. Much of the work for this PAP has been led
by NAESB. The result of NAESB’s work (the Energy Usage Information standard) has been
included in the Catalog of Standards. NAESB has also developed an Energy Service
Provider Interface (ESPI) that provides a way for Energy Usage Information to be shared, in
a controlled manner to ensure confidentiality, between participants in the energy services
markets.
The Green Button initiative is also based on the framework created by the NAESB Energy
Usage Information and ESPI standards. As discussed in Chapter 2, Green Button is an
industry-led effort to provide electricity customers with easy access to their energy usage
data in a consumer-friendly and computer-friendly format. To further develop the Green
Button effort, the SGIP recently approved the creation of a new PAP 20 (Green Button ESPI
Evolution).
There were several national-scale efforts over the past two years that have focused on
providing privacy protection for consumer energy usage information. The SGIP Cyber
Security Working Group devoted an entire chapter of the NIST IR 7628142
to privacy
principles. NAESB has also developed a set of guidelines143
with respect to customer data
being shared between utilities and third-party service providers.
Wholesale demand response communication protocols
The SGIP recently formed the PAP 19 working group (Wholesale Demand Response
Communication Protocol) to develop and enhance data exchange between RTOs and demand
response aggregators, which may include utilities.144
The new effort is not intended to
compete with standards for communicating with end-use customers, but rather is designed to
create a seamless transfer of information and signals from wholesale system operators to
demand response aggregators and then to end-use customers.
The PAP 19 working group is in the process of identifying electricity market requirements
and gaps within current standards frameworks (including but not limited to Energy
Interoperation, OpenADR 2.0 and the IEC Common Information Modeling), to adequately
address demand response wholesale market interfaces.145
142
NISTIR 7628, Guidelines for Smart Grid Cyber Security: Vol. 2, Privacy and the Smart Grid, available
at http://nist.gov/smartgrid/upload/nistir-7628_total.pdf. 143
North American Energy Standards Board, REQ.22 Third Party Access to Smart Meter-Based Information
(2011) 144
PAP 19 began its deliberations in March 2012. 145
PAP 19 developed a Wholesale Demand Response Communication Protocol that was out for comment in
Autumn 2012. See http://collaborate.nist.gov/twiki-sggrid/bin/view/SmartGrid/PAP19WholesaleDR for more
information.
Federal Energy Regulatory Commission 2012 Assessment of Demand Response and Advanced Metering 54
Facility-level standards
The standards discussed in the preceding sections focus on the interchange of information
and data among parties and across domains, and are not directly focused on the transfer of
information or communications at the facility level. To address facility-level
communications, the SGIP created two additional PAPs focused on communication and
information exchange within buildings and premises.
One PAP deals with the Smart Energy Profile, which originally was a proprietary protocol
developed for residential end users by the Zigbee Alliance, a collaboration of vendors and
utilities. The Smart Energy Profile has since changed into an open standard that is
harmonized with several previously competing communications standards. A new version
2.0 that communicates with home area networks is expected to be published by the end of
2012. It however is not compatible with the older Smart Energy Profile 1.0 and successor
versions already installed in many meters. This lack of compatibility has troubled state
commissions in Texas and California. In response, the SGIP established PAP 18 to focus on
the technical issues associated with migration and the coexistence of two Smart Energy
Profile versions. PAP 18 succeeded in identifying best practices and means to allow
continued use of Smart Energy Profile 1.x and transition towards the use of Smart Energy
Profile 2.0.146
A second PAP (PAP 17) focuses on interoperability among building energy management
systems for primarily commercial buildings, although the standard could also be used in
industrial facilities and residences. The standard is being developed through a partnership
between ASHRAE and NEMA. This standard enables communications of demand response
signals from system operators and aggregators, through building energy management
systems, to equipment within facilities. It also can allow communications about electrical
loads within the facility back to the utility and other electrical service providers.
Smart Grid Demonstration Program
The Smart Grid Demonstration Program147
operated by the U.S. Department of Energy aims
to demonstrate how a suite of existing and emerging smart grid concepts can be innovatively
applied and integrated to prove technical, operational, and business model feasibility. The
goal of the program is to demonstrate new and more cost-effective smart grid technologies,
tools, techniques, and system configurations that significantly improve on the ones
commonly used today. This program is currently funding 16 smart grid regional
demonstration projects and 16 energy storage projects.148
Most of these support advanced
metering or demand response programs.
The regional smart grid demonstration projects were selected to verify smart grid viability,
quantify smart grid costs and benefits, and validate new smart grid business models at scales
that can be readily replicated across the country. Of these 16 projects, the nine that employ
146
A white paper on this transition received supermajority support within the SGIP and is available at
http://collaborate.nist.gov/twiki-sggrid/bin/view/SmartGrid/PAP18SEP1To2TransitionAndCoexistence. 147
This program was authorized by the Energy Independence and Security Act of 2007, Section 1304, and
amended by the Recovery Act. 148
The total budget for the 32 projects is about $1.6 billion; the federal share is about $600 million.

2012 Assessment of Demand Response and Advanced Metering Federal Energy Regulatory Commission 55
demand response technologies or otherwise enhance demand response are described
below.149
AEP’s gridSMART Demonstration Project demonstrates the ability to maximize
distribution system efficiency and reliability, and consumer use of demand response
programs to reduce energy consumption, peak demand costs, and fossil fuel
emissions.
Battelle Memorial Institute’s Pacific Northwest Smart Grid Demonstration
Project is a collaboration between utilities, universities, and technology partners
across five states More than 20 types of responsive Smart Grid assets, including
demand response, storage, and direct load control, will be tested across six regional
and utility operational objectives at 15 unique distribution sites operated by 12
utilities.
Kansas City Power and Light’s Green Impact Zone SmartGrid Demonstration is
built around a SmartSubstation with a local distributed control system that includes
advanced generation, distribution, and customer technologies.
Long Island Power Authority’s Long Island Smart Energy Corridor will
integrate advanced metering technology with automated substation and distribution
systems to reduce peak demand and energy costs, while improving the ability to
identify and respond to outages.
Los Angeles Department of Water and Power’s Smart Grid Regional
Demonstration is a collaboration between a consortium of research institutions to
develop new Smart Grid technologies, quantify costs and benefits, validate new
models, and create prototypes to be adapted nationally. The project consists of four
broad initiatives: demand response, electric vehicle integration, customer behavior,
and cyber security.
National Rural Electric Cooperative Association’s Enhanced Demand and
Distribution Management Regional Demonstration demonstrates Smart Grid
technologies with 27 cooperatives in 11 states. The project will conduct studies in
advanced volt/volt-ampere reactive for total demand; demand response; critical peak
pricing; water heater and air conditioning load control; thermal storage; energy usage
portal pilots; consumer in-home energy display pilots; AMI integration; distribution
co-op meter data management system applications; and self-healing feeders for
improved reliability.
NSTAR Electric and Gas Corporation’s Automated Meter Reading-Based
Dynamic Pricing will enable residential dynamic pricing (time-of-use, critical peak
rates, and peak time rebates) and two-way direct load control by capturing automated
meter reading (AMR) data transmissions and communicating through existing
customer-sited broadband connections in conjunction with home area networks.
149
SmartGrid.gov, Smart Grid Demonstration Program, available at
http://www.smartgrid.gov/recovery_act/overview/smart_grid_demonstration_program.

Federal Energy Regulatory Commission 2012 Assessment of Demand Response and Advanced Metering 56
Pecan Street Project’s Energy Internet Demonstration is developing and
implementing an Energy Internet in Austin, Texas. Smart Grid technologies include
advanced metering, energy control gateways, advanced billing software, and smart
thermostats, distributed generation, thermal storage, battery storage, and smart
irrigation systems.
Southern California Edison Company’s Irvine Smart Grid Demonstration will
deploy advanced Smart Grid technologies in an integrated system to be more reliable,
secure, economic, efficient, safe, and environmentally friendly. The technology
demonstrations will include three main areas: (1) Energy Smart Customer Devices;
(2) Year 2020 Distribution System including distribution automation with looped
circuit topology, advanced voltage/VAR control, advanced distribution equipment,
smart metering, utility-scale storage, and dispatched renewable distributed generation;
and (3) a Secure Energy Network to demonstrate end-to-end management of a
complex high performance telecommunication system.
2012 Assessment of Demand Response and Advanced Metering Federal Energy Regulatory Commission 57
APPENDIX A: SECTION 1252 OF THE ENERGY POLICY ACT OF
2005
SEC. 1252. SMART METERING.
(a) IN GENERAL.—Section 111(d) of the Public Utility Regulatory Policies Act of 1978 (16
U.S.C.
2621(d)) is amended by adding at the end the following:
‘‘(14) TIME-BASED METERING AND COMMUNICATIONS.—
(A) Not later than 18 months after the date of enactment of this paragraph, each
electric utility shall offer each of its customer H. R. 6—371 classes, and provide
individual customers upon customer request, a time-based rate schedule under which
the rate charged by the electric utility varies during different time periods and reflects
the variance, if any, in the utility’s costs of generating and purchasing electricity at
the wholesale level. The time-based rate schedule shall enable the electric consumer
to manage energy use and cost through advanced metering and communications
technology.
‘‘(B) The types of time-based rate schedules that may be offered under the schedule
referred to in subparagraph (A) include, among others—
‘‘(i) time-of-use pricing whereby electricity prices are set for a specific time
period on an advance or forward basis, typically not changing more often than
twice a year, based on the utility’s cost of generating and/or purchasing such
electricity at the wholesale level for the benefit of the consumer. Prices paid
for energy consumed during these periods shall be pre-established and known
to consumers in advance of such consumption, allowing them to vary their
demand and usage in response to such prices and manage their energy costs
by shifting usage to a lower cost period or reducing their consumption overall;
‘‘(ii) critical peak pricing whereby time-of-use prices are in effect except for
certain peak days, when prices may reflect the costs of generating and/or
purchasing electricity at the wholesale level and when consumers may receive
additional discounts for reducing peak period energy consumption;
‘‘(iii) real-time pricing whereby electricity prices are set for a specific time
period on an advanced or forward basis, reflecting the utility’s cost of
generating and/or purchasing electricity at the wholesale level, and may
change as often as hourly; and
‘‘(iv) credits for consumers with large loads who enter into pre-established
peak load reduction agreements that reduce a utility’s planned capacity
obligations.
‘‘(C) Each electric utility subject to subparagraph (A) shall provide each customer
requesting a time-based rate with a time-based meter capable of enabling the utility
and customer to offer and receive such rate, respectively.
‘‘(D) For purposes of implementing this paragraph, any reference contained in this
section to the date of enactment of the Public Utility Regulatory Policies Act of 1978
shall be deemed to be a reference to the date of enactment of this paragraph.
Federal Energy Regulatory Commission 2012 Assessment of Demand Response and Advanced Metering 58
‘‘(E) In a State that permits third-party marketers to sell electric energy to retail
electric consumers, such consumers shall be entitled to receive the same time-based
metering and communications device and service as a retail electric consumer of the
electric utility.
‘‘(F) Notwithstanding subsections (b) and (c) of section 112, each State regulatory
authority shall, not later than 18 months after the date of enactment of this paragraph
conduct an investigation in accordance with section 115(i) and issue a decision
whether it is appropriate to implement the standards set out in subparagraphs (A) and
(C).’’. H. R. 6—372
(b) STATE INVESTIGATION OF DEMAND RESPONSE AND TIMEBASED
METERING.—Section
115 of the Public Utility Regulatory Policies Act of 1978 (16 U.S.C. 2625) is amended as
follows:
(1) By inserting in subsection (b) after the phrase ‘‘the standard for time-of-day rates
established by section 111(d)(3)’’ the following: ‘‘and the standard for time-based metering
and communications established by section 111(d)(14)’’.
(2) By inserting in subsection (b) after the phrase ‘‘are likely to exceed the metering’’ the
following: ‘‘and communications’’.
(3) By adding at the end the following:
‘‘(i) TIME-BASED METERING AND COMMUNICATIONS.—In making a determination
with respect to the standard established by section 111(d)(14), the investigation requirement
of section 111(d)(14)(F) shall be as follows: Each State regulatory authority shall conduct an
investigation and issue a decision whether or not it is appropriate for electric utilities to
provide and install time-based meters and communications devices for each of their
customers which enable such customers to participate in time-based pricing rate schedules
and other demand response programs.’’.
(c) FEDERAL ASSISTANCE ON DEMAND RESPONSE.—Section 132(a) of the Public
Utility
Regulatory Policies Act of 1978 (16 U.S.C. 2642(a)) is amended by striking ‘‘and’’ at the
end of paragraph (3), striking the period at the end of paragraph (4) and inserting ‘‘; and’’,
and by adding the following at the end thereof: ‘‘(5) technologies, techniques, and rate-
making methods related to advanced metering and communications and the use of these
technologies, techniques and methods in demand response programs.’’.
(d) FEDERAL GUIDANCE.—Section 132 of the Public Utility Regulatory Policies Act of
1978 (16
U.S.C. 2642) is amended by adding the following at the end thereof:
‘‘(d) DEMAND RESPONSE.—The Secretary shall be responsible for—
‘‘(1) educating consumers on the availability, advantages, and benefits of advanced metering
and communications technologies, including the funding of demonstration or pilot projects;
‘‘(2) working with States, utilities, other energy providers and advanced metering and
communications experts to identify and address barriers to the adoption of demand response
programs; and
‘‘(3) not later than 180 days after the date of enactment of the Energy Policy Act of 2005,
providing
2012 Assessment of Demand Response and Advanced Metering Federal Energy Regulatory Commission 59
Congress with a report that identifies and quantifies the national benefits of demand response
and makes a recommendation on achieving specific levels of such benefits by January 1,
2007.’’.
(e) DEMAND RESPONSE AND REGIONAL COORDINATION.—
(1) IN GENERAL.—It is the policy of the United States to encourage States to coordinate,
on a regional basis, State energy policies to provide reliable and affordable demand response
services to the public.
(2) TECHNICAL ASSISTANCE.—The Secretary shall provide technical assistance to States
and regional organizations formed by two or more States to assist them in—
(A) identifying the areas with the greatest demand response potential; H. R. 6—373
(B) identifying and resolving problems in transmission and distribution networks,
including through the use of demand response;
(C) developing plans and programs to use demand response to respond to peak
demand or emergency needs; and
(D) identifying specific measures consumers can take to participate in these demand
response programs.
(3) REPORT.—Not later than 1 year after the date of enactment of the Energy Policy Act of
2005, the
Commission shall prepare and publish an annual report, by appropriate region, that assesses
demand response resources, including those available from all consumer classes, and which
identifies and reviews—
(A) saturation and penetration rate of advanced meters and communications
technologies, devices and systems;
(B) existing demand response programs and time-based rate programs;
(C) the annual resource contribution of demand resources;
(D) the potential for demand response as a quantifiable, reliable resource for regional
planning
purposes
(E) steps taken to ensure that, in regional transmission planning and operations,
demand resources are provided equitable treatment as a quantifiable, reliable resource
relative to the resource obligations of any load-serving entity, transmission provider,
or transmitting party; and
(F) regulatory barriers to improve customer participation in demand response, peak
reduction and critical period pricing programs.
(f) FEDERAL ENCOURAGEMENT OF DEMAND RESPONSE DEVICES.—It is the
policy of the
United States that time-based pricing and other forms of demand response, whereby
electricity customers are provided with electricity price signals and the ability to benefit by
responding to them, shall be encouraged, the deployment of such technology and devices that
enable electricity customers to participate in such pricing and demand response systems shall
be facilitated, and unnecessary barriers to demand response participation in energy, capacity
and ancillary service markets shall be eliminated. It is further the policy of the United States
that the benefits of such demand response that accrue to those not deploying such technology
and devices, but who are part of the same regional electricity entity, shall be recognized.

Federal Energy Regulatory Commission 2012 Assessment of Demand Response and Advanced Metering 60
(g) TIME LIMITATIONS.—Section 112(b) of the Public Utility Regulatory Policies Act of
1978 (16
U.S.C. 2622(b)) is amended by adding at the end the following:
‘‘(4)(A) Not later than 1 year after the enactment of this paragraph, each State regulatory
authority (with respect to teach electric utility for which it has ratemaking authority) and each
non-regulated electric utility shall commence the consideration referred to in section 111, or
set a hearing date for such consideration, with respect to the standard established by
paragraph (14) of section 111(d).
‘‘(B) Not later than 2 years after the date of the enactment of this paragraph, each State
regulatory authority (with respect to each electric utility for which it has ratemaking
authority), and each non-regulated electric utility, shall complete the consideration, and shall
make the determination, referred to in section 111 with respect to the standard established by
paragraph (14) of section 111(d).’
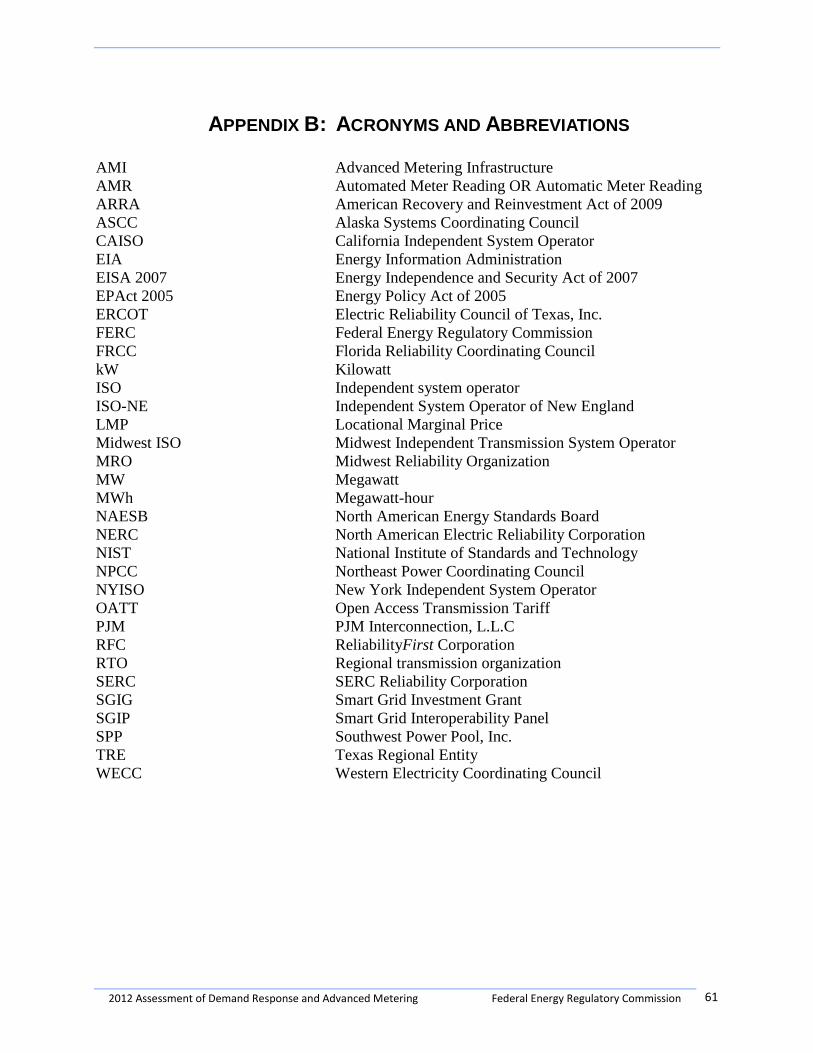
2012 Assessment of Demand Response and Advanced Metering Federal Energy Regulatory Commission 61
APPENDIX B: ACRONYMS AND ABBREVIATIONS
AMI Advanced Metering Infrastructure
AMR Automated Meter Reading OR Automatic Meter Reading
ARRA American Recovery and Reinvestment Act of 2009
ASCC Alaska Systems Coordinating Council
CAISO California Independent System Operator
EIA Energy Information Administration
EISA 2007 Energy Independence and Security Act of 2007
EPAct 2005 Energy Policy Act of 2005
ERCOT Electric Reliability Council of Texas, Inc.
FERC Federal Energy Regulatory Commission
FRCC Florida Reliability Coordinating Council
kW Kilowatt
ISO Independent system operator
ISO-NE Independent System Operator of New England
LMP Locational Marginal Price
Midwest ISO Midwest Independent Transmission System Operator
MRO Midwest Reliability Organization
MW Megawatt
MWh Megawatt-hour
NAESB North American Energy Standards Board
NERC North American Electric Reliability Corporation
NIST National Institute of Standards and Technology
NPCC Northeast Power Coordinating Council
NYISO New York Independent System Operator
OATT Open Access Transmission Tariff
PJM PJM Interconnection, L.L.C
RFC ReliabilityFirst Corporation
RTO Regional transmission organization
SERC SERC Reliability Corporation
SGIG Smart Grid Investment Grant
SGIP Smart Grid Interoperability Panel
SPP Southwest Power Pool, Inc.
TRE Texas Regional Entity
WECC Western Electricity Coordinating Council

Federal Energy Regulatory Commission 2012 Assessment of Demand Response and Advanced Metering 62

2012 Assessment of Demand Response and Advanced Metering Federal Energy Regulatory Commission 63
APPENDIX C: GLOSSARY
Note: The terms and definitions provided in this glossary were provided to survey
respondents and are for the limited purpose of the survey.
Actual MWh Change: The total change in energy consumption (measured in MWh) that
resulted from the deployment of demand response programs during the year.
Advanced Meters: Meters that measure and record usage data at hourly intervals or more
frequently, and provide usage data to both consumers and energy companies at least once
daily. Data are used for billing and other purposes. Advanced meters include basic hourly
interval meters, meters with one-way communication, and real-time meters with built-in two-
way communication capable of recording and transmitting instantaneous data.
Aggregator: See “Curtailment Service Provider”
Ancillary Services: Services that ensure reliability and support the transmission of electricity
to customer loads. Such services may include: energy imbalance, operating reserves,
contingency reserves, spinning (also known as synchronized, ten-minute spinning,
responsive) reserves, supplemental (also known as non-spinning, non-synchronized, ten-
minute non-synchronous, thirty-minute operating) reserves, reactive supply and voltage
control, and regulation and frequency response (also known as regulation reserves, regulation
service, up-regulation and down-regulation).
Bid Limit: The maximum bid, in $/MWh, that can be submitted by a demand response
program participant. If there is no bid limit, leave blank.
Capacity (program type): Displacement or augmentation of generation for planning and/or
operating resource adequacy; penalties are assessed for nonperformance.
Capacity Market Programs: Arrangements in which customers offer load reductions as
system capacity to replace conventional generation or delivery resources. Participating
customers typically receive notice of events requiring a load reduction and face penalties
when failing to curtail load. Incentives usually consist of up-front reservation payments.
Capacity Service: A type of demand response service in which demand resources are
obligated over a defined period of time to be an available resource for the system operator.
Commercial and Industrial: Belonging to either of the energy-consuming sectors that
consist of (a) a broad range of facility types including office buildings, retail establishments,
hospitals, universities, the facilities of federal, state, and local governments and non-profit
organizations, institutional living quarters, master-metered apartment buildings, and homes
on military bases; and (b) manufacturing facilities and equipment used for producing,
processing, or assembling goods and encompassing the following types of activities:
manufacturing; processing; agriculture, forestry and fisheries; mining; and construction.
Also, a business labeled as “industrial” by the North American Industry Classification
Federal Energy Regulatory Commission 2012 Assessment of Demand Response and Advanced Metering 64
System or by the energy provider on the basis of energy demand or annual usage exceeding
some specified limit set by the energy provider.
Coincident Reduction Capability: The amount of demand response curtailments that would
be realized if all demand response products were called simultaneously and all responded by
curtailing load at prearranged levels or at their enrolled quantity.
Critical Peak Pricing with Load Control: Demand-side management that combines direct
load control with a pre-specified high price for use during designated critical peak periods,
triggered by system contingencies or high wholesale market prices.
Critical Peak Pricing: Rate and/or price structure designed to encourage reduced
consumption during periods of high wholesale market prices or system contingencies by
imposing a pre-specified high rate or price for a limited number of days or hours.
Curtailment Service Provider: Businesses that sponsor demand response programs that
recruit and contract with end users, and sell the aggregated demand response to utilities,
RTOs and ISOs. A Curtailment Service Provider is sometimes called an Aggregator and is
not necessarily a load-serving entity.
Customer Sector: A group of customers: residential, commercial and industrial, and
other (for example, transportation, agricultural).
Demand Bidding & Buy-Back: A program which allows a demand resource in retail and
wholesale markets to offer load reductions at a price, or to identify how much load it is
willing to curtail at a specific price.
Demand Resource or Demand-Side Resource: An electricity consumer that can decrease
its power consumption in response to a price signal or direction from a system operator.
Demand Response: Changes in electric use by demand-side resources from their normal
consumption patterns in response to changes in the price of electricity, or to incentive
payments designed to induce lower electricity use at times of high wholesale market prices or
when system reliability is jeopardized.
Demand Response Program: A company's service/program/tariff related to demand
response, or the change in customer electric usage from normal consumption patterns in
response to changes in the price of electricity over time or in response to incentive payments
designed to induce lower electricity use at times of high wholesale market prices, or a change
in electric usage by end-use customers at the direction of a system operator or an automated
preprogrammed control system when system reliability is jeopardized. Includes both time-
based rate programs and incentive-based programs.
Demand Response Program/Tariff and Program/Tariff Types: A company or utility's
service/product/compilation of all effective rate schedules, general terms and conditions and
standard forms related to demand response and/or AMI services and classification thereof.

2012 Assessment of Demand Response and Advanced Metering Federal Energy Regulatory Commission 65
Direct Load Control: A demand response activity by which the program sponsor remotely
shuts down or cycles a customer’s electrical equipment (e.g., air conditioner, water heater) on
short notice. Direct load control programs are primarily offered to residential or small
commercial customers. Also known as direct control load management.
Display Unit/In-home Display: Customer on-site device that receives (from a service
provider or from a smart meter) and displays for the customer information such as usage and
pricing data, messages, and alerts.
Duration of Event: The length of an Emergency or Economic Demand Response Event, in
hours.
Economic Demand Response Event: An event in which the demand response program
sponsor directs response to an economic market opportunity, rather than for reliability or
because of an emergency in the energy delivery system.
Electric Utility: A corporation, person, agency, authority, or other legal entity or
instrumentality producing, transmitting, or distributing electricity for use primarily by the
public. This includes: investor-owned electric utilities, municipal and state utilities, federal
electric utilities, and rural electric cooperatives. A few entities that are tariff based and
affiliated with companies owning distribution facilities are also included in this definition.
Emergency Event: An abnormal system condition (for example, system constraints and
local capacity constraints) that requires automatic or immediate manual action to prevent or
limit the failure of transmission facilities or generation supply that could adversely affect the
reliability of the Bulk Electric System.
Emergency Demand Response Event: The period of time during which participants in a
Demand Response Program must reduce load. The Emergency Demand Response Event is
announced by the program sponsor in response to an Emergency Event declared by it or by
another entity such as a utility or RTO/ISO. Demand Response Program sponsors, utilities
and RTO/ISOs typically declare these emergency events.
Emergency Demand Response Program: A demand response program that provides
incentive payments to customers for load reductions achieved during an Emergency Demand
Response Event.
End-Use Customer: A firm or individual that purchases electricity for its own consumption
and not for resale; an ultimate consumer of electricity.
Energy Payment for MWh Curtailed ($/MWh): Compensation paid or received for
reductions in electric energy consumption.
Energy Service Providers: See Power Marketers.
Entity: The organization that is (1) responding to the survey, (2) offering demand response
programs, time-based rates and/or tariffs, or (3) using advanced or smart meters.
Federal Energy Regulatory Commission 2012 Assessment of Demand Response and Advanced Metering 66
Entity ID Number: The respondent should enter the ID number which appears on the survey
transmittal e-mail, or the ID number used for the entity’s response to the Form EIA-861
Survey.
Event Limits: The maximum number of times a demand response resource may be called
during a specified period of time (typically one year or one season).
Federal Electric Utility: A utility that is either owned or financed by the Federal
Government.
Generation and Transmission Company (G&T Company): A company that provides both
energy production and facilities for transmitting energy to wholesale customers. G&T
companies are usually formed by rural electric cooperatives and electric utilities to pool the
costs and risks of constructing and managing the generation facilities and high-voltage
transmission infrastructure which are needed to deliver energy to their customers.
Hourly Pricing: A pricing plan in which energy prices vary by the hour, usually based in
part on a wholesale market price for energy.
In-home Display: See Display Unit/In-home Display.
Industrial Sector: The energy-consuming sector that consists of manufacturing facilities and
equipment used for producing, processing, or assembling goods. The Industrial Sector
encompasses the following types of activities: manufacturing; processing; agriculture,
forestry and fisheries; mining; and construction. The term Industrial Sector may also
designate a business labeled as “industrial” by the North American Industry Classification
System or by the energy provider on the basis of energy demand or annual usage exceeding
some specified limit set by the energy provider. See Commercial and Industrial sector.
Internet: The worldwide, publicly accessible series of interconnected computer networks
that transmit data by packet switching using the standard Internet Protocol.
Interruptible Load: Electric consumption subject to curtailment or interruption under tariffs
or contracts that provide a rate discount or bill credit for agreeing to reduce load during
system contingencies. In some instances, the demand reduction may be effected by action of
the System Operator (remote tripping) after notice to the customer in accordance with
contractual provisions.
Interval: The period of time for which advanced meters measure energy usage (and possibly
other data). Increments are typically in minutes, and may consist of five-minute intervals, 15-
minute intervals, or hourly intervals.
Interval Meter: An electric meter that measures energy use in increments of one hour or
less.
Interval Usage: The amount of energy, measured in kWh, consumed during a period of time,
typically five minutes, 15 minutes, or an hour.
2012 Assessment of Demand Response and Advanced Metering Federal Energy Regulatory Commission 67
Investor-Owned Electric Utility: A privately-owned electric utility whose stock is publicly
traded. It is rate regulated and authorized to achieve an allowed rate of return.
Joint Action Agency: A body consisting of utility companies, municipalities who own
public utilities, and/or municipalities who purchase energy from private utilities, which acts
as a committee for making decisions regarding the acquisition and delivery of energy
resources or related services.
Load as a Capacity Resource: Demand-side resources that commit to make pre-specified
load reductions when system contingencies arise.
Load Serving Entity: Entities that provide electric service to end-users, wholesale
customers, or both.
Mandatory Participation: Participation in the demand response program is required based
on the customer’s size or rate class. Customers are not offered the option of refusing to
respond to requests for load reduction.
Maximum Demand: The highest level of demand in MWs as tracked by an entity, such as
an hourly demand, 30-minute demand, 15-minute demand or 5-minute demand.
Maximum Demand of Customers: The highest level of total demand, in MW, for
customers participating in a demand response program, excluding any demand reduction that
results from the program. The maximum non-coincident demand of the participating
customers that would occur without the program.
Maximum Duration of Event: A specified maximum length of time a particular demand
response event will continue, usually defined by 30-minute or hourly increments.
Megawatt (MW): One thousand kilowatts or one million watts of electric power.
Megawatt-hour (MWh): One thousand kilowatt-hours or one million watt-hours of electric
energy.
Member Company: Member of a joint action agency or generation and transmission
company that supplies wholesale electricity and energy services.
Minimum Payment Rate: The smallest amount of money, in dollars per megawatt-hour,
that a program sponsor will pay a demand response program participant for reduced energy
consumption.
Minimum Reduction: A level established by the demand response program sponsor as the
least amount of demand reduction, in megawatts, a participant must achieve during a demand
response event to be considered as participating in that event or to qualify for the demand
response program.
Minimum Term: The shortest period of time that customers are obligated to participate in a
demand response program.
Federal Energy Regulatory Commission 2012 Assessment of Demand Response and Advanced Metering 68
Municipality: A village, town, city, county, or other political subdivision of a state.
NERC Regional Entity: One of the eight groups listed below (formerly known as Reliability
Councils) organized within the major interconnections in the North American bulk power
system. They work with the North American Electric Reliability Corporation to improve the
reliability of the bulk power system. Florida Reliability Coordinating Council (FRCC),
Midwest Reliability Organization (MRO), Northeast Power Coordinating Council (NPCC),
ReliabilityFirst Corporation (RFC), SERC Reliability Corporation (SERC), Southwest Power
Pool RE (SPP), Texas Regional Entity (TRE), Western Electricity Coordinating Council
(WECC). The states of Alaska and Hawaii are not within a NERC Regional Entity, but for
purposes of this survey appear as a choice in NERC Regional Entity fields.
Non-Spinning Reserves: Demand-side resource that may not be immediately available, but
may provide solutions for energy supply and demand imbalance after a delay of ten minutes
or more.
Opt-In: A Time-Based Rate/Tariff or demand response program in which a customer will be
enrolled only if the customer chooses to enroll.
Opt-Out: A Time-Based Rate/Tariff or demand response program in which a customer will
be enrolled unless the customer chooses not to enroll; a program that is the default for a class
of customers but that allows individual customers to choose an alternative rate/tariff or
program.
Other (as shown in Q3, Q5 & Q6): Customers who are in a customer class that is not listed.
Other Demand Response Program/Tariff: A company or utility's
service/product/compilation of all effective rate schedules, general terms and conditions and
standard forms related to demand response/AMI services for customers that are not
Residential, Commercial and Industrial, or Other.
Peak Time Rebate: Peak time rebates allow customers to earn a rebate by reducing energy
use from a baseline during a specified number of hours on critical peak days. Like Critical
Peak Pricing, the number of critical peak days is usually capped for a calendar year and is
linked to conditions such as system reliability concerns or very high supply prices.
Penalties: Fines or reductions in payments that result when a demand response program
participant fails to meet targeted reductions in power demand or chooses to not reduce
consumption during a demand response event.
Potential Peak Reduction: The sum of the load reduction capabilities (measured in
megawatts) of the demand response program participants, within the specified customer
sector, whether reductions are made through the direct control of the utility system operator
or by the participant in response to price signals or a utility request to curtail load. It reflects
the demand reduction capability, as opposed to the actual peak reduction achieved by
participants.
2012 Assessment of Demand Response and Advanced Metering Federal Energy Regulatory Commission 69
Power Marketers: Business entities, including energy service providers, which are engaged
in buying and selling electricity, but which do not necessarily own generating or transmission
facilities. Power marketers and energy service providers take ownership (title) of the
electricity, unlike power brokers, who do not take title to electricity. Power marketers are
involved in interstate commerce and must file with the FERC for authority to make
wholesale sales. Energy service providers will not file with the FERC but may file with the
states if they undertake only retail transactions.
Program Type: The category of demand response arrangements between retail or wholesale
entities and their retail or wholesale customers. Examples of these arrangements include:
critical peak pricing, critical peak pricing with load control, direct load control, interruptible
load, load as a capacity resource, regulation, non-spinning reserves, spinning reserves,
demand bidding and buy-back, time of use pricing, real-time pricing, system peak response
transmission tariff, peak time rebate, and emergency demand response, all of which are
defined in this glossary.
Program End Date: A date specified when the demand response and/or time-based rate
program is no longer in effect.
Program Start Date: A date specified when a demand response and/or time-based rate
program began.
Public Utility District: Municipal corporations organized to provide electric service to both
incorporated cities and towns and unincorporated rural areas.
Publicly Owned Electric Utility: Utilities operated by municipalities, political subdivisions,
and state and federal power agencies (such as the Bonneville Power Administration and the
Tennessee Valley Authority).
Realized Demand Reduction: The largest hourly demand reduction (in megawatts) that
occurred when the demand response program was called, or that was attributable to the
demand response program, during the 2011 calendar year.
Real Time Meters: Meters that measure energy as used, with built-in two-way
communication capable of recording and transmitting instantaneous data.
Real Time Pricing: Rate and price structure in which the retail price for electricity typically
fluctuates hourly or more often, to reflect changes in the wholesale price of electricity on
either a day-ahead or hour-ahead basis.
Regulation Service: A type of Demand Response service in which a Demand Resource
increases and decreases load in response to real-time signals from the system operator.
Demand Resources providing Regulation Service are subject to dispatch continuously during
a commitment period. This service is usually responsive to Automatic Generation Control
(AGC) to provide normal regulating margin. Also known as regulation or regulating reserves,
up-regulation and down-regulation.
Federal Energy Regulatory Commission 2012 Assessment of Demand Response and Advanced Metering 70
Reliability: A measure of the ability of the electric system to withstand sudden disturbances
such as electric short circuits or unanticipated loss of system components.
Reliability Event: An event, such as the loss of a line or generator, or imbalance between
supply and demand, which threatens the safe operation of the grid.
Reserve: A service in which demand resources are obligated to be available to provide
demand reduction upon deployment by the system operator, based on reserve capacity
requirements that are established to meet reliability standards.
Residential: The energy-consuming sector consisting of private households. Common uses
of energy associated with this sector include space heating, water heating, air conditioning,
lighting, refrigeration, cooking, and running a variety of other electric-powered devices. The
residential sector excludes institutional living quarters. This sector excludes deliveries or
sales to master-metered apartment buildings or homes on military bases (these buildings or
homes are included in the commercial sector).
Response Time: The maximum time allowed in a demand response program for a program
participant to react to the program sponsor’s notification, in hours.
Retail: Sales covering electrical energy supplied for residential, commercial, industrial, and
other (e.g., agricultural) end-use purposes. Electricity supplied at retail cannot be offered for
resale.
Retail Customer: A purchaser of energy that consumes electricity for residential,
commercial, or industrial use, or a variety of other end-uses.
Retail Electric Customer: See Retail Customer.
Rural Electric Cooperative: A member-owned electric utility company serving retail
electricity customers. Electric cooperatives may be engaged in the generation, wholesale
purchasing, transmission, and/or distribution of electric power to serve the demands of their
members on a not-for-profit basis.
Specific Event Limits: The maximum number of times that a participant in a demand
response program may be called to reduce energy consumption during a year.
Spinning/Responsive Reserves: Demand-side resource that is synchronized and ready to
provide solutions for energy supply and demand imbalance within the first few minutes of an
Emergency Event.
System Peak Response Transmission Tariff: The terms, conditions, and rates and/or prices
for customers with interval meters who reduce load during peaks as a way of reducing
transmission charges.
Tariff: A published volume of all effective rate schedules, terms and conditions under which
a product or service will be supplied to customers.
2012 Assessment of Demand Response and Advanced Metering Federal Energy Regulatory Commission 71
Time-Based Rate/Tariff: A retail rate or Tariff in which customers are charged different
prices for using electricity at different times during the day. Examples are time-of-use rates,
real time pricing, hourly pricing, and critical peak pricing. Time-based rates do not include
seasonal rates, inverted block, or declining block rates.
Time-of-Use: A rate where usage unit prices vary by time period, and where the time periods
are typically longer than one hour within a 24-hour day. Time-of-use rates reflect the average
cost of generating and delivering power during those time periods.
Transportation: An energy consuming sector that consists of electricity supplied and
services rendered to railroads and inter-urban and street railways, for general railroad use
including the propulsion of cars or locomotives, where such electricity is supplied under
separate and distinct rate schedules. In this survey, transportation customers should be
counted in the Other category.
Transportation Program/Tariff: A company or utility's service/product/compilation of all
effective rate schedules, general terms and conditions and standard forms related to demand
response/AMI services for transportation customers.
Type of Entity: The category of organization that best represents the energy market
participant. The available options include: investor-owned utility, municipal utility,
cooperative utility, state-owned utility, federally-owned utility, independent system operator,
retail power marketer, wholesale power marketer, regional transmission operator, curtailment
service provider, transmission, or other.
Voluntary: Customers have the option of participating or not participating. This would
include opt-out programs where customers are automatically enrolled but are allowed to
discontinue their participation.
Wholesale: Pertaining to a sale of electric energy for resale.
Wholesale Customer: An entity that purchases electric energy for resale.

Federal Energy Regulatory Commission 2012 Assessment of Demand Response and Advanced Metering 72
2012 Assessment of Demand Response and Advanced Metering Federal Energy Regulatory Commission 73
APPENDIX D: 2012 FERC SURVEY METHOD
Background
The Energy Policy Act of 2005 (EPAct 2005) requires that the Federal Energy Regulatory
Commission prepare and publish an annual report, by appropriate region, that assesses
electricity demand response resources. Commission staff determined that a survey of a full
set of private and public entities that provide electric power and could provide demand
response to customers would help fulfill the requirement.
In the first half of 2012 Commission staff:
Identified survey respondents, i.e., the “survey population;” and
Developed a voluntary survey based on a PDF vehicle.
Beginning in February of 2012 Z, INC. and their subcontractor DNV KEMA
Developed a sampling design based on the 2010 FERC Demand Response and
Advanced Metering Survey;
Revised a custom survey processing system in Microsoft Access to interface with the
FERC provided PDF Survey;
Reviewed the list of survey respondents and removed companies who are out
business or do are not appropriate recipients of the survey150
;
Distributed the 2012 FERC Survey, collected the data, and followed-up with
respondents where necessary; and
Conducted data analysis of the survey responses.
Responses to the survey were originally requested from all 3,349 entities from all 50 states
representing all aspects of the electricity delivery industry: investor-owned utilities,
municipally owned utilities, wholesale and retail power marketers, state and federal agencies,
and (rural electric) cooperatives. The 2012 FERC Survey respondent list was based on the
list of entities that the Energy Information Administration (EIA) uses for their Form EIA-861
Survey Form. The FERC staff added three categories of respondents to the base set of EIA
contacts – Regional Transmission Organizations (RTOs)/Independent System Operators
(ISOs), curtailment service providers, and transmission companies.
During the survey processing period it was determined fifteen entities were no longer in
operation or should not have received the survey. These entities were removed from the
survey respondent list, resulting in a list of 3,334 active respondents. Out of this active
group, 1,978 entities responded to the 2012 FERC Survey (a response rate of 59.3 percent),
an increase from the 2010 FERC Survey response rate of 52 percent.
Development of the FERC Survey and Sampling Design
The 2012 FERC Survey was conducted subject to the same Office of Management and
Budget (OMB) authorization that was provided to the Commission for similar surveys
150
A surveyed company may have been acquired by another company, for example.

Federal Energy Regulatory Commission 2012 Assessment of Demand Response and Advanced Metering 74
previously. The 2010 authorization of March 31, 2013 was used.151
As was done in the
previous three surveys, Commission staff fielded the survey on a voluntary rather than a
mandatory basis. Commission staff designed the survey to collect the needed information
using nine questions organized in three sections. The three sections include one parent
section containing questions one through seven and two child sections covering retail and
wholesale demand response programs:
Parent record (only one record per Utility)
Question 1: Company and contact information including utility ID, company name and
ownership type. Primary contact information along with their supervisor’s
information.
Question 2: Advanced and total meter counts by State and customer class
Question 3: Number of retail customers and meters by NERC region and customer class.
(optional, skip if there are demand response programs)
Question 4: Number of retail customers that can access the amount and frequency of their
electricity use by method and by customer sector.
Question 5: Plans for demand response programs over next 5 years by number of
programs and potential peak reduction.
Question 6: NERC regions and states in which you operate
Question 7: Number of retail customers for each NERC and State combination in Question
6,
by customer class.
Child 1 Record (Add additional pages as needed)
Question 8: Detailed retail demand response program information by NERC region, State,
Customer class, and Program type.
Child 2 Record (Add additional pages as needed)
Question 9: Detailed wholesale demand response program information by NERC region,
State, and Program type.
By shifting the detailed Demand Response program information to the end of the survey, the
burden on small utilities without demand response programs was lessened because they were
only asked to complete Questions 1 through 3. Also, by having all the information relative to
one demand response program on one page (Child record), respondents could as many pages
as required to cover each of their programs. The content of the 2012 FERC Survey mirrored
151
Links to the 2012 FERC Survey documents can be found at http://www.ferc.gov/industries/electric/indus-
act/demand-response/2012/survey.asp.
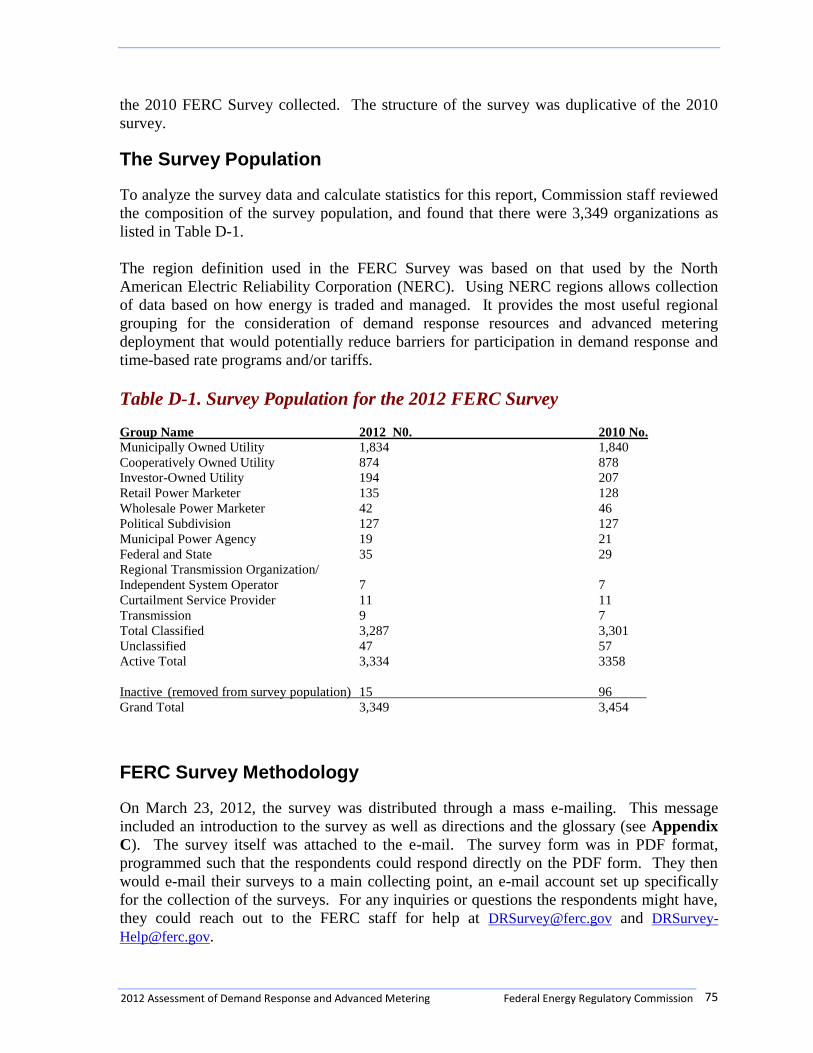
2012 Assessment of Demand Response and Advanced Metering Federal Energy Regulatory Commission 75
the 2010 FERC Survey collected. The structure of the survey was duplicative of the 2010
survey.
The Survey Population
To analyze the survey data and calculate statistics for this report, Commission staff reviewed
the composition of the survey population, and found that there were 3,349 organizations as
listed in Table D-1.
The region definition used in the FERC Survey was based on that used by the North
American Electric Reliability Corporation (NERC). Using NERC regions allows collection
of data based on how energy is traded and managed. It provides the most useful regional
grouping for the consideration of demand response resources and advanced metering
deployment that would potentially reduce barriers for participation in demand response and
time-based rate programs and/or tariffs.
Table D-1. Survey Population for the 2012 FERC Survey
Group Name 2012 N0. 2010 No.
Municipally Owned Utility 1,834 1,840
Cooperatively Owned Utility 874 878
Investor-Owned Utility 194 207
Retail Power Marketer 135 128
Wholesale Power Marketer 42 46
Political Subdivision 127 127
Municipal Power Agency 19 21
Federal and State 35 29
Regional Transmission Organization/
Independent System Operator 7 7
Curtailment Service Provider 11 11
Transmission 9 7
Total Classified 3,287 3,301
Unclassified 47 57
Active Total 3,334 3358
Inactive (removed from survey population) 15 96
Grand Total 3,349 3,454
FERC Survey Methodology
On March 23, 2012, the survey was distributed through a mass e-mailing. This message
included an introduction to the survey as well as directions and the glossary (see Appendix
C). The survey itself was attached to the e-mail. The survey form was in PDF format,
programmed such that the respondents could respond directly on the PDF form. They then
would e-mail their surveys to a main collecting point, an e-mail account set up specifically
for the collection of the surveys. For any inquiries or questions the respondents might have,
they could reach out to the FERC staff for help at [email protected] and DRSurvey-
Federal Energy Regulatory Commission 2012 Assessment of Demand Response and Advanced Metering 76
Z, INC., in collaboration with the FERC staff, strove to maximize the response rate through
various means. If respondents required specific information, a phone hotline was
established, open daily between 9 am and 6 pm. FERC staff also initiated its own
dissemination of the survey through postal mail, to capture any respondents that might not
have internet access or a functional e-mail account. Additionally, Z, INC assisted in the
sending out of a reminder e-mail to all those who had not responded as of April 25, 2012. Z,
INC. also contacted all companies that were statistically significant (i.e., large companies and
those selected for the sample), as well as all medium-sized companies, reaching more than
1,200 companies individually. Finally, FERC Chairman Jon Wellinghoff sent out a letter to
all cooperating organizations, including members and representatives of the National
Association of Regulatory Commissioners, American Public Power Association, Edison
Electric Institute, and the National Rural Electric Cooperative Association, asking them to
reach out to members and the industry to encourage submission of the survey.
As responses were returned to us, Z, INC. employed a rigorous system of verification and
due diligence. Beyond the software used to collect the submissions to the e-mail account
established by the FERC staff, Z, INC. also searched through the e-mail account looking for
attachments that had not been included in the data upload or other related problems.
Anomalies and seemingly incorrect information received a flag, indicating the necessity for
personal follow-up.
Continuous efforts were also made to ensure the optimal structure and processing of the
incoming data. Z, INC. created a specialized database for the 2010 FERC-731 Survey. This
database included all available information for on each entity in the survey population, This
data base allowed for a more efficient process overall, reducing the labor involved with
cleaning data.
Working with the Data
As discussed in Chapters 2 and 3, the FERC staff used the 2012 FERC Survey to estimate
advanced metering penetration rate and potential peak reduction. The following discussion
describes the analysis undertaken by the FERC staff and Z, Inc.’s subcontractor DNV
KEMA, who was responsible for the analysis.
Advanced Metering
The FERC staff developed estimates of the penetration rate of national and regional
advanced metering required by Congress at the national, regional, and state levels, as well as
by load serving entity type. These estimates were to reflect the full universe of entities in the
United States that own electricity meters for retail. The FERC Survey population
encompasses all such entities. As such, the primary data source of the estimates produced is
the set of respondent data from the 2012 FERC Survey. Some entities in the FERC Survey
did not respond, requiring statistical estimation of advanced metering penetration in their
retail service territories so that the estimates account for the whole survey population.
The approach taken by DNV KEMA was to make statistically informed imputations of the
number of customers, advanced meters, and total meters for non-responding entities
leveraging related published information from the 2011 preliminary Form EIA-861 Survey
2012 Assessment of Demand Response and Advanced Metering Federal Energy Regulatory Commission 77
and FERC Survey. The Form EIA-861 Survey file 2 contains customer counts at the entity
level by customer class, which is highly correlated with total meter counts, a FERC Survey
item. Other FERC Survey items – customer counts and advanced meters – have direct
counterparts in the Form EIA-861 Survey. For the “other” customer class (i.e., retail
customers not classified as residential, commercial, or industrial), there is not a comparable
field in the Form EIA-861 Survey from which to link to the 2012 FERC Survey. For this
customer class balance group, the 2010 FERC Survey was used as the source of missing
data.152
When an entity did not respond to the 2012 FERC Survey at all, or responded but did not
provide a valid entry for the number of advanced meters for a customer class, DNV KEMA
used direct substitution of an entity’s advanced meters by sector from the reported value by
that entity in the 2011 Form EIA-861 Survey. Having the 2011 Form EIA-861 Survey
preliminary database available for comparison was valuable because both surveys collected
2011 summary information. If the sector-level advanced meter count for an entity was not
available in the preliminary 2011 Form EIA-861 Survey database made available to DNV
KEMA for this analysis, the imputation methodology from the 2010 FERC Survey analysis
was used, with updated databases supporting it.
Having access to the preliminary 2011 Form EIA-861 Survey database was valuable also
because it contains fields for both advanced and AMR meters. DNV KEMA developed an
editing procedure to identify instances where it appeared likely that the respondent was
misreporting AMR meters as advanced meters in the 2012 FERC Survey.
The logic used in the editing procedure started with computing the percent difference in
advanced meters between the 2012 FERC Survey and the 2011 Form EIA-861 Survey and
the percent difference between the meters in the 2012 FERC Survey advanced metering and
the Form EIA-861 Survey AMR meter count. If an entity did not provide an advanced meter
count on the Form EIA-861 Survey but did provide a count for AMR meters, and the AMR
meter count was within 50 percent of the reported advanced meter count on the 2012 FERC
Survey, DNV KEMA edited the advanced metering value. The 2012 FERC survey was set
to zero since the entity likely misreported an AMR meter count which does not meet the
FERC definition of advanced metering.
If the entity reported meter counts for both AMI and AMR on the Form EIA-861 Survey, and
the 2012 FERC Survey advanced meter count was found to be significantly closer to the sum
of the AMR and AMI meter totals than just the AMI meters on the Form EIA-861, the
determination was that the respondent likely included both AMI and AMR meters on the
2012 FERC Survey, when it should have only included AMI meters. In these instances, the
Form EIA-861 total AMI meters were used in the analysis.
Demand Response
The FERC Survey responses were extrapolated to estimate the demand response for the
entire FERC Survey population by imputing survey answers for nonrespondents using an
152
A secondary data source field that is used directly or following a statistical modification, in place of a
missing value on the FERC Survey, is referred to as a “donor variable”.
Federal Energy Regulatory Commission 2012 Assessment of Demand Response and Advanced Metering 78
imputation method that limits the bias introduced. The DNV KEMA approach for
imputation utilized direct substitution of responses by the entity for comparable survey items
(same survey year and identical or nearly identical wording and/or response categorization)
from related surveys when such responses are available. When direct substitution was not
available, responses from identical or closely related questions of past survey years were
utilized, with a class-level growth rate multiplier applied. Classes were defined according to
customer sector and size exactly as is documented in the 2010 report.
For potential peak reduction, the imputation process below was implemented for the tables
supporting figures 4.12 and 4.13, which give estimated potential MW by entity type, NERC
region, and customer sector.
If an entity did not provide potential peak reduction in the 2012 FERC Survey, data on
potential peak reduction from the 2011 Form EIA-861 was used. However, since the Form
EIA-861 data only contains potential peak reduction at the entity/sector level, but not by state
or demand response program type, imputations were made at this entity/sector level, not at
the state or program type level. If there was no response for potential peak reduction in the
2012 FERC survey response and an imputation was made with the EIA data, the potential
peak reduction value was assigned to the entity’s primary NERC region.
If an entity did not provide potential peak reduction either the 2012 FERC Survey or the
2011 Form EIA-861, but provided a response to the 2010 Form EIA-861 for this item, it was
multiplied by a the class-level growth rate between 2010 and 2011 and used as the imputed
value. If the customer sector for the demand response program was listed as “Other”, and the
entity did not provide potential peak reduction in the 2012 FERC Survey, the 2010 FERC
Survey response value multiplied by a class-level growth rate factor was used as the imputed
value. No imputation was used for wholesale potential peak reduction.
Eliminating Double-Counting in Wholesale Demand Response
The methodology used for tabulating wholesale potential peak reduction was designed to
identify and separate potential peak reduction that is solely wholesale in nature and is not
associated with any programs offered by retail entities (such as an investor-owned utility). If
a retail entity reported that 50 MW of potential peak reduction was enrolled in an ISO or
RTO wholesale market demand response program, the 50 MW may have also been included
in the ISO or RTO’s survey response. The 50 MW could be counted as both retail demand
response, since it was reported by a retail entity in Q8, and as wholesale demand response,
since it was reported by the ISO or RTO in its Q9 submission for wholesale entities. The 50
MW should be counted only once as either retail or wholesale. The FERC staff decision rule
for this and each prior survey has been to count it as retail demand response.
To accomplish this, DNV KEMA merged the enrolled potential demand response reported by
retail entities in Q8 with the Q9 reports by wholesale entities as negative values of the same
magnitude. In principle, the tabulation of the combined values would give the final
wholesale potential demand response. This, however, does not work because ISO/RTOs
classify their demand response programs by purpose, such as load as a capacity resource or
emergency demand response, while retail entities generally classify programs according to

2012 Assessment of Demand Response and Advanced Metering Federal Energy Regulatory Commission 79
the mechanism employed for reducing load, such as an air conditioner or water heater direct
load control program, or according to the contract agreement with a large commercial or
industrial customer. To align the programs to reduce double counting, DNV KEMA
reclassified the program type listed for retail entities to match the program type listed by the
ISO or RTO market program that the retail program was enrolled in. Note that the retail
program types were only recategorized in this step for the enrolled potential demand
response for the purpose of eliminating double counting. The entity’s response for potential
peak reduction by sector was according to the original program type in their response.

Federal Energy Regulatory Commission 2012 Assessment of Demand Response and Advanced Metering 80
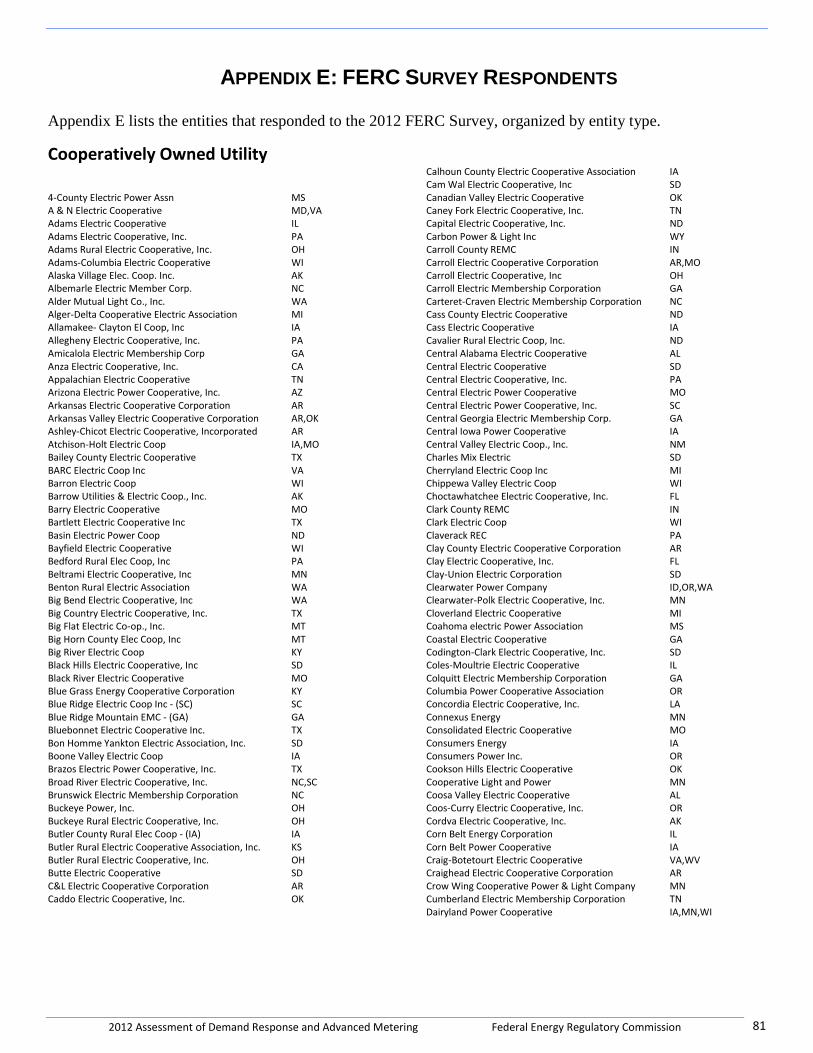
2012 Assessment of Demand Response and Advanced Metering Federal Energy Regulatory Commission 81
APPENDIX E: FERC SURVEY RESPONDENTS
Appendix E lists the entities that responded to the 2012 FERC Survey, organized by entity type.
Cooperatively Owned Utility Calhoun County Electric Cooperative Association IA Cam Wal Electric Cooperative, Inc SD 4-County Electric Power Assn MS Canadian Valley Electric Cooperative OK A & N Electric Cooperative MD,VA Caney Fork Electric Cooperative, Inc. TN Adams Electric Cooperative IL Capital Electric Cooperative, Inc. ND Adams Electric Cooperative, Inc. PA Carbon Power & Light Inc WY Adams Rural Electric Cooperative, Inc. OH Carroll County REMC IN Adams-Columbia Electric Cooperative WI Carroll Electric Cooperative Corporation AR,MO Alaska Village Elec. Coop. Inc. AK Carroll Electric Cooperative, Inc OH Albemarle Electric Member Corp. NC Carroll Electric Membership Corporation GA Alder Mutual Light Co., Inc. WA Carteret-Craven Electric Membership Corporation NC Alger-Delta Cooperative Electric Association MI Cass County Electric Cooperative ND Allamakee- Clayton El Coop, Inc IA Cass Electric Cooperative IA Allegheny Electric Cooperative, Inc. PA Cavalier Rural Electric Coop, Inc. ND Amicalola Electric Membership Corp GA Central Alabama Electric Cooperative AL Anza Electric Cooperative, Inc. CA Central Electric Cooperative SD Appalachian Electric Cooperative TN Central Electric Cooperative, Inc. PA Arizona Electric Power Cooperative, Inc. AZ Central Electric Power Cooperative MO Arkansas Electric Cooperative Corporation AR Central Electric Power Cooperative, Inc. SC Arkansas Valley Electric Cooperative Corporation AR,OK Central Georgia Electric Membership Corp. GA Ashley-Chicot Electric Cooperative, Incorporated AR Central Iowa Power Cooperative IA Atchison-Holt Electric Coop IA,MO Central Valley Electric Coop., Inc. NM Bailey County Electric Cooperative TX Charles Mix Electric SD BARC Electric Coop Inc VA Cherryland Electric Coop Inc MI Barron Electric Coop WI Chippewa Valley Electric Coop WI Barrow Utilities & Electric Coop., Inc. AK Choctawhatchee Electric Cooperative, Inc. FL Barry Electric Cooperative MO Clark County REMC IN Bartlett Electric Cooperative Inc TX Clark Electric Coop WI Basin Electric Power Coop ND Claverack REC PA Bayfield Electric Cooperative WI Clay County Electric Cooperative Corporation AR Bedford Rural Elec Coop, Inc PA Clay Electric Cooperative, Inc. FL Beltrami Electric Cooperative, Inc MN Clay-Union Electric Corporation SD Benton Rural Electric Association WA Clearwater Power Company ID,OR,WA Big Bend Electric Cooperative, Inc WA Clearwater-Polk Electric Cooperative, Inc. MN Big Country Electric Cooperative, Inc. TX Cloverland Electric Cooperative MI Big Flat Electric Co-op., Inc. MT Coahoma electric Power Association MS Big Horn County Elec Coop, Inc MT Coastal Electric Cooperative GA Big River Electric Coop KY Codington-Clark Electric Cooperative, Inc. SD Black Hills Electric Cooperative, Inc SD Coles-Moultrie Electric Cooperative IL Black River Electric Cooperative MO Colquitt Electric Membership Corporation GA Blue Grass Energy Cooperative Corporation KY Columbia Power Cooperative Association OR Blue Ridge Electric Coop Inc - (SC) SC Concordia Electric Cooperative, Inc. LA Blue Ridge Mountain EMC - (GA) GA Connexus Energy MN Bluebonnet Electric Cooperative Inc. TX Consolidated Electric Cooperative MO Bon Homme Yankton Electric Association, Inc. SD Consumers Energy IA Boone Valley Electric Coop IA Consumers Power Inc. OR Brazos Electric Power Cooperative, Inc. TX Cookson Hills Electric Cooperative OK Broad River Electric Cooperative, Inc. NC,SC Cooperative Light and Power MN Brunswick Electric Membership Corporation NC Coosa Valley Electric Cooperative AL Buckeye Power, Inc. OH Coos-Curry Electric Cooperative, Inc. OR Buckeye Rural Electric Cooperative, Inc. OH Cordva Electric Cooperative, Inc. AK Butler County Rural Elec Coop - (IA) IA Corn Belt Energy Corporation IL Butler Rural Electric Cooperative Association, Inc. KS Corn Belt Power Cooperative IA Butler Rural Electric Cooperative, Inc. OH Craig-Botetourt Electric Cooperative VA,WV Butte Electric Cooperative SD Craighead Electric Cooperative Corporation AR C&L Electric Cooperative Corporation AR Crow Wing Cooperative Power & Light Company MN Caddo Electric Cooperative, Inc. OK Cumberland Electric Membership Corporation TN Dairyland Power Cooperative IA,MN,WI
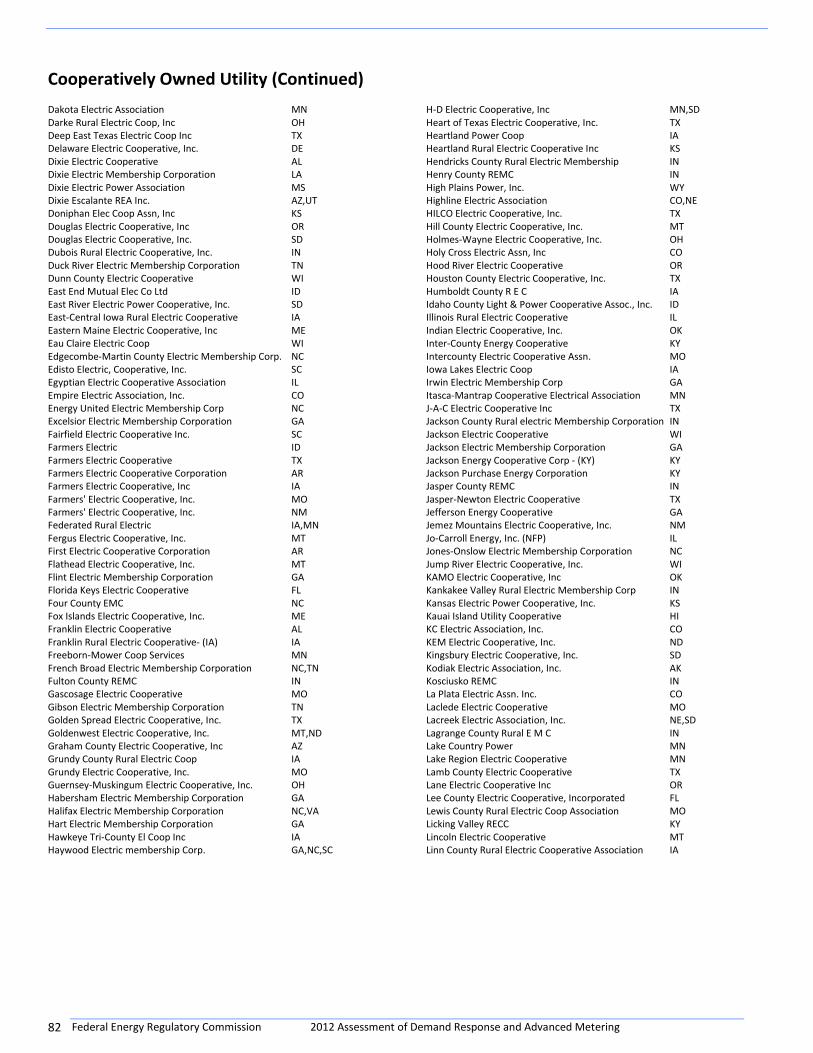
Federal Energy Regulatory Commission 2012 Assessment of Demand Response and Advanced Metering 82
Cooperatively Owned Utility (Continued)
Dakota Electric Association MN H-D Electric Cooperative, Inc MN,SD Darke Rural Electric Coop, Inc OH Heart of Texas Electric Cooperative, Inc. TX Deep East Texas Electric Coop Inc TX Heartland Power Coop IA Delaware Electric Cooperative, Inc. DE Heartland Rural Electric Cooperative Inc KS Dixie Electric Cooperative AL Hendricks County Rural Electric Membership IN Dixie Electric Membership Corporation LA Henry County REMC IN Dixie Electric Power Association MS High Plains Power, Inc. WY Dixie Escalante REA Inc. AZ,UT Highline Electric Association CO,NE Doniphan Elec Coop Assn, Inc KS HILCO Electric Cooperative, Inc. TX Douglas Electric Cooperative, Inc OR Hill County Electric Cooperative, Inc. MT Douglas Electric Cooperative, Inc. SD Holmes-Wayne Electric Cooperative, Inc. OH Dubois Rural Electric Cooperative, Inc. IN Holy Cross Electric Assn, Inc CO Duck River Electric Membership Corporation TN Hood River Electric Cooperative OR Dunn County Electric Cooperative WI Houston County Electric Cooperative, Inc. TX East End Mutual Elec Co Ltd ID Humboldt County R E C IA East River Electric Power Cooperative, Inc. SD Idaho County Light & Power Cooperative Assoc., Inc. ID East-Central Iowa Rural Electric Cooperative IA Illinois Rural Electric Cooperative IL Eastern Maine Electric Cooperative, Inc ME Indian Electric Cooperative, Inc. OK Eau Claire Electric Coop WI Inter-County Energy Cooperative KY Edgecombe-Martin County Electric Membership Corp. NC Intercounty Electric Cooperative Assn. MO Edisto Electric, Cooperative, Inc. SC Iowa Lakes Electric Coop IA Egyptian Electric Cooperative Association IL Irwin Electric Membership Corp GA Empire Electric Association, Inc. CO Itasca-Mantrap Cooperative Electrical Association MN Energy United Electric Membership Corp NC J-A-C Electric Cooperative Inc TX Excelsior Electric Membership Corporation GA Jackson County Rural electric Membership Corporation IN Fairfield Electric Cooperative Inc. SC Jackson Electric Cooperative WI Farmers Electric ID Jackson Electric Membership Corporation GA Farmers Electric Cooperative TX Jackson Energy Cooperative Corp - (KY) KY Farmers Electric Cooperative Corporation AR Jackson Purchase Energy Corporation KY Farmers Electric Cooperative, Inc IA Jasper County REMC IN Farmers' Electric Cooperative, Inc. MO Jasper-Newton Electric Cooperative TX Farmers' Electric Cooperative, Inc. NM Jefferson Energy Cooperative GA Federated Rural Electric IA,MN Jemez Mountains Electric Cooperative, Inc. NM Fergus Electric Cooperative, Inc. MT Jo-Carroll Energy, Inc. (NFP) IL First Electric Cooperative Corporation AR Jones-Onslow Electric Membership Corporation NC Flathead Electric Cooperative, Inc. MT Jump River Electric Cooperative, Inc. WI Flint Electric Membership Corporation GA KAMO Electric Cooperative, Inc OK Florida Keys Electric Cooperative FL Kankakee Valley Rural Electric Membership Corp IN Four County EMC NC Kansas Electric Power Cooperative, Inc. KS Fox Islands Electric Cooperative, Inc. ME Kauai Island Utility Cooperative HI Franklin Electric Cooperative AL KC Electric Association, Inc. CO Franklin Rural Electric Cooperative- (IA) IA KEM Electric Cooperative, Inc. ND Freeborn-Mower Coop Services MN Kingsbury Electric Cooperative, Inc. SD French Broad Electric Membership Corporation NC,TN Kodiak Electric Association, Inc. AK Fulton County REMC IN Kosciusko REMC IN Gascosage Electric Cooperative MO La Plata Electric Assn. Inc. CO Gibson Electric Membership Corporation TN Laclede Electric Cooperative MO Golden Spread Electric Cooperative, Inc. TX Lacreek Electric Association, Inc. NE,SD Goldenwest Electric Cooperative, Inc. MT,ND Lagrange County Rural E M C IN Graham County Electric Cooperative, Inc AZ Lake Country Power MN Grundy County Rural Electric Coop IA Lake Region Electric Cooperative MN Grundy Electric Cooperative, Inc. MO Lamb County Electric Cooperative TX Guernsey-Muskingum Electric Cooperative, Inc. OH Lane Electric Cooperative Inc OR Habersham Electric Membership Corporation GA Lee County Electric Cooperative, Incorporated FL Halifax Electric Membership Corporation NC,VA Lewis County Rural Electric Coop Association MO Hart Electric Membership Corporation GA Licking Valley RECC KY Hawkeye Tri-County El Coop Inc IA Lincoln Electric Cooperative MT Haywood Electric membership Corp. GA,NC,SC Linn County Rural Electric Cooperative Association IA
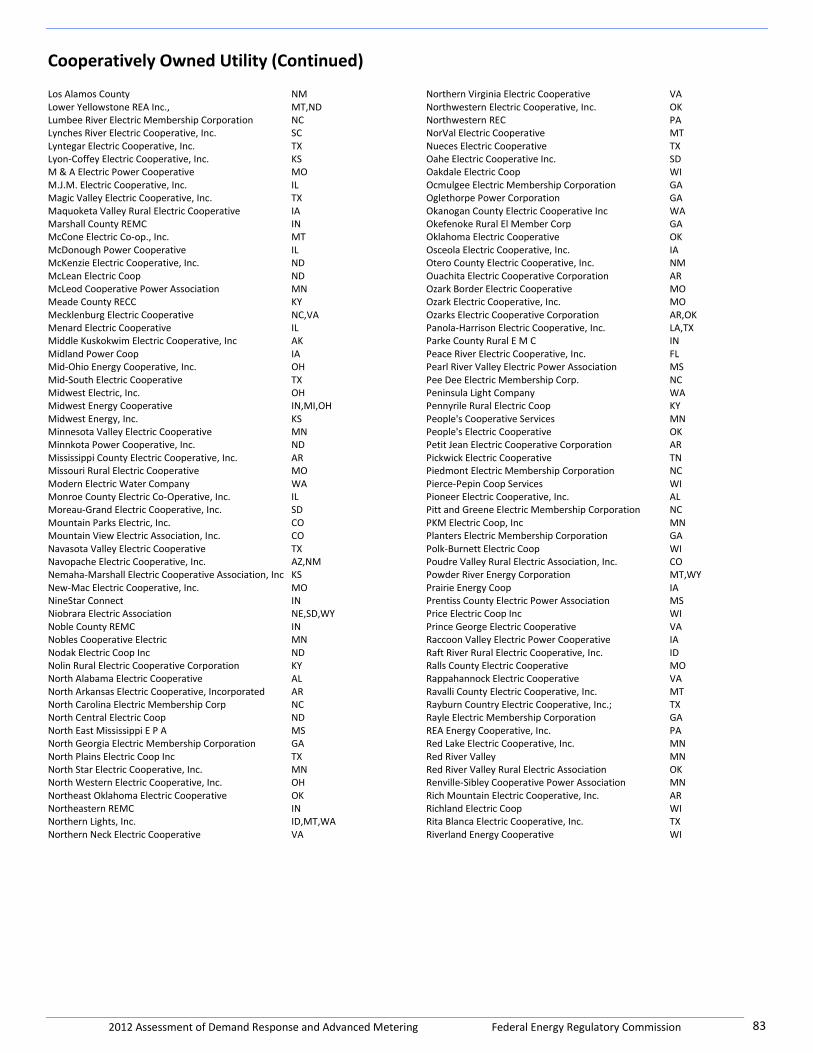
2012 Assessment of Demand Response and Advanced Metering Federal Energy Regulatory Commission 83
Cooperatively Owned Utility (Continued)
Los Alamos County NM Northern Virginia Electric Cooperative VA Lower Yellowstone REA Inc., MT,ND Northwestern Electric Cooperative, Inc. OK Lumbee River Electric Membership Corporation NC Northwestern REC PA Lynches River Electric Cooperative, Inc. SC NorVal Electric Cooperative MT Lyntegar Electric Cooperative, Inc. TX Nueces Electric Cooperative TX Lyon-Coffey Electric Cooperative, Inc. KS Oahe Electric Cooperative Inc. SD M & A Electric Power Cooperative MO Oakdale Electric Coop WI M.J.M. Electric Cooperative, Inc. IL Ocmulgee Electric Membership Corporation GA Magic Valley Electric Cooperative, Inc. TX Oglethorpe Power Corporation GA Maquoketa Valley Rural Electric Cooperative IA Okanogan County Electric Cooperative Inc WA Marshall County REMC IN Okefenoke Rural El Member Corp GA McCone Electric Co-op., Inc. MT Oklahoma Electric Cooperative OK McDonough Power Cooperative IL Osceola Electric Cooperative, Inc. IA McKenzie Electric Cooperative, Inc. ND Otero County Electric Cooperative, Inc. NM McLean Electric Coop ND Ouachita Electric Cooperative Corporation AR McLeod Cooperative Power Association MN Ozark Border Electric Cooperative MO Meade County RECC KY Ozark Electric Cooperative, Inc. MO Mecklenburg Electric Cooperative NC,VA Ozarks Electric Cooperative Corporation AR,OK Menard Electric Cooperative IL Panola-Harrison Electric Cooperative, Inc. LA,TX Middle Kuskokwim Electric Cooperative, Inc AK Parke County Rural E M C IN Midland Power Coop IA Peace River Electric Cooperative, Inc. FL Mid-Ohio Energy Cooperative, Inc. OH Pearl River Valley Electric Power Association MS Mid-South Electric Cooperative TX Pee Dee Electric Membership Corp. NC Midwest Electric, Inc. OH Peninsula Light Company WA Midwest Energy Cooperative IN,MI,OH Pennyrile Rural Electric Coop KY Midwest Energy, Inc. KS People's Cooperative Services MN Minnesota Valley Electric Cooperative MN People's Electric Cooperative OK Minnkota Power Cooperative, Inc. ND Petit Jean Electric Cooperative Corporation AR Mississippi County Electric Cooperative, Inc. AR Pickwick Electric Cooperative TN Missouri Rural Electric Cooperative MO Piedmont Electric Membership Corporation NC Modern Electric Water Company WA Pierce-Pepin Coop Services WI Monroe County Electric Co-Operative, Inc. IL Pioneer Electric Cooperative, Inc. AL Moreau-Grand Electric Cooperative, Inc. SD Pitt and Greene Electric Membership Corporation NC Mountain Parks Electric, Inc. CO PKM Electric Coop, Inc MN Mountain View Electric Association, Inc. CO Planters Electric Membership Corporation GA Navasota Valley Electric Cooperative TX Polk-Burnett Electric Coop WI Navopache Electric Cooperative, Inc. AZ,NM Poudre Valley Rural Electric Association, Inc. CO Nemaha-Marshall Electric Cooperative Association, Inc KS Powder River Energy Corporation MT,WY New-Mac Electric Cooperative, Inc. MO Prairie Energy Coop IA NineStar Connect IN Prentiss County Electric Power Association MS Niobrara Electric Association NE,SD,WY Price Electric Coop Inc WI Noble County REMC IN Prince George Electric Cooperative VA Nobles Cooperative Electric MN Raccoon Valley Electric Power Cooperative IA Nodak Electric Coop Inc ND Raft River Rural Electric Cooperative, Inc. ID Nolin Rural Electric Cooperative Corporation KY Ralls County Electric Cooperative MO North Alabama Electric Cooperative AL Rappahannock Electric Cooperative VA North Arkansas Electric Cooperative, Incorporated AR Ravalli County Electric Cooperative, Inc. MT North Carolina Electric Membership Corp NC Rayburn Country Electric Cooperative, Inc.; TX North Central Electric Coop ND Rayle Electric Membership Corporation GA North East Mississippi E P A MS REA Energy Cooperative, Inc. PA North Georgia Electric Membership Corporation GA Red Lake Electric Cooperative, Inc. MN North Plains Electric Coop Inc TX Red River Valley MN North Star Electric Cooperative, Inc. MN Red River Valley Rural Electric Association OK North Western Electric Cooperative, Inc. OH Renville-Sibley Cooperative Power Association MN Northeast Oklahoma Electric Cooperative OK Rich Mountain Electric Cooperative, Inc. AR Northeastern REMC IN Richland Electric Coop WI Northern Lights, Inc. ID,MT,WA Rita Blanca Electric Cooperative, Inc. TX Northern Neck Electric Cooperative VA Riverland Energy Cooperative WI
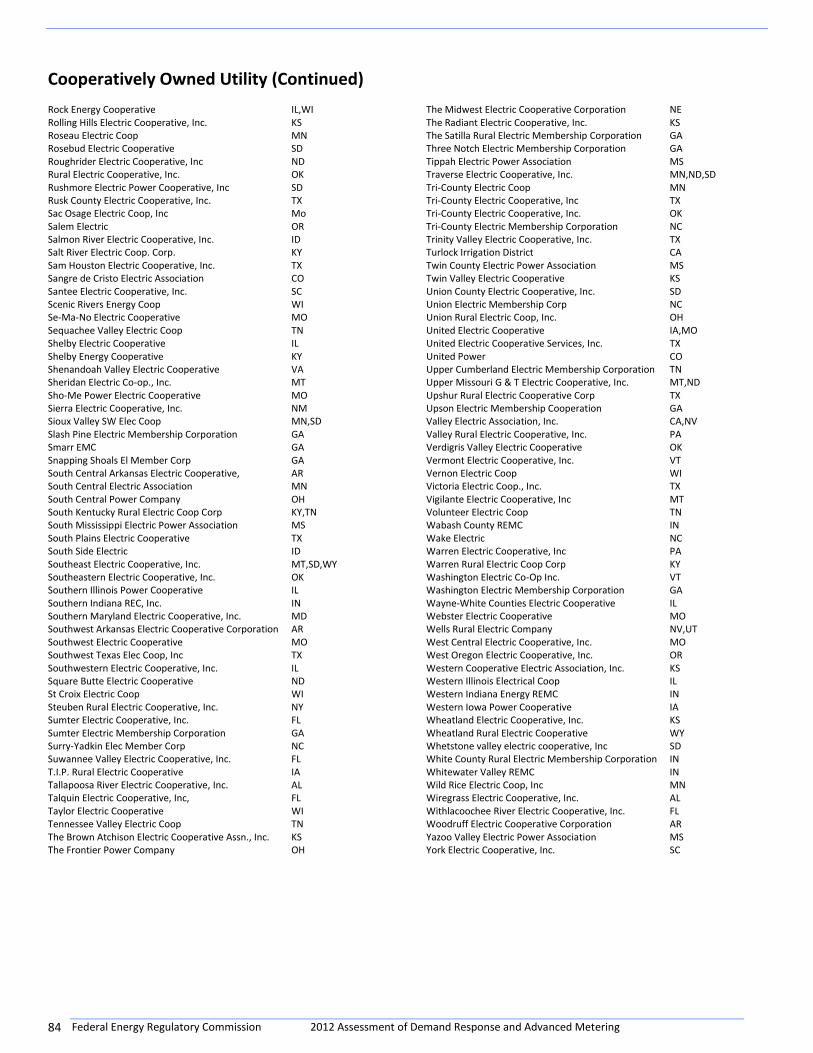
Federal Energy Regulatory Commission 2012 Assessment of Demand Response and Advanced Metering 84
Cooperatively Owned Utility (Continued)
Rock Energy Cooperative IL,WI The Midwest Electric Cooperative Corporation NE Rolling Hills Electric Cooperative, Inc. KS The Radiant Electric Cooperative, Inc. KS Roseau Electric Coop MN The Satilla Rural Electric Membership Corporation GA Rosebud Electric Cooperative SD Three Notch Electric Membership Corporation GA Roughrider Electric Cooperative, Inc ND Tippah Electric Power Association MS Rural Electric Cooperative, Inc. OK Traverse Electric Cooperative, Inc. MN,ND,SD Rushmore Electric Power Cooperative, Inc SD Tri-County Electric Coop MN Rusk County Electric Cooperative, Inc. TX Tri-County Electric Cooperative, Inc TX Sac Osage Electric Coop, Inc Mo Tri-County Electric Cooperative, Inc. OK Salem Electric OR Tri-County Electric Membership Corporation NC Salmon River Electric Cooperative, Inc. ID Trinity Valley Electric Cooperative, Inc. TX Salt River Electric Coop. Corp. KY Turlock Irrigation District CA Sam Houston Electric Cooperative, Inc. TX Twin County Electric Power Association MS Sangre de Cristo Electric Association CO Twin Valley Electric Cooperative KS Santee Electric Cooperative, Inc. SC Union County Electric Cooperative, Inc. SD Scenic Rivers Energy Coop WI Union Electric Membership Corp NC Se-Ma-No Electric Cooperative MO Union Rural Electric Coop, Inc. OH Sequachee Valley Electric Coop TN United Electric Cooperative IA,MO Shelby Electric Cooperative IL United Electric Cooperative Services, Inc. TX Shelby Energy Cooperative KY United Power CO Shenandoah Valley Electric Cooperative VA Upper Cumberland Electric Membership Corporation TN Sheridan Electric Co-op., Inc. MT Upper Missouri G & T Electric Cooperative, Inc. MT,ND Sho-Me Power Electric Cooperative MO Upshur Rural Electric Cooperative Corp TX Sierra Electric Cooperative, Inc. NM Upson Electric Membership Cooperation GA Sioux Valley SW Elec Coop MN,SD Valley Electric Association, Inc. CA,NV Slash Pine Electric Membership Corporation GA Valley Rural Electric Cooperative, Inc. PA Smarr EMC GA Verdigris Valley Electric Cooperative OK Snapping Shoals El Member Corp GA Vermont Electric Cooperative, Inc. VT South Central Arkansas Electric Cooperative, AR Vernon Electric Coop WI South Central Electric Association MN Victoria Electric Coop., Inc. TX South Central Power Company OH Vigilante Electric Cooperative, Inc MT South Kentucky Rural Electric Coop Corp KY,TN Volunteer Electric Coop TN South Mississippi Electric Power Association MS Wabash County REMC IN South Plains Electric Cooperative TX Wake Electric NC South Side Electric ID Warren Electric Cooperative, Inc PA Southeast Electric Cooperative, Inc. MT,SD,WY Warren Rural Electric Coop Corp KY Southeastern Electric Cooperative, Inc. OK Washington Electric Co-Op Inc. VT Southern Illinois Power Cooperative IL Washington Electric Membership Corporation GA Southern Indiana REC, Inc. IN Wayne-White Counties Electric Cooperative IL Southern Maryland Electric Cooperative, Inc. MD Webster Electric Cooperative MO Southwest Arkansas Electric Cooperative Corporation AR Wells Rural Electric Company NV,UT Southwest Electric Cooperative MO West Central Electric Cooperative, Inc. MO Southwest Texas Elec Coop, Inc TX West Oregon Electric Cooperative, Inc. OR Southwestern Electric Cooperative, Inc. IL Western Cooperative Electric Association, Inc. KS Square Butte Electric Cooperative ND Western Illinois Electrical Coop IL St Croix Electric Coop WI Western Indiana Energy REMC IN Steuben Rural Electric Cooperative, Inc. NY Western Iowa Power Cooperative IA Sumter Electric Cooperative, Inc. FL Wheatland Electric Cooperative, Inc. KS Sumter Electric Membership Corporation GA Wheatland Rural Electric Cooperative WY Surry-Yadkin Elec Member Corp NC Whetstone valley electric cooperative, Inc SD Suwannee Valley Electric Cooperative, Inc. FL White County Rural Electric Membership Corporation IN T.I.P. Rural Electric Cooperative IA Whitewater Valley REMC IN Tallapoosa River Electric Cooperative, Inc. AL Wild Rice Electric Coop, Inc MN Talquin Electric Cooperative, Inc, FL Wiregrass Electric Cooperative, Inc. AL Taylor Electric Cooperative WI Withlacoochee River Electric Cooperative, Inc. FL Tennessee Valley Electric Coop TN Woodruff Electric Cooperative Corporation AR The Brown Atchison Electric Cooperative Assn., Inc. KS Yazoo Valley Electric Power Association MS The Frontier Power Company OH York Electric Cooperative, Inc. SC
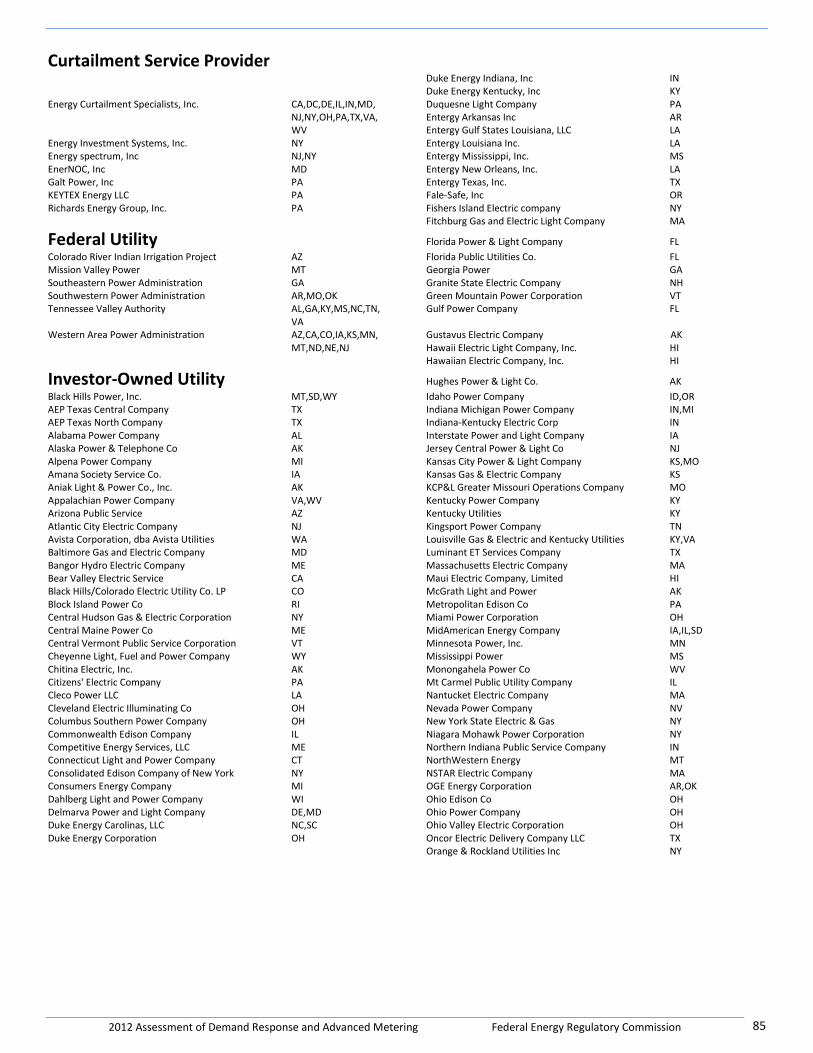
2012 Assessment of Demand Response and Advanced Metering Federal Energy Regulatory Commission 85
Curtailment Service Provider Duke Energy Indiana, Inc IN Duke Energy Kentucky, Inc KY Energy Curtailment Specialists, Inc. CA,DC,DE,IL,IN,MD, Duquesne Light Company PA NJ,NY,OH,PA,TX,VA, Entergy Arkansas Inc AR WV Entergy Gulf States Louisiana, LLC LA Energy Investment Systems, Inc. NY Entergy Louisiana Inc. LA Energy spectrum, Inc NJ,NY Entergy Mississippi, Inc. MS EnerNOC, Inc MD Entergy New Orleans, Inc. LA Galt Power, Inc PA Entergy Texas, Inc. TX KEYTEX Energy LLC PA Fale-Safe, Inc OR Richards Energy Group, Inc. PA Fishers Island Electric company NY Fitchburg Gas and Electric Light Company MA
Federal Utility Florida Power & Light Company FL Colorado River Indian Irrigation Project AZ Florida Public Utilities Co. FL Mission Valley Power MT Georgia Power GA Southeastern Power Administration GA Granite State Electric Company NH Southwestern Power Administration AR,MO,OK Green Mountain Power Corporation VT Tennessee Valley Authority AL,GA,KY,MS,NC,TN, Gulf Power Company FL VA Western Area Power Administration AZ,CA,CO,IA,KS,MN, Gustavus Electric Company AK MT,ND,NE,NJ Hawaii Electric Light Company, Inc. HI Hawaiian Electric Company, Inc. HI
Investor-Owned Utility Hughes Power & Light Co. AK Black Hills Power, Inc. MT,SD,WY Idaho Power Company ID,OR AEP Texas Central Company TX Indiana Michigan Power Company IN,MI AEP Texas North Company TX Indiana-Kentucky Electric Corp IN Alabama Power Company AL Interstate Power and Light Company IA Alaska Power & Telephone Co AK Jersey Central Power & Light Co NJ Alpena Power Company MI Kansas City Power & Light Company KS,MO Amana Society Service Co. IA Kansas Gas & Electric Company KS Aniak Light & Power Co., Inc. AK KCP&L Greater Missouri Operations Company MO Appalachian Power Company VA,WV Kentucky Power Company KY Arizona Public Service AZ Kentucky Utilities KY Atlantic City Electric Company NJ Kingsport Power Company TN Avista Corporation, dba Avista Utilities WA Louisville Gas & Electric and Kentucky Utilities KY,VA Baltimore Gas and Electric Company MD Luminant ET Services Company TX Bangor Hydro Electric Company ME Massachusetts Electric Company MA Bear Valley Electric Service CA Maui Electric Company, Limited HI Black Hills/Colorado Electric Utility Co. LP CO McGrath Light and Power AK Block Island Power Co RI Metropolitan Edison Co PA Central Hudson Gas & Electric Corporation NY Miami Power Corporation OH Central Maine Power Co ME MidAmerican Energy Company IA,IL,SD Central Vermont Public Service Corporation VT Minnesota Power, Inc. MN Cheyenne Light, Fuel and Power Company WY Mississippi Power MS Chitina Electric, Inc. AK Monongahela Power Co WV Citizens' Electric Company PA Mt Carmel Public Utility Company IL Cleco Power LLC LA Nantucket Electric Company MA Cleveland Electric Illuminating Co OH Nevada Power Company NV Columbus Southern Power Company OH New York State Electric & Gas NY Commonwealth Edison Company IL Niagara Mohawk Power Corporation NY Competitive Energy Services, LLC ME Northern Indiana Public Service Company IN Connecticut Light and Power Company CT NorthWestern Energy MT Consolidated Edison Company of New York NY NSTAR Electric Company MA Consumers Energy Company MI OGE Energy Corporation AR,OK Dahlberg Light and Power Company WI Ohio Edison Co OH Delmarva Power and Light Company DE,MD Ohio Power Company OH Duke Energy Carolinas, LLC NC,SC Ohio Valley Electric Corporation OH Duke Energy Corporation OH Oncor Electric Delivery Company LLC TX Orange & Rockland Utilities Inc NY
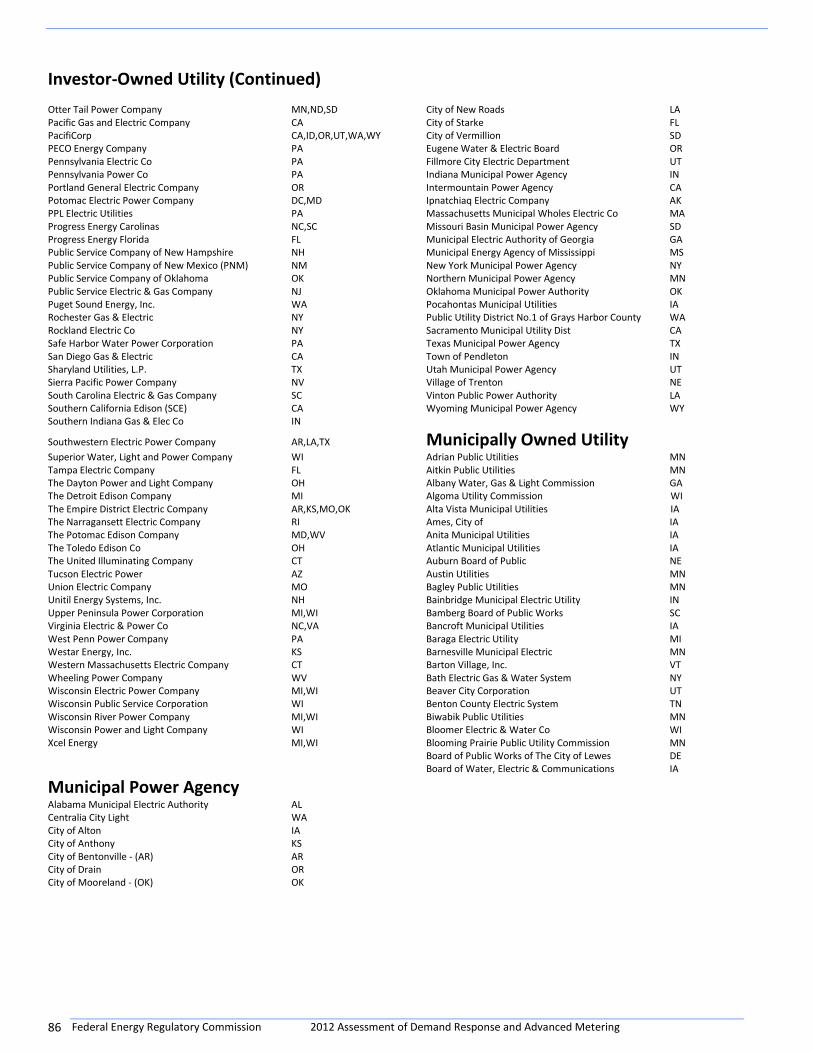
Federal Energy Regulatory Commission 2012 Assessment of Demand Response and Advanced Metering 86
Investor-Owned Utility (Continued)
Otter Tail Power Company MN,ND,SD City of New Roads LA Pacific Gas and Electric Company CA City of Starke FL PacifiCorp CA,ID,OR,UT,WA,WY City of Vermillion SD PECO Energy Company PA Eugene Water & Electric Board OR Pennsylvania Electric Co PA Fillmore City Electric Department UT Pennsylvania Power Co PA Indiana Municipal Power Agency IN Portland General Electric Company OR Intermountain Power Agency CA Potomac Electric Power Company DC,MD Ipnatchiaq Electric Company AK PPL Electric Utilities PA Massachusetts Municipal Wholes Electric Co MA Progress Energy Carolinas NC,SC Missouri Basin Municipal Power Agency SD Progress Energy Florida FL Municipal Electric Authority of Georgia GA Public Service Company of New Hampshire NH Municipal Energy Agency of Mississippi MS Public Service Company of New Mexico (PNM) NM New York Municipal Power Agency NY Public Service Company of Oklahoma OK Northern Municipal Power Agency MN Public Service Electric & Gas Company NJ Oklahoma Municipal Power Authority OK Puget Sound Energy, Inc. WA Pocahontas Municipal Utilities IA Rochester Gas & Electric NY Public Utility District No.1 of Grays Harbor County WA Rockland Electric Co NY Sacramento Municipal Utility Dist CA Safe Harbor Water Power Corporation PA Texas Municipal Power Agency TX San Diego Gas & Electric CA Town of Pendleton IN Sharyland Utilities, L.P. TX Utah Municipal Power Agency UT Sierra Pacific Power Company NV Village of Trenton NE South Carolina Electric & Gas Company SC Vinton Public Power Authority LA Southern California Edison (SCE) CA Wyoming Municipal Power Agency WY Southern Indiana Gas & Elec Co IN
Southwestern Electric Power Company AR,LA,TX Municipally Owned Utility Superior Water, Light and Power Company WI Adrian Public Utilities MN Tampa Electric Company FL Aitkin Public Utilities MN The Dayton Power and Light Company OH Albany Water, Gas & Light Commission GA The Detroit Edison Company MI Algoma Utility Commission WI The Empire District Electric Company AR,KS,MO,OK Alta Vista Municipal Utilities IA The Narragansett Electric Company RI Ames, City of IA The Potomac Edison Company MD,WV Anita Municipal Utilities IA The Toledo Edison Co OH Atlantic Municipal Utilities IA The United Illuminating Company CT Auburn Board of Public NE Tucson Electric Power AZ Austin Utilities MN Union Electric Company MO Bagley Public Utilities MN Unitil Energy Systems, Inc. NH Bainbridge Municipal Electric Utility IN Upper Peninsula Power Corporation MI,WI Bamberg Board of Public Works SC Virginia Electric & Power Co NC,VA Bancroft Municipal Utilities IA West Penn Power Company PA Baraga Electric Utility MI Westar Energy, Inc. KS Barnesville Municipal Electric MN Western Massachusetts Electric Company CT Barton Village, Inc. VT Wheeling Power Company WV Bath Electric Gas & Water System NY Wisconsin Electric Power Company MI,WI Beaver City Corporation UT Wisconsin Public Service Corporation WI Benton County Electric System TN Wisconsin River Power Company MI,WI Biwabik Public Utilities MN Wisconsin Power and Light Company WI Bloomer Electric & Water Co WI Xcel Energy MI,WI Blooming Prairie Public Utility Commission MN Board of Public Works of The City of Lewes DE Board of Water, Electric & Communications IA
Municipal Power Agency Alabama Municipal Electric Authority AL Centralia City Light WA City of Alton IA City of Anthony KS City of Bentonville - (AR) AR City of Drain OR City of Mooreland - (OK) OK

2012 Assessment of Demand Response and Advanced Metering Federal Energy Regulatory Commission 87
Municipally Owned Utility (Continued)
Bolivar Energy Authority TN City of California MO Borough of Berlin (PA) PA City of Abbeville LA Borough of Butler- (NJ) NJ City of Abbeville- SC SC Borough of Ellwood City PA City of Aberdeen MS Borough of Ephrata PA City of Acworth GA Borough of Goldsboro PA City of Ada MN Borough of Grove City PA City of Adel GA Borough of Hatfield PA City of Afton IA Borough of Kutztown - (PA) PA City of Akron (IA) IA Borough of Lansdale PA City of Akutan AK Borough of Lavallette- (NJ) NJ City of Albany - (IL) IL Borough Of Lehighton PA City of Albany- (MO) MO Borough of Middletown PA City of Albemarle NC Borough of Mifflinburg PA City of Albion ID Borough of Mont Alto PA City of Alcoa Electric Department TN Borough of Olyphant- (PA) PA City of Alexander City AL Borough of Park Ridge - (NJ) NJ City of Alexandria MN Borough of Pemberton NJ City of Algona IA Borough of Perkasie PA City Of Alma KS Borough of Pitcairn - (PA) PA City of Alpha MN Borough of Quakertown- (PA) PA City of Altamont IL Borough of Royalton PA City of Altamont - (KS) KS Borough of Schuylkill Haven - (PA) PA City of Anaheim Public Utilities Department CA Borough of Smethport PA City of Anoka MN Borough of South River (NJ) NJ City of Ansley NE Borough of St Clair- (PA) PA City of Anthon IA Borough of Tarentum (PA) PA City of Aplington IA Borough of Wampum PA City of Arapahoe NE Borough Watsontown (PA) PA City of Arcadia WI Boscobel Municipal Utilities WI City of Arcadia - (KS) KS Borough of Catawissa PA CITY OF ARLINGTON MN Borough of Duncannon PA City of Arma KS Bowling Green Municipal Utilities KY City of Ashland KS Boylston Municipal Light Department MA City of Athens AL Brainerd Public Utilities MN City of Atka AK Braintree Electric Light Department (BELD) MA City of Auburn (IA) IA Bremen Electric Light & Power Co IN City of Auburn Electric Utility IN Brigham City Corporation UT City of Augusta KS Bristol Virginia Utilities VA City of Ava (MO) MO Brodhead Water & Light Commission WI City of Axtell KS Brooklyn Municipal Utilities IA City of Azusa CA Brownfield Power & Light TX City of Blackwell OK Brownsville Public Utilities Board TX City of Baldwin City Kansas KS Brownsville Utility Department TN City of Bandon OR Burlington Electric Department VT City of Banning CA Cairo Public Utility Company IL City oF Bartlett, Texas TX Canby Utility Board OR City of Bartow FL Canton Municipal Utilities MS City of Bastrop TX Carrollton Board of Public Works MO City of Batavia IL Cascade Municipal Utilities IA City of Baudette MN Cedarburg Light & Water Commission WI City of Beaver City NE Centerville Municipal Power & Light IN City of Bedford, Virginia VA Centuria Municipal Electric Utility WI City of Bellville (TX) TX Chicopee Municipal Lighting Plant MA City of Benham KY Chillicothe Municipal Utility MO City of Benkelman NE City & Borough of Sitka, Electric Department AK City of Benton - (AR) AR City & County of San Francisco CA City of Berea Municipal Utility KY City of Hickman KY City Of Beresford SD
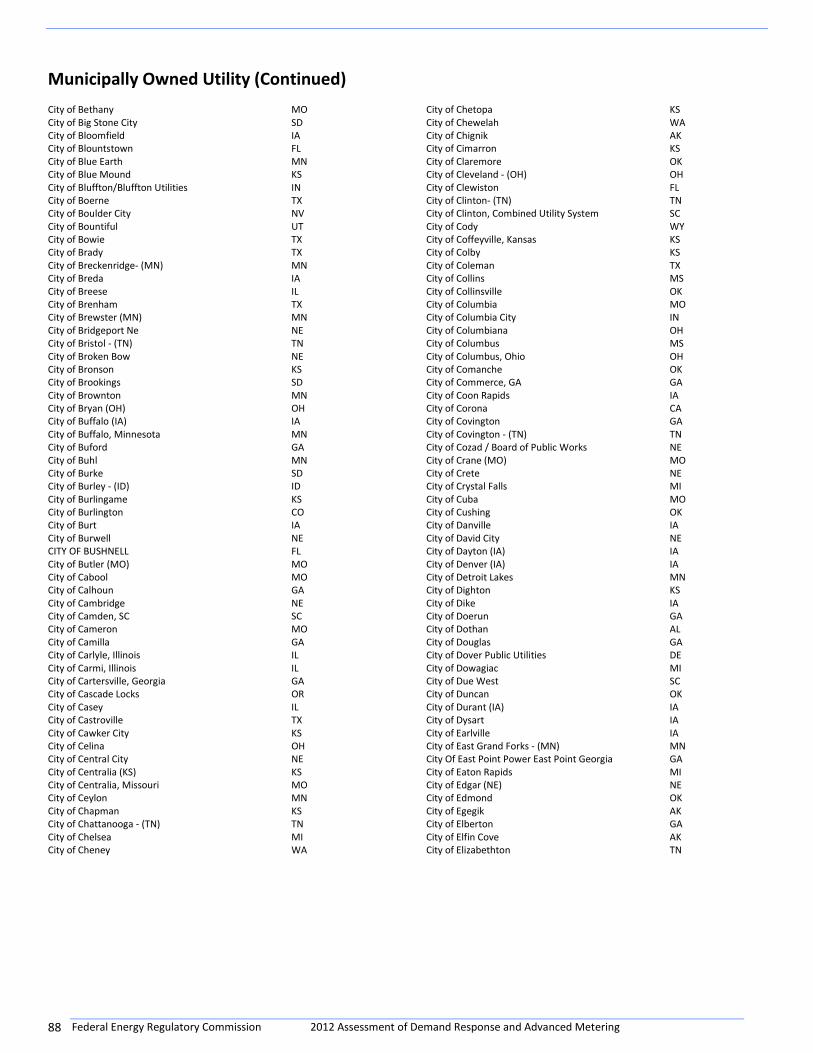
Federal Energy Regulatory Commission 2012 Assessment of Demand Response and Advanced Metering 88
Municipally Owned Utility (Continued)
City of Bethany MO City of Chetopa KS City of Big Stone City SD City of Chewelah WA City of Bloomfield IA City of Chignik AK City of Blountstown FL City of Cimarron KS City of Blue Earth MN City of Claremore OK City of Blue Mound KS City of Cleveland - (OH) OH City of Bluffton/Bluffton Utilities IN City of Clewiston FL City of Boerne TX City of Clinton- (TN) TN City of Boulder City NV City of Clinton, Combined Utility System SC City of Bountiful UT City of Cody WY City of Bowie TX City of Coffeyville, Kansas KS City of Brady TX City of Colby KS City of Breckenridge- (MN) MN City of Coleman TX City of Breda IA City of Collins MS City of Breese IL City of Collinsville OK City of Brenham TX City of Columbia MO City of Brewster (MN) MN City of Columbia City IN City of Bridgeport Ne NE City of Columbiana OH City of Bristol - (TN) TN City of Columbus MS City of Broken Bow NE City of Columbus, Ohio OH City of Bronson KS City of Comanche OK City of Brookings SD City of Commerce, GA GA City of Brownton MN City of Coon Rapids IA City of Bryan (OH) OH City of Corona CA City of Buffalo (IA) IA City of Covington GA City of Buffalo, Minnesota MN City of Covington - (TN) TN City of Buford GA City of Cozad / Board of Public Works NE City of Buhl MN City of Crane (MO) MO City of Burke SD City of Crete NE City of Burley - (ID) ID City of Crystal Falls MI City of Burlingame KS City of Cuba MO City of Burlington CO City of Cushing OK City of Burt IA City of Danville IA City of Burwell NE City of David City NE CITY OF BUSHNELL FL City of Dayton (IA) IA City of Butler (MO) MO City of Denver (IA) IA City of Cabool MO City of Detroit Lakes MN City of Calhoun GA City of Dighton KS City of Cambridge NE City of Dike IA City of Camden, SC SC City of Doerun GA City of Cameron MO City of Dothan AL City of Camilla GA City of Douglas GA City of Carlyle, Illinois IL City of Dover Public Utilities DE City of Carmi, Illinois IL City of Dowagiac MI City of Cartersville, Georgia GA City of Due West SC City of Cascade Locks OR City of Duncan OK City of Casey IL City of Durant (IA) IA City of Castroville TX City of Dysart IA City of Cawker City KS City of Earlville IA City of Celina OH City of East Grand Forks - (MN) MN City of Central City NE City Of East Point Power East Point Georgia GA City of Centralia (KS) KS City of Eaton Rapids MI City of Centralia, Missouri MO City of Edgar (NE) NE City of Ceylon MN City of Edmond OK City of Chapman KS City of Egegik AK City of Chattanooga - (TN) TN City of Elberton GA City of Chelsea MI City of Elfin Cove AK City of Cheney WA City of Elizabethton TN
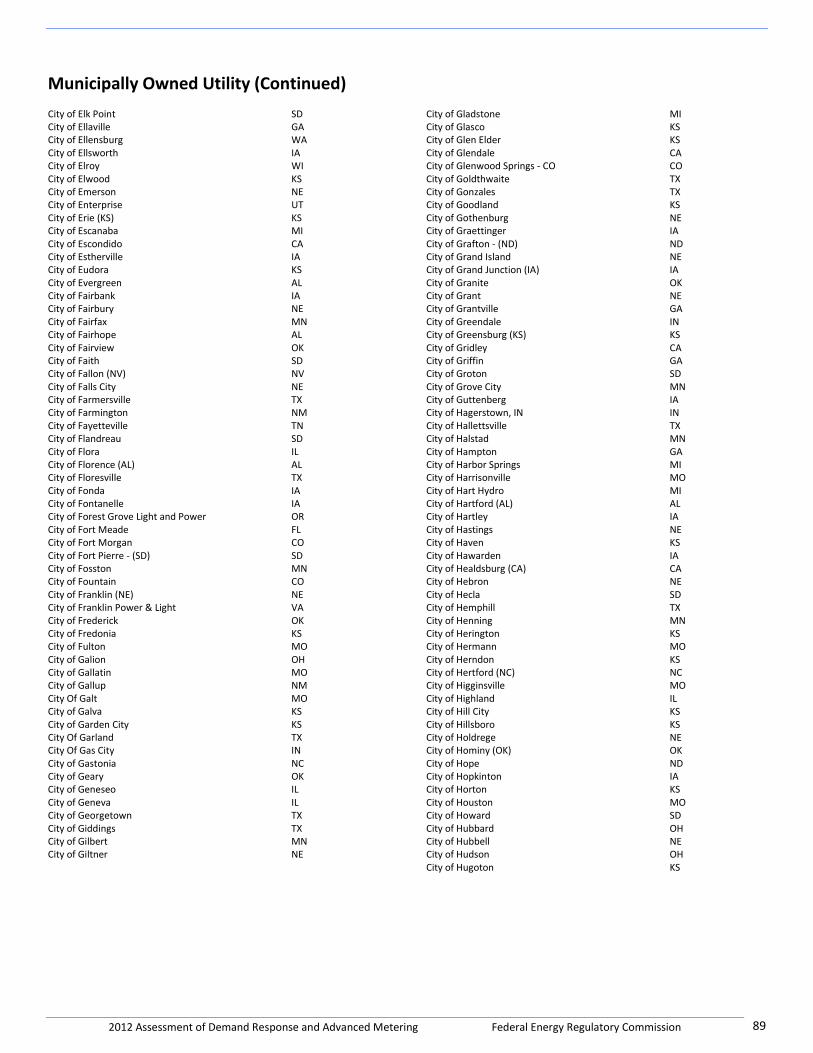
2012 Assessment of Demand Response and Advanced Metering Federal Energy Regulatory Commission 89
Municipally Owned Utility (Continued)
City of Elk Point SD City of Gladstone MI City of Ellaville GA City of Glasco KS City of Ellensburg WA City of Glen Elder KS City of Ellsworth IA City of Glendale CA City of Elroy WI City of Glenwood Springs - CO CO City of Elwood KS City of Goldthwaite TX City of Emerson NE City of Gonzales TX City of Enterprise UT City of Goodland KS City of Erie (KS) KS City of Gothenburg NE City of Escanaba MI City of Graettinger IA City of Escondido CA City of Grafton - (ND) ND City of Estherville IA City of Grand Island NE City of Eudora KS City of Grand Junction (IA) IA City of Evergreen AL City of Granite OK City of Fairbank IA City of Grant NE City of Fairbury NE City of Grantville GA City of Fairfax MN City of Greendale IN City of Fairhope AL City of Greensburg (KS) KS City of Fairview OK City of Gridley CA City of Faith SD City of Griffin GA City of Fallon (NV) NV City of Groton SD City of Falls City NE City of Grove City MN City of Farmersville TX City of Guttenberg IA City of Farmington NM City of Hagerstown, IN IN City of Fayetteville TN City of Hallettsville TX City of Flandreau SD City of Halstad MN City of Flora IL City of Hampton GA City of Florence (AL) AL City of Harbor Springs MI City of Floresville TX City of Harrisonville MO City of Fonda IA City of Hart Hydro MI City of Fontanelle IA City of Hartford (AL) AL City of Forest Grove Light and Power OR City of Hartley IA City of Fort Meade FL City of Hastings NE City of Fort Morgan CO City of Haven KS City of Fort Pierre - (SD) SD City of Hawarden IA City of Fosston MN City of Healdsburg (CA) CA City of Fountain CO City of Hebron NE City of Franklin (NE) NE City of Hecla SD City of Franklin Power & Light VA City of Hemphill TX City of Frederick OK City of Henning MN City of Fredonia KS City of Herington KS City of Fulton MO City of Hermann MO City of Galion OH City of Herndon KS City of Gallatin MO City of Hertford (NC) NC City of Gallup NM City of Higginsville MO City Of Galt MO City of Highland IL City of Galva KS City of Hill City KS City of Garden City KS City of Hillsboro KS City Of Garland TX City of Holdrege NE City Of Gas City IN City of Hominy (OK) OK City of Gastonia NC City of Hope ND City of Geary OK City of Hopkinton IA City of Geneseo IL City of Horton KS City of Geneva IL City of Houston MO City of Georgetown TX City of Howard SD City of Giddings TX City of Hubbard OH City of Gilbert MN City of Hubbell NE City of Giltner NE City of Hudson OH City of Hugoton KS
Federal Energy Regulatory Commission 2012 Assessment of Demand Response and Advanced Metering 90
Municipally Owned Utility (Continued)
City of Hunnewell MO City of Liberty TX City of Huntingburg - (IN) IN City of Lincoln Center KS City of Imperial NE City of Lincoln Electric System NE City of Indianola NE CITY OF LINDSAY OK City of Isabel (KS) KS City of Lindsborg KS City of Itta Bena MS City of Linneus (MO) MO City of Iuka KS City of Litchfield Public Utilities MN City of Jackson GA City of Livermore IA City of Jackson (OH) OH City of Livingston TX City of Jacksonville Beach FL City of Lockhart TX City of Janesville MN City of Lodgepole (NE) NE City of Jasper, TX TX City of Lodi CA City of Jetmore KS City of Lompoc CA City of Jonesville (LA) LA City of Long Grove (IA) IA City of Kahoka MO City of Lowell MI City of Kandiyohi MN City of Lucas KS City of Kansas City KS City of Luray (KS) KS City of Kasson MN City of Luverne MN City of Kennett MO CITY OF LYONS NE City of Kiel WI City of Mabel (MN) MN City of Kimball NE City of Maddock ND City of Kingfisher OK City of Madison (MN) MN City of Kings Mountain NC City of Madison (NE) NE City of Kiowa (KS) KS City of Malden (MO) Board of Public Works MO City of Kirkwood (MO) MO City of Mangum (OK) OK City of La Crosse KS City of Manitou (OK) OK City of La Grange TX City of Mankato KS City of La Grange (GA) GA City of Manokotak AK City of La Plata MO City of Mansfield MO City of Lafayette AL City of Mansfield (GA) GA City of Lake City Electric Utility MN City of Mapleton IA City of Lake Crystal (MN) MN City of Marathon IA City of Lake Mills IA City of Marietta (GA) GA City of Lake Park- (IA) IA City of Marion KS City of Lake View IA City of Marshall IL City of Lake Worth Utilities FL City of Marshall, Michigan MI City of Lakefield MN City of Marshfield WI City of Lakeland, Lakeland Electric FL City of Martinsville Electric Department VA City of Lakota ND City of Mascoutah IL City of Lamar MO City of Mason TX City of Lamar- (Colorado) CO City of McLeansboro IL City of Lampasas (TX) TX City of McMinnville (OR) OR City of Lanett AL City of Meade KS City of Larchwood IA City of Meadville MO City of Larned KS City of Memphis (MO) MO City of Larsen Bay AK City of Mendon - (OH) OH City of Las Animas Municipal Light & Power CO City of Mesa AZ City of Laurel (NE) NE City of Milan TN City of Laurens IA City of Milan (MO) MO City of Laurinburg NC City of Milford DE City of Lawler (IA) IA City of Milford (IA) IA City of Lawrenceville GA City of Miller (SD) SD City of Le Sueur (MN) MN City of Milton WA City of Lebanon OH City of Minden LA City of Lehigh IA City of Minden (NE) NE City of Lenox (IA) IA City of Mindenmines (MO) MO City of Lexington NE City of Mindoka (ID) ID City of Liberal MO City of Minneapolis (KS) KS
2012 Assessment of Demand Response and Advanced Metering Federal Energy Regulatory Commission 91
Municipally Owned Utility (Continued)
City of Mishawaka IN City of Osawatomie KS City of Monmouth OR City of Osborne KS City of Monroe GA City of Osceola MO City of Montezuma (IA) IA City of Osceola (AR) AR City of Montezuma (KS) KS City of Osford KS City of Monticello GA City of Oxford (GA) GA City of Moore Haven (FL) FL City of Painesville OH City of Mora (MN) MN City of Palo Alto Utilities CA City of Moran KS City of Paris (AR) AR City of Moreno Valley (CA) CA City of Paris (KY) KY City of Morrill KS City of Park River - (ND) ND City of Moultrie GA City of Pasadena CA City of Mount Dora FL City of Paton - (IA) IA City of Mount Hope (KS) KS City of Perry, MO. MO City of Mount Vernon MO City of Peterson MN City of Mountain Iron MN City of Petoskey MI City of Mountain Lake MN City of Piedmont AL City of Mountain View MO City of Pierce NE City of Mt Pleasant UT City of Pierre SD City of Mulberry (KS) KS City of Pierz MN City of Mulvane - - (KS) KS City of Piqua (OH) OH City of Murray UT City of Plainview (NE) NE City of Nashwauk MN City of Plaquemine (LA) LA City of Natchitoches LA City of Plattsburgh - (NY) NY City of Nebraska City NE City of Pomona (KS) KS City of Needles CA City of Poplar Bluff MO City of Neligh NE City of Port Angeles WA City of Neodesha (KS) KS City of Pratt (KS) KS City of Neola (IA) IA City of Preston IA City of New Braunfels - (TX) TX City of Princeton IL City of New Hampton (IA) IA City of Princeton (WI) WI City of New Lisbon Municipal Electric & Water Dept. WI City of Pryor (OK) OK City of New Madrid (MO) MO City of Purcell OK City of New Ross IN City of Quitman GA City of Newberry, Florida FL City of Radford - Electric Department VA City of Newburg (MO) MO City of Radium KS City of Newkirk OK City of Rancho Cucamonga CA City of Newton IL City of Randall MN City of Nicholasville KY City of Randolph (NE) NE City of Nielsville MN City of Rayne LA City of Niles (MI) MI City of Readlyn (IA) IA City of Nixa Utilities MO City of Red Cloud NE City of North Saint Paul MN City of Redding CA City of Northwood ND City of Renwick (IA) IA City Of Norton Kansas KS City of Richland WA City of Norway Dept. of Power & Light MI City of Rising Sun (IN) IN City of Oberlin (KS) KS City of Riverdale ND City of Ocala Utility Services FL City of Robertsdale AL City of Odessa MO City of Robinson KS City of Oglesby (IL) IL City of Rock Hill SC City of Olivia (MN) MN City of Rockwood TN City of Onawa IA City of Roodhouse IL City of Onida (SD) SD City of Roseau MN City of Opelika AL City of Roseville CA City of Ord NE City of Round Lake MN City of Orient (IA) IA City of Rupert ID City of Ortonsville - (MN) MI City of Rushford MN City of Osage City KS City of Rushmore - (MN) MN
Federal Energy Regulatory Commission 2012 Assessment of Demand Response and Advanced Metering 92
Municipally Owned Utility (Continued)
City of Russell KS City of Strawberry Point IA City of Russell (MA) MA City of Stroud (OK) OK City of Ruston (LA) LA City of Stuart (NE) NE City of Sabula IA City of Sullivan MO City of Saint Peter MN City of Sumas WA City of Salamanca NY City of Superior (NE) NE City of Salem VA City of Sutton NE City of Sanborn IA City of Sylvania (GA) GA City of Sauk Centre MN City of Syracuse NE City of Schuyler (NE) NE City of Tallahassee Utilities FL City of Scranton KS City of Taunton MA City of Scribner NE City of Tecumseh NE City of Seaford DE City of Tenakee Springs AK City of Sebewaing (MI) MI City of Thayer MO City of Seguin TX City of Thief River Falls MN City of Seneca SC City of Timpson (TX) TX City of Seward (AK) AK City of Toronto (KS) KS City of Seymour (TX) TX City of Traverse City MI City of Shasta Lake CA City of Trenton (TN) TN City of Sheboygan Falls WI City of Trinidad CO City of Shelbina MO City of Troy KS City of Shelby (NC) NC City of Troy - (IN) IN City of Shelby (OH) OH City of Troy AL City of Sherrill Power & Light NY City of Tulia TX City of Shiner TX City of Tupelo - (MS) MS City of Shullsburg (WI) WI City of Tuskegee AL City of Sibley IA City of Two Harbors MN City of Sidney NE City of Tyler MN City of Siloam Springs (AR) AR City of Tyndall SD City of Sioux Falls (SD) SD City of Udall KS City of Slater MO City of Unalaska AK City of Smithville TX City of Union City TN City of Snyder NE City of Union SC City of Soda Springs ID City of Unionville MO City of South Sioux City NE City of Valentine NE City of Spring Grove MN City of Valley City ND City of Springfield CO City of Vandalia MO City of Springfield, IL IL City of Vermillion (KS) KS City of St Charles IL City of Versailles OH City of St Louis MI City of Virginia MN City Of St Marys KS City of Wadena Electric & Water MN City of St Robert (MO) MO City of Wakefield (NE) NE City of St. Charles MN City of Wall Lake IA City of St. Clairsville OH City of Wamego KS City of St. George UT City of Warren - (MN) MN City of St. James MN City Of Warroad MN City Of St. John KS City of Washington (IN) IN City of St. Marys OH City of Washington (KS) KS City of Stafford (KS) KS City of Washington GA City of Stanhope IA City of Waterloo IL City of Stanton ND City of Watertown NY City of Stanton (IA) IA City of Wathena KS City of Starkville MS City of Wauchula FL City of State Center IA City of Weiser ID City of Statesville (NC) NC City of Wellington KS City of Stephen - (MN) MN City of West Liberty IA City of Stephenson MI City of West Plains MO City of Stockton KS City of Westbrook MN
2012 Assessment of Demand Response and Advanced Metering Federal Energy Regulatory Commission 93
Municipally Owned Utility (Continued)
City of Westfield MA Gaffney Board of Public Works SC City of Whalan MN Gainesville Regional Utilities FL City of Whigham GA Galena Electric Utility AK City of White SD Gallatin Department of Electricity TN City of Whittemore IA Glasgow Electric Plant Board KY City of Wilber NE Glencoe Light and Power Commission MN City of Willow Springs MO Gold Country Energy AK City of Windom MN Goltry Public Works Authority OK City of Winfield (KS) KS Grafton Electric IA City of Winner SD Grand Haven Board of Light and Power MI City of Winnfield LA Green Cove Springs Electric Utility FL City of Winona MO Greenfield Municipal Utilities IA City of Winterset (IA) IA Greenwood Commissioners Public Works SC City of Winterville NC Greenwood Utilities MS City of Winthrop (MN) MN Groton Electric Light Dept. MA City of Wisner NE Grundy Center Mun. Light & Power IA City of Woolstock IA Harriman Utility Board TN City of Wrangell AK Harrisonburg Electric Commission VA City of Wray CO Hartford Utilities WI City of Wymore (NE) NE Havana Power & Light Company FL City of Yoakum, Texas TX Hawley Public Utilities MN City Utilities of Springfield, MO MO Heber Light & Power Company UT City Water & Light Plant of the City of Jonesboro AR Helper City UT City of Girard KS Henderson Power and Light KY Clarksdale Public Utilities MS Hermiston Energy Services OR Clarksville Light & Water Co AR Hibbing Public Utilities MN Clintonville Utilities WI Hingham Municipal Light Plant MA Colorado Springs Utilities CO Holland Board of Public Works MI Columbia Power & Water Systems TN Holy Springs Utility Department MS Columbus Water & Light Dept. WI Hooversville Electric Light Co PA Conway Corporation AR Hope Water and Light Commission AR Corbin City Utilities Commission KY Hopkinsville Electric System KY Corwith Municipal Utilities IA Hudson Light & Power Department MA Crawfordsville Electric Light & Power IN Hudson Municipal Electric Utility IA Cuba City Electric & Water Utility WI Hurricane City Power UT Cumberland, City of WI Hustisford Utilities WI Cuyahoga Falls Electric System OH Hutchinson Utilities Commission MN D.G. Hunter Power Station LA Hyrum City Corp. UT Darlington Light & Power Co IN Idaho Falls Power ID Delano Municipal Utilities MN Illinois Municipal Electric Agency IL Delta Municipal Light and Power CO Independence Light & Power IA Dublin Municipal Electric Utilities IN Indianola Municipal Utilities IA Eagle River Light & Water Commission WI Jamestown Board of Public Utilities NY Easley Combined Utility System SC JEA FL East Bay Municipal Utility District CA Jefferson Water & Light Dept. WI Easton Utilities Commission MD Jewett City Department of Public Utilities CT Ediburg Municipal Utilities IN Juneau Utility Commission WI Electric and Water Plant Board of the City of Frankfort KY Kaukauna Utilities WI Elk River Municipal Utilities MN Kaysville City Corporation UT Evansville Water & Light WI Keewatin Public Utilities MN Fairburn Utilities GA Kennebunk Light & Power District ME Fitzgerald Wtr Lgt GA Kenyon Municipal Utility MN Florence Utility Commission WI Kerrville Public Utility Board TX Foley Board of Utilities AL Ketchikan Public Utilities AK Forest City Municipal Utilities IA Kimballton Municipal Utilities IA Fort Collins Utilities CO Kirbyville Light & Power Co TX Fort Pierce Utilities Authority FL Kissimmee Utility Authority FL Fremont Department of Utilities NE Knoxville Utilities Board TN
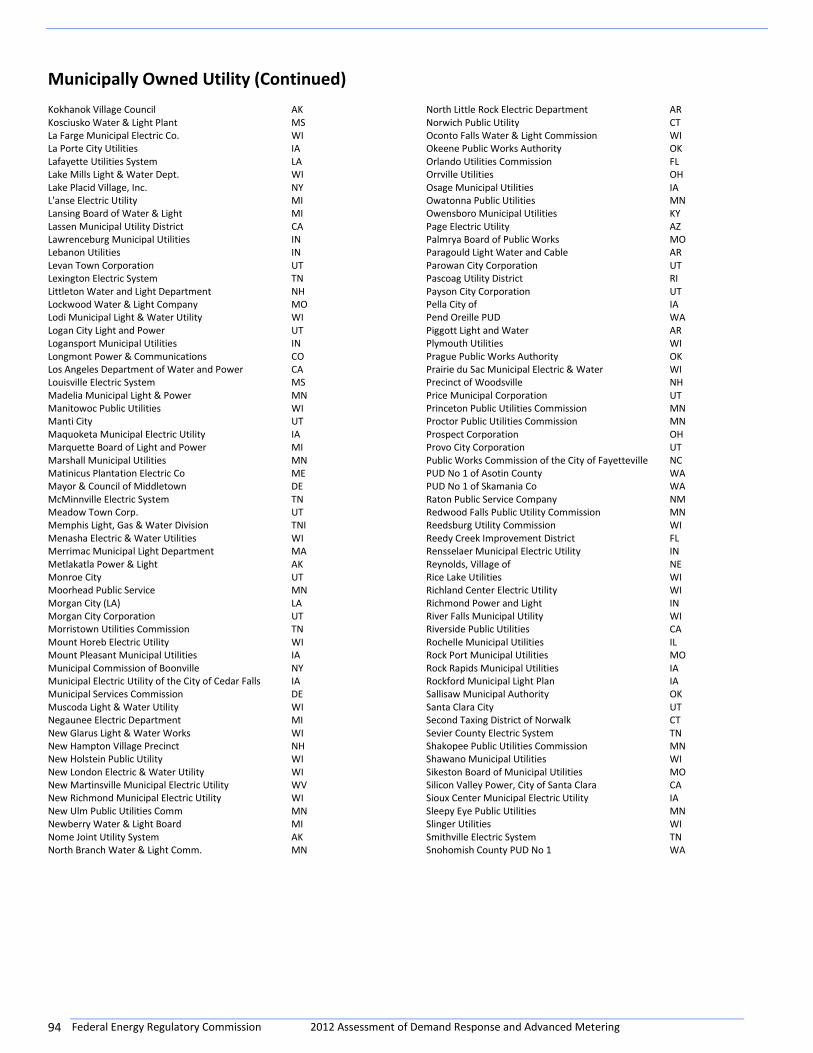
Federal Energy Regulatory Commission 2012 Assessment of Demand Response and Advanced Metering 94
Municipally Owned Utility (Continued)
Kokhanok Village Council AK North Little Rock Electric Department AR Kosciusko Water & Light Plant MS Norwich Public Utility CT La Farge Municipal Electric Co. WI Oconto Falls Water & Light Commission WI La Porte City Utilities IA Okeene Public Works Authority OK Lafayette Utilities System LA Orlando Utilities Commission FL Lake Mills Light & Water Dept. WI Orrville Utilities OH Lake Placid Village, Inc. NY Osage Municipal Utilities IA L'anse Electric Utility MI Owatonna Public Utilities MN Lansing Board of Water & Light MI Owensboro Municipal Utilities KY Lassen Municipal Utility District CA Page Electric Utility AZ Lawrenceburg Municipal Utilities IN Palmrya Board of Public Works MO Lebanon Utilities IN Paragould Light Water and Cable AR Levan Town Corporation UT Parowan City Corporation UT Lexington Electric System TN Pascoag Utility District RI Littleton Water and Light Department NH Payson City Corporation UT Lockwood Water & Light Company MO Pella City of IA Lodi Municipal Light & Water Utility WI Pend Oreille PUD WA Logan City Light and Power UT Piggott Light and Water AR Logansport Municipal Utilities IN Plymouth Utilities WI Longmont Power & Communications CO Prague Public Works Authority OK Los Angeles Department of Water and Power CA Prairie du Sac Municipal Electric & Water WI Louisville Electric System MS Precinct of Woodsville NH Madelia Municipal Light & Power MN Price Municipal Corporation UT Manitowoc Public Utilities WI Princeton Public Utilities Commission MN Manti City UT Proctor Public Utilities Commission MN Maquoketa Municipal Electric Utility IA Prospect Corporation OH Marquette Board of Light and Power MI Provo City Corporation UT Marshall Municipal Utilities MN Public Works Commission of the City of Fayetteville NC Matinicus Plantation Electric Co ME PUD No 1 of Asotin County WA Mayor & Council of Middletown DE PUD No 1 of Skamania Co WA McMinnville Electric System TN Raton Public Service Company NM Meadow Town Corp. UT Redwood Falls Public Utility Commission MN Memphis Light, Gas & Water Division TNI Reedsburg Utility Commission WI Menasha Electric & Water Utilities WI Reedy Creek Improvement District FL Merrimac Municipal Light Department MA Rensselaer Municipal Electric Utility IN Metlakatla Power & Light AK Reynolds, Village of NE Monroe City UT Rice Lake Utilities WI Moorhead Public Service MN Richland Center Electric Utility WI Morgan City (LA) LA Richmond Power and Light IN Morgan City Corporation UT River Falls Municipal Utility WI Morristown Utilities Commission TN Riverside Public Utilities CA Mount Horeb Electric Utility WI Rochelle Municipal Utilities IL Mount Pleasant Municipal Utilities IA Rock Port Municipal Utilities MO Municipal Commission of Boonville NY Rock Rapids Municipal Utilities IA Municipal Electric Utility of the City of Cedar Falls IA Rockford Municipal Light Plan IA Municipal Services Commission DE Sallisaw Municipal Authority OK Muscoda Light & Water Utility WI Santa Clara City UT Negaunee Electric Department MI Second Taxing District of Norwalk CT New Glarus Light & Water Works WI Sevier County Electric System TN New Hampton Village Precinct NH Shakopee Public Utilities Commission MN New Holstein Public Utility WI Shawano Municipal Utilities WI New London Electric & Water Utility WI Sikeston Board of Municipal Utilities MO New Martinsville Municipal Electric Utility WV Silicon Valley Power, City of Santa Clara CA New Richmond Municipal Electric Utility WI Sioux Center Municipal Electric Utility IA New Ulm Public Utilities Comm MN Sleepy Eye Public Utilities MN Newberry Water & Light Board MI Slinger Utilities WI Nome Joint Utility System AK Smithville Electric System TN North Branch Water & Light Comm. MN Snohomish County PUD No 1 WA

2012 Assessment of Demand Response and Advanced Metering Federal Energy Regulatory Commission 95
Municipally Owned Utility (Continued)
South Hadley Electric Light Department MA Town of Hobgood NC South Vienna Corporation OH Town of Ipswich MA Spanish Fork City Corporation UT Town of Julesburg CO Spencer Municipal Utilities IA Town of Kingsford Heights IN Spencerport Electric NY Town of Knightstown (Municipal Electric Utility) IN Spooner Municipal Utilities WI Town of Ladoga (IN) IN Spring Valley Public Utilities MN Town of Landis NC Springville Light & Power UT Town of Laverne- (OK) OK Stoughton Electric Utility WI Town of Lewisville IN Straughn Municipal Electric IN Town of Lucama NC Stuart Municipal Utilities IA Town of Lyons CO Sturgeon Bay Utilities WI Town of MacClesfield NC Sumner Municipal Light Plant IA Town of Madison (ME) ME Sun Prairie Water & Light Commission WI Town of Maiden (NC) NC Sylacauga Utilities Board AL Town of Manilla (IA) IA Tacoma Public Utilities WA Town of Mansfield (MA) MA TDX Manley Generating LLC AK Town of Massena Electric Department NY Tell City Electric Department IN Town of Middleborough (MA) MA The City of Holyoke Gas and Electric Department MA Town of Middletown-(IN) IN The Hagerstown Light Department MD Town of Montezuma IN Third Taxing District Electric Dept. CT Town of New Carlisle (IN) IN Tipton Municipal Electric Utility IN Town of Oak City UT Tipton Municipal Utilities IA Town of Paxton Municipal Light Department MA Town of Argos Utilities IN Town of Pinetops NC Town of Ashburnham MA Town of Pineville (NC) NC Town of Avilla IN Town of Princeton (MA) MA Town of Bargersville IN Town of Prosperity, SC SC Town of Belmont MA Town of Rowley (MA) MA Town of Black Creek NC Town of Ruston (WA) WA Town of Blackstone VA Town of Ryan (OK) OK Town of Bostic NC Town of Scotland Neck (NC) NC Town of Boyce LA Town of Sharpsburg NC Town of Brinson GA Town of South Whitley IN Town of Brooklyn IN Town of Spiceland IN Town of Clayton (NC) NC Town of Spiro OK Town of Coatesville IN Town of Stantonsburg NC Town of Coulee Dam WA Town of Stowe VT Town of Crane IN Town of Templeton (MA) MA Town of Culpeper Light & Power VA Town of Veedersburg IN Town of Dallas NC Town of Vidalia LA Town of Eatonville WA Town of Wakefield (VA) VA Town of Etna Green IN Town of Walkerton IN Town of Ferdinand IN Town of Wallingford, Department of Public Utilities CT Town of Forest City NC Town of Walstonburg NC Town of Fountain NC Town of Waynesville NC Town of Frankton IN Town of Winamac IN Town of Frederick CO Town of Winnsboro SC Town of Fredonia AZ Town of Wolfeboro NH Town of Front Royal VA Traer Municipal Utilities IA Town of Granada CO Trenton Municipal Utilities MO Town of Granite Falls NC Tullahoma Board of Public Utilities TN Town of Groveland MA Two Rivers Water & Light Utility WI Town of Guernsey WY Van Buren Light & Power District ME Town of Gueydan LA Village of Akron NY Town of Hardwick VT Village of Angelica NY Town of Haxtun CO Village of Arcade NY Town of High Point NC Village of Arcadia OH Town of Highlands NC Village of Arnold NE
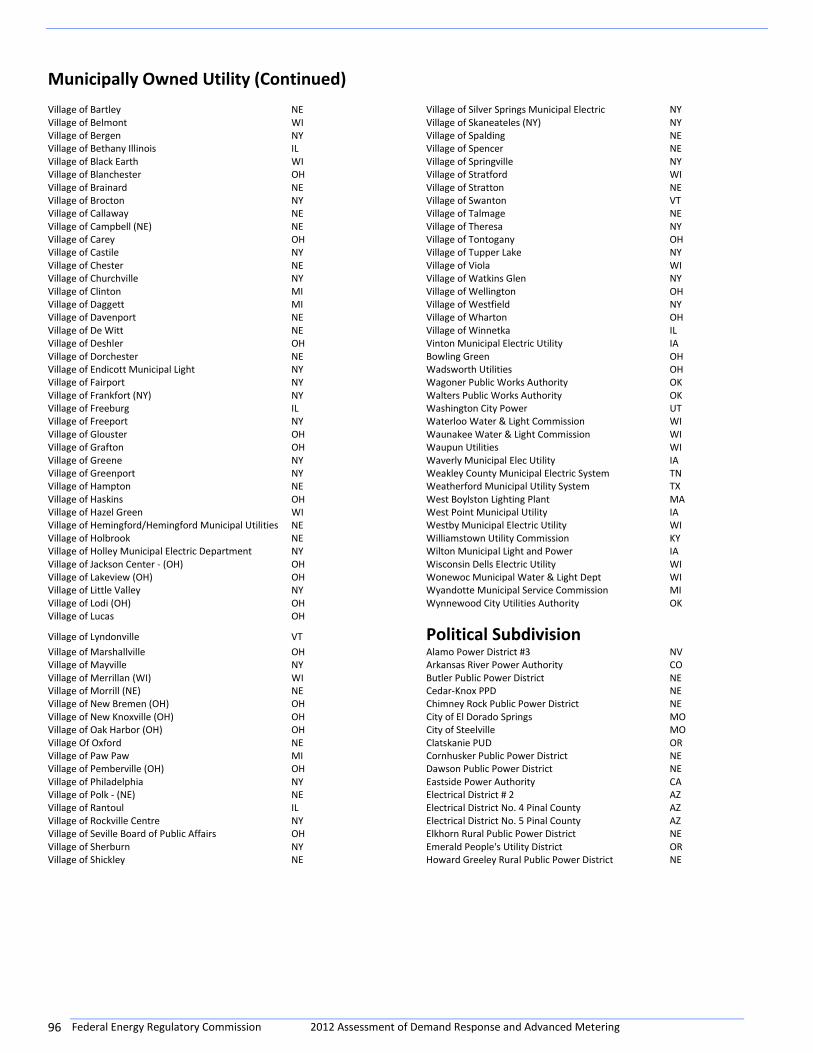
Federal Energy Regulatory Commission 2012 Assessment of Demand Response and Advanced Metering 96
Municipally Owned Utility (Continued)
Village of Bartley NE Village of Silver Springs Municipal Electric NY Village of Belmont WI Village of Skaneateles (NY) NY Village of Bergen NY Village of Spalding NE Village of Bethany Illinois IL Village of Spencer NE Village of Black Earth WI Village of Springville NY Village of Blanchester OH Village of Stratford WI Village of Brainard NE Village of Stratton NE Village of Brocton NY Village of Swanton VT Village of Callaway NE Village of Talmage NE Village of Campbell (NE) NE Village of Theresa NY Village of Carey OH Village of Tontogany OH Village of Castile NY Village of Tupper Lake NY Village of Chester NE Village of Viola WI Village of Churchville NY Village of Watkins Glen NY Village of Clinton MI Village of Wellington OH Village of Daggett MI Village of Westfield NY Village of Davenport NE Village of Wharton OH Village of De Witt NE Village of Winnetka IL Village of Deshler OH Vinton Municipal Electric Utility IA Village of Dorchester NE Bowling Green OH Village of Endicott Municipal Light NY Wadsworth Utilities OH Village of Fairport NY Wagoner Public Works Authority OK Village of Frankfort (NY) NY Walters Public Works Authority OK Village of Freeburg IL Washington City Power UT Village of Freeport NY Waterloo Water & Light Commission WI Village of Glouster OH Waunakee Water & Light Commission WI Village of Grafton OH Waupun Utilities WI Village of Greene NY Waverly Municipal Elec Utility IA Village of Greenport NY Weakley County Municipal Electric System TN Village of Hampton NE Weatherford Municipal Utility System TX Village of Haskins OH West Boylston Lighting Plant MA Village of Hazel Green WI West Point Municipal Utility IA Village of Hemingford/Hemingford Municipal Utilities NE Westby Municipal Electric Utility WI Village of Holbrook NE Williamstown Utility Commission KY Village of Holley Municipal Electric Department NY Wilton Municipal Light and Power IA Village of Jackson Center - (OH) OH Wisconsin Dells Electric Utility WI Village of Lakeview (OH) OH Wonewoc Municipal Water & Light Dept WI Village of Little Valley NY Wyandotte Municipal Service Commission MI Village of Lodi (OH) OH Wynnewood City Utilities Authority OK Village of Lucas OH
Village of Lyndonville VT Political Subdivision Village of Marshallville OH Alamo Power District #3 NV Village of Mayville NY Arkansas River Power Authority CO Village of Merrillan (WI) WI Butler Public Power District NE Village of Morrill (NE) NE Cedar-Knox PPD NE Village of New Bremen (OH) OH Chimney Rock Public Power District NE Village of New Knoxville (OH) OH City of El Dorado Springs MO Village of Oak Harbor (OH) OH City of Steelville MO Village Of Oxford NE Clatskanie PUD OR Village of Paw Paw MI Cornhusker Public Power District NE Village of Pemberville (OH) OH Dawson Public Power District NE Village of Philadelphia NY Eastside Power Authority CA Village of Polk - (NE) NE Electrical District # 2 AZ Village of Rantoul IL Electrical District No. 4 Pinal County AZ Village of Rockville Centre NY Electrical District No. 5 Pinal County AZ Village of Seville Board of Public Affairs OH Elkhorn Rural Public Power District NE Village of Sherburn NY Emerald People's Utility District OR Village of Shickley NE Howard Greeley Rural Public Power District NE
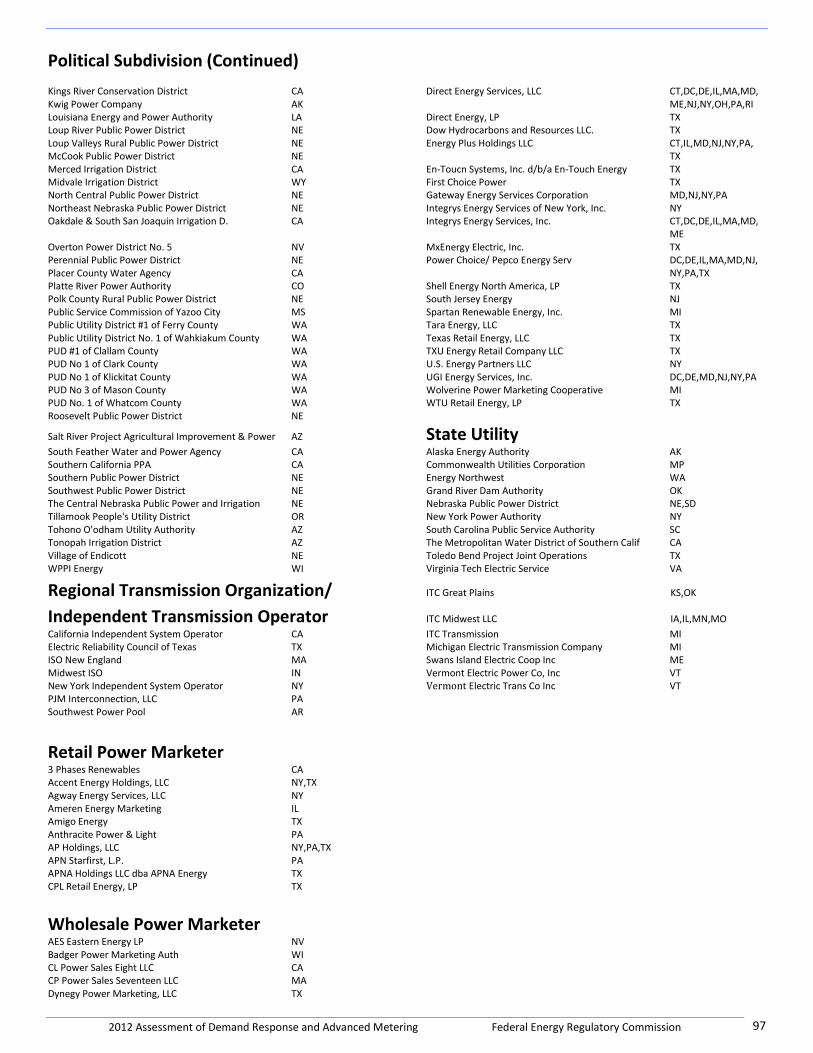
2012 Assessment of Demand Response and Advanced Metering Federal Energy Regulatory Commission 97
Political Subdivision (Continued)
Kings River Conservation District CA Direct Energy Services, LLC CT,DC,DE,IL,MA,MD, Kwig Power Company AK ME,NJ,NY,OH,PA,RI Louisiana Energy and Power Authority LA Direct Energy, LP TX Loup River Public Power District NE Dow Hydrocarbons and Resources LLC. TX Loup Valleys Rural Public Power District NE Energy Plus Holdings LLC CT,IL,MD,NJ,NY,PA, McCook Public Power District NE TX Merced Irrigation District CA En-Toucn Systems, Inc. d/b/a En-Touch Energy TX Midvale Irrigation District WY First Choice Power TX North Central Public Power District NE Gateway Energy Services Corporation MD,NJ,NY,PA Northeast Nebraska Public Power District NE Integrys Energy Services of New York, Inc. NY Oakdale & South San Joaquin Irrigation D. CA Integrys Energy Services, Inc. CT,DC,DE,IL,MA,MD, ME Overton Power District No. 5 NV MxEnergy Electric, Inc. TX Perennial Public Power District NE Power Choice/ Pepco Energy Serv DC,DE,IL,MA,MD,NJ, Placer County Water Agency CA NY,PA,TX Platte River Power Authority CO Shell Energy North America, LP TX Polk County Rural Public Power District NE South Jersey Energy NJ Public Service Commission of Yazoo City MS Spartan Renewable Energy, Inc. MI Public Utility District #1 of Ferry County WA Tara Energy, LLC TX Public Utility District No. 1 of Wahkiakum County WA Texas Retail Energy, LLC TX PUD #1 of Clallam County WA TXU Energy Retail Company LLC TX PUD No 1 of Clark County WA U.S. Energy Partners LLC NY PUD No 1 of Klickitat County WA UGI Energy Services, Inc. DC,DE,MD,NJ,NY,PA PUD No 3 of Mason County WA Wolverine Power Marketing Cooperative MI PUD No. 1 of Whatcom County WA WTU Retail Energy, LP TX Roosevelt Public Power District NE
Salt River Project Agricultural Improvement & Power AZ State Utility South Feather Water and Power Agency CA Alaska Energy Authority AK Southern California PPA CA Commonwealth Utilities Corporation MP Southern Public Power District NE Energy Northwest WA Southwest Public Power District NE Grand River Dam Authority OK The Central Nebraska Public Power and Irrigation NE Nebraska Public Power District NE,SD Tillamook People's Utility District OR New York Power Authority NY Tohono O'odham Utility Authority AZ South Carolina Public Service Authority SC Tonopah Irrigation District AZ The Metropolitan Water District of Southern Calif CA Village of Endicott NE Toledo Bend Project Joint Operations TX WPPI Energy WI Virginia Tech Electric Service VA
Regional Transmission Organization/ ITC Great Plains KS,OK
Independent Transmission Operator ITC Midwest LLC IA,IL,MN,MO
California Independent System Operator CA ITC Transmission MI Electric Reliability Council of Texas TX Michigan Electric Transmission Company MI ISO New England MA Swans Island Electric Coop Inc ME Midwest ISO IN Vermont Electric Power Co, Inc VT New York Independent System Operator NY Vermont Electric Trans Co Inc VT PJM Interconnection, LLC PA Southwest Power Pool AR
Retail Power Marketer 3 Phases Renewables CA Accent Energy Holdings, LLC NY,TX Agway Energy Services, LLC NY Ameren Energy Marketing IL Amigo Energy TX Anthracite Power & Light PA AP Holdings, LLC NY,PA,TX APN Starfirst, L.P. PA APNA Holdings LLC dba APNA Energy TX CPL Retail Energy, LP TX
Wholesale Power Marketer AES Eastern Energy LP NV Badger Power Marketing Auth WI CL Power Sales Eight LLC CA CP Power Sales Seventeen LLC MA Dynegy Power Marketing, LLC TX

Federal Energy Regulatory Commission 2012 Assessment of Demand Response and Advanced Metering 98
Edison Mission Marketing & Trading, Inc. - WSPP MA GenOn Energy Management, LLC FL,IL,MA,MD,MS,NJ,NY,OH,PA,TX,VA Great Bay Power Marketing, Inc. MA,ME,NH,NJ,NY,VT Guthrie County Rural Electric Cooperative IA H.Q. Energy Services (U.S.) Inc. CT JP Morgan TX Luminant Energy Company LLC TX Macquarie Energy LLC TX NextEra Energy Power Marketing, LLC FL PPL EnergyPlus LLC MT PSEG Energry Resources & Trade LLC NJ Rainbow Energy Marketing Corporation ND RRI Energy Services, LLC TX Select Energy, Inc. TX Sunflower Electric Power Corporation KS TransAlta Energy Marketing NY
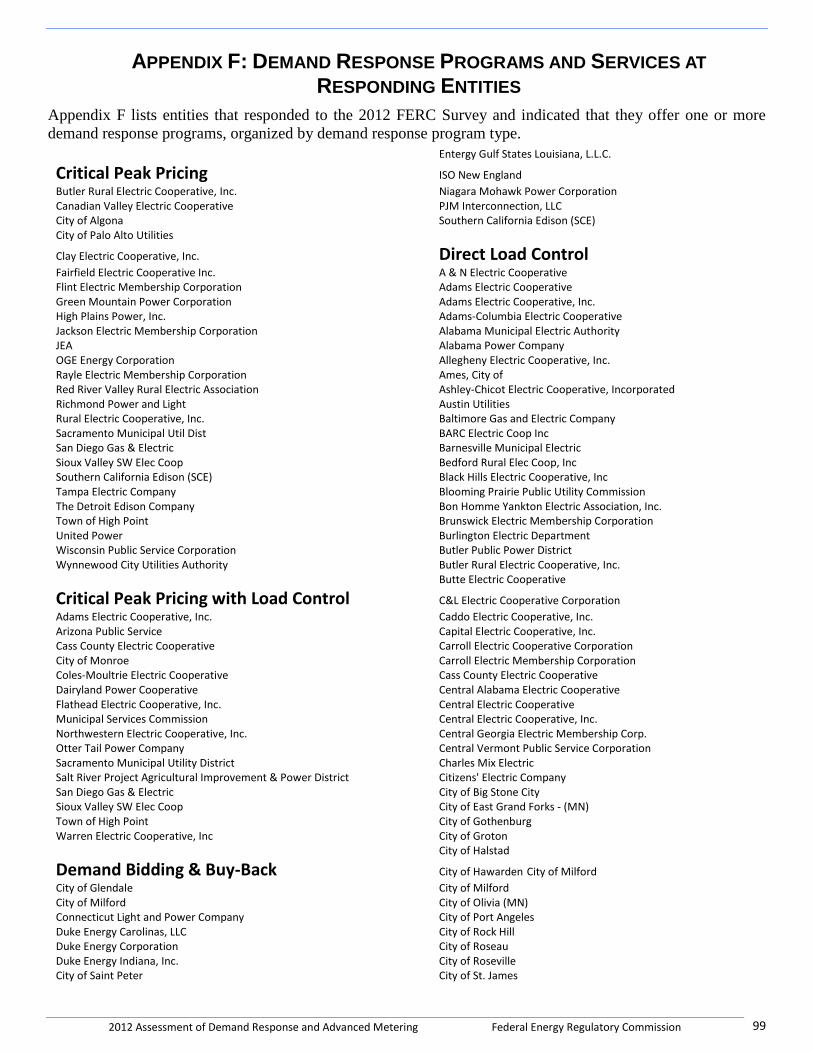
2012 Assessment of Demand Response and Advanced Metering Federal Energy Regulatory Commission 99
APPENDIX F: DEMAND RESPONSE PROGRAMS AND SERVICES AT
RESPONDING ENTITIES
Appendix F lists entities that responded to the 2012 FERC Survey and indicated that they offer one or more
demand response programs, organized by demand response program type.
Entergy Gulf States Louisiana, L.L.C.
Critical Peak Pricing ISO New England Butler Rural Electric Cooperative, Inc. Niagara Mohawk Power Corporation Canadian Valley Electric Cooperative PJM Interconnection, LLC City of Algona Southern California Edison (SCE) City of Palo Alto Utilities
Clay Electric Cooperative, Inc. Direct Load Control Fairfield Electric Cooperative Inc. A & N Electric Cooperative Flint Electric Membership Corporation Adams Electric Cooperative Green Mountain Power Corporation Adams Electric Cooperative, Inc. High Plains Power, Inc. Adams-Columbia Electric Cooperative Jackson Electric Membership Corporation Alabama Municipal Electric Authority JEA Alabama Power Company OGE Energy Corporation Allegheny Electric Cooperative, Inc. Rayle Electric Membership Corporation Ames, City of Red River Valley Rural Electric Association Ashley-Chicot Electric Cooperative, Incorporated Richmond Power and Light Austin Utilities Rural Electric Cooperative, Inc. Baltimore Gas and Electric Company Sacramento Municipal Util Dist BARC Electric Coop Inc San Diego Gas & Electric Barnesville Municipal Electric Sioux Valley SW Elec Coop Bedford Rural Elec Coop, Inc Southern California Edison (SCE) Black Hills Electric Cooperative, Inc Tampa Electric Company Blooming Prairie Public Utility Commission The Detroit Edison Company Bon Homme Yankton Electric Association, Inc. Town of High Point Brunswick Electric Membership Corporation United Power Burlington Electric Department Wisconsin Public Service Corporation Butler Public Power District Wynnewood City Utilities Authority Butler Rural Electric Cooperative, Inc. Butte Electric Cooperative
Critical Peak Pricing with Load Control C&L Electric Cooperative Corporation Adams Electric Cooperative, Inc. Caddo Electric Cooperative, Inc. Arizona Public Service Capital Electric Cooperative, Inc. Cass County Electric Cooperative Carroll Electric Cooperative Corporation City of Monroe Carroll Electric Membership Corporation Coles-Moultrie Electric Cooperative Cass County Electric Cooperative Dairyland Power Cooperative Central Alabama Electric Cooperative Flathead Electric Cooperative, Inc. Central Electric Cooperative Municipal Services Commission Central Electric Cooperative, Inc. Northwestern Electric Cooperative, Inc. Central Georgia Electric Membership Corp. Otter Tail Power Company Central Vermont Public Service Corporation Sacramento Municipal Utility District Charles Mix Electric Salt River Project Agricultural Improvement & Power District Citizens' Electric Company San Diego Gas & Electric City of Big Stone City Sioux Valley SW Elec Coop City of East Grand Forks - (MN) Town of High Point City of Gothenburg Warren Electric Cooperative, Inc City of Groton City of Halstad
Demand Bidding & Buy-Back City of Hawarden City of Milford City of Glendale City of Milford City of Milford City of Olivia (MN) Connecticut Light and Power Company City of Port Angeles Duke Energy Carolinas, LLC City of Rock Hill Duke Energy Corporation City of Roseau Duke Energy Indiana, Inc. City of Roseville City of Saint Peter City of St. James
Federal Energy Regulatory Commission 2012 Assessment of Demand Response and Advanced Metering 100
Direct Load Control (Continued) City of Valley City Jefferson Energy Cooperative City of Vermillion Jersey Central Power & Light Co City of Wadena Electric & Water Kansas City Power & Light Company City of Winner Kansas Gas & Electric Company Claverack REC KCP&L Greater Missouri Operations Company Clay County Electric Cooperative Corporation Kingsbury Electric Cooperative, Inc. Clay-Union Electric Corporation Lake Region Electric Cooperative Cleveland Electric Illuminating Co Lee County Electric Cooperative, Incorporated Coles-Moultrie Electric Cooperative Louisville Gas & Electric and Kentucky Utilities Commonwealth Edison Company Marshall Municipal Utilities Connexus Energy McLean Electric Coop Consolidated Edison Company of New York McLeod Cooperative Power Association Cooperative Light and Power Mecklenburg Electric Cooperative Corn Belt Energy Corporation Menard Electric Cooperative Corn Belt Power Cooperative Metropolitan Edison Co Craighead Electric Cooperative Corporation MidAmerican Energy Company Crow Wing Cooperative Power & Light Company Midwest Electric, Inc. Dairyland Power Cooperative Midwest Energy Cooperative Dakota Electric Association Midwest Energy, Inc. Delaware Electric Cooperative, Inc. Midwest ISO Delmarva Power and Light Company Minnesota Valley Electric Cooperative Dixie Electric Membership Corporation Minnkota Power Cooperative, Inc. Douglas Electric Cooperative, Inc. Mississippi County Electric Cooperative, Inc. Duke Energy Carolinas, LLC Moorhead Public Service Duke Energy Corporation Mountain View Electric Association, Inc. Duke Energy Indiana Inc Municipal Commission of Boonville Duke Energy Kentucky, Inc. Nevada Power Company East River Electric Power Cooperative, inc. Nobles Cooperative Electric Elk River Municipal Utilities North Arkansas Electric Cooperative, Incorporated Elkhorn Rural Public Power District North Carolina Electric Membership Corp Emerald People's Utility District North Central Electric Coop EnergyUnited Electric Membership Corporation Northeastern REMC Entergy New Orleans, Inc. Northern Municipal Power Agency Excelsior Electric Membership Corporation Northern Virginia Electric Cooperative Fairfield Electric Cooperative Inc. Oahe Electric Cooperative Inc. Farmers Electric Cooperative Corporation Ohio Edison Co Farmers' Electric Cooperative, Inc. Osceola Electric Cooperative, Inc. Federated Rural Electric Otter Tail Power Company First Electric Cooperative Corporation Pacific Gas and Electric Company Flint Electric Membership Corporation PacifiCorp Florida Power & Light Company Pee Dee Electric Membership Corp. Fort Collins Utilities Pennsylvania Electric Co Georgia Power Pennsylvania Power Co Grundy Electric Cooperative, Inc. People's Electric Cooperative Hawaiian Electric Company, Inc. Perennial Public Power District Haywood Electric membership Corp. Piedmont Electric Membership Corporation H-D Electric Cooperative, Inc Pocahontas Municipal Utilities Henry County REMC Potomac Electric Power Company Highline Electric Association Power Choice/ Pepco Energy Services Idaho Power Company Prince George Electric Cooperative Illinois Rural Electric Cooperative Princeton Public Utilities Commission Indiana Michigan Power Company Progress Energy Carolinas Interstate Power and Light Company Progress Energy Florida Itasca-Mantrap Cooperative Electrical Association Public Service Electric & Gas Company Jackson Electric Membership Corporation Puget Sound Energy, Inc. Jackson Energy Cooperative Corp - (KY) Rappahannock Electric Cooperative
2012 Assessment of Demand Response and Advanced Metering Federal Energy Regulatory Commission 101
Direct Load Control (Continued) Renville-Sibley Cooperative Power Association Manitowoc Public Utilities Rolling Hills Electric Cooperative, Inc. Midwest ISO Sacramento Municipal Utility District Monongahela Power Co San Diego Gas & Electric Nebraska Public Power District Santee Electric Cooperative, Inc. New York Independent System Operator Shakopee Public Utilities Commission New York State Electric & Gas Shelby Electric Cooperative Niagara Mohawk Power Corporation Shenandoah Valley Electric Cooperative Northern Virginia Electric Cooperative Sioux Center Municipal Electric Utility Pacific Gas and Electric Company Sioux Valley SW Elec Coop Rochester Gas & Electric South Central Electric Association Sacramento Municipal Utility District South Central Power Company Sierra Pacific Power Company Southeastern Electric Cooperative, Inc. Southern California Edison (SCE) Southern California Edison (SCE) Tampa Electric Company Southern Indiana Gas & Elec The United Illuminating Company Southern Indiana REC, Inc. West Penn Power Company Southern Maryland Electric Cooperative, Inc.
Southwest Public Power District Interruptible Load Southwestern Electric Power Company Adams Electric Cooperative Spring Valley Public Utilities Adams Electric Cooperative, Inc. Steuben Rural Electric Cooperative, Inc. Alabama Power Company Sumter Electric Cooperative, Inc. APN Starfirst, L.P. Superior Water, Light and Power Company Appalachian Power Company Tampa Electric Company Arkansas Electric Cooperative Corporation The Detroit Edison Company Atchison-Holt Electric Coop The Frontier Power Company Austin Utilities The Midwest Electric Cooperative Corporation Baltimore Gas and Electric Company The Toledo Edison Co Blooming Prairie Public Utility Commission Town of Massena Electric Department Board of Public Utilities, City of McPherson Tucson Electric Power Bon Homme Yankton Electric Association, Inc. TXU Energy Retail Company LLC Borough of Lansdale Union County Electric Cooperative, Inc. Brunswick Electric Membership Corporation United Electric Cooperative C&L Electric Cooperative Corporation United Power Carroll Electric Cooperative Corporation Virginia Electric & Power Co Carroll Electric Membership Corporation Westar Energy, Inc. Central Electric Cooperative Whetstone valley electric cooperative, Inc Central Iowa Power Cooperative Wiregrass Electric Cooperative, Inc. Central Vermont Public Service Corporation Wisconsin Public Service Corporation City of Cartersville, Georgia Wisconsin Power and Light Company City of Elroy Woodruff Electric Cooperative Corporation City of Halstad Xcel Energy City of Lakeland, Lakeland Electric York Electric Cooperative, Inc. City of Lincoln Electric System City of Port Angeles Emergency Demand Response City of Rock Hill Central Hudson Gas & Electric Corporation City of Saint Peter City of Columbus, Ohio City of Sheboygan Falls Electric Reliability Council of Texas City of Tallahassee Utilities Energy spectrum, Inc City Utilities of Springfield, MO EnerNOC, Inc Clay Electric Cooperative, Inc. ISO New England Columbus Southern Power Company Kansas City Power & Light Company Commonwealth Edison Company Keytex Energy LLC Connecticut Light and Power Company Connexus Energy Consolidated Edison Company of New York Consumers Energy Company
Federal Energy Regulatory Commission 2012 Assessment of Demand Response and Advanced Metering 102
Interruptible Load (Continued) Corn Belt Energy Corporation Moorhead Public Service Crow Wing Cooperative Power & Light Company Mountain View Electric Association, Inc. Dairyland Power Cooperative Municipal Electric Utility of the City of Cedar Falls, Iowa Dakota Electric Association New York Power Authority Delaware Electric Cooperative, Inc. Nobles Cooperative Electric Dixie Escalante REA Inc. North Carolina Electric Membership Corp Duke Energy Carolinas, LLC Northern Virginia Electric Cooperative Duke Energy Corporation NorthWestern Energy Duke Energy Indiana Inc Ocmulgee Electric Membership Corporation Duke Energy Kentucky, Inc. Ohio Power Company Elk River Municipal Utilities OSCEOLA ELECTRIC COOPERATIVE, INC. EnergyUnited Electric Membership Corporation Ouachita Electric Cooperative Corporation Entergy Arkansas Inc Ozarks Electric Cooperative Corporation Entergy Gulf States Louisiana, L.L.C. Pacific Gas and Electric Company Entergy Louisiana Inc PECO Energy Company Entergy New Orleans, Inc. Prince George Electric Cooperative Entergy Texas, Inc. Progress Energy Carolinas Federated Rural Electric Progress Energy Florida First Electric Cooperative Corporation Public Service Company of Oklahoma Florida Power & Light Company Public Service Electric & Gas Company Fort Collins Utilities Rappahannock Electric Cooperative Four County EMC Richards Energy Group, Inc. Georgia Power Sacramento Municipal Utility District Green Mountain Power Corporation Salt River Project Agricultural Improvement & Power District Hawaiian Electric Company, Inc. San Diego Gas & Electric Howard Greeley Rural Public Power District Shelby Electric Cooperative Idaho Power Company Shenandoah Valley Electric Cooperative Illinois Rural Electric Cooperative South Carolina Electric & Gas Company Indiana Michigan Power Company South Carolina Public Service Authority Interstate Power and Light Company South Central Arkansas Electric Cooperative, Incorporated Itasca-Mantrap Cooperative Electrical Association South Central Electric Association JEA South Kentucky Rural Electric Cooperative Corp Jefferson Energy Cooperative Southern California Edison (SCE) Kansas City Power & Light Company Southern Indiana Gas & Electric Co Kansas Gas & Electric Company Southern Maryland Electric Cooperative, Inc. KCP&L Greater Missouri Operations Company Southwest Arkansas Electric Cooperative Corporation Kentucky Power Company Southwestern Electric Power Company Lake Country Power Spencer Municipal Utilities Lake Region Electric Cooperative Sumter Electric Cooperative, Inc. Lamb County Electric Cooperative T.I.P. Rural Electric Cooperative Lee County Electric Cooperative, Incorporated Tampa Electric Company Linn County Rural Electric Cooperative Association Tennessee Valley Authority Louisville Gas & Electric and Kentucky Utilities The Detroit Edison Company Loup River Public Power District The Empire District Electric Company Loup Valleys Rural Public Power District The Potomac Edison Company Marshall Municipal Utilities The Satilla Rural Electric Membership Corporation Mecklenburg Electric Cooperative Tucson Electric Power Menard Electric Cooperative Union County Electric Cooperative, Inc. MidAmerican Energy Company Upper Peninsula Power Corporation Midwest Energy Cooperative Virginia Electric & Power Co Midwest Energy, Inc. Warren Electric Cooperative, Inc Midwest ISO Webster Electric Cooperative Minnesota Power, Inc. West Penn Power Company Minnesota Valley Electric Cooperative Westar Energy, Inc. Mississippi County Electric Cooperative, Inc. Wheeling Power Company Mississippi Power Whetstone Valley Electric Cooperative, Inc
2012 Assessment of Demand Response and Advanced Metering Federal Energy Regulatory Commission 103
Interruptible Load (Continued) Wisconsin Electric Power Company Northwestern REC Wisconsin Public Service Corporation Oklahoma Electric Cooperative Wisconsin Power and Light Company Orange & Rockland Utilities Inc Woodruff Electric Cooperative Corporation Puget Sound Energy, Inc. WPPI Energy Rockland Electric Co Xcel Energy Salt River Project Agricultural Improvement & Power District Sierra Electric Cooperative, Inc. South Carolina Electric & Gas Company Southern California Edison (SCE) Southwest Power Pool
Load as a Capacity Resource Spring Valley Public Utilities Arizona Public Service United Electric Cooperative Services, Inc. Brazos Electric Power Cooperative, Inc. United Power Cass County Electric Cooperative Western Massachusetts Electric Company City of Radford - Electric Department Wisconsin Electric Power Company Cooperative Light and Power Withlacoochee River Electric Cooperative, Inc. EnerNOC, Inc
Idaho Power Company Peak Time Rebate Memphis Light, Gas & Water Division Entergy New Orleans, Inc. Midwest ISO Granite State Electric Company New York Independent System Operator Grundy Electric Cooperative, Inc. PJM Interconnection, LLC Massachusetts Electric Company Public Service Company of New Mexico (PNM) Nantucket Electric Company Salt River Project Agricultural Improvement & Power District OGE Energy Corporation San Diego Gas & Electric Oklahoma Electric Cooperative Southern California Edison (SCE) The Narragansett Electric Company Tampa Electric Company Tri-County Electric Cooperative, Inc. Tri-County Electric Cooperative, Inc
West Penn Power Company Real-Time Pricing Wisconsin Electric Power Company Alpena Power Company WPPI Energy Commonwealth Edison Company
Non-spinning Reserves Duke Energy Carolinas, LLC Duke Energy Corporation California Independent System Operator Duke Energy Kentucky, Inc. PJM Interconnection, LLC Entergy Arkansas Inc Georgia Power
Other Gulf Power Company Board of Public Utilities, City of McPherson Indiana Michigan Power Company Carroll Electric Membership Corporation Kansas City Power & Light Company Central Electric Cooperative, Inc. KCP&L Greater Missouri Operations Company City of Ceylon Kentucky Power Company Consolidated Edison Company of New York MidAmerican Energy Company Consumers Energy Company New York State Electric & Gas Delaware Electric Cooperative, Inc. Niagara Mohawk Power Corporation Eastern Maine Electric Cooperative, Inc Northern Neck Electric Cooperative Eastside Power Authority Northern Virginia Electric Cooperative Entergy Arkansas Inc OGE Energy Corporation Fairburn Utilities Otter Tail Power Company ISO New England Progress Energy Carolinas Itasca-Mantrap Cooperative Electrical Association Public Service Company of Oklahoma Louisville Gas & Electric and Kentucky Utilities Public Service Electric & Gas Company Minnesota Valley Electric Cooperative Rochester Gas & Electric Mountain View Electric Association, Inc. South Carolina Public Service Authority Nebraska Public Power District Southern California Edison (SCE) New York Independent System Operator Tennessee Valley Authority
Federal Energy Regulatory Commission 2012 Assessment of Demand Response and Advanced Metering 104
Real-Time Pricing (Continued) Upper Peninsula Power Corporation City of Rancho Cucamonga Virginia Electric & Power Co City of Rock Hill West Penn Power Company City of Roseville Wisconsin Public Service Corporation City of Salem Xcel Energy City of Tallahassee Utilities City of Westfield
Regulation Clark County REMC ISO New England Claverack REC PJM Interconnection, LLC Clay Electric Cooperative, Inc. Clintonville Utilities
Spinning Reserves Colorado Springs Utilities Electric Reliability Council of Texas Columbus Southern Power Company EnerNOC, Inc Columbus Water & Light Dept. New York Independent System Operator Connecticut Light and Power Company Consumers Energy
System Peak Response Transmission Tariff Cooperative Light and Power
Coosa Valley Electric Cooperative Jefferson Energy Cooperative Crawfordsville Electric Light & Power Nueces Electric Cooperative Crow Wing Cooperative Power & Light Company Red River Valley Rural Electric Association Cuba City Electric & Water Utility Dairyland Power Cooperative
Time-of-Use Delaware Electric Cooperative, Inc. A & N Electric Cooperative Delmarva Power and Light Company Adams Electric Cooperative Dixie Escalante REA Inc. Adams Electric Cooperative, Inc. Duke Energy Carolinas, LLC Algoma Utility Commission Duke Energy Corporation Appalachian Power Company Duke Energy Indiana Inc Arizona Public Service Duke Energy Kentucky, Inc. Bangor Hydro Electric Company Eagle River Light & Water Commission Bear Valley Electric Service Eastside Power Authority Bedford Rural Elec Coop, Inc Edgecombe-Martin County Electric Membership Corp. Bloomer Electric & Water Co Empire Electric Association, Inc. Board of Public Utilities, City of McPherson Entergy Arkansas Inc Boscobel Municipal Utilities Entergy Gulf States Louisiana, L.L.C. Broad River Electric Cooperative, Inc. Entergy Louisiana Inc Brodhead Water & Light Commission Entergy Texas, Inc. Burlington Electric Department Evansville Water & Light Butler Rural Electric Cooperative Association, Inc. Fitchburg Gas and Electric Light Company Carbon Power & Light Inc Flathead Electric Cooperative, Inc. Cedarburg Light & Water Commission Flint Electric Membership Corporation Central Hudson Gas & Electric Corporation Florence Utility Commission Central Maine Power Co Florida Power & Light Company Central Vermont Public Service Corporation Florida Public Utilities Co. Chicopee Municipal Lighting Plant Gaffney Board of Public Works City of Boulder City Georgia Power City of Carlyle, Illinois Grand Haven Board of Light and Power City of Carmi, Illinois Grand River Dam Authority City of Crystal Falls Green Mountain Power Corporation City of Gastonia Groton Electric Light Dept. City of Glendale Gulf Power Company City of Lakeland, Lakeland Electric Hartford Utilities City of Lodi Hawaii Electric Light Company, Inc. City of Milford Hawaiian Electric Company, Inc. City of North Saint Paul Haywood Electric membership Corp. City of Palo Alto Utilities Hendricks County Rural Electric Membership Cooperative City of Pasadena High Plains Power, Inc.
2012 Assessment of Demand Response and Advanced Metering Federal Energy Regulatory Commission 105
Time-of-Use(Continued)
Highline Electric Association Oconto Falls Water & Light Commission Holy Cross Electric Assn, Inc OGE Energy Corporation Hustisford Utilities Ohio Power Company Indiana Michigan Power Company Okefenoke Rural El Member Corp Inter County Energy Cooperative Oklahoma Electric Cooperative Interstate Power and Light Company Orange & Rockland Utilities Inc Itasca-Mantrap Cooperative Electrical Association Orlando Utilities Commission Jackson County Rural electric Membership Corporation Otero County Electric Cooperative, Inc. Jackson Electric Membership Corporation Otter Tail Power Company JEA Ozark Border Electric Cooperative Jefferson Energy Cooperative Pee Dee Electric Membership Corp. Jefferson Water & Light Dept. Piedmont Electric Membership Corporation Jemez Mountains Electric Cooperative, Inc. Pioneer Electric Cooperative, Inc. Jo-Carroll Energy, Inc.(NFP) Plymouth Utilities Juneau Utility Commission Potomac Electric Power Company Kansas City Power & Light Company Poudre Valley Rural Electric Association, Inc. Kansas Gas & Electric Company Prairie du Sac Municipal Electric & Water Kaukauna Utilities Progress Energy Carolinas KCP&L Greater Missouri Operations Company Progress Energy Florida Kentucky Power Company Public Service Company of New Hampshire Kingsport Power Company Public Service Company of Oklahoma Kissimmee Utility Authority Public Service Electric & Gas Company La Plata Electric Assn. Inc. PUD No 1 of Klickitat County Lake Country Power Rappahannock Electric Cooperative Lake Mills Light & Water Dept. Reedsburg Utility Commission Linn County Rural Electric Cooperative Association Rice Lake Utilities Lodi Municipal Light & Water Utility Richland Center Electric Utility Los Angeles Department of Water and Power Richmond Power and Light Manitowoc Public Utilities River Falls Municipal Utility Maui Electric Company, Limited Riverside Public Utilities McLeod Cooperative Power Association Rochester Gas & Electric Mecklenburg Electric Cooperative Rockland Electric Co Medford Electric Utility Sacramento Municipal Utility District Memphis Light, Gas & Water Division Salt River Project Agricultural Improvement & Power District Menasha Electric & Water Utilities Sangre de Cristo Electric Association MidAmerican Energy Company Sierra Electric Cooperative, Inc. Midwest Energy Cooperative Slinger Utilities Mississippi Power Snohomish County PUD No 1 Mount Horeb Electric Utility South Carolina Electric & Gas Company Mountain Parks Electric, Inc. South Carolina Public Service Authority Mountain View Electric Association, Inc. South Central Electric Association Muscoda Light & Water Utility South Kentucky Rural Electric Cooperative Corp Nebraska Public Power District South Mississippi Electric Power Association New Glarus Light & Water Works Southwestern Electric Power Company New Holstein Public Utility Steuben Rural Electric Cooperative, Inc. New London Electric & Water Utility Stoughton Electric Utility New Richmond Municipal Electric Utility Sturgeon Bay Utilities New York State Electric & Gas Sun Prairie Water & Light Commission Niagara Mohawk Power Corporation Superior Water, Light and Power Company North Little Rock Electric Department Tampa Electric Company Northeastern REMC Tennessee Valley Authority Northern Neck Electric Cooperative The Detroit Edison Company Northern Virginia Electric Cooperative The Empire District Electric Company Northwestern Electric Cooperative, Inc. The Satilla Rural Electric Membership Corporation NorthWestern Energy Tri-County Electric Cooperative, Inc Northwestern REC Tucson Electric Power

Federal Energy Regulatory Commission 2012 Assessment of Demand Response and Advanced Metering 106
Time-of-Use(Continued)
Turlock Irrigation District Two Rivers Water & Light Utility TXU Energy Retail Company LLC Union Electric Company United Electric Cooperative Services, Inc. United Power Valley Rural Electric Cooperative, Inc. Village of Stratford Virginia Electric & Power Co Wake Electric Waterloo Water & Light Commission Waunakee Water & Light Commission Waupun Utilities Waverly Municipal Elec Utility Westar Energy, Inc. Westby Municipal Electric Utility Western Indiana Energy REMC Western Massachusetts Electric Company Wheatland Rural Electric Cooperative Wheeling Power Company Wisconsin Public Service Corporation Wisconsin Power and Light Company WPPI Energy Xcel Energy
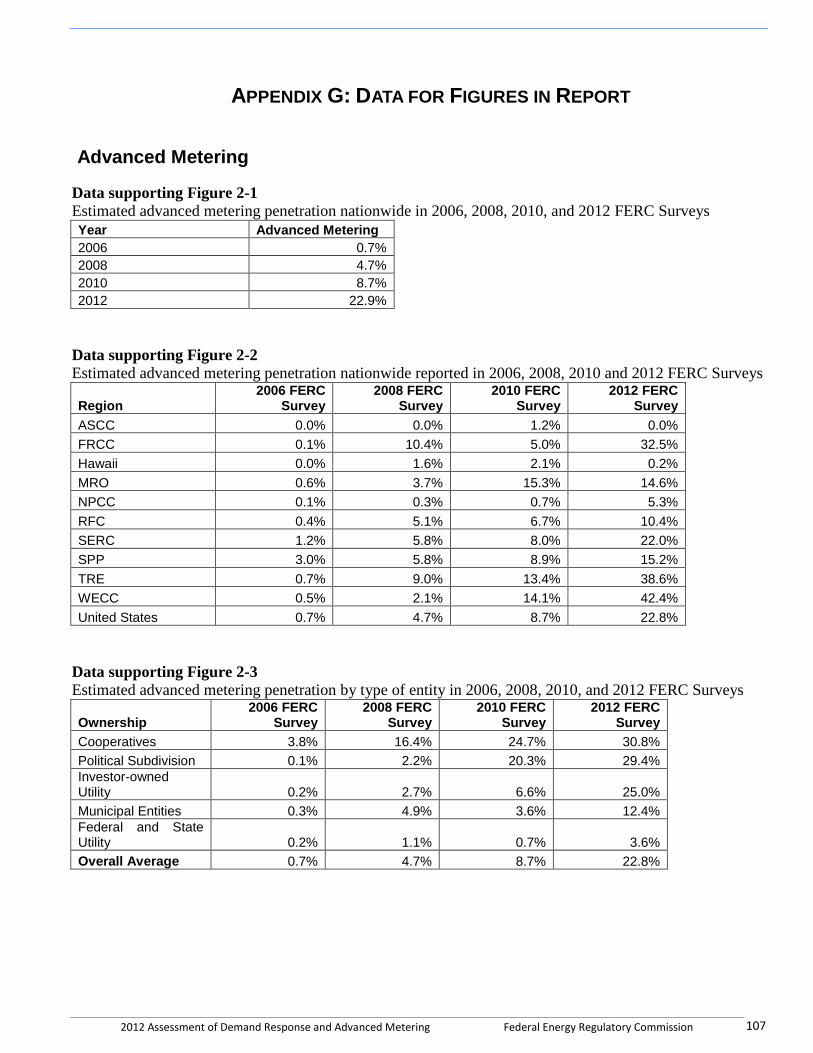
2012 Assessment of Demand Response and Advanced Metering Federal Energy Regulatory Commission 107
APPENDIX G: DATA FOR FIGURES IN REPORT
Advanced Metering
Data supporting Figure 2-1 Estimated advanced metering penetration nationwide in 2006, 2008, 2010, and 2012 FERC Surveys
Year Advanced Metering
2006 0.7%
2008 4.7%
2010 8.7%
2012 22.9%
Data supporting Figure 2-2
Estimated advanced metering penetration nationwide reported in 2006, 2008, 2010 and 2012 FERC Surveys
Region 2006 FERC
Survey 2008 FERC
Survey 2010 FERC
Survey 2012 FERC
Survey
ASCC 0.0% 0.0% 1.2% 0.0%
FRCC 0.1% 10.4% 5.0% 32.5%
Hawaii 0.0% 1.6% 2.1% 0.2%
MRO 0.6% 3.7% 15.3% 14.6%
NPCC 0.1% 0.3% 0.7% 5.3%
RFC 0.4% 5.1% 6.7% 10.4%
SERC 1.2% 5.8% 8.0% 22.0%
SPP 3.0% 5.8% 8.9% 15.2%
TRE 0.7% 9.0% 13.4% 38.6%
WECC 0.5% 2.1% 14.1% 42.4%
United States 0.7% 4.7% 8.7% 22.8%
Data supporting Figure 2-3
Estimated advanced metering penetration by type of entity in 2006, 2008, 2010, and 2012 FERC Surveys
Ownership 2006 FERC
Survey 2008 FERC
Survey 2010 FERC
Survey 2012 FERC
Survey
Cooperatives 3.8% 16.4% 24.7% 30.8%
Political Subdivision 0.1% 2.2% 20.3% 29.4%
Investor-owned Utility 0.2% 2.7% 6.6% 25.0%
Municipal Entities 0.3% 4.9% 3.6% 12.4%
Federal and State Utility 0.2% 1.1% 0.7% 3.6%
Overall Average 0.7% 4.7% 8.7% 22.8%
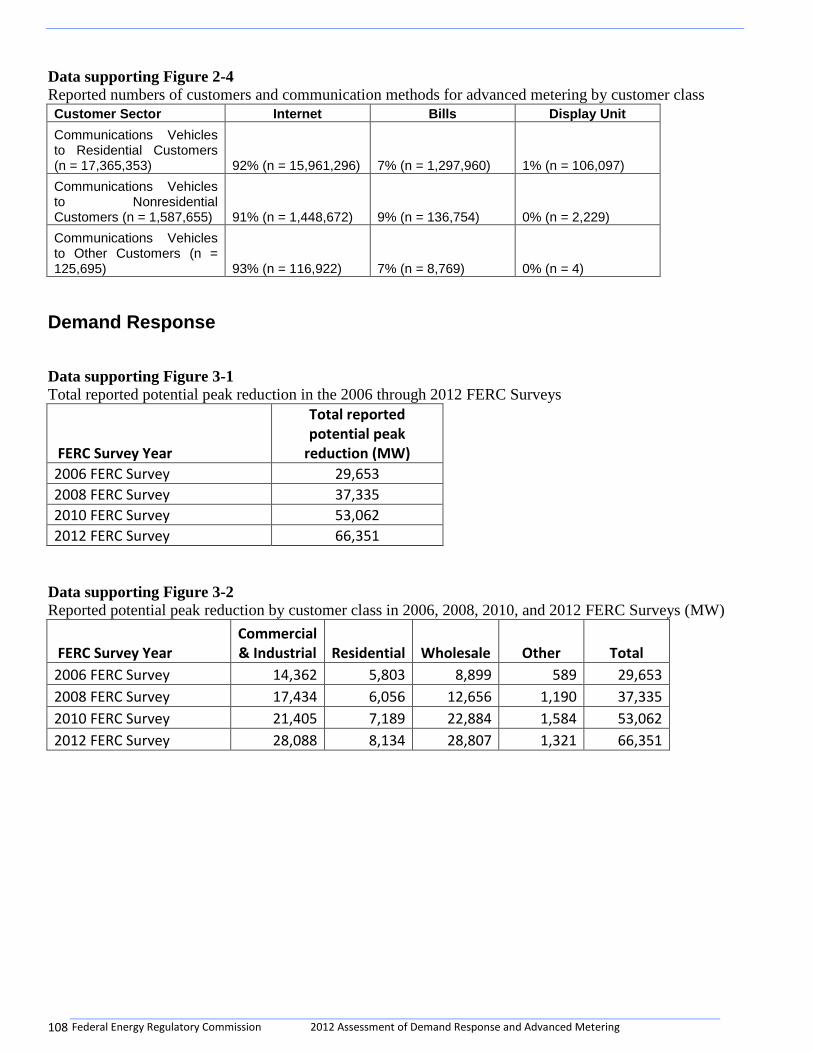
Federal Energy Regulatory Commission 2012 Assessment of Demand Response and Advanced Metering 108
Data supporting Figure 2-4 Reported numbers of customers and communication methods for advanced metering by customer class
Customer Sector Internet Bills Display Unit
Communications Vehicles to Residential Customers (n = 17,365,353) 92% (n = 15,961,296) 7% (n = 1,297,960) 1% (n = 106,097)
Communications Vehicles to Nonresidential Customers (n = 1,587,655) 91% (n = 1,448,672) 9% (n = 136,754) 0% (n = 2,229)
Communications Vehicles to Other Customers (n = 125,695) 93% (n = 116,922) 7% (n = 8,769) 0% (n = 4)
Demand Response
Data supporting Figure 3-1 Total reported potential peak reduction in the 2006 through 2012 FERC Surveys
FERC Survey Year
Total reported potential peak
reduction (MW)
2006 FERC Survey 29,653
2008 FERC Survey 37,335
2010 FERC Survey 53,062
2012 FERC Survey 66,351
Data supporting Figure 3-2 Reported potential peak reduction by customer class in 2006, 2008, 2010, and 2012 FERC Surveys (MW)
FERC Survey Year Commercial & Industrial Residential Wholesale Other Total
2006 FERC Survey 14,362 5,803 8,899 589 29,653
2008 FERC Survey 17,434 6,056 12,656 1,190 37,335
2010 FERC Survey 21,405 7,189 22,884 1,584 53,062
2012 FERC Survey 28,088 8,134 28,807 1,321 66,351
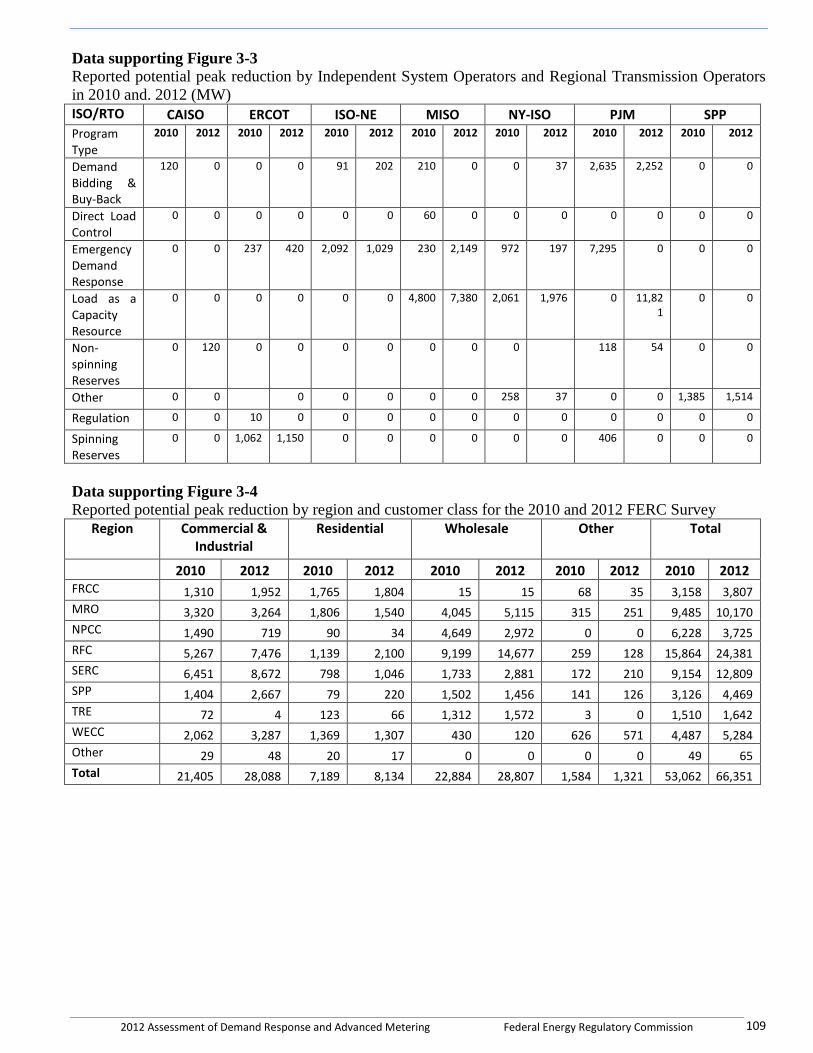
2012 Assessment of Demand Response and Advanced Metering Federal Energy Regulatory Commission 109
Data supporting Figure 3-3
Reported potential peak reduction by Independent System Operators and Regional Transmission Operators
in 2010 and. 2012 (MW)
ISO/RTO CAISO ERCOT ISO-NE MISO NY-ISO PJM SPP
Program Type
2010 2012 2010 2012 2010 2012 2010 2012 2010 2012 2010 2012 2010 2012
Demand Bidding & Buy-Back
120 0 0 0 91 202 210 0 0 37 2,635 2,252 0 0
Direct Load Control
0 0 0 0 0 0 60 0 0 0 0 0 0 0
Emergency Demand Response
0 0 237 420 2,092 1,029 230 2,149 972 197 7,295 0 0 0
Load as a Capacity Resource
0 0 0 0 0 0 4,800 7,380 2,061 1,976 0 11,821
0 0
Non-spinning Reserves
0 120 0 0 0 0 0 0 0 118 54 0 0
Other 0 0 0 0 0 0 0 258 37 0 0 1,385 1,514
Regulation 0 0 10 0 0 0 0 0 0 0 0 0 0 0
Spinning Reserves
0 0 1,062 1,150 0 0 0 0 0 0 406 0 0 0
Data supporting Figure 3-4
Reported potential peak reduction by region and customer class for the 2010 and 2012 FERC Survey
Region Commercial & Industrial
Residential Wholesale Other Total
2010 2012 2010 2012 2010 2012 2010 2012 2010 2012 FRCC 1,310 1,952 1,765 1,804 15 15 68 35 3,158 3,807
MRO 3,320 3,264 1,806 1,540 4,045 5,115 315 251 9,485 10,170
NPCC 1,490 719 90 34 4,649 2,972 0 0 6,228 3,725
RFC 5,267 7,476 1,139 2,100 9,199 14,677 259 128 15,864 24,381
SERC 6,451 8,672 798 1,046 1,733 2,881 172 210 9,154 12,809
SPP 1,404 2,667 79 220 1,502 1,456 141 126 3,126 4,469
TRE 72 4 123 66 1,312 1,572 3 0 1,510 1,642
WECC 2,062 3,287 1,369 1,307 430 120 626 571 4,487 5,284
Other 29 48 20 17 0 0 0 0 49 65
Total 21,405 28,088 7,189 8,134 22,884 28,807 1,584 1,321 53,062 66,351

Federal Energy Regulatory Commission 2012 Assessment of Demand Response and Advanced Metering 110
Data supporting Figure 3-5
Reported potential peak reduction in by type of program type and by customer class in 2012 FERC Survey
Type of Program Commercial & Industrial Residential Wholesale Other Total
Critical Peak Pricing 261 54 6 0 321
Critical Peak Pricing with Load Control 129 2 0 15 147
Demand Bidding & Buy-Back 139 0 3,927 0 4,066
Direct Load Control 1,638 6,940 666 534 9,777
Emergency Demand Response 494 110 3,734 0 4,339
Interruptible Load 14,268 45 685 649 15,647
Load as a Capacity Resource 2,649 77 16,600 0 19,327
Non-spinning Reserves 0 0 174 0 174
Other 105 40 1,076 54 1,276
Peak Time Rebate 58 1 0 0 59
Real-Time Pricing 1,868 6 0 0 1,874
Regulation 0 0 0 0 0
Spinning Reserves 40 0 1,150 0 1,190
System Peak Response Transmission Tariff 12 0 0 0 13
Time-of-Use 6,425 858 789 69 8,141
Total 28,088 8,134 28,807 1,321 66,351
Data supporting Figure 3-6 and 3-7
Reported potential and actual 2012 peak reduction by demand response resources by region
Region Potential Peak Reduction
Actual Peak Reduction
2012 2010 2012
FRCC 3,807 957 966
MRO 10,170 2,462 2,709
NPCC 3,725 2,497 3,151
RFC 24,381 2,051 3,651
SERC 12,809 3,086 3,520
SPP 4,469 1,466 1,863
TRE 1,642 422 1,470
WECC 5,284 2,667 2,870
Other 65 352 55
Total 66,351 15,980 20,256
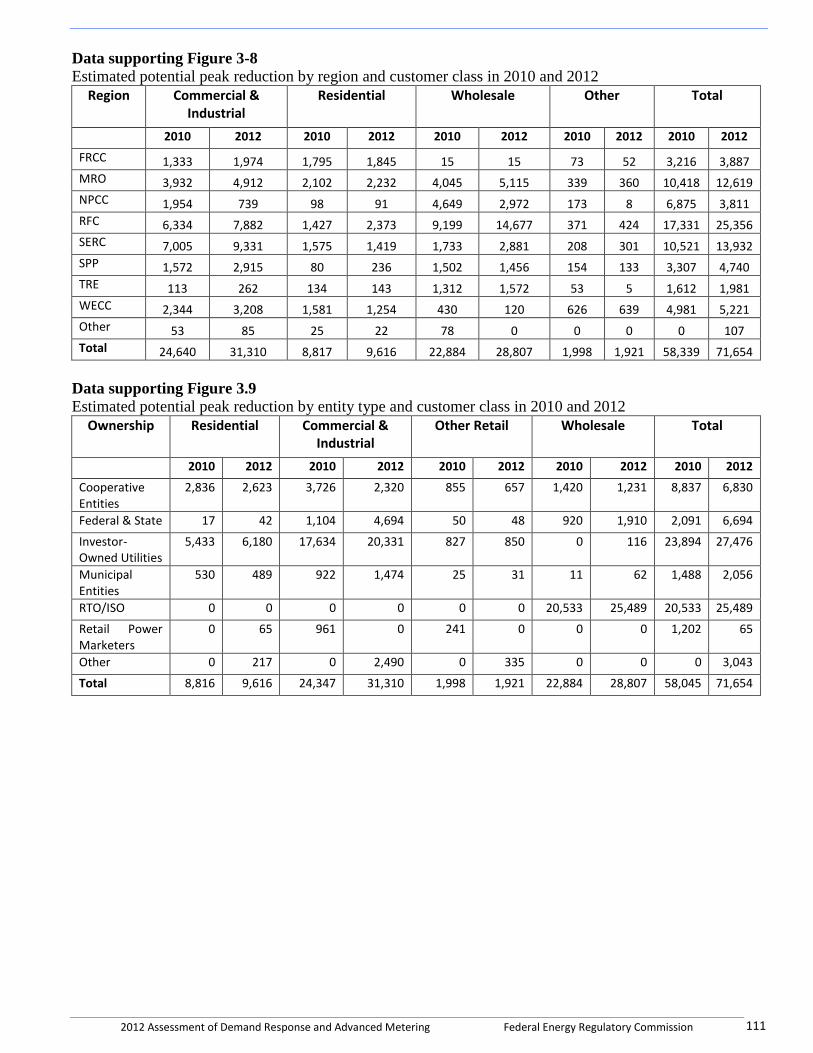
2012 Assessment of Demand Response and Advanced Metering Federal Energy Regulatory Commission 111
Data supporting Figure 3-8
Estimated potential peak reduction by region and customer class in 2010 and 2012
Region Commercial & Industrial
Residential Wholesale Other Total
2010 2012 2010 2012 2010 2012 2010 2012 2010 2012
FRCC 1,333 1,974 1,795 1,845 15 15 73 52 3,216 3,887
MRO 3,932 4,912 2,102 2,232 4,045 5,115 339 360 10,418 12,619
NPCC 1,954 739 98 91 4,649 2,972 173 8 6,875 3,811
RFC 6,334 7,882 1,427 2,373 9,199 14,677 371 424 17,331 25,356
SERC 7,005 9,331 1,575 1,419 1,733 2,881 208 301 10,521 13,932
SPP 1,572 2,915 80 236 1,502 1,456 154 133 3,307 4,740
TRE 113 262 134 143 1,312 1,572 53 5 1,612 1,981
WECC 2,344 3,208 1,581 1,254 430 120 626 639 4,981 5,221
Other 53 85 25 22 78 0 0 0 0 107
Total 24,640 31,310 8,817 9,616 22,884 28,807 1,998 1,921 58,339 71,654
Data supporting Figure 3.9 Estimated potential peak reduction by entity type and customer class in 2010 and 2012
Ownership Residential Commercial & Industrial
Other Retail Wholesale Total
2010 2012 2010 2012 2010 2012 2010 2012 2010 2012
Cooperative Entities
2,836 2,623 3,726 2,320 855 657 1,420 1,231 8,837 6,830
Federal & State 17 42 1,104 4,694 50 48 920 1,910 2,091 6,694
Investor-Owned Utilities
5,433 6,180 17,634 20,331 827 850 0 116 23,894 27,476
Municipal Entities
530 489 922 1,474 25 31 11 62 1,488 2,056
RTO/ISO 0 0 0 0 0 0 20,533 25,489 20,533 25,489
Retail Power Marketers
0 65 961 0 241 0 0 0 1,202 65
Other 0 217 0 2,490 0 335 0 0 0 3,043
Total 8,816 9,616 24,347 31,310 1,998 1,921 22,884 28,807 58,045 71,654
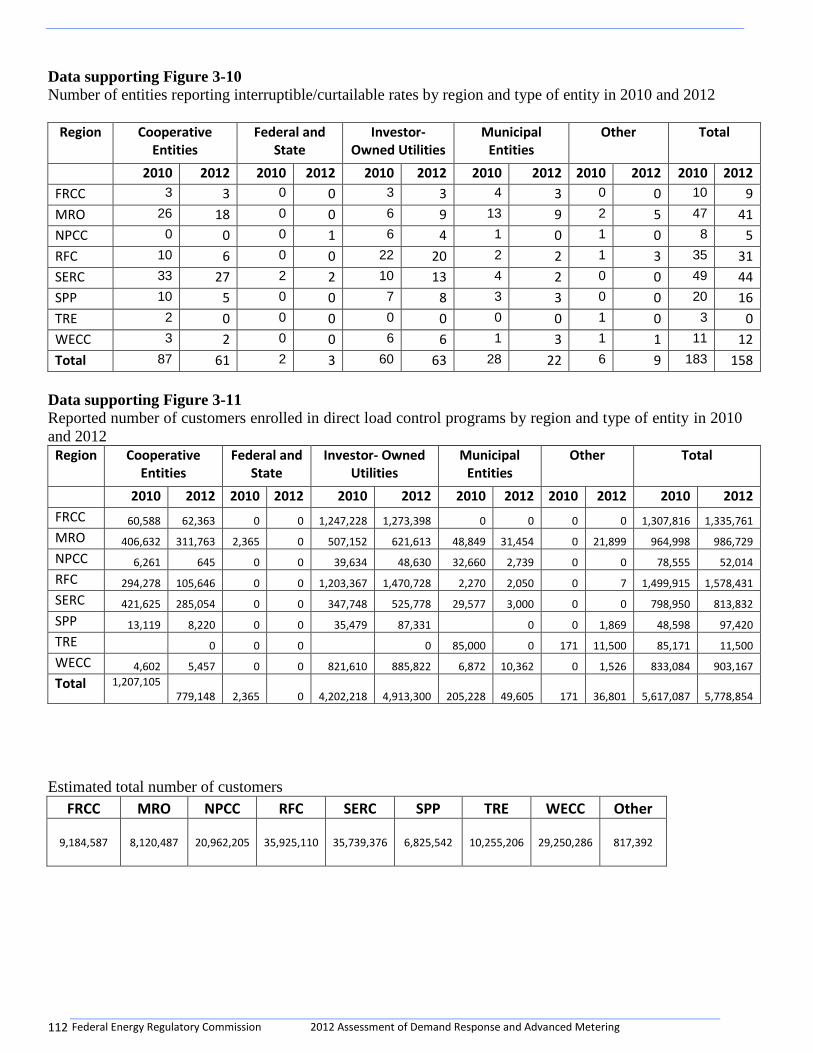
Federal Energy Regulatory Commission 2012 Assessment of Demand Response and Advanced Metering 112
Data supporting Figure 3-10
Number of entities reporting interruptible/curtailable rates by region and type of entity in 2010 and 2012
Region Cooperative Entities
Federal and State
Investor- Owned Utilities
Municipal Entities
Other Total
2010 2012 2010 2012 2010 2012 2010 2012 2010 2012 2010 2012
FRCC 3 3 0 0 3 3 4 3 0 0 10 9
MRO 26 18 0 0 6 9 13 9 2 5 47 41
NPCC 0 0 0 1 6 4 1 0 1 0 8 5
RFC 10 6 0 0 22 20 2 2 1 3 35 31
SERC 33 27 2 2 10 13 4 2 0 0 49 44
SPP 10 5 0 0 7 8 3 3 0 0 20 16
TRE 2 0 0 0 0 0 0 0 1 0 3 0
WECC 3 2 0 0 6 6 1 3 1 1 11 12
Total 87 61 2 3 60 63 28 22 6 9 183 158
Data supporting Figure 3-11
Reported number of customers enrolled in direct load control programs by region and type of entity in 2010
and 2012
Region Cooperative Entities
Federal and State
Investor- Owned Utilities
Municipal Entities
Other Total
2010 2012 2010 2012 2010 2012 2010 2012 2010 2012 2010 2012
FRCC 60,588 62,363 0 0 1,247,228 1,273,398 0 0 0 0 1,307,816 1,335,761
MRO 406,632 311,763 2,365 0 507,152 621,613 48,849 31,454 0 21,899 964,998 986,729
NPCC 6,261 645 0 0 39,634 48,630 32,660 2,739 0 0 78,555 52,014
RFC 294,278 105,646 0 0 1,203,367 1,470,728 2,270 2,050 0 7 1,499,915 1,578,431
SERC 421,625 285,054 0 0 347,748 525,778 29,577 3,000 0 0 798,950 813,832
SPP 13,119 8,220 0 0 35,479 87,331 0 0 1,869 48,598 97,420
TRE 0 0 0 0 85,000 0 171 11,500 85,171 11,500
WECC 4,602 5,457 0 0 821,610 885,822 6,872 10,362 0 1,526 833,084 903,167
Total 1,207,105 779,148 2,365 0 4,202,218 4,913,300 205,228 49,605 171 36,801 5,617,087 5,778,854
Estimated total number of customers
FRCC MRO NPCC RFC SERC SPP TRE WECC Other
9,184,587 8,120,487 20,962,205 35,925,110 35,739,376 6,825,542 10,255,206 29,250,286 817,392
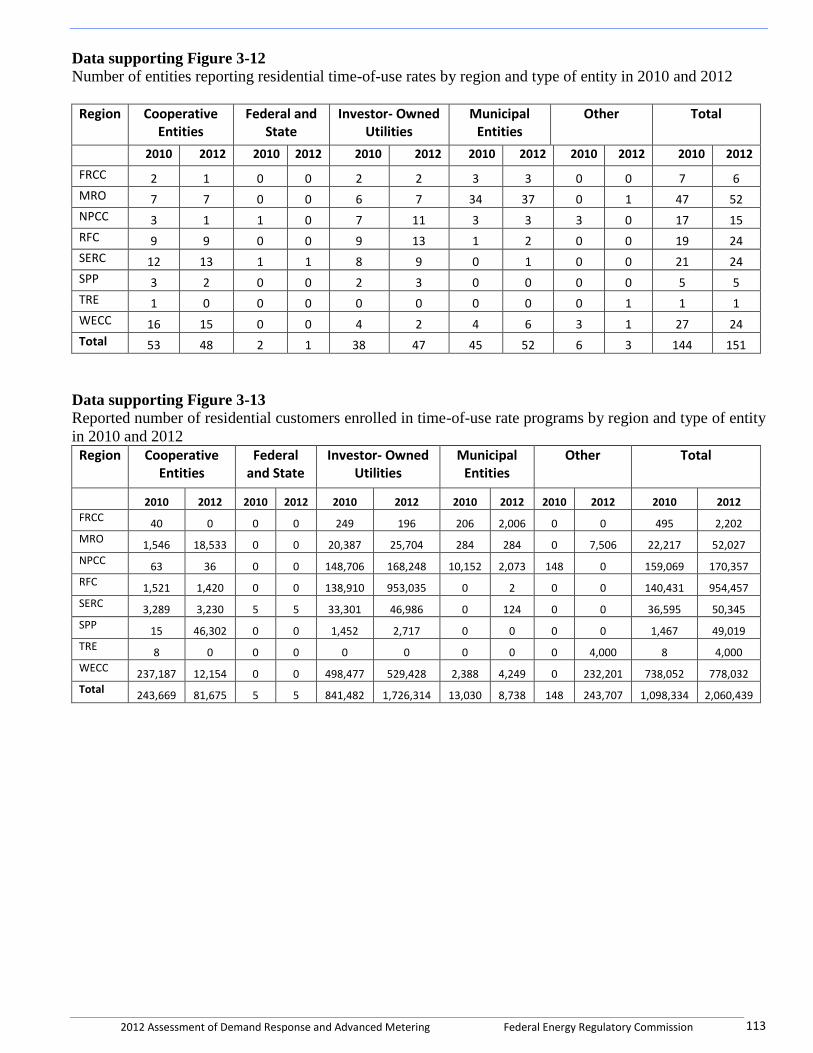
2012 Assessment of Demand Response and Advanced Metering Federal Energy Regulatory Commission 113
Data supporting Figure 3-12
Number of entities reporting residential time-of-use rates by region and type of entity in 2010 and 2012
Region Cooperative Entities
Federal and State
Investor- Owned Utilities
Municipal Entities
Other Total
2010 2012 2010 2012 2010 2012 2010 2012 2010 2012 2010 2012
FRCC 2 1 0 0 2 2 3 3 0 0 7 6
MRO 7 7 0 0 6 7 34 37 0 1 47 52
NPCC 3 1 1 0 7 11 3 3 3 0 17 15
RFC 9 9 0 0 9 13 1 2 0 0 19 24
SERC 12 13 1 1 8 9 0 1 0 0 21 24
SPP 3 2 0 0 2 3 0 0 0 0 5 5
TRE 1 0 0 0 0 0 0 0 0 1 1 1
WECC 16 15 0 0 4 2 4 6 3 1 27 24
Total 53 48 2 1 38 47 45 52 6 3 144 151
Data supporting Figure 3-13
Reported number of residential customers enrolled in time-of-use rate programs by region and type of entity
in 2010 and 2012
Region Cooperative Entities
Federal and State
Investor- Owned Utilities
Municipal Entities
Other Total
2010 2012 2010 2012 2010 2012 2010 2012 2010 2012 2010 2012
FRCC 40 0 0 0 249 196 206 2,006 0 0 495 2,202
MRO 1,546 18,533 0 0 20,387 25,704 284 284 0 7,506 22,217 52,027
NPCC 63 36 0 0 148,706 168,248 10,152 2,073 148 0 159,069 170,357
RFC 1,521 1,420 0 0 138,910 953,035 0 2 0 0 140,431 954,457
SERC 3,289 3,230 5 5 33,301 46,986 0 124 0 0 36,595 50,345
SPP 15 46,302 0 0 1,452 2,717 0 0 0 0 1,467 49,019
TRE 8 0 0 0 0 0 0 0 0 4,000 8 4,000
WECC 237,187 12,154 0 0 498,477 529,428 2,388 4,249 0 232,201 738,052 778,032
Total 243,669 81,675 5 5 841,482 1,726,314 13,030 8,738 148 243,707 1,098,334 2,060,439
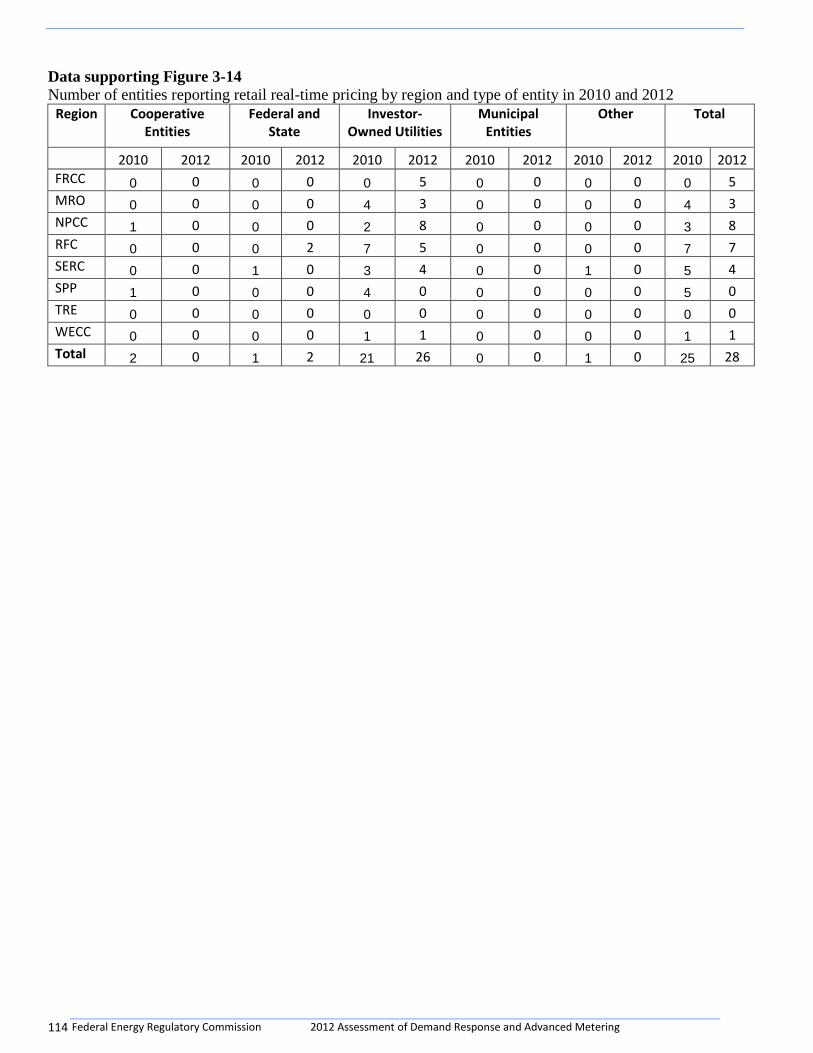
Federal Energy Regulatory Commission 2012 Assessment of Demand Response and Advanced Metering 114
Data supporting Figure 3-14
Number of entities reporting retail real-time pricing by region and type of entity in 2010 and 2012
Region Cooperative Entities
Federal and State
Investor- Owned Utilities
Municipal Entities
Other Total
2010 2012 2010 2012 2010 2012 2010 2012 2010 2012 2010 2012
FRCC 0 0 0 0 0 5 0 0 0 0 0 5
MRO 0 0 0 0 4 3 0 0 0 0 4 3
NPCC 1 0 0 0 2 8 0 0 0 0 3 8
RFC 0 0 0 2 7 5 0 0 0 0 7 7
SERC 0 0 1 0 3 4 0 0 1 0 5 4
SPP 1 0 0 0 4 0 0 0 0 0 5 0
TRE 0 0 0 0 0 0 0 0 0 0 0 0
WECC 0 0 0 0 1 1 0 0 0 0 1 1
Total 2 0 1 2 21 26 0 0 1 0 25 28
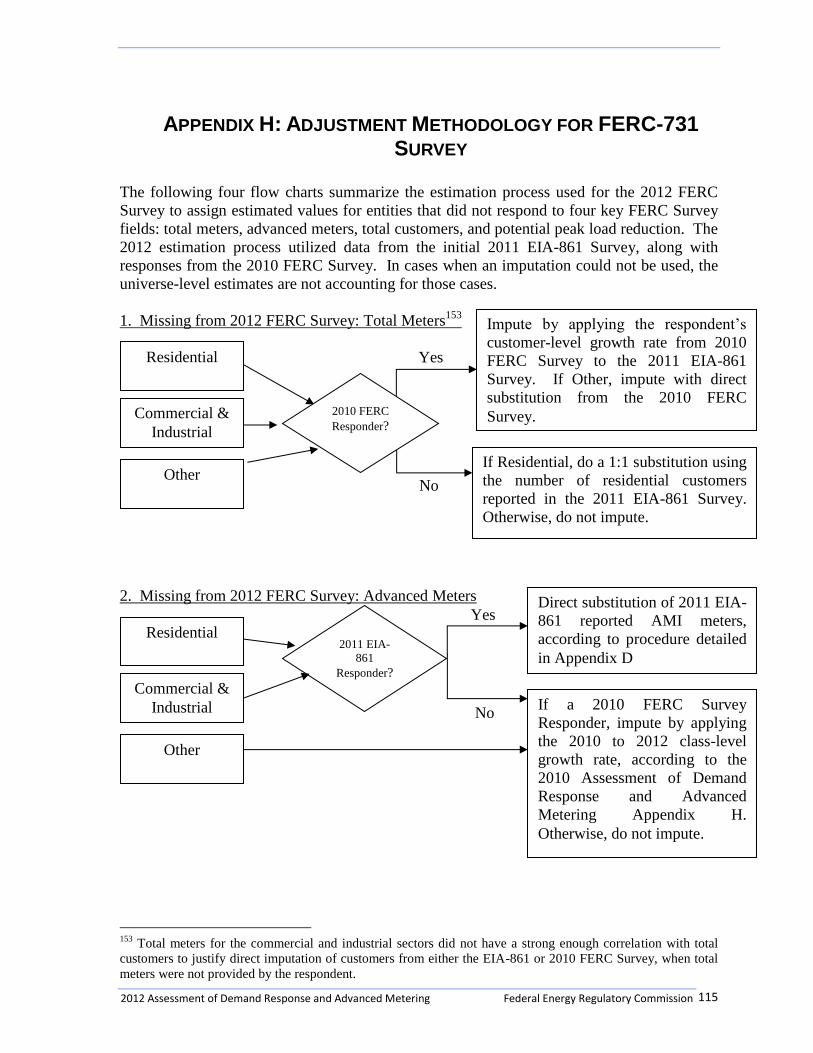
2012 Assessment of Demand Response and Advanced Metering Federal Energy Regulatory Commission 115
APPENDIX H: ADJUSTMENT METHODOLOGY FOR FERC-731
SURVEY
The following four flow charts summarize the estimation process used for the 2012 FERC
Survey to assign estimated values for entities that did not respond to four key FERC Survey
fields: total meters, advanced meters, total customers, and potential peak load reduction. The
2012 estimation process utilized data from the initial 2011 EIA-861 Survey, along with
responses from the 2010 FERC Survey. In cases when an imputation could not be used, the
universe-level estimates are not accounting for those cases.
1. Missing from 2012 FERC Survey: Total Meters153
Yes
No
2. Missing from 2012 FERC Survey: Advanced Meters
153
Total meters for the commercial and industrial sectors did not have a strong enough correlation with total
customers to justify direct imputation of customers from either the EIA-861 or 2010 FERC Survey, when total
meters were not provided by the respondent.
Commercial &
Industrial
Residential
Other
2011 EIA-
861
Responder?
Impute by applying the respondent’s
customer-level growth rate from 2010
FERC Survey to the 2011 EIA-861
Survey. If Other, impute with direct
substitution from the 2010 FERC
Survey.
If Residential, do a 1:1 substitution using
the number of residential customers
reported in the 2011 EIA-861 Survey.
Otherwise, do not impute.
Commercial &
Industrial
Residential
Other
Direct substitution of 2011 EIA-
861 reported AMI meters,
according to procedure detailed
in Appendix D
2010 FERC
Responder?
Yes
No If a 2010 FERC Survey
Responder, impute by applying
the 2010 to 2012 class-level
growth rate, according to the
2010 Assessment of Demand
Response and Advanced
Metering Appendix H.
Otherwise, do not impute.

Federal Energy Regulatory Commission 2012 Assessment of Demand Response and Advanced Metering 116
3. Missing from 2012 FERC Survey: Potential Peak Reduction
Yes
No
4. Missing from 2012 FERC Survey: Total Customers
Self-Selection Assessment Subsample
The FERC Staff determined that the 2012 FERC Survey, to adhere with its Congressional
directive, should collect or estimate information on all entities that provide electric power
and demand response to customers in the U.S. However, the FERC Survey is voluntary, and
essentially a census of respondents to the EIA-861 Survey, with the addition of Regional
Transmission Operators (RTOs), Independent System Operators (ISOs), and curtailment
service providers. As such, there is inherent risk for self-selection bias; for example, some
entities may be more likely to respond to the FERC Survey if they have already deployed
advanced meters or demand response programs, and these are key measures of the survey.
Since the propensity to respond may be related to key measures in the FERC Survey, OMB
directed the Commission to assess the potential for self-selection bias in the FERC Survey, as
compared to traditional statistical sampling methods. As in previous survey years, the FERC
staff prepared a “bias assessment sample,” or a statistical subsample from the full survey
population. This section of the report describes the “bias assessment sample” design, and
compares the estimates derived from the full dataset with the corresponding estimates
produced from the bias assessment sample. If the corresponding estimates are within an
acceptable margin of error, it supports the hypothesis that a census of the target population
achieves as reliable estimates as a traditional statistical sample. However, significant
Commercial &
Industrial
Residential
Other
Do a 1:1 substitution using total MW
peak load reduction potential reported in
the 2011 EIA-861 Survey
Regression-based imputation using class
average growth from 2010 FERC Survey
to 2012 FERC Survey, applied to 2010
FERC data. If not a 2010 FERC Survey
responder, do not impute.
2011 EIA
Responder?
Commercial &
Industrial
Residential
Other
Regression-based imputation using class
average growth from 2010 FERC Survey
to 2011 EIA-861 Survey, applied to
2010 FERC data
2012 Assessment of Demand Response and Advanced Metering Federal Energy Regulatory Commission 117
differences in the corresponding estimates would indicate a significant risk for self-selection
bias in the FERC Survey.
Assessment of Past Designs
The designs for 2006 and 2008 bias assessment samples utilize known relationships of
advanced metering penetration with region, utility type, and utility size. Although
curtailment service providers and generation & transmission entities do not provide retail
electricity and have no advanced meters associated with them, they are unique and important
respondents to the survey, especially with respect to demand response data, so selecting these
respondents into the sample with certainty ensures they would be accounted for. The 2010
bias assessment sample was very similar to those constructed in 2006 and 2008, except for
utilizing ratio estimation rather than simple random sampling. This change improved the
sampling efficiency, but added complexity to the sample construction process.
2012 Self-Selection Bias Assessment Design
DNV KEMA maintained the same basic design used in 2006, 2008, and 2010, with some
modifications. Key features of the design are as follows:
Entities were stratified by state, ownership type, and size category (small, medium,
large, or other). In 2010, entities were stratified by NERC region rather than state.
Within strata, units were selected either with certainty or probability proportionate to
size (PPS). Entities were selected with certainty if they fell in the “large” size
category or they did not have a number of customers served for the state listed in the
EIA-861 Survey. Entities were selected PPS within the strata defined as above, with
proportional allocation of a target sample size of 750 among the entities in the various
strata.
The total sample size obtained was 797 EIA utility ID/state code combinations. Some
entities were included in the sample for more than one state, so the number of unique
EIA utility IDs was 727.
The switch to using state instead of NERC region for the geographic stratification component
was based on the addition of state-level estimates in the 2010 FERC Survey, as well as the
availability of state-level customer data in the EIA-861 Survey, but not by NERC. This
modification resulted in more strata, and fewer sample cases per strata, but better state-level
coverage overall.
The 2012 bias assessment sample design also selects more entities with certainty; all large
utilities and all entities without a listed number of customers served in a state were included
in the sample. Large utilities were selected with certainty because they tend to have a
disproportionally large contribution towards total advanced metering and demand response
estimates. Entities without an assigned number of customers were included with certainty
because without a measure of size to use in the sample selection, there was no other way to
include them without using a different sample design; this also helped minimize overall
sampling complexity and include respondents such as curtailment service providers.
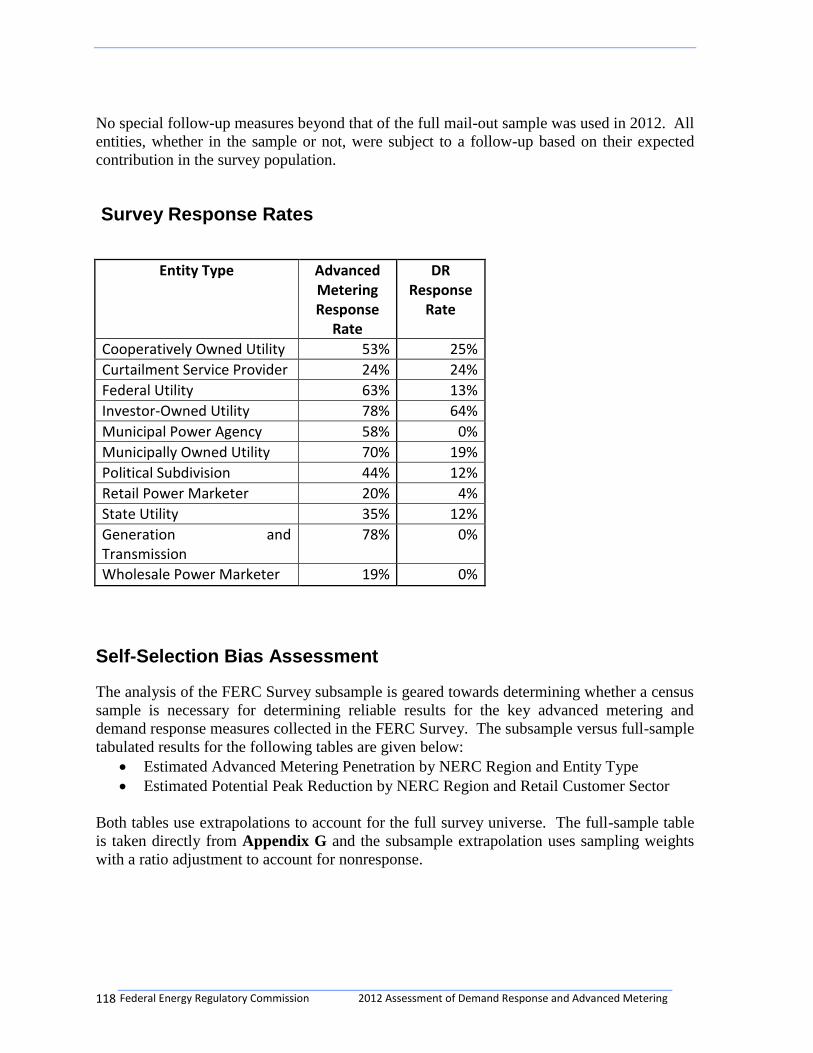
Federal Energy Regulatory Commission 2012 Assessment of Demand Response and Advanced Metering 118
No special follow-up measures beyond that of the full mail-out sample was used in 2012. All
entities, whether in the sample or not, were subject to a follow-up based on their expected
contribution in the survey population.
Survey Response Rates
Entity Type Advanced Metering Response
Rate
DR Response
Rate
Cooperatively Owned Utility 53% 25%
Curtailment Service Provider 24% 24%
Federal Utility 63% 13%
Investor-Owned Utility 78% 64%
Municipal Power Agency 58% 0%
Municipally Owned Utility 70% 19%
Political Subdivision 44% 12%
Retail Power Marketer 20% 4%
State Utility 35% 12%
Generation and Transmission
78% 0%
Wholesale Power Marketer 19% 0%
Self-Selection Bias Assessment
The analysis of the FERC Survey subsample is geared towards determining whether a census
sample is necessary for determining reliable results for the key advanced metering and
demand response measures collected in the FERC Survey. The subsample versus full-sample
tabulated results for the following tables are given below:
Estimated Advanced Metering Penetration by NERC Region and Entity Type
Estimated Potential Peak Reduction by NERC Region and Retail Customer Sector
Both tables use extrapolations to account for the full survey universe. The full-sample table
is taken directly from Appendix G and the subsample extrapolation uses sampling weights
with a ratio adjustment to account for nonresponse.

2012 Assessment of Demand Response and Advanced Metering Federal Energy Regulatory Commission 119
Estimated Advanced Metering Penetration by NERC Region and Entity Type - Full-
Sample Analysis
NERC Region
Cooperatively Owned Utilities
Political Subdivisions
Investor- Owned Utilities
Municipally Owned Utilities
Federal and State Utilities
Overall
FRCC 14% 0% 38% 14% 0% 32%
MRO 33% 4% 10% 4% 45% 15%
NPCC 20% 0% 7% 5% 0% 5%
RFC 36% 0% 10% 5% 1% 10%
SERC 36% 0% 19% 11% 1% 22%
SPP 29% 5% 14% 2% 91% 15%
TRE 17% 0% 72% 24% 0% 39%
WECC 26% 36% 48% 18% 23% 42%
Other 0% 0% 0% 5% 0% 2%
Overall 31% 29% 25% 12% 4% 23%
Estimated Advanced Metering Penetration by NERC Region and Entity Type -
Subsample Analysis
NERC Region
Cooperatively Owned Utilities
Political Subdivisions
Investor- Owned Utilities
Municipally Owned Utilities
Federal and
State Utilities
Overall
FRCC 30% 0% 38% 11% 0% 33%
MRO 44% 9% 18% 0% 78% 18%
NPCC 48% 0% 6% 0% 0% 6%
RFC 25% 0% 9% 1% 1% 9%
SERC 58% 0% 0% 21% 2% 16%
SPP 37% 0% 15% 0% 91% 17%
TRE 28% 0% 74% 8% 0% 58%
WECC 16% 35% 61% 46% 100% 57%
Other 0% 0% 3% 0% 0% 3%
Overall 46% 33% 23% 24% 12% 26%
The subsample analysis results for the chosen advanced metering table shows that overall,
the subsample performed well, with only a 3 percent difference in overall advanced metering
penetration in the U.S. and was only 2 percentage points different for investor-owned
utilities. Similarly, the results are extremely comparable for the NERC region marginal
totals. The penetration estimate for RFC, for example was 2 percentage points different for
the full sample and the subsample, and was even closer for NPCC. However, it is clear that
abandoning the census in favor for a sample would lead to self-selection bias for cooperatives
and municipally owned utilities, and for certain regions, as suggested by moderate pairwise
differences for MRO.

Federal Energy Regulatory Commission 2012 Assessment of Demand Response and Advanced Metering 120
Estimated Potential Peak Reduction by NERC Region and Retail Customer Sector – Full Sample
Region Commercial & Industrial Residential Other Total
FRCC 1,974 1,845 52 3,872
MRO 4,912 2,232 360 7,504
NPCC 739 91 8 839
RFC 7,882 2,373 424 10,680
SERC 9,331 1,419 301 11,051
SPP 2,915 236 133 3,284
TRE 262 143 5 409
WECC 3,208 1,254 639 5,101
Other 85 22 0 107
Total 31,310 9,616 1,921 42,847 Estimated Potential Peak Reduction by NERC Region and Retail Customer Sector - Subsample
Region Commercial & Industrial Residential Other Total
FRCC 1,952 1,804 35 3,792
MRO 3,754 1,662 94 5,511
NPCC 733 23 0 756
RFC 11,642 3,481 128 15,251
SERC 10,251 1,830 128 12,209
SPP 4,834 414 556 5,804
TRE 29 737 0 766
WECC 3,658 1,565 2,430 7,653
Other 47 19 0 65
Total 36,900 11,535 3,371 51,807
The analysis results for demand response suggest that utilizing a statistical sample instead of
a census would lead to biased results. Unlike the advanced metering assessment, which
shows above that reliable results are achievable through aggregating the data by one
categorical variable, the demand response results show that most of the tabulations have
pairwise differences of 20 percent or more. It is therefore advisable to continue using a
census of the survey universe rather than using a statistical sample to maintain reliable survey
estimates for demand response.