assessment of degradation equivalent operating time for
TRANSCRIPT

Assessment of Degradation Equivalent Operating Time for Aircraft Gas Turbine Engines
Ogechukwu Alozie, Yi-Guang Li, Michail Diakostefanis
Cranfield University School of Aerospace, Transport and Manufacturing MK43 0AL, Bedford United Kingdom
Xin Wu, Xingchao Shong, Wencheng Ren
Shenyang Engine Design and Research Institute (SEDRI) Aircraft Engine Corporation of China (AECC) China
ABSTRACT
This paper presents a novel method for quantifying the effect of ambient, environmental and operating conditions on the progression of degradation in aircraft gas turbines based on the measured engine and environmental parameters. The proposed Equivalent Operating Time (EOT) model considers the degradation modes of fouling, erosion, and blade tip wear due to creep strain, and expresses the actual degradation rate over the engine clock time relative to a pre-defined reference condition. In this work, the effects of changing environmental and engine operating conditions on the EOT for the core engine booster compressor and the high-pressure turbine were assessed by performance simulation with an engine model. The application to a single and multiple flight scenarios showed that, compared to the actual engine clock time, the EOT provides a clear description of component degradation, prediction of remaining useful life, and sufficient margin for maintenance action to be planned and performed before functional failure.
Keywords: Gas turbine; Performance; Degradation; Fouling; Erosion; Creep; Equivalent Operating Time; Prognostics; Remaining Useful Life

NOMENCLATURE
CDP Cloud Droplet Probe
d Diameter (m) D Degradation or damage level DEvAC Duration of Exposure versus Ash Concentration
DPA Design Point Adaptation
ECAM Electronic Centralized Aircraft Monitor Eff Efficiency health index
EOT Equivalent Operating Time (hours) FC Flow Capacity health index
GA Genetic Algorithm
HP High-Pressure
I.Fan + LPC Integrated Inner Fan and Low-Pressure Compressor (Booster) ISA International Standard Atmosphere
LMP Larson-Miller Parameter LP Low-Pressure
NGV Nozzle Guide Vane
N Relative shaft speed (%) OEM Original Engine Manufacturer O.Fan Outer Fan
p Static pressure (atm) P Total pressure (atm) PCASP Passive Cavity Aerosol Spectrometer Probe
PM Particulate Matter RH Relative Humidity
RMSE Root Mean Squared Error RUL Remaining Useful Life (hours) SFC Specific Fuel Consumption
SLS Sea Level Static
t Time / Static temperature (K) T Total temperature (K) TET Turbine Entry Temperature (K) W Mass flow rate (kg/s)
Subscripts 0, a Ambient condition
air Air property
corr Corrected to standard inlet temperature and pressure (for mass flow)
C Creep strain
E Erosion
F Fouling
FF Fuel flow
p Particle
r Corrected to standard inlet temperature (for rotational speed)
ref Reference condition

O. ALOZIE ET AL. 3
1.0 INTRODUCTION
Although gas turbine engines for aircraft propulsion are designed and manufactured to meet high standards of efficiency, fuel economy, reliability and safety, the nature of their operation exposes them to hostile conditions that adversely impact their performance over time [1,2]. These conditions may be caused by factors originating within the engine such as blade tip rubs during transient operation or rotor imbalance leading to excessive seal wears and increased blade tip clearance, temperature hot spots leading to thermal oxidation of blade coatings, high thermo-mechanical stresses that produce creep damage, fatigue due to blade stress cycling which affects the structural integrity and imposes limits on the engine operating life. Other influence factors are external to the engine, and in some cases beyond the control of the engine or airline operators. These include ambient dust, sand, salt, ice, bird strikes that lead to fouling, erosion, corrosion and foreign object damage respectively, when the engine is exposed to them in the course of its operating profiles. With the accumulation of on-wing time, these degradations not only reduce engine component performance, but also result in higher specific fuel consumption (SFC) and lead to the engine running hotter, with increased turbine entry temperature, and ultimately a reduction in the service life of the hot section components. The rate of degradation is also accelerated for a degraded engine, leading to a faster usage consumption of life-limiting parts.
A key objective of health condition monitoring is, therefore, to assess the performance of an engine at any given time to reveal the presence and if any, the progression of degradation or faults of the components in concern. The results of such diagnostic activity serve as input in predicting the time-to-failure or remaining useful life (RUL) of the affected component and enable adequate logistics and spares to be set in place for maintenance when an overhaul is required. Such health monitoring procedure is also expected to account for the changes in the engine operating profile and how these impact the rate of performance deterioration when making predictions.
Various methods have been developed and proposed for quantifying the effect of adverse operating conditions on the gas turbine health dating as far back as to the Palmgren-Miners rule for calculating cumulative damage and failure resulting from different load cycles [3]. The equivalent time or cycles is also a similar concept that has been applied extensively to land-based gas turbines, especially for power generation applications. General Electric, for example, developed a set of equations to derive maintenance factors that determine the gas turbine combustion and hot gas path inspection intervals based on their operating cycles [4]. The calculated factored hours quantify the impact of different fuel types, load setting or firing temperature and steam/water injection on the hot section component life relative to both baseline operation and inspection interval. According to Lee [5], engine manufacturers also account for the effect of engine start operations on inspection intervals by converting each start cycle to an equivalent number of operating hours. However, these methods cannot be readily applied to aero-gas turbine engines because of the different operating profiles and wide range of conditions encountered in the latter.
For aero-engine life assessment, Zhou et al [6] presented a damage evaluation model for blade creep life calculation, Abdul Ghafir et al [7] used a creep factor parameter to express the relative severity of firing temperatures on life consumption while Eshati et al [8] and Hanumanthan et al [9] adopted the numerical computational approach to solving the same problem. Gotoh et al [10] proposed a method for evaluating gas turbine equivalent operating time for creep and thermo-mechanical fatigue loadings. More recently, Wan et al

4
[11] presented an equivalent life index based on a multi-environmental time similarity approach to assess the degradation behaviours of different gas turbine systems operating under different environmental conditions. However, these life-assessment models do not account for the effects of gradual degradation modes that lead to engine performance loss, well before component failure occurs.
OEMs of commercial aircraft engines have also developed bespoke severity curves that define the severity of a given flight operation relative to a reference flight, based on the restoration cost per flight hour and shop visit intervals [12,13]. These curves enable the operator to evaluate the effects of thrust rating, take-off and climb derate, FLEX-assumed temperatures, flight length, etc. on engine life-limiting parts and the ensuing direct maintenance and life-cycle costs [14]. For rare events such as flight through volcanic ash clouds, the Duration of Exposure versus Ash Concentration (DEvAC) chart and volcanic ash dosage calculators have been applied to quantify the loss in engine safety margins based on exposure times and ash concentration [15,16]. Some of these charts and tools are proprietary, hence the methods for derivation are not publicly available to airline engine operators except that they are applied as factor multiples of the actual flight time or fractions of the time between overhaul. On the other hand, published aero-engine degradation models like in Zaita et al., and Bodjo and Filippone [17,18] which make use of experimental correlations for predicting daily fouling and erosion, lack numerical assessment and verification using engine flight data, mainly due to the unavailability of accurate environmental data acquired during in-flight operations.
This paper addresses these gaps by proposing a novel degradation equivalent operating time (EOT) model, derived from first principles and empirical data correlations, to quantify the severity of engine component degradation from different sources, as a function of internal power settings, ambient and environmental conditions. The output of the model is an equivalent time parameter, which is a factor multiple or fraction of the actual engine flight hours, depending on the severity or mildness respectively of engine operation relative to a reference flight condition. The EOT model was assessed under different operating conditions using steady-state performance simulations of a high-bypass turbofan engine model, thermodynamically similar to the CFM56-7B engine. The application of the EOT model was also demonstrated for single- and multiple-flight scenarios of the engine based on real flight trajectory settings and environmental particulate matter data measured from a dust survey science flight. Finally, the approach was applied to the prognostics of the model engine using implanted component degradation and simulated data, and the results analyzed. The following section describes the formulation of the equivalent operating time model along with the underlying assumptions and methodology for implementation.
2.0 METHODOLOGY
2.1 Fundamental Assumptions Engine component degradation is a complex phenomenon, especially when the interaction between simultaneously occurring degradation mechanisms are considered. Hence, the following assumptions have been made with respect to the development of the combined performance deterioration model for the EOT calculation.
1. Only the degradation of major gas path components (i.e. compressors, combustor
and turbines) is considered in this study, where each component is considered as a
single, brick unit with the air/gas properties defined at the inlet and/or exit stations.
O. ALOZIE ET AL. 5
2. Performance deterioration is assessed based on the health parameters for each
component. These include flow capacity and efficiency indices, which represent
the changes of the corrected mass flow rate and isentropic efficiency respectively
in all operating conditions, relative to their baseline values. A detailed description
of the component health parameters is provided by Li and Singh [19].
3. Engine health assessment is performed after every flight using a representative
sensor data sample obtained during the steady-state phase of the flight.
4. Environmental parameters such as the size distribution of airborne particulate
matter and their respective concentrations are either available or measured during
flight.
5. The degradation threshold of each component is assumed to ensure safe operation
of gas turbine engines. Such thresholds may be determined by the time between
overhauls set by OEM or the maximum allowed component degradations.
6. Finally, the degradation mechanisms considered are limited to fouling and erosion
arising from ingested particulate matter and turbine blade tip wear due to its
residual inelastic creep strain.
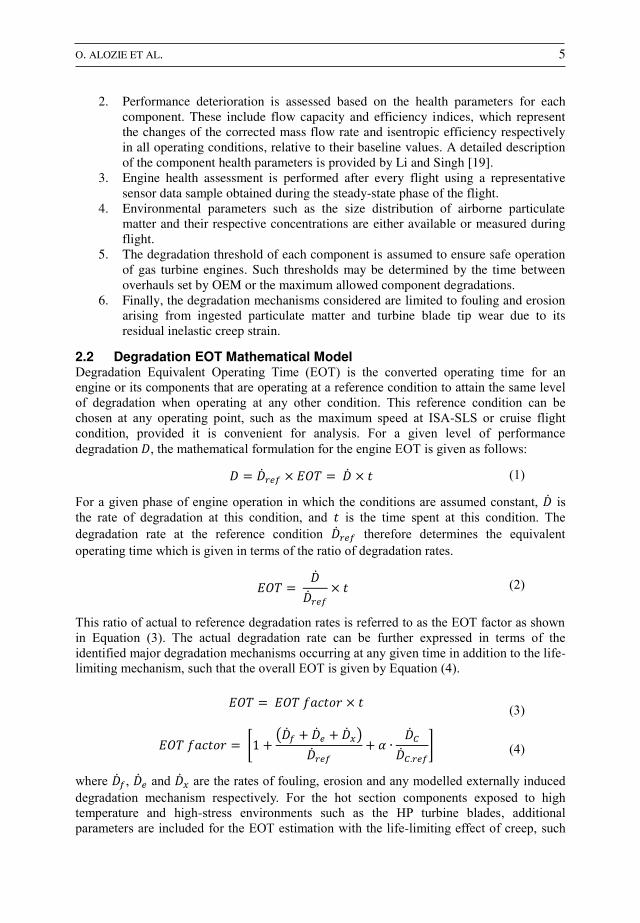
2.2 Degradation EOT Mathematical Model Degradation Equivalent Operating Time (EOT) is the converted operating time for an engine or its components that are operating at a reference condition to attain the same level of degradation when operating at any other condition. This reference condition can be chosen at any operating point, such as the maximum speed at ISA-SLS or cruise flight condition, provided it is convenient for analysis. For a given level of performance degradation 𝐷, the mathematical formulation for the engine EOT is given as follows:
𝐷 = �̇�𝑟𝑒𝑓 × 𝐸𝑂𝑇 = �̇� × 𝑡 (1)
For a given phase of engine operation in which the conditions are assumed constant, �̇� is the rate of degradation at this condition, and 𝑡 is the time spent at this condition. The degradation rate at the reference condition �̇�𝑟𝑒𝑓 therefore determines the equivalent operating time which is given in terms of the ratio of degradation rates.
𝐸𝑂𝑇 = �̇��̇�𝑟𝑒𝑓 × 𝑡 (2)
This ratio of actual to reference degradation rates is referred to as the EOT factor as shown in Equation (3). The actual degradation rate can be further expressed in terms of the identified major degradation mechanisms occurring at any given time in addition to the life-
limiting mechanism, such that the overall EOT is given by Equation (4).
𝐸𝑂𝑇 = 𝐸𝑂𝑇 𝑓𝑎𝑐𝑡𝑜𝑟 × 𝑡 (3)
𝐸𝑂𝑇 𝑓𝑎𝑐𝑡𝑜𝑟 = [1 + (�̇�𝑓 + �̇�𝑒 + �̇�𝑥)�̇�𝑟𝑒𝑓 + 𝛼 ∙ �̇�𝐶�̇�𝐶.𝑟𝑒𝑓] (4)
where �̇�𝑓, �̇�𝑒 and �̇�𝑥 are the rates of fouling, erosion and any modelled externally induced degradation mechanism respectively. For the hot section components exposed to high temperature and high-stress environments such as the HP turbine blades, additional parameters are included for the EOT estimation with the life-limiting effect of creep, such

6
as the actual total creep consumption rate, �̇�𝐶, the reference creep rate �̇�𝐶.𝑟𝑒𝑓 and the contribution of the creep mechanism to diagnosable performance deterioration 𝛼 via blade tip rubs and the resulting increase in tip clearance. In applying the EOT model to a given engine component, the coefficients of relevant terms must be provided, with those of non-
related terms set to zero.
For a complete flight mission made up of 𝑛 micro-phases, the mission EOT is the sum of the individual EOT values evaluated at the different micro-phases, and is given as:
𝐸𝑂𝑇𝑚𝑖𝑠𝑠𝑖𝑜𝑛 = ∑ 𝐸𝑂𝑇𝑖𝑛𝑖=1 = ∑ 𝐸𝑂𝑇 𝑓𝑎𝑐𝑡𝑜𝑟𝑖 × 𝑡𝑖𝑛
𝑖=1 (5)
The following sections will be devoted to discussing the formulation of the degradation rate equations for different engine degradation mechanisms.
2.2.1 Fouling Gas turbine fouling refers to the net deposition of small-sized, fine particulate matter or dust suspended in the air, on the surfaces of gas path components. This process alters the aerodynamic blade profile and introduces surface roughness on the blade, hub and end wall surfaces which adversely affects the flow boundary layer [20]. Severe fouling also reduces the cascade flow area, since these particles are known to accumulate in the mid-chord region, down to the trailing edge, especially on the blade suction side [21]. These phenomena are manifested as reductions in the flow capacity and efficiency of the fouled compressors and turbines stages.
In general, the fouling process involves simultaneous deposition of particles on the blade surfaces by adhesion, dislodgement of deposited particles by inertia collision and subsequent particle re-entrainment back into the flow stream. Hence, the net deposition rate can be expressed as the difference between the particle accretion and detachment rates, �̇�𝑎𝑐𝑐 and �̇�𝑑𝑒𝑡 respectively, as shown in Equations (6) to (8).
𝛿𝑚𝑑𝑝𝛿𝑡 = �̇�𝑑𝑝 = �̇�𝑎𝑐𝑐 − �̇�𝑑𝑒𝑡 (6)
�̇�𝑎𝑐𝑐 = �̇�𝑝𝑃𝑐𝑃𝑠 (7)
�̇�𝑑𝑒𝑡 = 𝑃𝑑𝑚𝑑𝑝 (8)
where �̇�𝑝 is the particle mass flow rate. 𝑃𝑐 is the particle contact probability, which depends on the engine design features such as the annular flow area, number of blades or blade-pitch per row and inertia of the ingested particles, as expressed by the generalised Stokes number, which is a ratio of the particle characteristic stopping or relaxation time to the flow travel time around the blade surface [22,23]. 𝑃𝑠 is the particle sticking probability, which depends on target surface conditions such as the presence of a bonding medium e.g. oil, previously formed deposit layer, phase-change temperatures, etc. and condensed water vapour in the air. Combining 𝑃𝑐 with 𝑃𝑠 gives the accumulation factor or capture ratio 𝜁, which is the proportion of ingested particles that will contact and stick to the gas path surfaces. The detachment probability, 𝑃𝑑 is the ratio of critical to actual particle-wall shear viscosity, 𝜇𝑐𝑟𝑖𝑡 𝜇𝑝⁄ [24] or the ratio of actual to critical wall shear fluid velocity, 𝑢𝑤𝑎𝑙𝑙 𝑢𝑐𝑟𝑖𝑡⁄ [25].

O. ALOZIE ET AL. 7
The particle flow rate into the engine can be substituted with the product of the particle concentration 𝜙𝑝 and the inlet air mass flow rate 𝑊𝑎𝑖𝑟 i.e. �̇�𝑝 = 𝜙𝑝𝑊𝑎𝑖𝑟 , to give:
�̇�𝑑𝑝 = 𝜁𝜙𝑝𝑊𝑎𝑖𝑟 − 𝜆𝑚𝑑𝑝 (9)
Integrating the above differential equation by separation of variables, the mass of deposited particles after a given exposure time interval ∆𝑡 can be expressed by the exponentially-
asymptotic relation as in Clarkson and Simpson [15].
𝑚𝑑𝑝(𝑡) = 𝑚0𝑒−𝜆∆𝑡 + 𝜁𝜙𝑝𝑊𝑎𝑖𝑟𝜆 (1 − 𝑒−𝜆∆𝑡) (10)
where 𝑚0 is the initial mass of particles deposited from previous exposure. For an initial clean, unfouled component, 𝑚0 = 0 and Equation (10) becomes:
𝑚𝑑𝑝(𝑡) = 𝜁𝜙𝑝𝑊𝑎𝑖𝑟𝜆 (1 − 𝑒−𝜆∆𝑡) (11)
where the exponential term can be expanded as a Taylor series: 𝑒−𝜆∆𝑡 = 1 − 𝜆Δ𝑡 + (𝜆Δ𝑡)22! − (𝜆Δ𝑡)33! + ⋯ (12)
Neglecting higher-order terms, the initial mass of deposited particles can be expressed as a linear function of the exposure time interval ∆𝑡 as shown in Equation (13).
𝑚𝑑𝑝(𝑡) = 𝜁𝜙𝑝𝑊𝑎𝑖𝑟 ∙ ∆𝑡 (13)
where the unit time interval of analysis, ∆𝑡 = 1 𝑠𝑒𝑐. is infinitesimal, compared to the total flight operating time of the engine and its components. This calculated initial mass of deposited particles can then be substituted for 𝑚0 in Equation (10) to obtain the progressive deposition rates and quantities at subsequent exposure time steps.
To account for ambient temperature and pressure deviations from standard or reference atmospheric conditions, the corrected mass flow rate 𝑊𝑐𝑜𝑟𝑟 is substituted for 𝑊𝑎𝑖𝑟 , according to Equation (14).
𝑊𝑐𝑜𝑟𝑟 = 𝑊𝑎𝑖𝑟 × √𝑇𝑎 𝑇𝑟𝑒𝑓⁄𝑃𝑎 𝑃𝑟𝑒𝑓⁄ (14)
Since neither of the above flow parameters is known in flight, 𝑊𝑐𝑜𝑟𝑟 must be expressed as a function of a measured, engine control handle, such as the corrected fan speed, 𝑁1𝑟. For the case study engine, the relation between 𝑊𝑐𝑜𝑟𝑟 and 𝑁1𝑟 was determined by the parametric fitting of a quadratic function to the part-speed simulation results of the engine model. The general form of Equation (13) in terms of the engine handle is given as:
𝑚𝑑𝑝(𝑡) = 𝜁𝜙𝑝 ∙ 𝑃𝑎𝑃𝑟𝑒𝑓 √𝑇𝑟𝑒𝑓𝑇𝑎 ∙ 𝑓(𝑁1𝑟) ∙ ∆𝑡 (15)
where

8
𝑊𝑐𝑜𝑟𝑟 = 𝑓(𝑁1𝑟) = 74.388 ∙ 𝑁1𝑟2 − 31.119 ∙ 𝑁1𝑟 + 24.086 (16)
For a maximum capture ratio 𝜁𝑚𝑎𝑥 in dry, unsaturated air of 0.5, the additional effect of ambient relative humidity, 𝑅𝐻0 takes the form of a logistic function in Equation (17) as determined from the simulation of the engine model. The growth rate, 𝑘 = 2.736 was chosen such that 𝜁𝑚𝑎𝑥 = 0.99 when 𝑅𝐻0 = 100% at the reference corrected fan speed.
𝜁𝑚𝑎𝑥 = { 0.5 for 0 ≤ 𝑅𝐻0 ≤ 28.35% 1[1 − 𝑒−𝑘(𝑅𝐻0−28.35)] for 28.35% ≤ 𝑅𝐻0 ≤ 100% (17)
Finally, the initial loss in component health parameters due to fouling, ∆𝑋𝑓 can be given as:
∆𝑋𝑓 ≡ 𝐷𝑓 = 𝑘𝑓𝑘𝑑 ∙ 𝜁𝜙𝑝 ∙ 𝑃𝑎𝑃𝑟𝑒𝑓 √𝑇𝑟𝑒𝑓𝑇𝑎 ∙ 𝑓(𝑁1𝑟) ∙ ∆𝑡 (18)
where 𝑘𝑓 is the fouling factor that expresses the loss in either component flow capacity or efficiency health index due to a unit mass of deposited particles, and 𝑘𝑑 is the distribution factor, since an uneven deposit film is expected for the 3-D flow in each component blade row.
Although gas turbine fouling is strongly non-linear against actual clock time and with respect to changing ambient, environmental and operating conditions, the fouling EOT which expresses the actual fouling rate relative to the nominal rate at a reference condition, can account for the non-linearity of these external factors. Hence, fouling degradation can approach a linear relation against the influence factors when expressed as a function of the EOT for each time interval.
2.2.2 Erosion Erosion in gas turbines involves the abrasive removal of material from the gas path component surfaces due to the impact of high-velocity, hard particles of significant size, contained in the ingested air. Erosion damage is commonly associated with bluntness of the leading edge, and thinning of tip regions and trailing edge of compressor blades, which modifies the aerofoil profile, increases surface roughness and blade running clearance [26,27]. This produces a loss in the flow capacity and efficiency of the affected blade rows or stages. In the turbine, however, acceleration of the particles through the nozzle guide vanes (NGV) produces more erosion at the throat and towards the trailing edge, leading to an increase in the turbine flow capacity as the efficiency drops [28]. According to Diakunchak [29], erosion is usually caused by sand particles, 20 m or more in diameter, when present in sufficient quantities. Meher Homji et al. [30] and Jacobson [31], however, posited that particles above 10 m in diameter would cause erosion in gas turbines.
For an ingested flow of particles with similar physical composition above the erosion size threshold and a known particle size distribution, the component material removal (erosion) rate 𝐸𝑟 can be expressed in Equation (19) [32].
𝐸𝑟 ∝ ∑ �̇�𝑝𝑖𝑑𝑝𝑖𝑣𝑝𝑖𝛼𝑁𝑖=1 (19)

O. ALOZIE ET AL. 9
where 𝑁 refers to the number of particle measurement channels above 10 m and the subscript 𝑖 denotes each channel of mean size 𝑑𝑝𝑖, �̇�𝑝𝑖 is the mass flow rate of ingested particles in band 𝑖, and 𝑣𝑝𝑖 is the impacting velocity of the particles, 𝛼 is the velocity exponent, which has been determined from erosion tests to be between 2.0 and 2.3 for relatively small particles [33]. For this study, 𝛼 = 2 is used.
Substituting the individual impact velocities 𝑣𝑝𝑖 with a mean value �̅�𝑝, and expressing �̇�𝑝𝑖 in terms of particle concentration in air, �̇�𝑝 = 𝜙𝑝𝑖𝑊𝑎𝑖𝑟 , the erosion rate becomes:
𝐸𝑟 = 𝑘𝑟𝑊𝑎𝑖𝑟 �̅�𝑝2 ∑ 𝜙𝑝𝑖𝑑𝑝𝑖𝑁
𝑖=1 (20)
where 𝑘𝑟 is the dimensionless erosion rate which comprises material-dependent factors, such as particle hardness and shape, blade material and coating properties, etc. that influence material removal but does not necessarily vary with engine operating conditions.
The summation term above can be aggregated into an effective particle size parameter 𝐷𝑝, where the contribution of each bin size 𝑑𝑝𝑖 to the total erosion rate is weighted by its relative concentration in the air 𝜙𝑝𝑖 ∑ 𝜙𝑝⁄ . If Φ𝑝𝑁 is the sum of measured particle concentrations ∑ 𝜙𝑝, then Equation (20) becomes:
𝐸𝑟 = 𝑘𝑟𝑊𝑎𝑖𝑟 �̅�𝑝2 𝐷𝑝Φ𝑝𝑁 (21)
where:
𝐷𝑝 = ∑ 𝜙𝑝𝑖𝑑𝑝𝑖𝑁𝑖=1∑ 𝜙𝑝𝑖𝑁𝑖=1 ≡ ∑ 𝜙𝑝𝑖𝑑𝑝𝑖𝑁𝑖=1Φ𝑝𝑁 (22)
The mean particle velocity can also be expressed in terms of the air axial velocity within the engine, based on the force equilibrium assumption for a body in a Newtonian fluid [34].
�̅�𝑝 = 𝑣𝑧(1 − 𝑒−𝑡𝜏/𝜏) (23)
where 𝑣𝑧 is the fluid (air or gas) axial velocity, 𝜏 is the response time constant representing the time required for the particles, initially at the same velocity as the fluid, to decay to approximately 1/𝑒 of their initial value and 𝑡𝜏 is the elapsed travel time, which is measured from the exit of an engine component that impacts energy to the air or gas, such as the fan or compressor. The erosion rate becomes:
𝐸𝑟 = 𝑘𝑟𝑊𝑎𝑖𝑟 𝐷𝑝𝑣𝑧2(1 − 𝑒−𝑡𝜏/𝜏)2 Φ𝑝𝑁 (24)
Since 𝑊𝑎𝑖𝑟 is also a function of the air density 𝜌𝑎, flow area 𝐴𝑎𝑛𝑛 and axial velocity 𝑣𝑧 according to 𝑊𝑎𝑖𝑟 = 𝜌𝑎𝐴𝑎𝑛𝑛𝑣𝑧, then substituting for 𝑣𝑧 as in Equation (25) yields:
𝐸𝑟 = 𝑘𝑟𝑊𝑎𝑖𝑟3 𝐷𝑝Φ𝑝𝑁𝜌𝑎2𝐴𝑎𝑛𝑛2 (1 − 𝑒−𝑡𝜏/𝜏)2 (25)
Correcting the effects of ambient conditions and substituting the engine handle, 𝑁1𝑟 as in Equation (14), the erosion rate can be expressed as:

10
𝐸𝑟 = 𝑘𝑟𝐷𝑝Φ𝑝𝑁𝜌𝑎2𝐴𝑎𝑛𝑛2 [ 𝑃𝑎𝑃𝑟𝑒𝑓 √𝑇𝑟𝑒𝑓𝑇𝑎 ∙ 𝑓(𝑁1𝑟)]3 (1 − 𝑒−𝑡𝜏/𝜏)2 (26)
In terms of the impact on the component health parameters, the degradation due to erosion ∆𝑋𝑒 can be expressed as in Equations (27) and (28):
∆𝑋𝑒 = 𝐸𝑟 ∙ Δ𝑡 (27)
∆𝑋𝑒 ≡ 𝐷𝑒 = 𝑘𝑒𝑘𝑟𝐷𝑝Φ𝑝𝑁𝜌𝑎2𝐴𝑎𝑛𝑛2 [ 𝑃𝑎𝑃𝑟𝑒𝑓 √𝑇𝑟𝑒𝑓𝑇𝑎 ∙ 𝑓(𝑁1𝑟)]3 (1 − 𝑒−𝑡𝜏/𝜏)2 ∙ Δ𝑡 (28)
where 𝑘𝑒 is the erosion factor relating the component flow capacity or efficiency loss due to a unit mass of material removed from the rotor or stator blades and the resulting surface roughness.
2.2.3 Creep-Strain Mechanism In addition to the above degradation processes, the hot section gas path components such as turbine rotor disk, blades and vanes are exposed to additional failure mechanisms that limit their achievable service life. Some of these failure modes also modify the turbine flow geometry, leading to detectable deterioration in engine performance. For example, the inelastic elongation due to creep of HP turbine blades over engine life can cause the blade tips to rub on the casing seal more frequently during transient acceleration from idle to maximum speed at take-off or early climb [35]. This results in increased blade tip-seal clearance during the cruise phase and reduced turbine efficiency as more hot gases are lost as over-tip flows from the pressure side to the suction side. The performance impact is a continuous increase in the engine’s SFC over time since the blades are not restored to their initial length. For this study, only the effect of HP turbine blade creep strain on HP turbine health parameters was analysed for inclusion in the EOT equation.
Previous studies investigating the effect of operating conditions of gas turbine creep damage have considered them as separate from component degradation mechanisms [7,8,36]. However, this failure mechanism which is initiated at the micro-structural level, has a significant impact on the physical geometry and tip surface quality of the blades, which affects the critical gas path flow area and stage efficiency.
The creep model used is based on the Larson-Miller Parameter (LMP) 𝑃 that relates the time to creep failure 𝑡𝑓 of a material to the subjected stress 𝜎 and temperature 𝑇 shown in Equation (29) [7].
𝑃(𝜎) = 𝑇1000 (log 𝑡𝑓 + 𝐶) (29)
where C is a material constant which is set to 20 for most metal alloys.
The LMP can also be applied to determine the time to a certain creep strain value, before actual creep failure, as a function of stress and temperature. Thus, the time taken for a turbine blade to reach 1% creep strain, 𝑡𝜀𝑐=1% can be expressed as a function of the blade temperature 𝑇𝑏 and the stress function for 1% creep strain, 𝑃(𝜎)1% as:

O. ALOZIE ET AL. 11
𝑡𝜀𝑐=1% = 101000∙𝑃(𝜎)1%𝑇𝑏 − 𝐶
(30)
and the creep strain rate can be expressed as:
𝜀𝑐 = 1𝑡𝜀𝑐=1% = 10−(1000∙𝑃(𝜎)1%𝑇𝑏 − 𝐶)
(31)
If the turbine blade tips are just clear of the casing seal at the maximum take-off speed (as obtainable after wear-in of a new engine), then any plastic growth in the blade will cause tip rubs and wear of the casing seal or blade, leading to increased tip gaps. The effect of increased tip clearance 𝛿 on the turbine efficiency 𝜂𝑇 as proposed by Baskherone [37] is given in Equation (32).
𝜂𝑇𝜂𝑇_𝑟𝑒𝑓 = 1 − 𝐾 ( 𝛿𝐿𝑏) ( 𝑟𝑡𝑖𝑝𝑟𝑚𝑒𝑎𝑛) (32)
where 𝜂𝑇_𝑟𝑒𝑓 is the reference turbine efficiency, 𝐿𝑏 is the blade span, 𝑟𝑡𝑖𝑝 and 𝑟𝑚𝑒𝑎𝑛 are the radii from the engine axis to the blade tip and mean-line respectively. 𝐾 is a blade-design constant given by:
𝐾 = 1 + 0.586 (𝜓𝑍𝑡𝑖𝑝 3.63) (33)
where 𝜓𝑍𝑡𝑖𝑝 is the Zwiffel coefficient, which is the pitch-to-axial-chord ratio, 𝑆 𝑐𝑧⁄ at the blade tip, and given in terms of the blade inlet and outlet angles 𝛽1 and 𝛽2 in Equation (34).
𝜓𝑍𝑡𝑖𝑝 = 2𝑆𝑡𝑖𝑝𝑐𝑧,𝑡𝑖𝑝 cos2 𝛽2 [tan 𝛽1 − tan 𝛽2] (34)
The flow capacity and efficiency degradation levels due to the creep-strain-induced blade tip-seal wear can be presented as:
∆𝑋𝑐_𝑓𝑐 = 1 − 𝛿𝛿𝑟𝑒𝑓 (35)
∆𝑋𝑐_𝑒𝑓𝑓 = 1 − 𝜂𝑇𝜂𝑇_𝑟𝑒𝑓 (36)
2.3 EOT Model Implementation The process flow diagram in Figure 1 describes the methodology for computing the post-
flight equivalent operating time of an aircraft gas turbine using in-flight sensor recordings
and physical degradation models for the affected component health indices. The
fundamental requirement is an engine model which defines each gas path component state
via the thermodynamic properties of the air/gas flowing through them. This engine model
must be representative of the actual engine steady-state behaviour in terms of the
configuration, component characteristic maps, control schedule, bleed systems, auxiliary
power off-takes, mechanical losses and performance output.
After each flight mission, a steady-state sample of the flight data is selected and then pre-
processed for noise reduction and data correction to a reference condition. The sensor

12
deviation or fault signature is provided as input for diagnostics of the gas path components
to predict the inherent degradation. This can be accomplished using gas path diagnostic
techniques, such as the non-linear, multiple-component GPA technique described by Li et
al [38]. The predicted degradation in flow capacity and efficiency for each component is
then re-implanted to update the engine model and its performance is simulated for all flight
conditions. Thus, both measured parameters and other important engine parameters for
which no sensors are installed, are generated. Examples of the latter include the
temperature, pressure, density and mass flow rate at the HP turbine NGV and rotor inlet
stations.
Simultaneously, atmospheric particle size distribution and concentration in the vicinity of
the engine inlet may be gathered by direct measurement using aircraft-fitted aerosol particle
counters, at the same sampling rate. Both environmental and relevant engine parameters are
fed into the component-aerosol interaction model, which calculates the impact of the
ingested particles on the component performance deterioration as presented in Figure 2. In
the HP turbine where blade tip-rubs on the casing during rapid acceleration and high pitch
or yaw angle manoeuvers may be an additional source of degradation, the simulated turbine
inlet measurements become an input to a blade creep strain and tip clearance sub-models.
These evaluate the blade tip clearance based on calculated thermo-mechanical strains in the
turbine blades and shroud-casing for each measured operating condition. In the event of
contact between the blade and the casing seal due to blade plastic elongation, the impact of
material loss on the performance of the turbine may also be computed.
With the above information, the EOT factor is obtained by expressing the component
degradation rate relative to its reference value. The Equivalent Operating Time is then
calculated by multiplying the actual flight time by the EOT factor and compared to the
operating limit set by the engine manufacturer. If the total consumed EOT is less than this
limiting operation threshold, the Remaining Useful Life (RUL) is calculated. Otherwise, the
component must undergo a physical inspection to determine if its true condition deserves
engine removal or overhaul. It is noteworthy that where the EOT exceeds the threshold, the
engine may be yet to attain this limit in actual flight hours. However, the use of EOT based
on the severity of the historical engine operating profile enables the operator to monitor the
true engine experience in addition to the on-wing time, and make well-informed, condition-
based, maintenance scheduling decisions.

O. ALOZIE ET AL. 13
Engine
Modelling
Performance
Adaptation
Flight
Operation
Environmental
Data Acquisition
Engine Data
Acquisition &
Pre-processing
Aerosol-Component
Interaction model
Optimum
Sensor
Selection
Component
Health
Diagnostics
Critical HP
Component?
HPT Blade-
Disk Strain
Calculation
RUL
Prediction
Blade Tip Wear
and Clearance
model
Simulate HPT
inlet flow
conditions
HPT Blade
Creep Strain
model
EOT
EvaluationEOT < TEOL?
Reference
conditions from
OEM data
Re-implant
diagnosed
degradation in
engine model
Recommend
inspection or
engine
overhaul
Aero – Gas Turbine
with installed sensors
Initial Test
Measurements
In-flight
measurementsNo
Yes
Yes
No
A
A
Figure 1 Implementation of the EOT assessment model.

14
Centrifuging of
large particles into
bypass stream
(dp > ~50um)Particles evade
blade/vane
(Pst = 0)
Particles strike
blade/vane
(Pst ~ 1)
Striking
probability,
Pst
Pure
rebound
from blade
Dislodge
blade
material
Embed into
blade
Particles
deposit on
blade surface
(Pc ~ 1)
Particles evade
blade surface
(Pc = 0)
Contact
probability,
Pc
Particle
shedding
parameter, l
Re-entrainment
back into flow
stream
Ingestion of smaller
particles into
engine core
(dp < ~50um)
Particles of size
above erosion
threshold
(dp > 10 um)
Particles of size
below erosion
threshold
(dp < 10 um)
Total effluence
rate from fore
stage/
component to
downstream
stages/
components
Also particle mass
flow rate input to
gas path
component or stage
Particle or dust
cloud encountered
in flight
(Sticking
Probability,
Sp ~ 1)
Particles
remains
deposited
Determines
component
fouling rate
+
+
+
Atmosphere Intake Duct Integrated Inner Fan and Booster (IF + B) HPC Inlet
Outer Fan and Bypass Duct
Figure 2 Mass flow balance of ingested particles through the integrated inner fan and booster compressor.

15
3.0 ENGINE PERFORMANCE MODEL VALIDATION
For this study, an aero gas turbine performance model similar to CFM56-7B engine, which is a 2-spool turbofan powering the Boeing 737 NG fleet for a mid-long haul transport, was chosen. The engine model was set up and its performance adapted and simulated using the Cranfield University’s gas turbine simulation and diagnostics software, PYTHIA [19]. Figure 3 shows the schematic of the engine model with air bleed network and station numbers. The nominal performance of the engine at take-off for sea-level static ISA conditions is given as follows [39]:
Takeoff thrust 120.7 kN
Total pressure ratio 26.97
Maximum fan speed 4876 rpm
Bypass ratio 5.94
SFC 10.2 kg/MN.s
Exhaust gas temperature (T5) 850 K
Figure 3 Turbofan Engine Model.
3.1 Performance Adaptation To match the engine model performance to the real engine sensor readings obtained from part-load operation at the start of its ground test, both design point and off-design performance adaptation were performed. The design point adaptation was done using the non-linear Adaptation Coefficient Matrix method [40] to tune the component parameters in order to match the test measurements at the chosen design point of 91.62% maximum fan speed. The accuracy of the model after design point adaptation is presented in Table 1, with all measurement errors below 0.001%. Due to the confidential nature of the engine data, only the initial and final errors are shown.

16
The off-design adaptation was done using a Genetic Algorithm [41] to optimize and scale the flow capacity, efficiency and pressure ratios in the OEM compressor and turbine maps, and efficiency in the combustor map, in order to match the measurements at lower speed lines. Three (3) off-design data sets at conditions shown in Table 2 were found to produce the minimum overall error between simulated and target measurements, compared to other cases investigated. The root mean squared (RMS) error between the predicted and target measurements was the objective function minimized by the GA.
Table 1 Design Point Adaptation Errors for Engine Performance Parameters
Target Performance Parameter Symbol Initial Error (%)
Post-Adaptation Error (%)
Engine inlet total pressure P10 1.38 4.7e-5
HPC inlet total temperature T25 3.53 2.5e-5
HPC inlet total pressure P25 -2.96 3.8e-5
HPC exit total temperature T3 5.58 6.1e-5
HPC exit total pressure P3 12.32 2.2e-6
LPT NGV 1 exit total temperature T495 5.00 5.7e-5
LPT NGV 1 exit total pressure P495 5.99 2.3e-4
LPT exit total temperature T5 4.66 1.4e-4
LPT exit total pressure P5 6.74 5.8e-4
Fuel flow WFF 6.26 1.4e-4
Net thrust FN 1.83 2.0e-4
HP spool corrected speed N2r25 -- --
The plots in Figure 4 show the outcome of the component map tuning on some key measurement turbine parameters. For the other parameters, the initial errors before adaptation were not significant. The improved accuracy of the model to within 98% of the engine data at lower speed setting highlights the importance of the off-design adaptation procedure.
Table 2 Design Point and Off-design Adapted Condition Settings
Data
Ambient Temperature
(oC)
Ambient Pressure
(atm)
Corrected Fan Speed
(%) Adapted design point 7.0 0.9873 91.62
Off-design setting 1 7.0 0.9874 87.09
Off-design setting 2 6.9 0.9877 85.08
Off-design setting 3 6.6 0.9875 80.19

O. ALOZIE ET AL. 17
Figure 4 Comparison between the target and simulated engine model measurements before and
after off-design adaptation.
3.2 Optimum Sensor Selection for Diagnostics Although engine measurements from 14 installed gas path sensors were available, sensors
that provide the most visibility of engine faults had to be identified using the selection
procedure proposed by Jasmani et al. [42]. The fault sensitivity of the sensors was obtained
by implanting 1% degradation in each component health index and simulating the engine
model measurement parameters at constant corrected fan speed and in off-design mode.
The resulting measurement sensitivity is revealed in Figure 5 and summarized using the
sensitivity norm in Table 3, where it can be seen that the fuel flow (WFF) is the most
sensitive to component faults and the fan exit total temperature (T13) is the least sensitive.
Figure 5 Simulated sensor deviations for unit degradation in component health parameters.

18
Table 3 Normalized sensor sensitivity
Parameters W1 T13 P13 T25 P25 T3 P3
Sensitivity Norm 0.688 0.221 0.642 0.582 2.289 0.773 1.697
Parameters WFF T495 P495 T5 P5 FN N2r25
Sensitivity Norm 2.719 1.461 1.472 1.681 0.640 1.485 0.828
Analysis of the correlation between sensors to identify those with similar fault signature profiles for deselection was also done. P13 was found to be highly correlated with Mass flow (W1) and Net thrust (FN) so that the 2 least sensitive sensors out of these 3 were eliminated. Although T495 is seen to be highly correlated and less sensitive when compared with T5, it was retained since it gives the best indication of the crucial TET, especially for the HP turbine component subset.
An optimum subset of 8 sensors was finally selected, comprising 7 main sensors for the gas path components and 1 for redundancy in the event of a sensor fault as shown in Table 4. This subset is capable of producing the most relevant and unique fault signature needed to accurately isolate and predict faults in all possible component fault cases using the Gas Path Analysis (GPA) diagnostics method [38].
Table 4 Selected optimum sensors for diagnostics
S/N Sensor Description Component Subset 1 P25 Booster exit total pressure (atm) Inner fan + Booster 2 P3 HP compressor inlet total pressure (atm) HPC
3 T495 LP turbine stage 2 inlet total temperature (K) HPT
4 P495 LP turbine stage 2 inlet total pressure (atm) LPT 1
5 T5 LP turbine exit total temperature (K) LPT 2-5
6 WFF Fuel flow (kg/s) Burner 7 N2r25 HP spool relative corrected speed (%) HPT / HPC
8 FN Net thrust (kN) Outer fan
4.0 EFFECT OF OPERATING CONDITIONS ON EOT
To assess the effect of changes in engine operating conditions on the EOT factors for
fouling, erosion and creep-strain wear degradation, under constant particle size distribution
and concentration, the adapted engine model performance was simulated for various cases.
These include changes in altitude, Mach number, ambient temperature and relative
humidity, all under constant fan speed, as well as a separate part-speed simulation.
4.1 Changes in Altitude Figure 6 shows the deviations in key engine parameters with respect to their reference
values, for step changes in take-off altitude from 500 m below sea-level to 5000 m above.
With increasing altitude, the ambient temperature drops linearly, with the air density and
pressure dropping exponentially. The constant fan speed control schedule leads to an
increase in the corrected fan speed, and therefore a rise in the pressure ratio and corrected
air mass flow through the engine, as inferred from the inner fan and booster map. However,

O. ALOZIE ET AL. 19
the actual core air mass flow decreases, leading to a drop in the ingestion rate for a given
unit particle concentration in air.
Figure 6 Deviations in performance parameters with changes in altitude.
In Figure 7, the EOT fouling factor in the inner fan + booster component relative to the
reference sea-level condition starts at 1.05 and drops at an average rate of 0.4% for every
100 m. The relative erosion factor, which depends on the air/particle velocity in addition to
the mass flow rate, drops initially at a gradient of 0.0143 per 100 m, down to 0.004 per 100
m. In the HP turbine, relative fouling and erosion EOT factors follow similar trends to those
in Figure 7(a) due to the turbine mass flow rate being the sum of the engine air inlet flow
and the fuel flow rates minus the compressor bleeds. However, they are less sensitive to
altitude variation compared to the thermo-mechanical creep effects. Hence, the relative
creep-strain EOT factor reduces with TET from an initial rate of 0.035 per 100m and
asymptotes to 0.001 at 5000 m.
Figure 7 EOT factors for (a) inner fan + booster, and (b) HP turbine degradations, relative to
the reference condition for changing altitude.
4.2 Changes in Flight Mach Number The engine performance summary obtained from the simulation of increasing Mach number
from 0 to 0.5 at constant sea-level altitude and fan speed is presented in Figure 8. The
observed trends can be ascribed to the ram compression in the intake duct, which causes the

20
stagnation temperature, pressure and air mass flow rate at the fan inlet to increase. At
constant fan speed, the booster pressure ratio and corrected mass flow drop as dictated by
the characteristic map. However, due to the ram pressure ratio being greater than the
ensuing temperature ratio, the actual intake mass flow increases.
Figure 8 Deviations in performance parameters with changes in flight Mach number.
The increased mass flow causes the relative fouling effect to increase non-linearly at a
constant rate up to a factor of 1.10 at the maximum permissible sea-level Ma = 0.5 as
shown in Figure 9(a) and (b). The relative erosion factor, however, follows an exponential
trend, with an initial growth rate of 0.058 at Ma = 0.05 up to 1.34 at Ma = 0.5 and an EOT
factor of 1.32 at Ma = 0.5. For the HP turbine, the final creep-strain EOT factor at Ma=0.5
is 1.26 due to the increased TET needed to accelerate the engine/aircraft.
Figure 9 EOT factors for (a) inner fan + booster, and (b) HP turbine degradations, relative to
the reference condition for changing flight Mach number.
4.3 Changes in Ambient Temperature The effects of changes in ambient temperature at sea-level on key performance parameters
are plotted in Figure 10. On a relatively hot day, the air entering the engine is less dense
than normal, leading to a reduction in the corrected mass flow rate and booster pressure
ratio as the corrected fan speed reduces. The actual mass flow rate, therefore, drops by a
larger extent than its corrected equivalent, given that the inlet pressure remains unchanged.

O. ALOZIE ET AL. 21
This leads to a reduction in the calculated EOT fouling and erosion factors relative to the
reference condition when the engine operates under constant ambient particle
concentration. This phenomenon is reversed on a colder day, as the fouling and erosion
factors increase.
Figure 10 Deviation in performance parameters with changes in ambient temperature.
Figure 11(a) and (b) shows that for a reference temperature of 7 oC, the relative fouling
factor drops by an average factor of 0.027 for every 5 oC rise in ambient temperature. The
erosion rate follows a more non-linear demise, starting steeply with a relative EOT factor of
1.35 and -0.095 gradient at -15 oC and ending with 0.6 erosion factor and -0.037 gradient at
45 oC. The HP turbine creep-strain EOT factor increases exponentially with day
temperature up to 35 times at 45 oC, which enhances the importance of take-off and climb
de-rate on hot days.
Figure 11 EOT factors for (a) inner fan + booster (b) HP turbine degradation, relative to the
reference condition for changing ambient temperature.
4.4 Changes in Relative Humidity The effect of changing ambient relative humidity on core engine performance parameters is
presented in Figure 12. Increasing relative humidity from 0 to 100% only slightly increases
the total mass flow rate into the engine because of the higher water vapour content in the
air. This produces a marginal reduction in the booster and HP compressor pressure ratios,

22
which lowers the power requirement from the HP turbine. The HP turbine operates at a
lower TET, although the fuel flow is increased due to the lower burner inlet total pressure.
All performance changes observed were below 1% of their reference values.
Figure 12 Deviation in performance parameters with changes in ambient temperature.
The effect of humidity on the fouling rate and EOT factor is also dependent on the potential
wetting of the foulants and gas path surfaces as the water vapour condenses, which
enhances the particle sticking probability or capture ratio [43]. In Figure 13(a), the
acceleration of air in the engine intake results in saturated vapour conditions being met at
the fan inlet at 𝑅𝐻0 = 28.35%, i.e. 𝑅𝐻2 = 100%. This implies that when 𝑅𝐻1 = 100%,
the number and impact of deposited particles in the booster front stages would be twice as
much, compared to the reference condition, 𝑅𝐻1 = 0%.
The relative humidity does not have a significant effect on the erosion EOT factors in both
components and only produces a 4% reduction in HP turbine creep-strain EOT factor due to
the reduced firing temperature.
Figure 13 EOT factors for (a) inner fan + booster, and (b) HP turbine degradation, relative to
the reference condition for changing ambient relative humidity.
4.5 Changes in Fan Speed With the fan speed decelerated from 100% to 45% at the reference ambient condition, the
deviations of the simulated engine performance results are shown in Figure 14. Engine part

O. ALOZIE ET AL. 23
speed operation is accompanied by a non-linear reduction in the mass flow rate and overall
pressure ratio in the compressor, reduced fuel flow and TET in the burner, and linear drop
in HP spool speed.
Figure 14 Deviation in performance parameters with changes in fan speed.
The mass flow reduction caused the relative EOT fouling factor to reduce significantly by a
factor of 0.73 over the speed range considered, while the drop in relative EOT erosion
factor followed a more aggressive path, starting at 1.54 and 0.07 gradient under maximum
speed to 0.08 and 0.004 slope at 45% fan speed as seen in Figure 15(a) and (b). In the HP
turbine, the creep strain EOT is insignificant below the reference speed and rapidly
increases under over-speed conditions, up to 20 at 100% fan speed, due to higher TET and
HP speed values.
Figure 15 EOT factors for (a) inner fan + booster, and (b) HP turbine degradation, relative to
the reference condition for part-speed operation.
5.0 SINGLE-FLIGHT MISSION EOT ANALYSIS
5.1 Flight Description A 3.71-hour simulated flight from Kaedi airport, Mauritania to Portela airport, Lisbon was
used as a case study to demonstrate the application of the EOT assessment model for a
flight cycle where environmental PM measurements are available. This flight trajectory was

24
adopted because of the dust particle count and size distribution measurements recorded at
low-altitude and under flight conditions as part of the dust characterization survey in the
Western Sahara region and Southern Mauritania. The observations were made from particle
counters and aerosol spectrometer probes installed on a BAe 146 science aircraft and
operated by the Facilities for Airborne Atmospheric Measurements (FAAM) team as part of
the FENNEC campaign in June 2012 [44]. Figure 16 shows the altitude, Mach number and engine fan speed readings, with the first 2,500 seconds obtained from the science flight data record.
Figure 16 Engine condition and control parameters for the flight cycle.
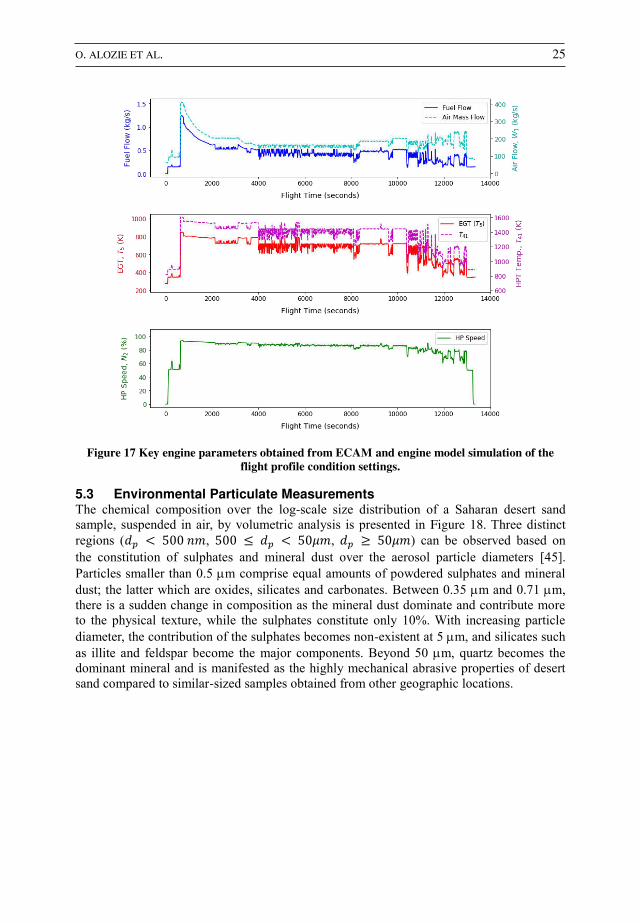
5.2 Flight Measurements The engine parameters that would have been recorded by the Electronic Centralized Aircraft Monitor (ECAM) were obtained by simulation of the clean engine model performance, under the flight condition settings with 10% take-off de-rate and a sampling rate of 1 Hz. These parameters are plotted against the left-axes in Figure 17.
As expected, the points of maximum fuel flow, HP spool speed and exhaust gas temperature (T5) occurred just at the commencement of take-off, while the cruise phases, characterized by level flight altitude, had relatively stable, steady-state measurements. All sensor perturbations observed in the cruise phase were mainly a result of sensor noise and uncertainty in actual fan speed readings, which were mitigated by exponential-average smoothing and data correction to the reference condition. The critical engine parameters not usually measured by the ECAM were also obtained by the simulation of the engine model performance in PYTHIA over the specified flight profile and are plotted on the right-axes in Figure 17.
O. ALOZIE ET AL. 25
Figure 17 Key engine parameters obtained from ECAM and engine model simulation of the
flight profile condition settings.
5.3 Environmental Particulate Measurements The chemical composition over the log-scale size distribution of a Saharan desert sand sample, suspended in air, by volumetric analysis is presented in Figure 18. Three distinct regions (𝑑𝑝 < 500 𝑛𝑚, 500 ≤ 𝑑𝑝 < 50𝜇𝑚, 𝑑𝑝 ≥ 50𝜇𝑚) can be observed based on the constitution of sulphates and mineral dust over the aerosol particle diameters [45]. Particles smaller than 0.5 m comprise equal amounts of powdered sulphates and mineral dust; the latter which are oxides, silicates and carbonates. Between 0.35 m and 0.71 m, there is a sudden change in composition as the mineral dust dominate and contribute more to the physical texture, while the sulphates constitute only 10%. With increasing particle diameter, the contribution of the sulphates becomes non-existent at 5 m, and silicates such as illite and feldspar become the major components. Beyond 50 m, quartz becomes the dominant mineral and is manifested as the highly mechanical abrasive properties of desert sand compared to similar-sized samples obtained from other geographic locations.

26
Figure 18 Chemical composition of the desert sand sample.
Figure 19 (a) and (b) show the dust volume concentration per cm3 of air, varying with altitude, with up to 140 cm-3 between 0.1 m and 3 m particle diameters, and up to 3.2 cm-3 between 3 m and 50 m diameter, as measured with a Cloud Droplet Probe (CDP) and Passive Cavity Aerosol Spectrometer Probe (PCASP) respectively [46]. It can be seen that most of the particle concentration falls below 3 m and that environmental dust is an issue for low altitudes and in the harsh desert atmosphere, while at the destination airport, the aerosol probes registered insignificant quantities.
Figure 19 Measured dust concentration in air of various nominal particle sizes over the flight.
The impact of ingested particles on the core engine component deterioration with respect to
the exposure time was then quantified using the EOT equations for fouling and erosion as
discussed below.

O. ALOZIE ET AL. 27
5.4 Flight EOT Using the EOT model equations, the individual and combined EOT factors were estimated
and plotted against flight time for the integrated inner fan + booster and HP turbine
modules in Figure 20 and Figure 21 respectively. These plots show that for the cruise
phase, the calculated EOT was equal to the actual time (EOT factor ~ 1) as externally-
induced degradation is absent. During take-off and early climb, however, the high dust
levels which contribute mainly to fouling resulted in an EOT greater than the actual time,
with a maximum fouling EOT factor of 4.45 for the LP compressor and 3.22 for the HP
turbine, just before the retraction of the aircraft wing flaps. The erosion EOT factor was
close to 1.0 in both cases as a result of low concentration of particles larger than 10 m at
any point.
Figure 20 Calculated fouling and erosion EOT over the flight for the inner fan + booster.
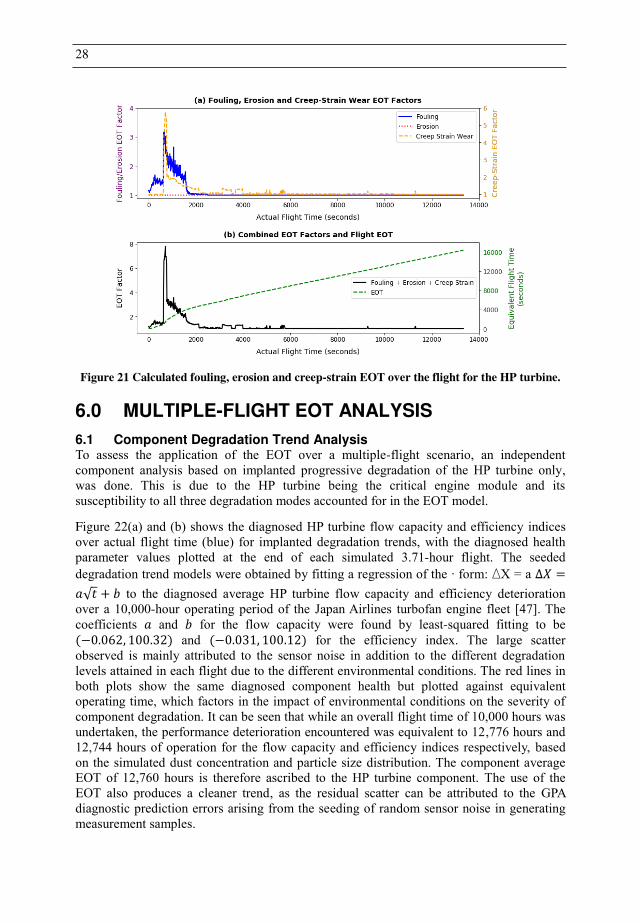
In Figure 21, thermo-mechanical strain effects in the HP turbine blades resulted in
additional EOT increase of 5.75 at 𝑡 = 710 𝑠𝑒𝑐𝑠 due to the combined rotor inlet
temperature and HP shaft speed, and therefore the creep strain rate, being higher than the
pre-defined reference maximum value. On landing, the absence of significant natural or
anthropogenic dust levels meant that no additional degradation occurred in this phase and
an EOT of 1 was calculated.
Thus, although the actual flight time was 3.71 hours, the relatively high particulate matter
concentration favouring fouling during take-off led to a 14.8% increase in LP compressor
degradation rate, to achieve an EOT of 4.26 hours. Combined with the slightly higher
maximum TET above the reference value, a 22.5% increase in HP turbine degradation rate
and EOT = 4.54 hours was recorded. It should be noted that this case-study flight scenario
is an example of a one-off operation under severe conditions that the aircraft engine would
not always be subjected to.
28
Figure 21 Calculated fouling, erosion and creep-strain EOT over the flight for the HP turbine.
6.0 MULTIPLE-FLIGHT EOT ANALYSIS
6.1 Component Degradation Trend Analysis To assess the application of the EOT over a multiple-flight scenario, an independent component analysis based on implanted progressive degradation of the HP turbine only, was done. This is due to the HP turbine being the critical engine module and its susceptibility to all three degradation modes accounted for in the EOT model.
Figure 22(a) and (b) shows the diagnosed HP turbine flow capacity and efficiency indices over actual flight time (blue) for implanted degradation trends, with the diagnosed health parameter values plotted at the end of each simulated 3.71-hour flight. The seeded degradation trend models were obtained by fitting a regression of the ∙ form: ΔX = a ∆𝑋 =𝑎√𝑡 + 𝑏 to the diagnosed average HP turbine flow capacity and efficiency deterioration over a 10,000-hour operating period of the Japan Airlines turbofan engine fleet [47]. The coefficients 𝑎 and 𝑏 for the flow capacity were found by least-squared fitting to be (−0.062, 100.32) and (−0.031, 100.12) for the efficiency index. The large scatter observed is mainly attributed to the sensor noise in addition to the different degradation levels attained in each flight due to the different environmental conditions. The red lines in both plots show the same diagnosed component health but plotted against equivalent operating time, which factors in the impact of environmental conditions on the severity of component degradation. It can be seen that while an overall flight time of 10,000 hours was undertaken, the performance deterioration encountered was equivalent to 12,776 hours and 12,744 hours of operation for the flow capacity and efficiency indices respectively, based on the simulated dust concentration and particle size distribution. The component average EOT of 12,760 hours is therefore ascribed to the HP turbine component. The use of the EOT also produces a cleaner trend, as the residual scatter can be attributed to the GPA diagnostic prediction errors arising from the seeding of random sensor noise in generating measurement samples.

O. ALOZIE ET AL. 29
Figure 22 Diagnosed HPT flow capacity and efficiency indices over actual and equivalent hours.
6.2 RUL Prediction The implication of this difference is revealed in predicting the remaining useful life of the component in concern. Figure 23 shows the plot of EOT against actual flight time for the HPT overall health. The nature of the degradation was such that the engine HP turbine was seeded with a normally-distributed concentration of dust particles, about the same size channels and within the limiting values observed in the single-flight case, implanted randomly over its 10,000 hours of operation. Also, at about 4,000 hours, tip rubs of the blade on the casing were seeded, causing the EOT to deviate from the actual time and signifying more severe engine operation than normal. This tip wear process ceased to occur after about 8,000 hours as the tip clearance was stabilized, causing the EOT to exhibit the same gradient as the actual flight time, albeit at a higher absolute value.
Figure 23 Calculated EOT vs Actual Flight Time for the HP turbine.
For an assumed baseline time-to-overhaul or shop visit interval of 15,000 hours based on the maximum permissible turbine degradation [48], the remaining useful life would be 5,000 hours according to the actual engine flight time. The median remaining useful life for the HPT based on the EOT would, however, be 2,240 hours, which is 45% of the actual flight-time-based RUL. Applying a 95% prediction interval to the 10-point moving-average forecast extrapolation, a lower bound (pessimistic) RUL of 1,700 hours is obtained, which is only 34% of the RUL according to the original engine clock hours.

30
7.0 CONCLUSION
A method for estimating the degradation equivalent operating time (EOT) to account for the effect of changes in environmental and engine operating conditions on the progression of component degradation has been presented in this paper. The EOT model accounted for 3 degradation modes namely fouling, erosion and performance deterioration effects of HP turbine blade creep-strain leading to tip-rubs.
The effect of ambient, flight and engine thrust setting operating conditions on the predicted EOT factors were assessed through simulation of a turbofan engine performance model under these cases. The results showed that the EOT is able to capture the severity of changes in engine operation when compared to a pre-defined reference condition.
Two cases, based on a single and multiple flight cycles, were investigated to test the capability of the equivalent operating time in providing a better measure of the progression of degradation compared to the actual flight time. For the single flight case, the engine at recorded EOT values in the inner fan + booster and HP turbine components equal to 14.8% and 22.5% respectively, more than the actual flight duration mainly due to fouling and higher TETs encountered during take-off. Finally, with randomly-implanted HP turbine degradation over multiple flights in a 10,000-hour operating period, the EOT model revealed a 27.6% increase in equivalent time, resulting in a 55% reduction in the calculated time to degradation threshold (i.e. the remaining useful life) when compared to using the actual engine on-wing flight time.
ACKNOWLEDGEMENTS
The authors would like to thank the Shenyang Engine Design and Research Institute (SEDRI) of the Aircraft Engine Corporation of China (AECC) for providing funding and technical engine data necessary to carry out this research.
REFERENCES
1. James W., O’Dell P. Derated Climb Performance in Large Civil Aircraft, Article 6. Boeing Performance and Flight Operations Engineering Conference. 2005;
2. Donaldson R., Fischer D., Gough J., Rysz M. Economic Impact of Derated Climb
on Large Commercial Engines. 2007 Boeing Performance and Flight Operations
Engineering Conference. 2007; : 8.1-8.11.
3. Yong Huang Z., Wagner D., Bathias C., Louis Chaboche J. Cumulative fatigue
damage in low cycle fatigue and gigacycle fatigue for low carbon-manganese steel.
International Journal of Fatigue. Elsevier Ltd; 2011; 33(2): 115–121. Available at:
DOI:10.1016/j.ijfatigue.2010.07.008
4. Janawitz J., Masso J., Childs C. Heavy-Duty Gas Turbine Operating and
Maintenance Considerations. Atlanta, GA; 2015. Available at: DOI:GER-3620M
5. Lee J. Total Operating Activities of Gas Turbine Components - Total Equivalent
Operating Hours (TEOH). International Gas Turbine and Aeroengine Congress and
Exhibition. Indianapolis, Indiana; 1999. pp. 1–4.
6. Zhou D., Wei T., Zhang H., Ma S., Weng S. A Damage Evaluation Model of
Turbine Blade for Gas Turbine. Journal of Engineering for Gas Turbines and
Power. 2017; 139(September): 1–9. Available at: DOI:10.1115/1.4036060
O. ALOZIE ET AL. 31
7. Abdul Ghafir MF., Li YG., Wang L., Zhang W. Impact Analysis of Aero-engine
Performance Parameter Variation on Hot Section’s Creep Life Using Creep Factor Approach. American Institute of Aeronautics and Astronautics. 2011; 16(9): 1–12.
8. Eshati S., Abu A., Laskaridis P., Haslam A. Investigation into the Effects of
Operating Conditions and Design Parameters on the Creep Life of High Pressure
Turbine Blades in a Stationary Gas Turbine Engine. 2011; 15(3): 237–247.
9. Hanumanthan H., Stitt A., Laskaridis P., Singh R. Severity estimation and effect of
operational parameters for civil aircraft jet engines. Proceedings of the Institution of
Mechanical Engineers, Part G: Journal of Aerospace Engineering. 2012; 226(12):
1544–1561. Available at: DOI:10.1177/0954410011424854
10. Gotoh J., Yasushi H., Shigeo S., Hiraku I. US007065471B2: Method and System
for Diagnosing State of Gas Turbine. United States: United States Patent; 2006.
11. Wan A., Gu F., Chen J., Zheng L., Hall P., Ji Y., et al. Prognostics of gas turbine: A
condition-based maintenance approach based on multi-environmental time
similarity. Mechanical Systems and Signal Processing. 2018; 109: 150–165.
Available at: DOI:10.1016/j.ymssp.2018.02.027
12. Seemann R., Langhans S., Schilling T., Gollnick V. Modeling the Life Cycle Cost
of Jet Engine Maintenance. Deutscher Luft- und Raumfahrtkongress. 2011;
(September): 663–672.
13. Ackert S. Engine Maintenance Concepts for Financiers. Aircraft Monitor. 2011;
(2): 30.
14. Wensky T., Winkler L., Friedrichs J. Environmental Influences on Engine
Performance Degradation. Proceedings of ASME Turbo Expo 2010: Power for
Land, Sea and Air. Glasgow, UK; 2010. pp. 1–6.
15. Clarkson R., Simpson H. Maximising Airspace Use During Volcanic Eruptions : Matching Engine Durability against Ash Cloud Occurrence. Sto-Mp-Avt-272.
2017; (June): 1–20. Available at: DOI:10.14339/STO-MP-AVT-272
16. Prata AT., Dacre HF., Irvine EA., Mathieu E., Shine KP., Clarkson RJ. Calculating
and communicating ensemble-based volcanic ash dosage and concentration risk for
aviation. Meteorological Applications. 2019; 26(2): 253–266. Available at:
DOI:10.1002/met.1759
17. Zaita A V., Buley G., Karlsons G. Performance Deterioration Modeling in Aircraft
Gas Turbine Engines. Journal of Engineering for Gas Turbines and Power. 1998;
120(2): 6. Available at: DOI:10.1115/1.2818128
18. Bojdo N., Filippone A. Effect of Desert Particulate Composition on Helicopter
Engine Degradation Rate. 40th European Rotorcraft Forum. Southampton, UK;
2015. Available at: DOI:10.13140/2.1.2959.8086
19. Li YG., Singh R. An Advanced Gas Turbine Gas Path Diagnostic System -
PYTHIA. VII International Symposium on Air Breathing Engines. Munich,
Germany; 2005. pp. 1–13.
20. Meher-homji CB., Focke AB., Wooldridge MB. Fouling of Axial Flow
Compressors - Causes, Effcets, Detention, And Control. Proceedings of the
Eighteenth Turbomachinery Symposium. 1989; : 55–76.
21. Igie U., Goiricelaya M., Nalianda D. Aero engine compressor fouling effects for
short- and long-haul missions. 2016; 230(7): 1312–1324. Available at:
DOI:10.1177/0954410015607897
22. Israel R., Rosner DE. Use of a Generalized Stokes Number to Determine the
Aerodynamic Capture Efficiency of Non- Stokesian Particles from a Compressible
Gas Flow. Aerosol Science and Technology. 1982; 2(1): 45–51. Available at:

32
DOI:10.1080/02786828308958612
23. Bojdo N., Ellis M., Filippone A., Pawley A. Particle-Vane Interaction Probability
in Gas Turbine Engines. Journal of Turbomachinery. 2019; 141(September): 1–13.
Available at: DOI:10.1115/1.4043953
24. Shrinivas Sreedharan S., Tafti DK. Effect of Blowing Ratio on Early Stage
Deposition of Syngas Ash on a Film-Cooled Vane Leading Edge Using Large Eddy
Simulations. Journal of Turbomachinery. 2013; 135(6): 061005. Available at:
DOI:10.1115/1.4025153
25. El-Batsh H. Modeling Particle Deposition on Compressor and Turbine Blade
Surfaces. Vienna University of Technology; 2001.
26. Hamed A., Tabakoff W., Singh D. Modeling of Compressor Performance
Deterioration Due to Erosion. International Journal of Rotating Machinery. 1998;
4(4): 243–248.
27. Suman A., Morini M., Aldi N., Casari N., Pinelli M., Spina PR. A Compressor
Fouling Review Based on an Historical Survey of ASME Turbo Expo Papers.
Journal of Turbomachinery. 2017; 139(4): 041005. Available at:
DOI:10.1115/1.4035070
28. Hamed A., Tabakoff W. Turbine Blade Surface Deterioration by Erosion. Journal
of Turbomachinery. 2005; 127(3): 445. Available at: DOI:10.1115/1.1860376
29. Diakunchak IS. Performance Deterioration in Industrial Gas Turbines. Journal of
Engineering for Gas Turbines and Power. 1992; 114(2): 161. Available at:
DOI:10.1115/1.2906565
30. Meher-homji CB., Chaker MA., Motiwala HM. Gas Turbine Performance
Deterioration. 30th Turbomachinery Symposium, Texas A&M University. Texas;
2001. pp. 139–176.
31. Jacobson DH. Gas Turbines. Major Process Equipment Maintenance and Repair.
Exxon Co.; 1997. pp. 442–479.
32. Van der Walt JP., Nurick A. Erosion of dust-filtered helicopter turbine engines Part
II: Erosion Reduction. Journal of Aircraft. 1995; 32(1): 112–117. Available at:
DOI:10.2514/3.56919
33. Smeltzer CE., Gulden ME., McElmury SS., Compton WA. Mechanisms of Sand
and Dust Erosion in Gas Turbine Engines. Fort Eustis, Virginia; 1970. Available at:
DOI:AD0876584
34. Kim J., Dunn MG., Baran AJ., Wade DP., Tremba EL. Deposition of Volcanic
Materials in the Hot Sections of Two Gas Turbine Engines. Journal of Engineering
for Gas Turbines and Power. 1993; 115(3): 641. Available at:
DOI:10.1115/1.2906754
35. General Electric Aircraft Engines. HPT Clearance Control - Intelligent Engine
Systems - Phase 1. Cincinnati, Ohio; 2005.
36. Abu AO., Eshati S., Laskaridis P., Singh R. Aero-engine turbine blade life
assessment using the Neu/Sehitoglu damage model. International Journal of
Fatigue. 2014; 61. Available at: DOI:10.1016/j.ijfatigue.2013.11.015
37. Baskharone EA. Principles of Turbomachinery in Air-Breathing Engines.
Cambridge, UK: Cambridge University Press; 2006.
38. Li YG. Training Future Engineers on Gas Turbine Gas Path Diagnostics Using
Pythia. Proceedings of ASME Turbo Expo 2014: Turbine Technical Conference
and Exposition. Dusseldorf, Germany, June 16 - 20, 2014; 2014. pp. 1–10.
39. SAFARAN Snecma - Communications Department. Commercial Aircraft Engines
CFM56-7B. Cedex, France; 2011. p. 2.

O. ALOZIE ET AL. 33
40. Li YG., Pilidis P., Newby M a. An adaptation approach for gas turbine design-point
performance simulation. Journal of Engineering for Gas Turbines and Power. 2006;
128(4): 789–795. Available at: DOI:10.1115/1.2136369
41. Lo Gatto E., Li YG., Pilidis P. Gas Turbine Off-Design Performance Adaptation
Using a Genetic Algorithm. ASME Turbo Expo 2006: Power for Land, Sea, and
Air. Barcelona, Spain; 2006.
42. Jasmani MS., Li Y-G., Ariffin Z. Measurement Selections for Multicomponent Gas
Path Diagnostics Using Analytical Approach and Measurement Subset Concept.
Journal of Engineering for Gas Turbines and Power. 2011; 133(11): 111701.
Available at: DOI:10.1115/1.4002348
43. Zaba TB., Lombardi P. Experience in the Operation of Air Filters in Gas Turbine
Installations. Brown Boveri Review. Baden, Switzerland; 1984.
44. Facility for Airborne Atmospheric Measurement., Natural Environment Research
Council., Met Office. FAAM B702 FENNEC flight, number 4: Airborne
atmospheric measurements from core and non-core instrument suites on board the
BAE-146 aircraft. NCAS British Atmospheric Data Centre; 2014.
45. Kandler K., Schütz L., Deutscher C., Ebert M., Hofmann H., Jäckel S., et al. Size
distribution, mass concentration, chemical and mineralogical composition and
derived optical parameters of the boundary layer aerosol at Tinfou, Morocco,
during SAMUM 2006. Tellus, Series B: Chemical and Physical Meteorology. 2009;
61(1): 32–50. Available at: DOI:10.1111/j.1600-0889.2008.00385.x
46. Droplet Measurement Technologies. Passive Cavity Aerosol Spectrometer Probe
(PCASP-100x) Operator Manual. Boulder, USA; 2011.
47. Sasahara O. JT9D Engine/Module Performance Detrioration Results from Back to
Back Testing. International Symposium on Air Breathing Engines. Beijing, China;
1985. pp. 528–535.
48. Aircraft Commerce. Aircraft Owner’s & Operator’s Guide: B737NG family.
Aircraft Commerce. 2010; : 3–30.