assessment of control technology options for bart-eligible ... · review of bart-eligible pulp and...
TRANSCRIPT
Assessment of Control Technology Options for BART-Eligible
Sources
Steam Electric Boilers, Industrial Boilers, Cement Plants and Paper and Pulp Facilities
Prepared by Northeast States for Coordinated Air Use Management
In Partnership with The Mid-Atlantic/Northeast Visibility Union
March 2005
ii
Members of Northeast States for Coordinated Air Use Management
Arthur N. Marin, Executive Director Northeast States for Coordinated Air Use Management
Anne Gobin, Bureau Chief
Connecticut Department of Environmental Protection, Bureau of Air Management
James P. Brooks, Bureau Director Maine Department of Environmental Protection, Bureau of Air Quality
Barbara Kwetz, Director
Massachusetts Department of Environmental Protection, Bureau of Waste Prevention
Robert Scott, Acting Director New Hampshire Department of Environmental Services, Air Resources Division
William O’Sullivan, Director
New Jersey Department of Environmental Protection, Office of Air Quality Management
David Shaw, Director New York Department of Environmental Conservation, Division of Air Resources
Stephen Majkut, Chief
Rhode Island Department of Environmental Management, Office of Air Resources
Richard A. Valentinetti, Director Vermont Department of Environmental Conservation, Air Pollution Control Division
iii
Assessment of Control Options for BART-Eligible Sources
Steam Electric Boilers, Industrial Boilers, Cement Plants and Paper and Pulp Facilities
Prepared by
Northeast States for Coordinated Air Use Management In Partnership with
The Mid-Atlantic/Northeast Visibility Union
Submitted to the United States Environmental Protection Agency, Region III in partial fulfillment of requirements for USEPA grant XA-983799-01-2 to the
Ozone Transport Commission
March 2005

iv
v
ASSESSMENT OF CONTROL OPTIONS FOR BART-ELIGIBLE SOURCES
STEAM ELECTRIC BOILERS, INDUSTRIAL BOILERS,
CEMENT PLANTS, AND PAPER AND PULP FACILITIES
Project Director Gary Kleiman, NESCAUM Editors Gary Kleiman, NESCAUM Praveen Amar, NESCAUM Principle Contributors Praveen Amar, NESCAUM Connie Senior, Reaction Engineering International Rui Afonso, Energy and Environmental Strategies Ingrid Ulbrich, NESCAUM
vi
Acknowledgments NESCAUM gratefully acknowledges the funding support provided by the United
States Environmental Protection Agency under USEPA grant XA-983799-01-2 to the Ozone Transport Commission.
We also thank Glynn Rountree of the American Forest & Paper Association for making us aware of John Pinkerton’s work at NCASI and providing us with Tables V-2 through V-5.
NESCAUM also thanks the following individuals for providing comments on this report:
Doug Austin, Ozone Transport Commission Mike Barden, Maine Paper and Pulp Association John C. Buckley, NRG Energy Bob Iwanchuck, ENSR on behalf of Dartmouth College Wendy Jacobs, CT DEP Roman Kramarchuk, U.S. EPA Edward L. (Skip) Kropp, Jackson and Kelly on behalf of Midwest Ozone Group Timothy Porter, Wheelabrator Technologies Buzz Reynolds, CR Clean Air Technologies Luc Robitaille, St. Lawrence Cement Glynn Rountree, American Forest and Paper Association Cathy Waxman, KeySpan
vii
Unit, Species, Acronyms Acronyms APCD – Air Pollution Control Device BACT –Best Available Control Technology BART – Best Available Retrofit Technology CAA – Clean Air Act CAAA – Clean Air Act Amendments CKD – Cement Kiln Dust CFBA – Circulating Fluidized-Bed Absorption CFR – Code of Federal Regulations DI – Dry Injection DSI – Dry Sorbent Injection EGU – Electricity Generating Unit ESP – ElectroStatic Precipitator ESFF – Electrostatic Stimulation of Fabric Filtration FBC – Fluidized Bed Combustion FF – Fabric Filters (also known as baghouses) FGD – Flue Gas Desulfurization (also known as scrubbers) FGR – Flue Gas Recirculation FOM – Fixed Operating and Maintenance Costs ICR – Information Collection Request LAER – Lowest Achievable Emission Rate LNB – Low NOX Burner LSFO – Limestone Forced Oxidation LSC – Low Sulfur Coal (also known as “compliance coal”) MACT – Maximum Achievable Control Technology MANE-VU – Mid-Atlantic/Northeast Visibility Union MC – Mechanical Collector NCG – Non Condensable Gases NESCAUM – Northeast States for Coordinated Air Use Management NSPS – New Source Performance Standard NSR – New Source Review OFA – Over Fire Air PC – Pulverized Coal PS – Particulate Scrubber RACT – Reasonably Available Control Technology RPO – Regional Planning Organization SIP – State Implementation Plan SCR – Selective Catalytic Reduction SDA – Spray Dry Absorption SNCR – Selective Non-Catalytic Reduction SOG – Stripper Off Gases TDF – Tire-Derived Fuel US EPA – United States Environmental Protection Agency
viii
Chemical Species EC – elemental carbon HSO4 – bisulfate H2SO4 – sulfuric acid HNO3 – nitric acid NOX – oxides of nitrogen ( NO and NO2) NO – nitric oxide NO2 – nitrogen dioxide NO3 – nitrate NH3 – ammonia (NH4)3H(SO4)2 – letovicite NH4HSO4 – ammonium bisulfate (NH4)2SO4 – ammonium sulfate NH4NO3 – ammonium nitrate OC – organic carbon PM2.5 – particle matter up to 2.5 µm in size PM10 – particle matter up to 10?µm in size PMcoarse – the difference: PM10 – PM2.5 S – sulfur Se – selenium SO2 – sulfur dioxide SO4 – sulfate VOC – volatile organic carbon VOM – Variable Operating and Maintenance Costs Units Length m – meter µm – micrometer (0.000001m; 10-6m)
km – kilometer (1000 x m; 103 m) Mm – Megameter (1000000 x m; 106 m) Flow Rate ACFM – Actual Cubic Feet per Minute Volume L – liter m3 – cubic meter Mass lb – pound g – gram µg – micrograms (0.000001 x g; 10-6 g) kg – kilograms (1000 x g; 103 g)
ix
Power W – watt (Joules/sec) kW – kilowatt (1000 x W; 103 W) MW – megawatt (1000000 x W; 106 W) Energy Btu – British Thermal Unit (= 1055 Joules) mmBtu – million Btu MWh – megawatt hour kWh – kilowatt hour Concentration µg/m3 – micrograms per cubic meter Visibility dv – deciview km – visual range in kilometers Mm-1 – extinction in inverse megameters
x
TABLE OF CONTENTS
Acknowledgments.......................................................................................................... vi Unit, Species, Acronyms ...............................................................................................vii Executive Summary ......................................................................................................xii 1. INTRODUCTION................................................................................................1-1 2. STEAM ELECTRIC PLANTS (EGUs) ................................................................2-1
2.1. Description of generation process and typical technologies ...........................2-1 2.2. Review of BART-Eligible EGUs in the MANE-VU Region .........................2-2 2.3. Available Control Technologies....................................................................2-2
2.3.1. Emission Characteristics of Regional Haze Precursors from Coal Combustion..........................................................................................................2-4 2.3.2. Control Technologies used for Coal-fired EGUs ......................................2-5 2.3.3. Emission Control Configurations for Coal-fired Electric Utility Boilers .2-20
2.4. Costs and Availability of Technology .........................................................2-22 2.4.1. Detailed Capital Costs, Operating and Maintenance Costs, and Cost Effectiveness ......................................................................................................2-22
3. INDUSTRIAL BOILERS.....................................................................................3-1 3.1. Description of Boiler Process........................................................................3-1 3.2. Review of BART-Eligible Industrial Boilers in the MANE-VU Region........3-2 3.3. Available Control Technologies....................................................................3-2
3.3.1. Emission Characteristics of Regional Haze Precursors from Industrial Boilers ................................................................................................................3-3 3.3.2. Control Technologies used for Industrial Boilers......................................3-5
3.4. Costs of Technology...................................................................................3-12 3.4.1. NOX Technologies .................................................................................3-12 3.4.2. SO2 Technologies ..................................................................................3-13 3.4.3. PM Technologies ...................................................................................3-14
4. PORTLAND CEMENT KILNS ...........................................................................4-1 4.1. Description of Cement-Making Processes .....................................................4-1 4.2. Review of BART-Eligible Cement Kilns in the MANE-VU Region .............4-2 4.3. Available Control Technologies....................................................................4-3
4.3.1. SO2 Controls ............................................................................................4-3 4.3.2. NOX Controls...........................................................................................4-7 4.3.3. PM2.5 Controls .......................................................................................4-18 4.3.4. VOC Controls ........................................................................................4-20
4.4. Costs and Availability.................................................................................4-20 4.4.1. Sulfur Dioxide Control...........................................................................4-20 4.4.2. Nitrogen Oxides Control........................................................................4-22 4.4.3. PM2.5 Control.........................................................................................4-24
5. KRAFT PULP MILLS .........................................................................................5-1 5.1. Description of pulp and paper processes .......................................................5-1 5.2. Review of BART-Eligible Pulp and Paper facilities in the MANE-VU Region .. .....................................................................................................................5-2 5.3. Available Control Technologies....................................................................5-2
xi
5.3.1. SO2 Controls ............................................................................................5-3 5.3.2. NOX Controls...........................................................................................5-4 5.3.3. PM2.5 Controls .........................................................................................5-5 5.3.4. VOC Controls ..........................................................................................5-5
5.4. Costs and availability....................................................................................5-6 6. CONCLUSION....................................................................................................6-1
6.1. EGUs............................................................................................................6-1 6.2. Industrial Boilers ..........................................................................................6-2 6.3. Cement Kilns................................................................................................6-2 6.4. Pulp Mills .....................................................................................................6-2
xii
Executive Summary
This report was prepared by the Northeast States for Coordinated Air Use Management (NESCAUM) as part of an effort to assist states and tribes as they prepare to comply with the Best Available Retrofit Technology Requirements (BART) of the Regional Haze Rule. The Haze Rule requires states to determine the most stringent technologically feasible system of controls that can reasonably be installed at each facility eligible for BART. Criteria that determine whether a specific control technology is deemed reasonable include: cost of the controls, other control technology in use at the source, energy and other non-air quality environmental impacts, remaining useful life of the source as well as the degree of visibility improvement anticipated to result from installation of the controls.
This assessment provides information on available technology options, control efficiency and typical installation costs for four important BART-eligible source categories in the MANE-VU region. These categories include Fossil-fuel fired steam electric plants of more than 250 million British thermal units per hour heat input, Fossil-fuel boilers of more than 250 million British thermal units per hour heat input, Portland cement plants, and Kraft pulp mills. While there are 22 other source categories covered by the BART rule (with over 25 BART-Eligible facilities in at least 8 of these source categories in the MANE-VU region), we have chosen to focus on these four categories which include 75 of the 100 MANE-VU BART-Eligible sources identified at this time. [Editors note: The addition of NY and PA non-EGU facilities will change these numbers] These source sectors were chosen for a combination of factors including the number of facilities, the typical emission level for these type of facilities and the availability of a generic control technology characterizations for that sector. States will need to conduct an individual analysis for each facility prior to making a BART determination. This information is intended to facilitate that process by collecting available technology information in a single reference document.
The report finds that significant emissions reductions can be achieved through a variety of technologies that target different haze forming pollutants. While wet and dry scrubbing techniques may be cost-effective means of removing SO2 at EGUs and large industrial boilers, combustion modifications and process changes might be more effective at cement plants and paper and pulp facilities. Similarly for NOX control, SCR and SNCR are very efficient methods of post-combustion control that can be quite cost-effective on large boilers, but combinations of combustion and post-controls as well as combustion modification and process changes are also viable means of reducing a facility’s total NOX emissions. These approaches need to be carefully considered on a unit-by-unit basis, taking into account fuel used (coal, natural gas, oil, wood, etc.) and capacity or use factors, to ensure that product quality and pollutant co-control issues are handled appropriately. Particulate controls include a variety of technologies, but electrostatic precipitators and fabric-filters (or baghouses) are viable options in different configurations for EGUs, industrial boilers and cement plants. Paper and pulp facilities may also consider demister pads, packed tower technologies and Venturi scrubbers.
DRAFT – Assessment of Control Options for BART-Eligible Sources Page 1-1
1-1
1. INTRODUCTION Under the U.S. Environmental Protection Agency’s (USEPA) 1999 “regional
haze rule” [64 Fed. Reg. 35714 (July 1, 1999)], certain emission sources that “may reasonably be anticipated to cause or contribute” to visibility impairment in downwind Class I areas are required to install Best Available Retrofit Technology (BART).1 These requirements are intended to reduce emissions specifically from large sources that, due to age, were exempted from other control requirements of the Clean Air Act (CAA).
BART requirements pertain to 26 specified major point source categories, including power plants, industrial boilers, paper and pulp plants, cement kilns and other large stationary sources. To be considered BART-eligible, sources from these specified categories must have the potential to emit at least 250 tons per year of any haze forming pollutant and must have commenced operation or come into existence in the fifteen year period prior to August 7, 1977 (the date of passage of the 1977 Clean Air Act Amendments (CAAA), which first required new source performance standards).
Because of the regional focus of the 1999 haze rule, it is likely that BART requirements will be applied to a much larger number of sources across a broader geographic region than has been the case historically (i.e. through reasonably attributable visibility impairment requirements in the 1980 haze regulations). In addition, USEPA has for the first time introduced the possibility that source-by-source, command and control type BART implementation may be replaced by more flexible, market-based approaches, provided such alternatives can be shown to achieve greater progress toward visibility objectives than the standard BART approach.
In developing future haze state implementation plans (SIPs), states and tribes will need to include an inventory of emissions from potentially BART-eligible facilities in their jurisdictions and specify the timetable and stringency of controls to be applied at those sources. In determining what level of control represents BART, states must address the following considerations for each eligible source or group of eligible sources:
• Compliance costs,
• Energy and non-air quality environmental impacts,
• Any existing pollution control technology in use at the source,
• The remaining useful life of the source, and
• The degree of visibility improvement that may reasonably be anticipated to result from the imposition of BART.
In many respects, the strength of the BART program is dependent upon the interpretation of these factors and in January 2001 USEPA proposed guidelines for the interpretation and implementation of Best Available Retrofit Technology (BART) requirements, including these factors. While no explicit threshold was established for
1 There are seven designated Class I areas in the Northeast and Mid-Atlantic States. They include Acadia National Park and Moosehorn Wilderness Area in Maine; Roosevelt-Campobello International Park in New Brunswick and Maine; the Lye Brook Wilderness Area in Vermont; the Great Gulf and Presidential Range-Dry River Wilderness Areas in New Hampshire; and the Brigantine Wilderness Area in New Jersey.
DRAFT – Assessment of Control Options for BART-Eligible Sources Page 1-2
1-2
any of these factors, the publication of the BART guidelines as a proposed rule in the Federal Register [66 Fed. Reg. 38108 (July 20, 2001)] initiated a formal rulemaking process to clarify BART requirements specifically.
BART is the primary mechanism identified for regulating haze-forming pollutants from stationary sources for the first implementation period under the Haze Rule and the final BART regulations, anticipated to be published on April 15, 2005, gives urgency to understanding the implications of the final BART guidelines with respect to state planning efforts. Depending on a host of factors, BART may be the primary component of state haze plans or may be eliminated as a potential mechanism for state compliance.2 Amid such uncertainty, states must continue to plan for the implementation of BART.
To assist MANE-VU states and tribes with BART implementation efforts, MANE-VU has developed a list of BART-eligible sources in the region (NESCAUM, 2001; NESCAUM, 2003).3 The preliminary list developed in these documents has been refined by state permitting staff to verify identifications and determine eligibility for those sources for which incomplete information was available. The final, state-approved (i.e. each state has approved the list of sources within that state) list is available here as Appendix A. It should be noted that the review of the facilities for BART eligibility was performed prior to the release of the draft BART rule in 2004. Determinations were based upon the guidance provided in EPA draft rule released in 2001. It is anticipated that EPA will release a final BART rule in April 2005 and at that time final BART-eligibility determinations will be made. It is likely that there will be changes to the BART list based upon that final rule. Once deemed BART-eligible, each source will undergo a BART engineering review to determine what system of controls constitutes BART for each facility. This review will examine impacts for all the BART pollutants. For example, if a facility triggeres BART because it has VOC emissions over 250 tons per year for date-eligible units, the facility will also have to examine the impacts of emissions of NOX, SO2, PM10 and ammonia, even if emissions of these pollutants are less than 250 tons per year.
In addition, this review must take into account the statutory factors cited earlier including remaining useful life of a source and controls already in place at a source. After review of these criteria and control options, the level of required control will be established. It is anticipated that the final rule will also address the specific aspects relating to the completion of a BART engineering analysis. 2 A number of factors in the pending BART regulation may affect the strength of the program. Among these are (1) a final decision on whether USEPA’s Clean Air Interstate Rule (CAIR) could serve as BART for affected sources in states that choose this option, (2) final rules for how states may institute a source-by-source exemption test, (3) a decision on whether to aggregate emissions from multiple date-eligible boilers at a facility when comparing to the 250 ton/year emission threshold. An additional factor to consider is a provision contained in Senate Resolution 485 (the Clear Skies Act of 2003 which is expected to be re-introduced early in the 109th congress), which would act in place of the BART requirements of the regional haze rule. 3 NESCAUM does not believe that there are any BART-eligible sources in the State of Vermont or any of the member Tribes in MANE-VU and thus we have not developed lists for these jurisdictions. In addition, Pennsylvania and the District of Columbia have developed BART-Eligible source lists following their own methodology and the identified sources are contained in the final list in Appendix A.
DRAFT – Assessment of Control Options for BART-Eligible Sources Page 1-3
1-3
As a next step in coordinating BART determinations for MANE-VU states and tribes, we present here (in Chapters 3 through 6 of this report) a preliminary assessment of available control technology options for states to consider as they undertake the specific BART determinations for each of the eligible facilities in four major source categories including EGUs, industrial boilers, cement plants and paper and pulp facilities. These four categories cover 76 of the 101 BART-eligible facilities in MANE-VU.
While a facility specific review will need to be undertaken for each BART-eligibility (either to determine BART controls to be installed, or to determine the magnitude of emissions reductions that must be considered in a BART trading program), the information provided here will give states and tribes a foundation for conducting these reviews.
DRAFT – Assessment of Control Options for BART-Eligible Sources Page 2-1
2-1
2. STEAM ELECTRIC PLANTS (EGUs)
Electricity Generating Units or EGUs are the largest source category among the twenty -six source categories covered by the Regional Haze Rule both in terms of total visibility impairing emissions and in terms of number of facilities. Estimates of national emissions for criteria air pollutants prepared by the USEPA show that electric utility power plants that burn coal are significant sources of sulfur dioxide (SO2), nitrogen oxides (NOX), and particulate matter (PM) (USEPA, 2000). Electric utility power plants are the nation’s largest source of SO2 emissions, contributing approximately 68 percent of the estimated total national SO2 emissions in 1998 (most recent year for which national estimates are available). Over 90 percent of these SO2 emissions are coal-fired electric utility boilers. Electric utilities contributed 25 percent of total national NOX emissions in 1998. Again coal combustion is the predominant source of NOX emissions from the electric utilities (almost 90 percent of the estimated NOX emissions). Coal-fired electric utility power plants also are one of the largest industrial sources of PM emissions. In general, the high combustion efficiencies achieved by coal-fired electric utility boilers result in low emissions of CO and volatile organic compounds (a precursor for the photochemical formation of ozone in the atmosphere). Although the emphasis of this Chapter is on coal-fired utility boilers, many technologies described here are also applicable to gas and oil-fired units (for example, SCR and SNCR technologies are equally applicable to coal and natural gas/oil units, generally at much lower capital and operating costs; same is true for wet scrubbers for SO2 control and ESPs or baghouses for PM control for oil units).
All coal-fired electric utility power plants in the United States use control devices to reduce PM emissions. Many coal-fired electric utility boilers also are required to use controls for SO2 and NOX emissions depending on site-specific factors such as the properties of the coal burned, when the power plant was built, and the area where the power plant is located. Though there are other major stationary source sectors (for example, cement plants, paper and pulp plants, large industrial boilers, combustion turbines, iron and steel industry), coal-fired boilers are by far the largest contributor of all of these three precursors of regional haze.
2.1. Description of generation process and typical technologies The USEPA ICR (Information Collection Request) of 1999 (the most recent and quite
detailed survey of coal-fired EGUs in the U.S. completed in connection with USEPA efforts to develop MACT regulations for mercury from EGUs) indicates that there were about 1,140 coal-fired units in the U.S. (with a maximum capacity to generate in excess of 300,000 MW of power). This USEPA ICR data indicated that coal-fired steam electric generating units in the U.S. burned 786 million tons of coal of which, approximately 52 percent was bituminous and 37 percent was sub-bituminous. Other fuels included lignite, anthracite coal, reclaimed waste coal, mixtures of coal and petroleum coke (pet-coke), and mixtures of coal and tire-derived fuel (TDF). Pulverized coal-fired (PC) boilers represent approximately 86 percent of the total number and 90 percent of total utility boiler capacity. Based on capacity, other types of boilers include cyclone-fired boilers (7.6 percent), fluidized-bed combustors (1.3 percent), and stoker-fired boilers (1.0 percent).
DRAFT – Assessment of Control Options for BART-Eligible Sources Page 2-2
2-2
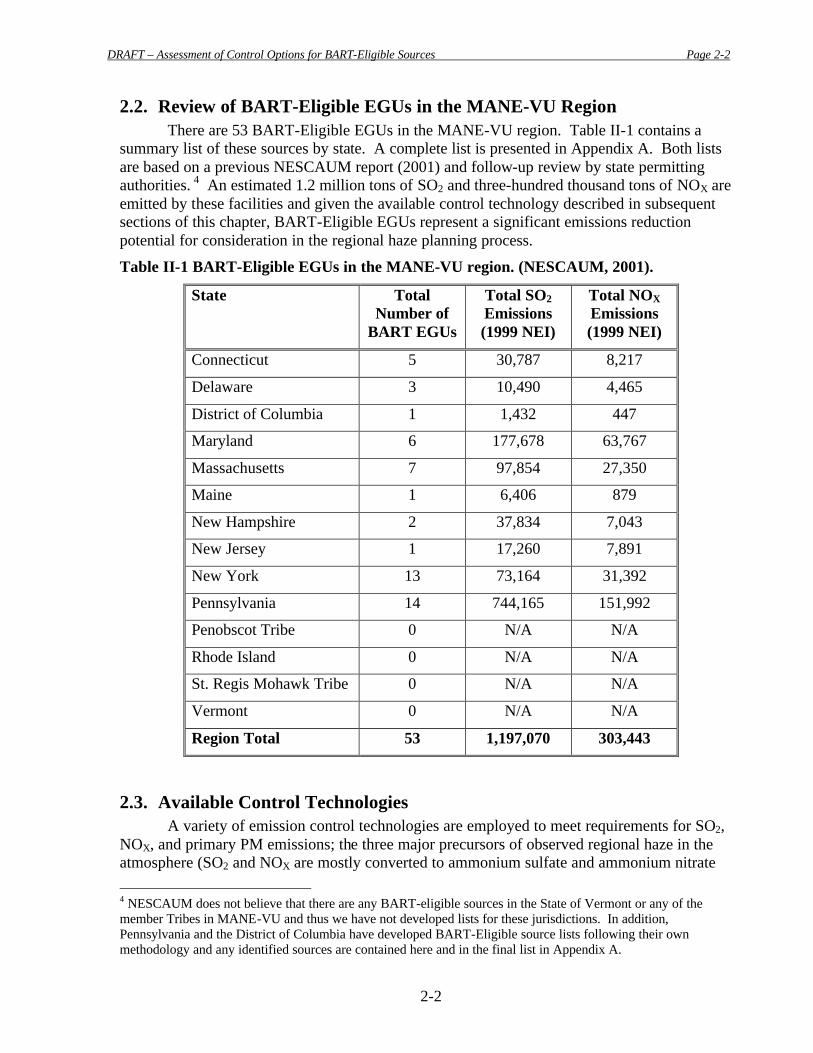
2.2. Review of BART-Eligible EGUs in the MANE-VU Region There are 53 BART-Eligible EGUs in the MANE-VU region. Table II-1 contains a
summary list of these sources by state. A complete list is presented in Appendix A. Both lists are based on a previous NESCAUM report (2001) and follow-up review by state permitting authorities. 4 An estimated 1.2 million tons of SO2 and three-hundred thousand tons of NOX are emitted by these facilities and given the available control technology described in subsequent sections of this chapter, BART-Eligible EGUs represent a significant emissions reduction potential for consideration in the regional haze planning process.
Table II-1 BART-Eligible EGUs in the MANE-VU region. (NESCAUM, 2001).
State Total Number of
BART EGUs
Total SO2 Emissions (1999 NEI)
Total NOX Emissions (1999 NEI)
Connecticut 5 30,787 8,217
Delaware 3 10,490 4,465
District of Columbia 1 1,432 447
Maryland 6 177,678 63,767
Massachusetts 7 97,854 27,350
Maine 1 6,406 879
New Hampshire 2 37,834 7,043
New Jersey 1 17,260 7,891
New York 13 73,164 31,392
Pennsylvania 14 744,165 151,992
Penobscot Tribe 0 N/A N/A
Rhode Island 0 N/A N/A
St. Regis Mohawk Tribe 0 N/A N/A
Vermont 0 N/A N/A
Region Total 53 1,197,070 303,443
2.3. Available Control Technologies A variety of emission control technologies are employed to meet requirements for SO2,
NOX, and primary PM emissions; the three major precursors of observed regional haze in the atmosphere (SO2 and NOX are mostly converted to ammonium sulfate and ammonium nitrate
4 NESCAUM does not believe that there are any BART-eligible sources in the State of Vermont or any of the member Tribes in MANE-VU and thus we have not developed lists for these jurisdictions. In addition, Pennsylvania and the District of Columbia have developed BART-Eligible source lists following their own methodology and any identified sources are contained here and in the final list in Appendix A.

DRAFT – Assessment of Control Options for BART-Eligible Sources Page 2-3
2-3
that are formed by the reactions of precursor gases with ammonia in the environment that is emitted mostly from agricultural and cattle related activities). Most utilities control SO2 by the use of either low-sulfur coal (generally less than 1 percent sulfur by weight) or by wet or dry scrubbing (known as flue gas desulphurization, or FGD). Generally, NOX emissions are controlled via combustion modification and, more recently, by more advanced post-combustion controls, which are required by the 1990 Clean Air Act and state regulations ( “NOX Transport SIP Call” and the Title IV of the 1990 CAAA are two major examples). Compared to these two precursors, PM emissions are almost universally controlled in the U.S. (almost 100% of units have either electrostatic precipitators (ESPs) or fabric filters (FF) (popularly known as “bag houses”). Based on the 1999 USEPA’s ICR (Information Collection Request) data, for post-combustion controls, 77.4 percent of the units have PM control only, 18.6 percent have both PM and SO2 controls, 2.5 percent have PM and NOX controls, and 1.3 percent have all three post-combustion control devices.
The different types of post-combustion control devices are briefly described below with detailed descriptions given later in this section:
SO2 post-combustion control technologies are systems that are classified as wet flue gas desulfurization (FGD) scrubbers, semi-dry scrubbers, or dry injection. Wet FGD scrubber controls remove SO2 by dissolving it in a solution. A PM control device is always located upstream of a wet scrubber. PM devices that may be used with wet FGD scrubbers include a Particulate Scrubber (PS), Cold Side (CS)-ESP, Hot Side (HS)-ESP, or a fabric filter (FF) or a baghouse. Semi-dry scrubbers include spray dryer absorption (SDA). Dry injection involves injecting dry powdered lime or other suitable sorbent directly into the flue gas. A PM control device (ESP or FF) is always installed downstream of a semi-dry scrubber or dry injection point to remove the sorbent from the flue gas.
NOX post-combustion control technologies include selective non-catalytic reduction (SNCR) and selective catalytic reduction (SCR) processes. With both of these methods, a reducing agent such as ammonia or urea is injected into the duct to reduce NOX to N2. SCR operates at lower temperatures than SNCR and is much more effective at reducing NOX, but it has higher capital costs for installation.
Particulate matter (PM) control technologies include electrostatic precipitators (ESPs), fabric filters (FFs) (also called “baghouses”), and particulate scrubbers (PS). ESPs and FFs may be classified as either cold-side (CS) devices [installed upstream of the air heater where flue gas temperatures range from 284 to 320 ºF (140 to 160 °C)] or hot-side [installed downstream of the air heater and operate at temperatures ranging from 662 to 842 ºF (350 to 450 °C)].
For PM controls, ESPs are used on 84 percent of the existing electric utility coal-fired boiler units, and fabric filters or baghouses are used on 14 percent of the utility units. Post-combustion SO2 controls are less common. Wet flue gas desulfurization (FGD) systems are used on 15.1 percent of the units; and, dry scrubbers, predominantly spray dryer absorbers (SDA), are used on 4.6 percent of units that were surveyed. However, since it is generally more cost effective to install scrubbers on big units, the 20 percent of the units represent about 30% of the installed U.S. capacity. In response to the “Section 110 Transport SIP call” and the implementation of the Federal Title IV acid rain program, the application of post-combustion NOX controls is becoming more prevalent. For example, based on the current status of electric utility industry, it appears that one third of the coal-based capacity (about 100,000 MW out of the
DRAFT – Assessment of Control Options for BART-Eligible Sources Page 2-4
2-4
installed base of about 300,000 MW) has been or is currently being retrofitted with the advanced SCR technology .
2.3.1. Emission Characteristics of Regional Haze Precursors from Coal Combustion
Sulfur Dioxide SO2 emissions, mostly from the combustion of fossil fuels and by metallurgical
processes, are the result of oxidation of sulfur in the coal during the combustion process. Coal deposits contain sulfur in amounts ranging from trace quantities to as high as eight percent or more. Most of this sulfur is present as either pyritic sulfur (sulfur combined with iron in the form of a mineral that occurs in the coal deposit) or organic sulfur (sulfur combined directly in the coal structure). During combustion, sulfur compounds in coal are oxidized to gaseous SO2 or SO3. When firing bituminous coal, almost all of the sulfur present in coal is emitted as gaseous sulfur oxides (on average, ninety eight percent). The more alkaline nature of ash in some subbituminous coals causes a portion of the sulfur in the coal to react to form various sulfate salts; these salts are emitted as fly ash or retained in the boiler bottom ash. Generally, the percentage of sulfur in the as-fired coal that is converted to sulfur oxides during combustion does not vary with the utility boiler design or operation. (USEPA, 1982; Buonicore and Davis, 1992).
Nitrogen Oxides The NOX formed during coal combustion by oxidation of molecular nitrogen (N2) in the
combustion air is referred to as “thermal NOX.” The oxidation reactions converting N2 to NO and NO2 become very rapid once gas temperatures rise above 1,700°C (3,100°F). Formation of thermal NOX in a coal-fired electric utility boiler is dependent on two conditions occurring simultaneously in the combustion zone: high temperature and an excess of combustion air. A boiler design feature or operating practice that increases the gas temperature above 1,700 °C, the gas residence time at these temperatures and the quantity of excess combustion air affects thermal NOX formation. The formation of NOX by oxidation of nitrogen compounds contained in the coal is referred to as “fuel NOX.” The nitrogen content in most coals ranges from approximately 0.5 to 2 percent. The amount of nitrogen available in the coal is relatively small compared with the amount of nitrogen available in the combustion air. However, depending on the combustion conditions, significant quantities of fuel NOX can be formed during coal combustion. (USEPA, 1991; Buonicore and Davis, 1992).
Both NO and NO2 are formed during coal combustion by oxidation of molecular nitrogen that is present in the combustion air or nitrogen compounds contained in the coal. Overall, total NOX formed during combustion is composed predominantly of NO mixed with small quantities of NO2 (typically less than 10 percent of the total NOX formed). However, when NO is formed during coal combustion, the NO is oxidized to NO2 and is emitted to the atmosphere.
DRAFT – Assessment of Control Options for BART-Eligible Sources Page 2-5
2-5
Particulate Matter Primary PM emissions from coal-fired electric utility boilers consist primarily of fly ash.
Ash is the unburned carbon char and the mineral portion of combusted coal. The amount of ash in the coal, which ultimately exits the boiler unit as fly ash, is a complex function of the coal properties, furnace-firing configuration, and boiler operation. For the dry-bottom, pulverized-coal-fired boilers, approximately 80 percent of the total ash in the as-fired coal exits the boiler as fly ash. Wet-bottom, pulverized-coal-fired boilers emit significantly less fly ash: on the order of 50 percent of the total ash exits the boiler as fly ash. In a cyclone furnace boiler, most of the ash is retained as liquid slag; thus, the quantity of fly ash exiting the boiler is typically 20 to 30 percent of the total ash. However, the high operating temperatures unique to these designs may also promote ash vaporization and larger fractions of submicron fly ash compared to dry bottom designs. Fluidized-bed combustors emit high levels of fly ash since the coal is fired in suspension and the ash is present in dry form. Spreader-stoker-fired boilers can also emit high levels of fly ash. However, overfeed and underfeed stokers emit less fly ash than spreader stokers, since combustion takes place in a relatively quiescent fuel bed.
In addition to the fly ash, PM emissions from coal-fired EGUs result from reactions of the SO2 and NOX compounds as well as unburned carbon particles carried in the flue gas from the boiler. The SO2 and NOX compounds are initially in the vapor phase following coal combustion in the furnace chamber but can partially chemically transform in the stack, or near plume, to form fine PM in the form of nitrates, sulfur trioxide (SO3), and sulfates. Firing configuration and boiler operation can affect the fraction of carbon (from unburned coal) contained in the fly ash. In general, the high combustion efficiencies achieved by pulverized-coal-fired boilers and cyclone-fired boilers result in relatively small amounts of unburned carbon particles in the exiting combustion gases. Those pulverized-coal-fired electric utility boilers that use special burners for NOX control tend to burn coal less completely; consequently, these furnaces tend to emit a higher fraction of unburned carbon in the combustion gases exiting the furnace.
Another potential source of PM from coal-fired EGUs can be found in the flue gas and the use of a dry sorbent-based control technology. Solid sorbent particles are injected into the combustion gases to react with the air pollutants and then recaptured by a downstream control device. Sorbent particles that escape capture by the control device are emitted as PM to the atmosphere. (USEPA, 1982; Buonicore and Davis, 1992).
2.3.2. Control Technologies used for Coal-fired EGUs In addition to BART requirements, all EGUs in the U.S. must comply with applicable
federal and state standards and programs that specifically regulate criteria air emissions from coal-fired electric utility boilers. The federal regulations and programs include New Source Performance Standards (NSPS), the CAA Title IV Acid Rain Program, the 1997 “Transport NOX SIP call,” and the CAA Title V Operating Permits Program. The USEPA has delegated authority to individual state and local agencies for implementing many of these regulatory requirements
DRAFT – Assessment of Control Options for BART-Eligible Sources Page 2-6
2-6
Additionally, some of the states in the Northeast, including Connecticut, Massachusetts, New Hampshire, New Jersey, and New York, have recently implemented new regulations or legislation that are more stringent than the federal requirements. Electric utility companies use one or a combination of the following three control strategies to comply with the specific set of requirements applicable to a given coal-fired boiler.
Pre-combustion Controls. Control measures in which fuel substitutions are made or fuel pre-processing is performed to reduce pollutant formation in the combustion unit.
Combustion Controls. Control measures in which operating and equipment modifications are made to reduce the amount of pollutants formed during the combustion process; or in which a material is introduced into the combustion unit along with the fuel to capture the pollutants formed before the combustion gases exit the unit.
Post-combustion Controls: Control measures in which one or more air pollution control devices are used at a point downstream of the furnace combustion zone to remove the pollutants from the post-combustion gases.
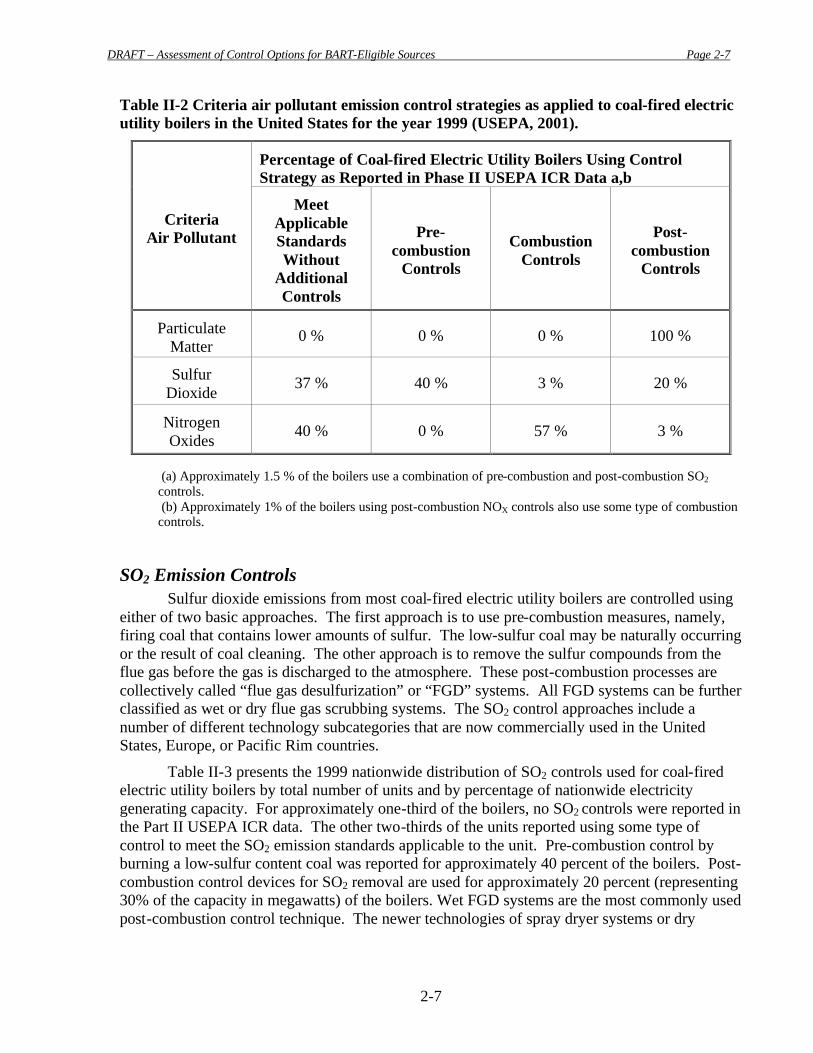
Table II-2 shows the national distribution of emissions control strategies for SO2, NOX, and PM used for coal-fired electric utility boilers in 1999 as reported in the Part II USEPA ICR data (USEPA, 2001). Approximately two-thirds of the total coal-fired electric utility boilers use either a low-sulfur fuel or a post-combustion technology (a wet or a dry scrubber) to control SO2 emissions. The methods used for controlling SO2 emissions from EGUs are discussed first. All coal-fired electric utility boilers in the United States are controlled for PM emissions by using some type of post-combustion controls. These particulate emission control types are discussed next. Although approximately two-thirds of the coal-fired electric utility boilers are controlled for NOX emissions, these units are not necessarily the same units controlled for SO2 emissions. The predominant strategy for controlling NOX emissions is to use combustion controls. Later in this section, the application of NOX emission controls to coal-fired electric utility boilers is described in detail.
DRAFT – Assessment of Control Options for BART-Eligible Sources Page 2-7
2-7
Table II-2 Criteria air pollutant emission control strategies as applied to coal-fired electric utility boilers in the United States for the year 1999 (USEPA, 2001).
Percentage of Coal-fired Electric Utility Boilers Using Control Strategy as Reported in Phase II USEPA ICR Data a,b
Criteria
Air Pollutant
Meet
Applicable Standards Without
Additional Controls
Pre-
combustion Controls
Combustion
Controls
Post-
combustion Controls
Particulate
Matter
0 %
0 %
0 %
100 %
Sulfur
Dioxide
37 %
40 %
3 %
20 %
Nitrogen Oxides
40 %
0 %
57 %
3 %
(a) Approximately 1.5 % of the boilers use a combination of pre-combustion and post-combustion SO2 controls. (b) Approximately 1% of the boilers using post-combustion NOX controls also use some type of combustion controls.
SO2 Emission Controls Sulfur dioxide emissions from most coal-fired electric utility boilers are controlled using
either of two basic approaches. The first approach is to use pre-combustion measures, namely, firing coal that contains lower amounts of sulfur. The low-sulfur coal may be naturally occurring or the result of coal cleaning. The other approach is to remove the sulfur compounds from the flue gas before the gas is discharged to the atmosphere. These post-combustion processes are collectively called “flue gas desulfurization” or “FGD” systems. All FGD systems can be further classified as wet or dry flue gas scrubbing systems. The SO2 control approaches include a number of different technology subcategories that are now commercially used in the United States, Europe, or Pacific Rim countries.
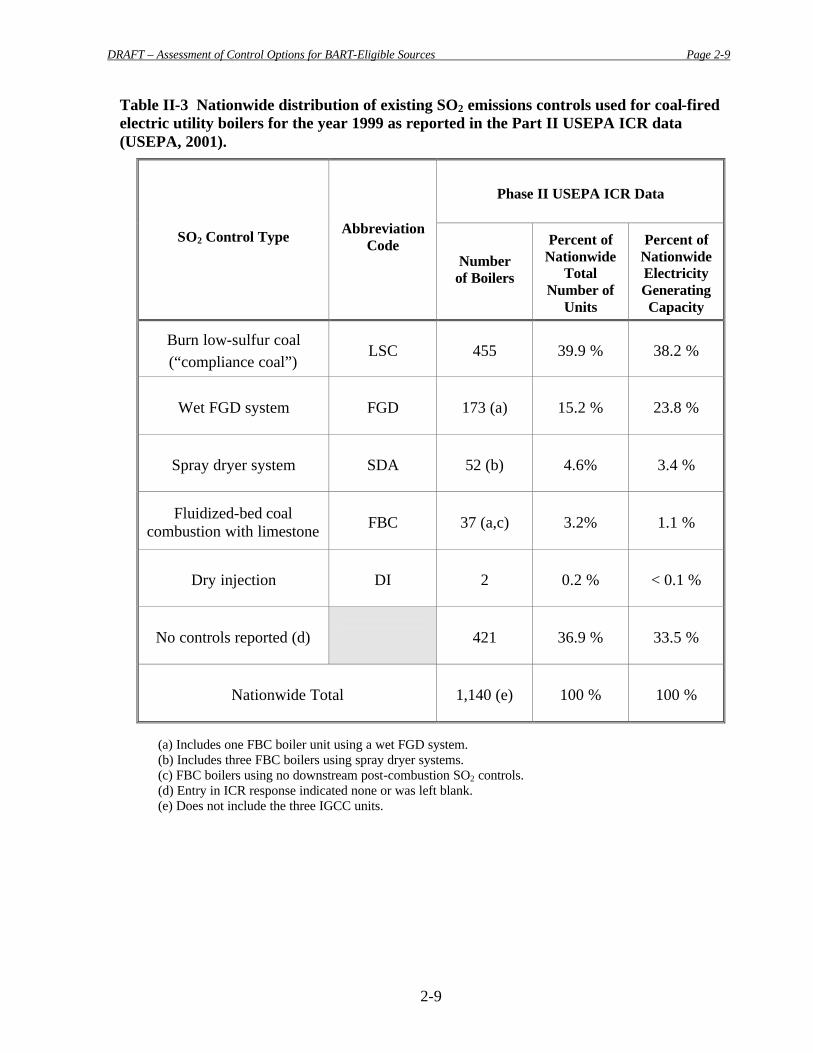
Table II-3 presents the 1999 nationwide distribution of SO2 controls used for coal-fired electric utility boilers by total number of units and by percentage of nationwide electricity generating capacity. For approximately one-third of the boilers, no SO2 controls were reported in the Part II USEPA ICR data. The other two-thirds of the units reported using some type of control to meet the SO2 emission standards applicable to the unit. Pre-combustion control by burning a low-sulfur content coal was reported for approximately 40 percent of the boilers. Post-combustion control devices for SO2 removal are used for approximately 20 percent (representing 30% of the capacity in megawatts) of the boilers. Wet FGD systems are the most commonly used post-combustion control technique. The newer technologies of spray dryer systems or dry
DRAFT – Assessment of Control Options for BART-Eligible Sources Page 2-8
2-8
injection are limited in their application to existing units. The remaining 3 percent of the boilers use fluidized-bed combustion (FBC) with limestone.
Low-sulfur Coal Coal with low sulfur content can be burned and meet applicable SO2 emission standards
without the use of additional controls is sometimes referred to as “compliance coal.” Coals naturally low in sulfur content may be mined directly from the ground. Alternatively, the sulfur content of coal fired in the boiler may be lowered first by cleaning the coal or blending coals obtained from several sources. However, burning low-sulfur coal may not be a technically feasible or economically practical SO2 control alternative for all boilers. In some cases, a coal with the required sulfur content to meet the applicable standard may not be available or cannot be fired satisfactorily in a given boiler unit design. Even if such a coal is available, use of the low-sulfur coal that must be transported long distances from the mine may not be cost-competitive with burning higher sulfur coal supplied by closer mines and using a post-combustion control device.
DRAFT – Assessment of Control Options for BART-Eligible Sources Page 2-9
2-9
Table II-3 Nationwide distribution of existing SO2 emissions controls used for coal-fired electric utility boilers for the year 1999 as reported in the Part II USEPA ICR data (USEPA, 2001).
Phase II USEPA ICR Data
SO2 Control Type Abbreviation Code
Number of Boilers
Percent of
Nationwide Total
Number of Units
Percent of
Nationwide Electricity Generating Capacity
Burn low-sulfur coal (“compliance coal”)
LSC
455
39.9 %
38.2 %
Wet FGD system
FGD
173 (a)
15.2 %
23.8 %
Spray dryer system
SDA
52 (b)
4.6%
3.4 %
Fluidized-bed coal
combustion with limestone
FBC
37 (a,c)
3.2%
1.1 %
Dry injection
DI
2
0.2 %
< 0.1 %
No controls reported (d)
421
36.9 %
33.5 %
Nationwide Total
1,140 (e)
100 %
100 %
(a) Includes one FBC boiler unit using a wet FGD system. (b) Includes three FBC boilers using spray dryer systems. (c) FBC boilers using no downstream post-combustion SO2 controls. (d) Entry in ICR response indicated none or was left blank. (e) Does not include the three IGCC units.
DRAFT – Assessment of Control Options for BART-Eligible Sources Page 2-10
2-10
Various coal cleaning processes may be used to reduce the sulfur content of the coal. A significant portion of the pyritic sulfur minerals mixed with the mined coal can usually be removed by physical gravity separation or surface property (flotation) methods. However, physical coal cleaning methods are not effective for removing the organic sulfur bound in coal. Another method of reducing the overall sulfur content of the coal burned in a given boiler unit is to blend coals with different sulfur contents to meet a desired or target sulfur level.
Wet FGD Systems The SO2 in flue gas can be removed by reacting the sulfur compounds with a solution of
water and an alkaline chemical to form insoluble salts that are removed in the scrubber effluent. These processes are called “wet FGD systems” in this report. Most wet FGD systems for control of SO2 emissions from coal-fired electric utility boilers are based on using either limestone or lime as the alkaline source. At some of these facilities, fly ash is mixed with the limestone or lime. Several other scrubber system designs (e.g., sodium carbonate, magnesium oxide, dual alkali) are also used by a small percentage of the total number of boilers.
The basic wet limestone scrubbing process is simple and is the type most widely used for control of SO2 emissions from coal-fired electric utility boilers. Limestone sorbent is inexpensive and generally available throughout the United States. In a wet limestone scrubber, the flue gas containing SO2 is brought into contact with limestone/water slurry. The SO2 is absorbed into the slurry and reacts with limestone to form an insoluble sludge. The sludge, mostly calcium sulfite hemihydrate and gypsum, is disposed of in a pond specifically constructed for the purpose or is recovered as a salable byproduct.
The wet lime scrubber operates in a similar manner to the wet limestone scrubber. In a wet lime scrubber, flue gas containing SO2 is contacted with hydrated lime/water slurry; the SO2 is absorbed into the slurry and reacts with hydrated lime to form an insoluble sludge. The hydrated lime provides greater alkalinity (higher pH) and reactivity than limestone. However, lime-scrubbing processes require appropriate disposal of large quantities of waste sludge.
The SO2 removal efficiencies of existing wet limestone scrubbers range from 31 to 97 percent, with an average of 78 percent. The SO2 removal efficiencies of existing wet lime scrubbers range from 30 to 95 percent. For both types of wet scrubbers, operating parameters affecting SO2 removal efficiency include liquid-to-gas ratio, pH of the scrubbing medium, and the ratio of calcium sorbent to SO2. Periodic maintenance is needed because of scaling, erosion, and plugging problems. Recent advancements include the use of additives or design changes to promote SO2 absorption or to reduce scaling and precipitation problems.
Spray Dryer Absorber A spray dryer absorber (sometimes referred to as wet-dry or semi-dry scrubbers) operates
by the same principle as wet lime scrubbing, except that the flue gas is contacted with a fine mist of lime slurry instead of a bulk liquid (as in wet scrubbing). For the spray dryer absorber process, the combustion gas containing SO2 is contacted with fine spray droplets of hydrated lime slurry in a spray dryer vessel. This vessel is located downstream of the air heater outlet where the gas temperatures are in the range of 120 to 180 °C (250 to 350 °F). The SO2 is absorbed in the slurry and reacts with the hydrated lime reagent to form solid calcium sulfite and calcium sulfate as in a wet lime scrubber. The water is evaporated by the hot flue gas and forms dry, solid particles containing the reacted sulfur. These particles are entrained in the flue gas,
DRAFT – Assessment of Control Options for BART-Eligible Sources Page 2-11
2-11
along with fly ash, and are collected in a PM collection device. Most of the SO2 removal occurs in the spray dryer vessel itself, although some additional SO2 capture has also been observed in downstream particulate collection devices, especially fabric filters. This process produces dry reaction waste products for easy disposal.
The primary operating parameters affecting SO2 removal are the calcium-reagent-to-sulfur stoichiometric ratio and the approach to saturation in the spray dryer. To increase overall sorbent use, the solids collected in the spray dryer and the PM collection device may be recycled. The SO2 removal efficiencies of existing lime spray dryer systems range from 60 to 95 percent.
Dry Injection For the dry injection process, dry powdered lime (or another suitable sorbent) is directly
injected into the ductwork upstream of a PM control device. Some systems use spray humidification followed by dry injection. This dry process eliminates the slurry production and handling equipment required for wet scrubbers and spray dryers, and produces dry reaction waste products for easier disposal. The SO2 is adsorbed and reacts with the powdered sorbent. The dry solids are entrained in the combustion gas stream, along with fly ash, and collected by the PM control device. The SO2 removal efficiencies of existing dry injection systems range from 40 to 60 percent.
Circulating Fluidized-bed Absorber In the circulating fluidized-bed absorber (CFBA), the flue gas flows upward through a
bed of sorbent particles to produce a fluid-like condition in the bed. This condition is obtained by adjusting gas flow rate sufficiently to support the particles, but not carry them out of the system. Characteristics of the bed are high heat and mass transfer, because of high mixing rates, and particle-to-gas contact. These conditions allow the CFBA’s bed of sorbent particles to remove a sorbate from the gas stream with high effectiveness. In a CFBA, material is withdrawn from the bed for treatment (such as desorption) then re-injected into the bed. The SO2 removal efficiencies for CFBA technologies range from 80 to 98 percent, providing a very effective means of control.
NOX Emission Controls Control techniques used to reduce NOX formation include combustion and post-
combustion control measures. Combustion measures consist of operating and equipment modifications that reduce the peak temperature and excess air in the furnace. Post-combustion control involves converting the NOX in the flue gas to molecular nitrogen and water using either a process that requires a catalyst (selective catalytic reduction) or a process that does not use a catalyst (selective noncatalytic reduction).
Table II-4 presents the 1999 nationwide distribution of NOX controls used for coal-fired electric utility boilers by total number of units and by percentage of nationwide electricity generating capacity. Approximately one-third of the boilers do not use additional NOX controls. The other two-thirds of the units use additional controls to meet the applicable NOX standards. The predominant control NOX strategy is to use one or more combustion control techniques. Post-combustion NOX reduction technologies (both catalytic and noncatalytic) accounted for
DRAFT – Assessment of Control Options for BART-Eligible Sources Page 2-12
2-12
only a small percentage of the NOX emission controls used in 1999 (approximately three percent of the total units). However, a number of electric utilities have recently retrofitted are currently actively retrofitting a large number of units with advanced SCR technology to meet the requirements of the federal Title IV acid rain program or the Section 110 Transport SIP call.
Combustion Controls A variety of combustion control practices can be used including low-NOX burners
(LNBs), overfire air, off-stoichiometric firing, selective or biased burner firing, reburning, and burners-out-of-service. Control of NOX also can be achieved through staged combustion (also called air staging). With staged combustion, the primary combustion zone is fired with most of the air needed for complete combustion of the coal. The remaining air is introduced into the products of the partial combustion in a secondary combustion zone. Air staging lowers the peak flame temperature, thereby reducing thermal NOX, and lowering the production of fuel NOX by reducing the oxygen available for combination with the fuel nitrogen. Staged combustion may be achieved through methods that require modifying equipment or operating conditions so that a fuel-rich condition exists near the burners (e.g., using specially designed low- NOX burners, selectively removing burners from service, or diverting a portion of the combustion air). In cyclone boilers and some other wet bottom designs, combustion occurs with a molten ash layer and the combustion gases flow to the main furnace; this design precludes the use of low NOX burners and air staging. Low-NOX burners may be used to lower NOX emissions by about 25 to 55 percent. Use of overfire air (OFA) as a single NOX control technique reduces NOX by 15 to 50 percent. When OFA is combined with low- NOX burners, reductions of up to 60 percent may result. The actual NOX reduction achieved with a given combustion control technique may vary from boiler to boiler.

DRAFT – Assessment of Control Options for BART-Eligible Sources Page 2-13
2-13
Table II-4 Nationwide distribution of existing NOX emissions controls used for coal-fired electric utility boilers for the year 1999 as reported in the Part II USEPA ICR data (USEPA, 2001).
Phase II USEPA ICR Data
NOX Control Type Abbreviation Code Nationwide
Number of
Boilers
Nationwide Percentage
of Boilers
Percent of Nationwide Electricity Generating Capacity
Combustion controls -
low- NOX burners
CC-LNB
404
35.4 %
43.0 %
Combustion controls - low- NOX burners +
overfire air
CC-LNB/OFA
84
7.4 %
10.4 %
Combustion controls -
overfire air
CC-OFA
79
6.9 %
10.6 %
Other combustion
controls (a)
CC
83
7.3 %
5.6 %
Selective noncatalytic
reduction
SNCR
32
2.8 %
0.6 %
Selective catalytic
reduction
SCR
6
0.5 %
1.3 %
No controls reported (b)
452
39.7%
28.5 %
Nationwide Total
1,140 (c)
100 %
100 %
(a) Combustion controls other than low-NOX burners or overfire air. The controls include burners-out-of service, flue gas recirculation, off-stoichiometric firing, and fluidized-bed combustion. (b) Entry in ICR response indicated “none,” “not applicable,” or was left blank. (c) Does not include the three IGCC units.
DRAFT – Assessment of Control Options for BART-Eligible Sources Page 2-14
2-14
Just as the combustion air to the primary combustion zone can be reduced, part of the fuel may be diverted to create a secondary flame with fuel-rich conditions downstream of the primary combustion zone. This combustion technique is termed reburning and involves injecting 10 to 20 percent of the fuel after the primary combustion zone and completing the combustion with overfire air. The fuel injected downstream may not necessarily be the same as that used in the primary combustion zone. In most applications of reburning, the primary fuel is coal and the reburn fuel is natural gas (methane), and the technology is known as “gas reburn.”
Other ways to reduce NOX formation by reducing peak flame temperature include using flue gas recirculation (FGR), reducing boiler load, injecting steam or water into the primary combustion zone, and increasing spacing between burners. By using FGR to return part of the flue gas to the primary combustion zone, the flame temperature and the concentration of oxygen in the primary combustion zone are reduced. Increasing the space between burners provides greater heat transfer to heat-absorbing surfaces. Another combustion control technique involves reducing the boiler load. In this case, the formation of thermal NOX generally decreases directly with decreases in heat release rate; however, reducing the load may cause poor air and fuel mixing and increase CO and soot emissions.
Selective Catalytic Reduction The selective catalytic reduction (SCR) process uses a catalyst with ammonia gas (NH3)
to reduce the NO and NO2 in the flue gas to molecular nitrogen and water. The ammonia gas is diluted with air or steam, and this mixture is injected into the flue gas upstream of a metal catalyst bed (composed of vanadium, titanium, platinum, or zeolite). In the reactor, the reduction reactions occur at the catalyst surface. Typically some ammonia exits the catalyst, on the order of 1-5 ppm in the flue gas; this is called “ammonia slip”. The SCR catalyst bed reactor is usually located between the economizer outlet and air heater inlet, where temperatures range from 230 to 400 °C (450 to 750 °F). The catalyst modules take up a considerable amount of space; in addition ductwork must be added for the ammonia injection section. There is not always room in an existing boiler to retrofit an SCR system. As a consequence, fan capacity may have to be increased, owing to the incremental pressure drop from the SCR and associated ductwork. In some cases, the boiler must be modified to increase the economizer exit temperature to the minimum and/or the air preheater must be modified. Installation of an SCR on a boiler is site-specific and this results in a range of capital costs for SCR systems on boilers.
SCR catalysts in coal- and oil-fired boilers oxidize a small fraction of the SO2 in the flue gas to produce SO3. The SO3 in the flue gas from an SCR may only be on the order of 10 ppm (depending on the sulfur-content of the fuel), but it can have impacts on the downstream equipment and emissions. The combination of ammonia slip and increased SO3 can form deposits of ammonium bisulfate in the air preheater. SO can condense in the flue gas in the form of a fine aerosol of sulfuric acid, which can cause a visible plume, the so-called “blue plume”.
Selective Noncatalytic Reduction The selective noncatalytic reduction (SNCR) process is based on the same basic
chemistry of reducing the NO and NO2 in the flue gas to molecular nitrogen and water but does not require the use of a catalyst to prompt these reactions. Instead, the reducing agent is injected into the flue gas stream at a point where the flue gas temperature is within a very specific
DRAFT – Assessment of Control Options for BART-Eligible Sources Page 2-15
2-15
temperature range. Currently, two SNCR processes are commercially available: the THERMAL DeNOX and the NOXOUT (USEPA, 1998). The THERMAL DeNOX uses ammonia gas as the reagent and requires the gas be injected where the flue gas temperature is in the range of 870 to 1090 °C (1,600 to 2,000 °F). Consequently, the ammonia gas is injected at a location upstream of the economizer. However, if the ammonia is injected above 1,090 °C (2,000 ºF), the ammonia will oxidize and will result in the formation of excess NOX emissions. Once the flue gas temperature drops below the optimum temperature range, the effectiveness of the process drops significantly. By adding hydrogen gas or other chemical enhancers, the reduction reactions can be sustained to temperatures down to approximately 700 °C (1,300 °F). The NOXOUT is a similar process but uses an aqueous urea solution as the reagent in place of ammonia.
Using nitrogen-based reagents requires operators of SNCR systems to closely monitor and control the rate of reagent injection. If injection rates are too high, NOX emissions may increase, and stack emissions of ammonia in the range of 10 to 50 ppm may also result. A portion (usually around 5 percent) of the NO reduction by SNCR systems results from transformation of NO to N2O, which is a global warming gas.
Particulate Matter Emission Controls Four types of control devices are used to collect PM emissions from coal-fired electric
utility boilers: electrostatic precipitators, fabric filters, mechanical collectors, and particle scrubbers. Table II-5 presents the 1999 nationwide distribution of PM controls on coal-fired electric utility boilers by total number of units and by percentage of nationwide electricity generating capacity. Electrostatic precipitators are the predominant control type used on coal-fired electric utility boilers both in terms of number of units (84 percent) and total generating capacity (87 percent). The second most common control device type used is a fabric filter. Fabric filters are used on about 14 percent of the coal-fired electric utility boilers. Particle scrubbers are used on approximately three percent of the boilers. The least used control device type is a mechanical collector. Less than one percent of the coal-fired electric utility boilers use this type of control device as the sole PM control. Other boilers equipped with a mechanical collector use this control device in combination with one of the other PM control device types.
Electrostatic Precipitators Electrostatic precipitator (ESP) control devices have been used to control PM emissions
for over 80 years. These devices can be designed to achieve high PM collection efficiencies (greater than 99 percent), but at the cost of increased unit size. An ESP operates by imparting an electrical charge to incoming particles, and then attracting the particles to oppositely charged metal plates for collection. Periodically, the particles collected on the plates are dislodged in sheets or agglomerates (by rapping the plates) and fall into a collection hopper. The dust collected in the ESP hopper is a solid waste that must be disposed of.

DRAFT – Assessment of Control Options for BART-Eligible Sources Page 2-16
2-16
Table II-5 Nationwide distribution of existing PM emission controls used for coal-fired electric utility boilers for the year 1999 (USEPA, 2001).
Phase II USEPA ICR Data
PM Control Type
Abbreviation Code
Number of Boilers
Percent of Nationwide
Total Number of
Units
Percent of
Nationwide Electricity Generating Capacity
Electrostatic precipitator
(Cold-side)
CS- ESP
822 (a)
72.1 %
74.7 %
Electrostatic precipitator
(Hot-side)
HS-ESP
122
10.8 %
11.3 %
Fabric filter
FF
155 (b)
13.6 %
9.4 %
Particle scrubber
PS
23 (c)
2.0%
3.0 %
Mechanical collector (d)
MC
5
0.4 %
0.2 %
Multiple control device
combinations (e)
13
1.1 %
1.4 %
Nationwide Total
1,140 (f)
100 %
100 %
(a) Includes 10 boilers with cold-side ESP in combination with upstream mechanical collector. (b) Includes eight boilers with baghouse in combination with upstream mechanical collector. (c) Includes two boilers with particle scrubber in combination with upstream mechanical collector. (d) Boilers using mechanical collector as only PM control device. (e) Boilers using a combination of two or more different control device types other than mechanical collectors. Includes two boilers that use a hot-side ESP in series with a cold-side ESP. (f) Does not include the three IGCC units.
DRAFT – Assessment of Control Options for BART-Eligible Sources Page 2-17
2-17
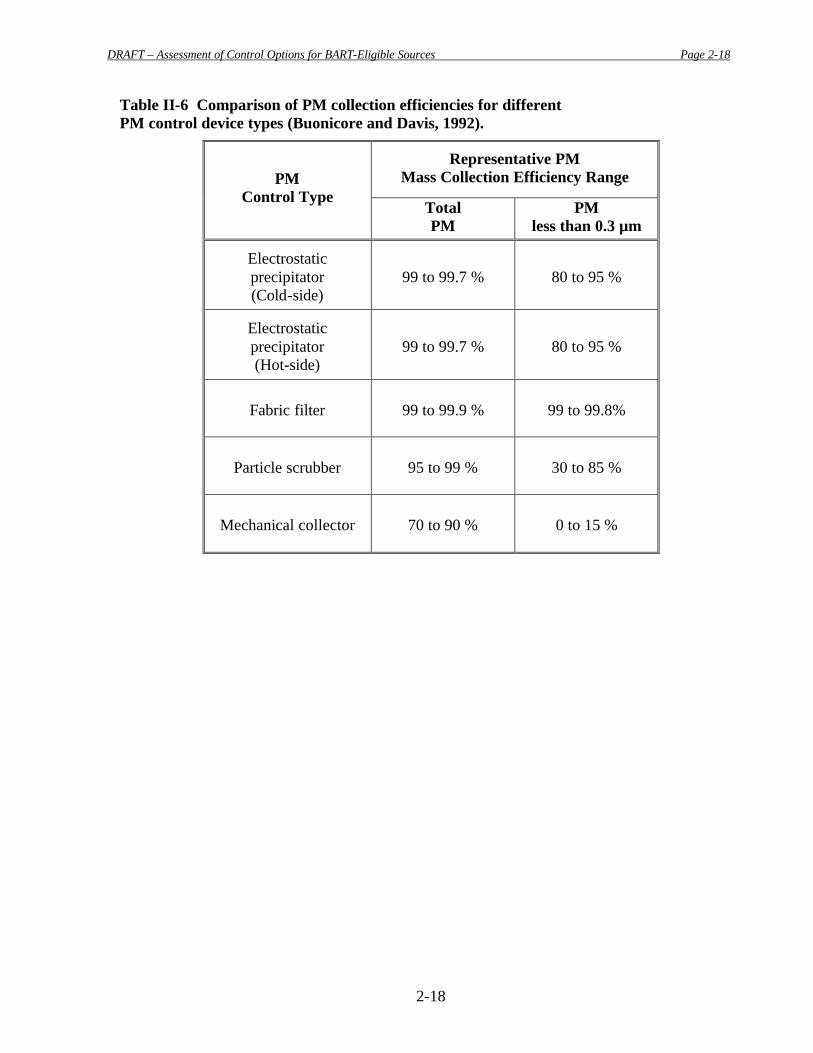
The effectiveness of particle capture in an ESP depends largely on the electrical resistance of the particles being collected. An optimum value exists for a given ash. Above and below this value, particles become less effectively charged and collected. Table II-6 presents the PM collection efficiency of an ESP compared with the other control device types. Coal that contains a moderate to high amount of sulfur (more than approximately three percent) produces an easily collected fly ash. Low-sulfur coal produces a high-resistivity fly ash that is more difficult to collect. Resistivity of the fly ash can be changed by operating the boiler at a different temperature or by conditioning the particles upstream of the ESP with sulfur trioxide, sulfuric acid, water, sodium, or ammonia. In addition, collection efficiency is not uniform for all particle sizes. For coal fly ash, particles larger than about 1 to 8 µm and smaller than about 0.3 µm (as opposed to total PM) are typically collected with efficiencies from 95 to 99.9 percent. Particles near the 0.3 µm size are in a poor charging region that reduces collection efficiency to 80 to 95 percent.
An ESP can be used at one of two locations in a coal-fired electric utility boiler system. For many years, every ESP was installed downstream of the air heater where the temperature of the flue gas is between 130 and 180 °C (270 and 350 °F). An ESP installed at this location is referred is as a "cold-side" ESP. However, to meet SO2 emission requirements, many electric utilities switched to burning low-sulfur coal (discussed in Section 2.3.2 under SO2 controls). These coals have higher electrical ash resistivities, making the fly ash more difficult to capture downstream of the air heater. Therefore, to take advantage of the lower fly-ash resistivities at higher temperatures, some ESPs are installed upstream of the air heater, where the temperature of the flue gas is in the range of 315 to 400 °C (600 to 750 °F). An ESP installed upstream of the air heater is referred to as a "hot-side" ESP. (Buonicore and Davis, 1992; USEPA, 1998).
Fabric Filters Fabric filters (FF) have been used for fly ash control from coal-fired electric utility
boilers for about 30 years. This type of control device collects fly ash in the combustion gas stream by passing the gases through a porous fabric material. The buildup of solid particles on the fabric surface forms a thin, porous layer of solids or a filter, which further acts as a filtration medium. Gases pass through this cake/fabric filter, but the fly ash is trapped on the cake surface. The fabric material used is typically fabricated in the shape of long, cylindrical bags. Hence, fabric filters also are frequently referred to as "baghouses."
DRAFT – Assessment of Control Options for BART-Eligible Sources Page 2-18
2-18
Table II-6 Comparison of PM collection efficiencies for different PM control device types (Buonicore and Davis, 1992).
Representative PM Mass Collection Efficiency Range PM
Control Type Total PM
PM less than 0.3 µm
Electrostatic precipitator (Cold-side)
99 to 99.7 %
80 to 95 %
Electrostatic precipitator (Hot-side)
99 to 99.7 %
80 to 95 %
Fabric filter
99 to 99.9 %
99 to 99.8%
Particle scrubber
95 to 99 %
30 to 85 %
Mechanical collector
70 to 90 %
0 to 15 %
DRAFT – Assessment of Control Options for BART-Eligible Sources Page 2-19
2-19
Gas flow through a FF becomes excessively restricted if the filter cake on the bags becomes too thick. Therefore, the dust collected on the bags must be removed periodically. The type of mechanism used to remove the filter cake classifies FF design types. Depending on the FF design type, the dust particles will be collected either on the inside or outside of the bag. For designs in which the dust is collected on the inside of the bags, the dust is removed by either mechanically shaking the bag (called a "shaker type" FF) or by blowing air through the bag from the opposite side (called a "reverse-air" FF). An alternate design mounts the bags over internal frame structures, called "cages" to allow collection of the dust on the outside of the bags. A pulsed jet of compressed air is used to cause a sudden stretching then contraction of the bag fabric dislodging the filter cake from the bag. This design is referred to as a "pulse-jet" FF. The dislodged dust particles fall into a hopper at the bottom of the baghouse. The dust collected in the hopper is a solid waste that must be disposed of.
An FF must be designed and operated carefully to ensure that the bags inside the collector are not damaged or destroyed by adverse operating conditions. The fabric material must be compatible with the gas stream temperatures and chemical composition. Because of the temperature limitations of the available bag fabrics, location of an FF for use in a coal-fired electric utility boiler is restricted to downstream of the air heater. In general, fabric filtration is the best commercially available PM control technology for high-efficiency collection of small particles.
Electrostatic stimulation of fabric filtration (ESFF) involves a modified fabric filter that uses electrostatic charging of incoming dust particles to increase collection efficiency and reduce pressure drop compared to fabric filters without charging. Filter bags are specially made to include wires or conductive threads, which produce an electrical field parallel to the fabric surface. Conductors can also be placed as a single wire in the center of the bag. When the bags are mounted in the baghouse, the conductors are attached to a wiring harness that supplies electricity. As particles enter the field and are charged, they form a porous mass or cake of agglomerates at the fabric surface. Greater porosity of the cake reduces pressure drop, while the agglomeration increases efficiency of small particle collection. Cleaning is required less frequently, resulting in longer bag life. For felted or nonwoven bags, the field promotes collection on the outer surface of the fabric, which also promotes longer bag life. Filtration velocity can be increased so that less fabric area is required in the baghouse. The amount of reduction is based on an economic balance among desired performance, capital cost, and operating costs. A number of variations exist on the ESFF idea of combining particle charging with fabric filtration. (Buonicore and Davis, 1992; Turner and McKenna, 1989).
Particle Scrubbers and Mechanical Collectors Particle scrubbers are generally much less efficient than ESPs and baghouses (especially
in collecting finer fraction of PM). For this reason and because they entail higher operating costs associated with achieving high collection efficiency, they are not widely used in the industry. Similarly, mechanical collectors have the least collection efficiency and are hardly used in the industry. These two methods are not discussed further in this report. (Buonicore and Davis, 1992).
DRAFT – Assessment of Control Options for BART-Eligible Sources Page 2-20
2-20
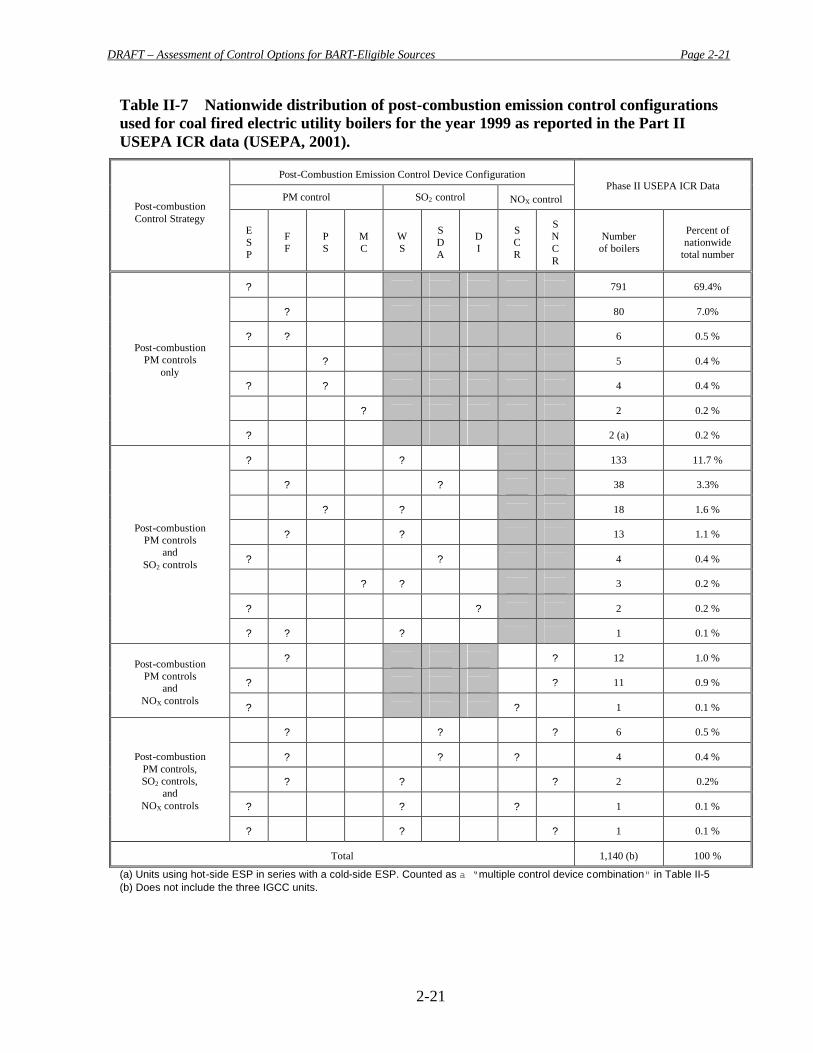
2.3.3. Emission Control Configurations for Coal-fired Electric Utility Boilers Table II-7 presents the 1999 nationwide distribution of post-combustion control device
configurations used for coal-fired electric utility boilers. For approximately 70 percent of the boilers, the only control device used downstream of the furnace is an ESP. If the unit is subject to SO2 and/or NOX emission limit standards, these units do burn low-sulfur coals to meet the SO2 emission limit and use some type of NOX combustion controls to meet the NOX emission limit. Approximately 25 percent of the boilers use some combination of post-combustion control devices. The most common configuration used is an ESP with a downstream wet scrubber for SO2 control. Less than 2 percent of the units used a combination of PM, SO2, and NOX post-combustion control devices.
It is important to note that, for the case of PM, the data on PM control as shown for the year 1999 should not have changed in any significant way. However, for SO2, the requirements of Phase II ( starting in the Year 2000) of the Title IV (acid rain provisions) of the 1990 CAAA, should have resulted in some boilers either switching to low -sulfur coal or the application of wet or dry scrubbers. It appears that the SO2 scrubber retrofit activity in the U.S. has been rather insignificant since 1999. The most active retrofits have involved the application of SCR, SNCR, and gas reburn (in conjunction with low-NOX burners where appropriate) to significantly reduce NOX emissions in the eastern U.S. These reductions, however, are only for ozone season (May 1 to September 30) since the NOX Transport SIP call applies to ozone season. As of 2003, more than 50 applications of SCRs, SNCRs, or gas reburn have either been completed or are under construction.
DRAFT – Assessment of Control Options for BART-Eligible Sources Page 2-21
2-21
Table II-7 Nationwide distribution of post-combustion emission control configurations used for coal fired electric utility boilers for the year 1999 as reported in the Part II USEPA ICR data (USEPA, 2001).
Post-Combustion Emission Control Device Configuration
PM control SO2 control
NOX control
Phase II USEPA ICR Data
Post-combustion Control Strategy
E S P
F F
P S
M C
W S
S D A
D I
S C R
S N C R
Number
of boilers
Percent of nationwide
total number
?
791
69.4%
?
80
7.0%
?
?
6
0.5 %
?
5
0.4 %
?
?
4
0.4 %
?
2
0.2 %
Post-combustion
PM controls only
?
2 (a)
0.2 %
?
?
133
11.7 %
?
?
38
3.3%
?
?
18
1.6 %
?
?
13
1.1 %
?
?
4
0.4 %
?
?
3
0.2 %
?
?
2
0.2 %
Post-combustion
PM controls and
SO2 controls
?
?
?
1
0.1 %
?
?
12
1.0 %
?
?
11
0.9 %
Post-combustion
PM controls and
NOX controls ?
?
1
0.1 %
?
?
?
6
0.5 %
?
?
?
4
0.4 %
?
?
?
2
0.2%
?
?
?
1
0.1 %
Post-combustion
PM controls, SO2 controls,
and NOX controls
?
?
?
1
0.1 %
Total
1,140 (b)
100 %
(a) Units using hot-side ESP in series with a cold-side ESP. Counted as a “multiple control device combination" in Table II-5 (b) Does not include the three IGCC units.
DRAFT – Assessment of Control Options for BART-Eligible Sources Page 2-22
2-22
2.4. Costs and Availability of Technology The technologies to control three of the precursors of regional haze are commercially
available. Since EGUs are the most significant stationary source of SO2, NOX, and PM, they have been subject to extensive federal and state regulations to control all three pollutants. The technical feasibility of control technologies has been successfully proven for a large number of small (say, 100 MW) to very large boilers (over 1,000 MW) using different types of coal used. Over the last few years, a large amount of cost data have also become available that clearly indicate that many technologies provide substantial and extremely cost effective reductions.
2.4.1. Detailed Capital Costs, Operating and Maintenance Costs, and Cost Effectiveness Cost of Controlling SO2 Emissions
Both wet and dry scrubbers are in wide commercial use in the U.S. The capital costs for new or retrofit wet or dry scrubbers are high when compared to the capital costs for NOX and PM controls. The recent capital costs range from $180/kW for large units (larger than 600 MW) to as high as $350 for small units (200 to 300 MW). However, the last few years has seen a general trend of declining capital costs due to vendor competition and technology maturation. The cost effectiveness (in dollars per ton) is very attractive, since these devices remove a very large amount of SO2 (driven by high sulfur content of coal burned). The typical cost effectiveness is in the range of 200 to 500 dollars per ton of SO2 removed though higher values are obtained for small units operating at low capacity factors and burning low-sulfur coal. The cost effectiveness is determined mostly by the baseline pre-controlled SO2 emisison rate (or sulfur content of fuel), size and capacity factor of the unit, as well as the capital cost of FGDs (that generally ranges from $150 to $200/kW).
Cost of Controlling NOX A representative summary of range of costs associated with various technologies for NOX
control is provided below.
Gas Reburn In general, the capital costs range from $15/kW to $30/kW for gas reburn and $30/kW to
$60/kW when using coal as the reburn fuel. Operating costs are mainly driven by fuel cost differential (certainly gas vs. coal). For other fuels (e.g. coal/orimulsion reburning), fuel preparation costs become more important (micronization, atomization) as there is little or no fuel cost differential. The cost in dollars per ton of NOX removed is in the range of 500 to 2000 dollars.
Retrofit schedules are directly related to the scope of the retrofit requirements. In most cases, 3-6 weeks are adequate for a reburn retrofit.
Low-NOX Burners
DRAFT – Assessment of Control Options for BART-Eligible Sources Page 2-23
2-23
In general, the capital costs for burners range from $10,000 to 50,000 per burner plus installation. The lower end of this range applies when existing burners are modified instead of replaced to achieve lower NOX. Operating costs are negligible unless increased unburned carbon results in lost revenues from ash sales. An outage is generally required when implementing this technology, but coal-flow sensors and adjustable orifices are best installed when a mill is out of service. Low-NOX Burners provide moderate NOX reductions in the range of 30 to 60% at moderate cost ($200 to 500 per ton of NOX removed).
Overfire Air (OFA) OFA technologies have little or no impact on operating costs (other than the potential for
an increase in unburned carbon - efficiency loss -, and the resulting impact on ash disposal options). Retrofit costs are site-specific. As such, the economics of these technologies are driven by capital/retrofit costs which typically range from $5-$10/kW, with the lower range reflecting easier application whereas the higher costs are typically associated with more difficult and involved retrofits. The cost effectiveness is in the range of $250 to 600 per ton of NOX removed.
From a schedule standpoint, OFA retrofit projects can require outages of 3 – 6 weeks, depending on factors such as scope of work, integration with other plant outage requirements, etc.
SCR Capital costs for retrofit SCR systems to coal-fired power generation sources are specific
to the individual site, but have been documented to be within the range of $70/kW to about $190/kW. The lower end of this range applies to retrofits with nominal difficulty. The high end of the range would typically be associated with retrofits having significantly impeded construction access, extensive relocations, and difficult ductwork transitions.
Capital costs for retrofit SCR systems on oil and gas-fired boilers are substantially lower (about half to one third) than costs of coal-fired boiler retrofits. Lower volumes of catalyst are required for gas-fired boilers because of the lack of ash and catalysts poisons like arsenic in the flue gas. Capital costs for oil-fired retrofits are intermediate between coal- and gas-fired retrofits. Oil combustion produces some particulate matter, which necessitates larger SCR catalyst volume as compared to that for natural gas.
Operating costs are mainly driven by cost of reagent, energy penalty (pressure loss, ammonia vaporization), catalyst replacement and dedicated O and M costs. SCR technology offers very high NOX reductions (from 90 to 95%) and cost effectiveness (in the range of $1,000 to 1500 per ton of NOX removed).
SNCR The capital costs for SNCR application are low making it an attractive option for
moderate NOX reductions (25 to 50%). Capital cots range from $10 to $20/kW for power generation boilers.
DRAFT – Assessment of Control Options for BART-Eligible Sources Page 2-24
2-24
Operating costs are driven primarily by the consumption of the chemical reagent – usually urea for SNCR - which in turn is dependent upon the efficiency of the control equipment as well as the initial NOX level and the desired percent reduction. These are typically in the range of $500-$700/ton of NOX.
An additional consideration important in the overall operating costs is the potential contamination of fly ash by ammonia making it potentially unsalable.
Cost of Controlling PM The costs associated with controlling PM from EGUs generally do not scale on the size
of the unit but on the volume of flue gases processed by the control devices (ESPs or fabric filters). The representative costs are provided below.
ESPs The following values represent typical costs for application of ESPs to units handling a
range of flue gas rates (these numbers reflect unit sizes ranging from utility-size units up to about 2,000,000 ACFM to smaller process down to about 10,000 ACFM):
• Capital: $15 - $40/ACFM • Fixed O&M: Dry ESP’s - $0.25 - $0.65/yr-ACFM
Wet ESP’s - $0.15- $0.50/yr-ACFM • Variable O&M: Dry ESP’s - $0.45 - $0.60/yr-ACFM
Wet ESP’s - $0.25 - $0.50/yr-ACFM
Fabric Filters Baghouses have been used extensively for many years in different industries. The EGU
sector, while predominantly dominated by ESP’s, has started to utilize FF’s in the last 20 years.
• Capital: Reverse Air Fabric Filter - $17 - $40/ACFM Pulse Jet Fabric Filter - $12 - $40/ACFM
• Fixed O&M: Reverse Air Fabric Filter - $0.35 - $0.75/yr-ACFM Pulse Jet Fabric Filter - $0.50 - $0.90/yr-ACFM
• Variable O&M: Reverse Air Fabric Filter - $0.70 - $0.80/yr-ACFM Pulse Jet Fabric Filter - $.90 - $1.1/yr-ACFM
DRAFT – Assessment of Control Options for BART-Eligible Sources Page 2-25
2-25
References
Buonicore, A.J., and W.T. Davis (eds.). Air Pollution Engineering Manual. Air & Waste Management Association. Van Nostrand Reinhold, New York, NY. 1992. NESCAUM, A Basis for Control of BART Eligible Sources, Northeast States for Coordinated Air Use Management, Boston, MA, July, 2001. Turner, J.H., and J.D. McKenna. Fabric Filter Baghouses I - Theory, Design, and Selection. ETS, Inc., Roanoke, VA. 1989. U.S. Environmental Protection Agency. Air Quality Criteria for Particulate Matter and Sulfur Oxides, Volumes 1-3, EPA/600/8-82/029a-c. (NTIS PB84-156777). Office of Health and Environmental Assessment, Environmental Criteria and Assessment Office, Research Triangle Park, NC. 1982. U.S. Environmental Protection Agency. Air Quality Criteria for Oxides of Nitrogen, Volumes 1-3, EPA/600/8-91/049a-c (NTIS PB92-176361; 95-124525; 95-124517), Office of Health and Environment Assessment, Environmental Criteria and Assessment Office, Research Triangle Park, NC. 1991. U.S. Environmental Protection Agency, Stationary Source Control Techniques Document for Fine Particulate Matter, Woodward, K., EPA/425/R-97-001 (NTIS PB99-116493). Office of Air Quality Planning and Standards, Research Triangle Park, NC. October 1998. U.S Environmental Protection Agency, National Air Pollutant Emissions Trends, 1900-1998, U.S. EPA and the States: Working Together for Cleaner Air, Nizich, S.V., A.A. Pope, and L.M. Driver. EPA-454/R-00-002 (NTIS PB2000-108054). Office of Air Quality Planning and Standards, Research Triangle Park, NC. March 2000. U.S. Environmental Protection Agency. Database of information collected in the Electric Utility Steam Generating Unit Mercury Emissions Information Collection Effort. OMB Control No. 2060-0396. Office of Air Quality Planning and Standards. Research Triangle Park, NC. April 2001. Available at: <http://www.epa.gov/ttn/atw/combust/utiltox/utoxpg.html>.
DRAFT – Assessment of Control Options for BART-Eligible Sources Page 3-1
3-1
3. INDUSTRIAL BOILERS
Industrial boilers are a significant source of emissions among the twenty-six source categories covered under the Regional Haze Rule. Estimates of national emissions for criteria air pollutants prepared by the USEPA (2000) show that industrial boilers contributed approximately 12 percent of the estimated total national SO2 emissions and 23 percent of total national NOX emissions in 1998 (the most recent year for which national estimates are available). Industrial boilers also are one of the largest industrial sources of PM emissions, with 16 percent of the national PM10 emissions and 20 percent of the national PM2.5 in 1998. Contrast this with the emissions of EGUs for which PM10 and PM2.5 emissions were 25 percent and 23 percent of national totals in 1998, respectively. In general, the combustion efficiencies achieved by industrial boilers are lower than those of EGUs, resulting in significant emissions of CO (18 percent of the 1998 emissions) and volatile organic compounds (6 percent of the 1998 emissions) from industrial boilers. Industrial boilers also produced 16 percent of the ammonia emissions in 1998. Ammonia is precursor of secondary PM in the atmosphere.
About 46 percent of the SO2 emissions from industrial boilers are from coal-fired boilers (see Table III-1). The predominant sources of NOX emissions from industrial boilers are gas-fired boilers (30 percent) and internal combustion boilers (34 percent); coal-fired boilers were only responsible for 17 percent of NOX emissions from industrial boilers. Although the emphasis of this Chapter is on coal-fired utility boilers, many technologies described here are also applicable to gas and oil-fired units (for example, SCR and SNCR technologies are equally applicable to coal and natural gas/oil units, generally at much lower capital and operating costs; same is true for wet scrubbers for SO2 control and ESPs or baghouses for PM control for oil units).
Table III-1 Distribution of emissions from industrial fuel boilers from 1998 National Emissions Inventory (USEPA, 2000)
Fuel/Source NOX SO2 PM10 PM2.5 Coal 17% 46% 31% 16% Oil 7% 27% 18% 16% Gas 39% 21% 18% 26% Other 4% 5% 25% 32% Internal Combustion 34% 1% 7% 10%
3.1. Description of Boiler Process Typically, industrial boilers generate steam used for process heating or on-site
generation of electricity. Industrial boilers burn a wider variety of fuels than EGUs and there are a larger number of boiler designs in use than in the electric power sector. According to information contained in USEPA’s Docket on “National Emission Standards for Hazardous Air Pollutants for Industrial/ Commercial/Institutional Boilers

DRAFT – Assessment of Control Options for BART-Eligible Sources Page 3-2
3-2
and Process Heaters” (USEPA, 2004) in 1998 there were 63,767 fossil fuel-fired boilers, 1,100 wood-fired boilers and 998 boilers classified as non-fossil-fuel-fired. The fossil fuels fired were natural gas, distillate oil, residual oil, coal and petroleum coke. The majority (75 to 95 percent) of the boilers firing natural gas, residual oil and distillate oil are fire tube boilers; the rest are water tube boilers. Coal-fired boilers include fluidized bed boilers, stokers, cyclone boilers, and pulverized coal-fired boilers (wall-fired or tangentially fired). Wood-fired boilers include fluidized bed boilers, cyclones, stokers and dutch ovens.
3.2. Review of BART-Eligible Industrial Boilers in the MANE-VU Region
There are 10 facilities with BART-Eligible industrial boilers in the MANE-VU region. Table III-2 contains a list of these sources based on a previous NESCAUM report (2003) and follow-up review by state permitting authorities. 5
Table III-2 BART-Eligible Facilities in the Industrial Boiler Category
State Company/Facility City/Town Category
Connecticut SPRAGUE PAPERBOARD INC Versailles boilers Massachusetts GENERAL ELECTRIC AIR (GE Aircraft Engines) Lynn boilers
Massachusetts TRIGEN BOSTON ENERGY-KNEELAND STATION Boston boilers
Massachusetts SOLUTIA INC. (MONSANTO CO.) Springfield boilers
Massachusetts HARVARD UNIVERSITY CAMBRIDGE Cambridge boilers
Maine International Paper - Bucksport Bucksport boilers
Maine Katadhin - Mill W. Millinocket boilers
New Hampshire Annheuser-Busch Merrimack boilers
New Hampshire Dartmouth College Hanover boilers
Rhode Island BROWN UNIVERSITY Providence boilers
3.3. Available Control Technologies A variety of emission control technologies are employed to meet requirements for
sulfur dioxide (SO2), nitrogen oxides (NOX), and primary PM emissions, the three major precursors of observed regional haze in the atmosphere. SO2 and NOX are mostly converted to ammonium sulfate and ammonium nitrate that are formed by the reactions of precursor gases with ammonia, which is emitted mostly from agricultural and cattle-related activities.
Pollutant emission controls are generally divided into three major types:
5 NESCAUM does not believe that there are any BART-eligible sources in the State of Vermont or any of the member Tribes in MANE-VU and thus we have not developed lists for these jurisdictions. In addition, Pennsylvania and the District of Columbia have developed BART-Eligible source lists following their own methodology and any identified sources are contained here and in the final list in Appendix A.
DRAFT – Assessment of Control Options for BART-Eligible Sources Page 3-3
3-3
• Pre-combustion Controls. Control measures in which fuel substitutions are made or fuel pre-processing is performed to reduce pollutant formation in the combustion unit.
• Combustion Controls. Control measures in which operating and equipment modifications are made to reduce the amount of pollutants formed during the combustion process; or in which a material is introduced into the combustion unit along with the fuel to capture the pollutants formed before the combustion gases exit the unit.
• Post-combustion Controls: Control measures in which one or more air pollution control devices are used at a point downstream of the furnace combustion zone to remove the pollutants from the post-combustion gases.
3.3.1. Emission Characteristics of Regional Haze Precursors from Industrial Boilers
Nitrogen Oxides The formation of NOX is an unfortunate byproduct of the combustion of fossil
fuels. Both NO and NO2 (collectively called NOX) are formed during fossil fuel combustion by oxidation of molecular nitrogen that is present in the combustion air or nitrogen compounds contained in the fuel. The degree to which this conversion occurs is dependent on many factors including both the combustion process itself and the properties of the particular fuel being burned. This explains why similar boilers firing different fuels or similar fuels burned in different boilers will yield different NOX emissions. Overall, total NOX formed during combustion is composed predominantly of NO mixed with small quantities of NO2 (typically less than 10 percent of the total NOX formed). However, once NO formed during coal combustion is emitted to the atmosphere, the NO is oxidized to NO2.
The NOX formed during combustion by oxidation of molecular nitrogen (N2) in the combustion air is referred to as “thermal NOX.” The oxidation reactions converting N2 to NO and NO2 become very rapid once gas temperatures rise above 1,700°C (3,100°F). Formation of thermal NOX in a boiler is dependent on two conditions occurring simultaneously in the combustion zone: high temperature and an excess of combustion air. A boiler design feature or operating practice that increases the gas temperature above 1,700 °C, the gas residence time at these temperatures, or the quantity of excess combustion air affects thermal NOX formation. The formation of NOX by oxidation of nitrogen compounds contained in the coal is referred to as “fuel NOX.” The nitrogen content in coal and petcoke ranges from approximately 0.5 to 2 percent; in wood, the nitrogen content is typically 0.1 to 0.2 percent. The amount of nitrogen available in the fuel is relatively small compared with the amount of nitrogen available in the combustion air. However, a significant portion of the fuel nitrogen can be converted to NO in the flame. Local temperature, oxygen concentration and NO concentration affect the conversion of fuel nitrogen to NO and this is exploited in low-NOX firing systems.
DRAFT – Assessment of Control Options for BART-Eligible Sources Page 3-4
3-4
Sulfur Dioxide SO2, like NOX, is a precursor to acid rain and fine particulate matter (PM2.5) and is
also an undesirable byproduct of the combustion of sulfur-containing fuels. Coal deposits contain sulfur in amounts ranging from trace quantities to as high as 8 percent or more. Natural gas contains virtually no sulfur. Residual oil can have 1 to 2 percent sulfur by weight, while petroleum coke can have as much as 6 percent sulfur. During combustion, sulfur compounds in the fuel are oxidized to gaseous SO2 or SO3. When firing bituminous coal, almost all of the sulfur present in coal is emitted as gaseous sulfur oxides (on average, 98 percent). The more alkaline nature of ash in some sub bituminous coals causes a portion of the sulfur in the coal to react to form various sulfate salts; these salts are emitted as fly ash or retained in the boiler bottom ash. When firing petcoke or residual oil, more of the SO2 is converted to SO3 because of the oxidation that is catalyzed by vanadium in the ash. In coal-fired boilers, SO3 levels are typically 10 ppm or less. With petcoke firing, however, SO3 levels as high as several hundred ppm have been reported (Fernando,2001). Formation of SO3 is a concern because the temperature of the particulate control device or scrubber is often below the acid dew point, resulting in nucleation and condensation of ultrafine sulfuric acid particles from the SO3 present in the gas. These particles can contribute to the fine PM emissions from the stack.
Unlike nitrogen in fossil fuels and wood, almost all of the sulfur in fuel is oxidized to form SO2. This means that the relationship between sulfur content in the fuel and SO2 production is much more direct than that between fuel nitrogen and NOX, and as such, it makes fuel switching (for example higher to lower sulfur coal) directly proportional to reductions in SO2. Generally, the percentage of sulfur in the fuel that is converted to sulfur oxides during combustion does not vary with the boiler design or operation. The exception to this is the fluidized bed boiler in which limestone is added to the bed. The bed is operated at a sufficiently low temperature (compared to other combustion systems) that sulfur is captured effectively in the bed as calcium sulfate.
Particulate Matter Primary PM emissions from boilers consist primarily of fly ash. Ash is the
unburned carbon and the mineral portion of the fuel. Coals contain 4 to 12 percent ash typically. Other liquid or solid fuels (oil, petroleum coke, wood) contain less than one percent ash. The amount of ash that ultimately exits the boiler unit as fly ash is a complex function of the fuel properties, furnace-firing configuration, and boiler operation. For the dry-bottom, pulverized-coal-fired boilers, approximately 80 percent of the total ash in the as-fired coal exits the boiler as fly ash. Wet-bottom, pulverized-coal-fired boilers emit significantly less fly ash: on the order of 50 percent of the total ash exits the boiler as fly ash. In a cyclone-fired boiler, most of the ash is retained as liquid slag; thus, the quantity of fly ash exiting the boiler is typically 20 to 30 percent of the total ash. However, the high operating temperatures unique to these designs promote ash vaporization and this results in larger fractions of submicron fly ash compared to dry bottom designs. Fluidized-bed combustors emit high levels of fly ash since the coal is
DRAFT – Assessment of Control Options for BART-Eligible Sources Page 3-5
3-5
fired in suspension and the ash is present in dry form. Spreader-stoker-fired boilers can also emit high levels of fly ash. However, overfeed and underfeed stokers emit less fly ash than spreader stokers, since combustion takes place in a relatively quiescent fuel bed.
In addition to the fly ash, PM emissions from boilers result from reactions of the SO2 and NOX compounds as well as unburned carbon particles carried in the flue gas from the boiler. The SO2 and NOX compounds are initially in the vapor phase following coal combustion in the furnace chamber but can partially chemically transform in the stack, or near plume, to form fine PM in the form of nitrates, sulfur trioxide (SO3), and sulfates. Firing configuration and boiler operation can affect the fraction of carbon (from unburned fuel) contained in the fly ash. Combustion efficiencies tend to be lower in industrial boilers than in EGUs. Oil or petcoke combustion results in high amounts of sulfur trioxide as compared to coal combustion because of the high vanadium content of residual oil and petcoke.
NOX control technologies that inject ammonia or amine-based reagents (like Selective Catalytic Reduction or Selective Non-Catalytic Reduction) produce ammonia, generally with concentrations less than 10 ppm. This ammonia can also form fine particulate in the stack, if it persists through the air pollution control devices.
3.3.2. Control Technologies used for Industrial Boilers
Application Status According to the 1998 survey of industrial boilers by USEPA (2004), only 2
percent of gas-fired boilers and 3 percent of oil-fired boilers had any kind of air pollution control device. More coal-fired boilers had air pollution control devices: 47 percent had some control device and these were largely PM controls.
For PM controls, ESPs were used on 12 percent of the coal-fired boiler units in 1998, fabric filters or baghouses were used on 10 percent of the boiler units, mechanical collectors were used on 21 percent of the units, and particulate scrubbers were only used on 2 percent of the units. 66 percent of wood-fired boilers used mechanical collectors for PM control, while 10 percent used PM scrubbers and another 10 percent used ESPs.
Post-combustion SO2 control was used by less than one percent of industrial boilers in 1998, with the exception of boilers firing petcoke: 2 percent of boilers firing petroleum coke had acid scrubbers. A small percentage of industrial boilers had combustion controls in place in 1998, although since 1998, additional low-NOX firing systems may have been installed.
SO2 Reduction Overview Almost all SO2 emission control technologies fall in the category of reducing SO2
after its formation, as opposed to minimizing its formation during combustion. The exception to the nearly universal use of post-combustion controls is found in fluidized bed boilers, in which limestone is added to the fluidized bed combustion. Typically 90
DRAFT – Assessment of Control Options for BART-Eligible Sources Page 3-6
3-6
percent of the sulfur can be captured in a coal-fired fluidized bed using limestone with Ca/S molar ratios of 2 to 2.5, depending on the sulfur content of the fuel, the reactivity of the limestone and the operation of the combustor.
Post-combustion SO2 control is accomplished by reacting the SO2 in the gas with a reagent (usually calcium- or sodium-based) and removing the resulting product (a sulfate/sulfite) for disposal or commercial use depending on the technology used. SO2 reduction technologies are commonly referred to as Flue Gas Desulfurization (FGD) and/or "Scrubbers" and are usually described in terms of the process conditions (wet versus dry), byproduct utilization (throwaway versus saleable) and reagent utilization (once-through versus regenerable).
Within each technology category, multiple variations are possible and typically involve the type and preparation of the reagent, the temperature of the reaction (for dry processes), the use of enhancing additives, etc. Because these variations mostly involve complex process chemistry, but are fundamentally similar, this summary focuses on the major categories of SO2 control technologies, their applicability, performance and cost.
Pre-Combustion Control A coal with sufficiently low sulfur content that when burned in the boiler meets
the applicable SO2 emission standards without the use of additional controls is sometimes referred to as “compliance coal.” Coals naturally low in sulfur content may be mined directly from the ground. Alternatively, the sulfur content of coal fired in the boiler may be lowered first by cleaning the coal or blending coals obtained from several sources. However, burning low-sulfur coal may not be a technically feasible or economically practical SO2 control alternative for all boilers. In some cases, a coal with the required sulfur content to meet the applicable standard may not be available or cannot be fired satisfactorily in a given boiler unit design. Even if such a coal is available, use of the low-sulfur coal that must be transported long distances from the mine may not be cost-competitive with burning higher sulfur coal supplied by closer mines and using a post-combustion control device.
Various coal cleaning processes may be used to reduce the sulfur content of the coal. A significant portion of the pyritic sulfur minerals mixed with the mined coal can usually be removed by physical gravity separation or surface property (flotation) methods. However, physical coal cleaning methods are not effective for removing the organic sulfur bound in coal. Another method of reducing the overall sulfur content of the coal burned in a given boiler unit is to blend coals with different sulfur contents to meet a desired or target sulfur level.
In-Process Controls Fluidized bed boilers generally operate at lower temperatures than other
combustion systems, 800 to 870oC (1500 to 1600oF). The lower temperatures allow the use of limestone or dolomite to be added to the bed to capture sulfur. Limestone (CaCO3) is converted to CaO at approximately 800oC (1500oF). SO2 released from the
DRAFT – Assessment of Control Options for BART-Eligible Sources Page 3-7
3-7
fuel reacts with CaO to form CaSO4, which is thermodynamically stable at bed temperatures. By recycling some of the solids leaving the bed, which contain unsulfated calcium, 90 percent removal of SO2 can be achieved with Ca/S molar ratios of 2 to 2.5 in circulating fluidized beds. Higher Ca/S ratios are required in bubbling beds. In either case, the sorbent is removed with the ash from the bed and sent to disposal.
Post-Combustion Controls
Wet Processes Wet FGD "scrubbers" date back to the 1960s with commercial applications in
Japan and the U.S. in the early 1970s. They represent the predominant SO2 control technology in use today with over 80% of the controlled capacity in the world and the U.S.
In a wet scrubber, the SO2-containing flue gas passes through a vessel or tower where it contacts an alkaline slurry, usually in a counterflow arrangement. The intensive contact between the gas and the liquid droplets ensures rapid and effective reactions that can yield greater than 90 percent SO2 capture. Currently, advanced scrubber designs have eliminated many of the early problems, primarily related to reliability, but have also demonstrated very high SO2 reduction capabilities with some units providing over 95 percent control.
Variations of the basic technology, in addition to equipment improvements made over the years, include reagent and byproduct differences. Limestone, lime, sodium carbonate and even seawater-based processes are commercial. Limestone is by far the most widely used with commercial-grade gypsum (wallboard quality) being produced in the so-called Limestone Forced Oxidation (LSFO) process. The use of other reagents, as mentioned, is driven by site-specific criteria, such as local reagent availability, economics, efficiency targets, etc.
Dry Processes Dry processes include spray dryer absorbers (SDA) and Dry Sorbent Injection
(DSI) technologies. SDA refers to a configuration where the reaction between SO2 and the sorbent takes place in a dedicated reactor or scrubber hence the common reference to "dry scrubber"; conversely, DSI uses the existing boiler/duct system as the "reactor" and several configurations are possible based on the temperature window desired. This can occur at furnace (~2200ºF), economizer (800-900ºF) or duct temperatures (~250ºF). Dry processes are more compatible with low to medium sulfur coals due to limitations in reaction rates and sorbent handling (e.g., atomization). Therefore, high-sulfur applications are not likely. In addition, another common feature among them is the need for particulate control downstream of the sorbent injection. Usually this is accomplished through the use of fabric filters (baghouses) which are, not only efficient collectors of particulates, but also provide additional SO2 removal as the flue gas passes through unreacted sorbent collected on the filters.
DRAFT – Assessment of Control Options for BART-Eligible Sources Page 3-8
3-8
Dry SO2 controls vary significantly in performance, with SDAs being able to achieve about 80 percent removal rates, whereas the various forms of DSI are capable of 40 to 75 percent efficiencies.
NOX Reduction Overview As a result of the complex interactions in the formation of NOX, an equally large
number of approaches to minimize or reduce its emissions into the atmosphere have been and continue to be developed. A relatively simple way of understanding the many technologies available for NOX emission control is to divide them into two major categories: (1) those that minimize the formation of NOX during the combustion process (e.g., smaller quantities of NOX are formed); and (2) those that reduce the amount of NOX formed during combustion prior to exiting the stack into the atmosphere. In industry "language" it is common to refer to the first approach under the "umbrella" of Combustion Modifications whereas technologies in the second category are termed Post-Combustion Controls.
Within each of these categories, several technologies and variations of the same technology exist. Finally, combinations of some of these technologies are not only possible but often desirable as they may produce more effective NOX control than the application of a stand-alone technology.
The following summaries describe the major technologies in each category.
Combustion Modifications Combustion modifications can vary from simple "tuning" or optimization efforts
(similar to a "tune-up" in a car) to the deployment of dedicated technologies such as Low-NOX Burners (LNB), Overfire Air (OFA) or gas recirculation (GR).
Boiler Tuning or Optimization Combustion optimization efforts can lead to improvements in NOX emissions of 5
to 15 percent or even higher in cases where a unit may be badly "de-tuned." It is important to remember that optimization results are truly a function of the "pre-optimization" condition of the power plant or unit (just as the improvement in a car from a "tune-up" depends on how "bad" it was running prior to it), and as such have limited opportunity for drastic emission reductions.
Recent development of "intelligent controls" - software-based systems that "learn" to operate a unit and then maintain its performance during normal operation, are expected help in keeping plants well-tuned, as they gain acceptance and become common features in combustion control systems.
DRAFT – Assessment of Control Options for BART-Eligible Sources Page 3-9
3-9
Low-NOX Burners and Overfire Air LNBs and OFA represent practical approaches to minimizing the formation of
NOX during combustion. Simply, this is accomplished by "controlling" the quantities and the way in which fuel and air are introduced and mixed in the boiler (usually referred to as "fuel or air staging").
These technologies are the most prevalent in the power industry at present. For example, plants that have had to comply with Title IV of the CAAA of 1992 have largely used these technologies for compliance. Competing manufacturers have proprietary designs, geared towards application in different boiler types, as well as reflecting their own design philosophies. LNBs and OFA, which can be used separately or as a system, are capable of NOX reductions of 40 to 60 percent from uncontrolled levels. Again, the type of boiler (e.g., dry versus wet-bottom, wall- versus tangential-fired, NSPS versus pre-NSPS) and the type of fuel (e.g., bituminous versus sub-bituminous) will influence the actual performance achieved.
Furthermore, all combustion modification approaches face a common challenge: that of "striking a balance" between NOX reduction and fuel efficiency. The concern is exemplified by the typically higher carbon levels in the fly ash, which reflect lower efficiency (more fuel needed for the same electrical output), but also the contamination of the fly ash itself possibly making it unsuitable for reutilization (e.g., cement industry).
LNBs/OFA have little or no impact on operating costs (other than by the potential for the above-mentioned efficiency loss).
From a schedule standpoint, LNB/OFA retrofit projects have "lead" times of 10 to 14 weeks and can require outages of 6 to 10 weeks, depending on factors such as scope of work, integration with other plant outage requirements, etc.
Post-Combustion Controls Readily available post-combustion NOX controls are limited to Selective Non-
Catalytic Reduction (SNCR) and Selective Catalytic Reduction (SCR). They are fundamentally similar, in that both use an ammonia-containing reagent to react with the NOX produced in the boiler, and convert it to harmless nitrogen and water, SNCR accomplishes this at higher temperatures (1700ºF-2000ºF) in the upper furnace region of the boiler, while SCR operates at lower temperatures (about 700ºF) and hence needs a catalyst to produce the desired reaction between ammonia and NOX.
While this difference between the two technologies may seem minor, it yields significant difference in performance and costs. This is because in the case of SNCR, the reaction occurs in a somewhat uncontrolled fashion (e.g., the existing upper furnace becomes the "makeshift" reactor which is not what it was originally designed to be), while in the SCR case, a dedicated reactor and the reaction-promoting catalyst ensure a highly controlled, efficient reaction. In practice, this means that SNCR has lower capital costs (no need for a reactor/catalyst); higher operating costs (lower efficiency means that more reagent is needed to accomplish a given reduction in NOX); and finally, has limited NOX reduction capability (typically 30 to 40 percent with some cases achieving
DRAFT – Assessment of Control Options for BART-Eligible Sources Page 3-10
3-10
reductions in the 50 percent range). SCR, on the other hand, offers lower operating costs and the opportunity for very high NOX reductions (up to 90 percent and higher).
Operating costs are driven primarily by the consumption of the chemical reagent – usually urea for SNCR and ammonia for SCR, - which in turn is dependent upon the efficiency of the process (usually referred to in terms of reagent utilization) as well as the initial NOX level and the desired percent reduction. Two additional parameters important in the overall operating costs are: (1) the potential contamination of coal fly ash by ammonia making it unsaleable; and (2) the life cycle of the catalyst due to premature “poisoning.”
Selective Catalytic Reduction The selective catalytic reduction (SCR) process uses a catalyst with ammonia gas
(NH3) to reduce the NO and NO2 in the flue gas to molecular nitrogen and water. The ammonia gas is diluted with air or steam, and this mixture is injected into the flue gas upstream of a metal catalyst bed (composed of vanadium, titanium, platinum, or zeolite). In the reactor, the reduction reactions occur at the catalyst surface. The SCR catalyst bed reactor is usually located between the economizer outlet and air heater inlet. The catalyst modules take up a considerable amount of space; in addition ductwork must be added for the ammonia injection section. There is not always room in an existing boiler to retrofit an SCR system. As a consequence, fan capacity may have to be increased, owing to the incremental pressure drop from the SCR and associated ductwork. In some cases, the boiler must be modified to increase the economizer exit temperature to the minimum and/or the air preheater must be modified. Installation of an SCR on a boiler is site-specific and this results in a range of capital costs for SCR systems on boilers.
Selective Noncatalytic Reduction The selective noncatalytic reduction (SNCR) process is based on the same basic
chemistry of reducing the NO and NO2 in the flue gas to molecular nitrogen and water but does not require the use of a catalyst to prompt these reactions. Instead, the reducing agent is injected into the flue gas stream at a point where the flue gas temperature is within a very specific temperature range. A minimum of 0.5 seconds of residence time is required at a temperature of about 1800oF to achieve high (50 to 60 percent) NOX removal with SNCR. Good dispersion of the reagent in the flue gas is also needed to get good utilization of the reagent and to avoid excessive ammonia slip from the process. The need for a sufficient volume in the boiler at the right temperature window precludes the application of SNCR in all types of industrial boilers.
PM Reduction Overview Particulate matter is generated by a variety of physical and chemical processes. It
is emitted to the atmosphere through combustion, industrial processes, fugitive emissions and natural sources. In combustion processes, the mineral matter (inorganic impurities) is
DRAFT – Assessment of Control Options for BART-Eligible Sources Page 3-11
3-11
converted to ash. The particles suspended in the flue gas are known as fly ash. Fly ash constitutes the primary particulate matter, which enters the particulate control device. Particulate matter is in general referred to as "PM", " PM10", " PM2.5" (particulate matter (PM) with an aerodynamic equivalent diameter of 10 microns or less and 2.5 microns or less, respectively).
Quantity and characteristics of the fly ash and particle size distribution depend on the mineral matter content of the fuel, combustion system, and operating conditions. Combustion technique mainly determines the particle size distribution in the fly ash and hence the final particulate emissions. Common combustion systems in pulverized coal firing include dry bottom, wall (front, opposed) and corner (tangential) burners and wet bottom furnaces. In dry bottom boilers, 10 to 20 percent of the ash is discharged as dry, bottom ash. In wet bottom boilers, 50 to 60 percent of the ash is discharged at the bottom of the boiler as slag. Stokers or grate-fired boilers are used to burn coal, wood and waste. The majority of the ash falls through the grate and is discharged as bottom ash. Mineral composition of the coal and the amount of carbon in the fly ash determine the quantity, resistivity and cohesivity of the fly ash.
PM emissions from other point source processes involve similar phenomena where particulate matter is carried with the flue gas, in suspension to the stack. Hence, the general technologies applicable to one source are typically suitable for the others as well. Factors such as type and quantity of PM, characteristics of the process gas (temperature, moisture, other contaminants) have a major influence on the selection and design of the PM control technology.
PM Control Technologies The following four major types of particulate controls technologies are common
for a variety of applications:
Wet scrubbers Scrubbers work on the principle of rapid mixing and impingement of the
particulate with the liquid droplets and subsequent removal with the liquid waste. For particulate controls the “venturi scrubber” is an effective technology whose performance is directly related to the pressure loss across the venturi section of the scrubber. Venturi scrubbers are effective devices for particulate control. However, for higher collecting efficiencies and a wider range of particulate sizes, higher pressures are required. High-energy scrubbers refer to designs operating at pressure losses of 50 to 70 inches of water. Of course, higher pressure translates to higher energy consumption. Performance of scrubbers varies significantly across particle size range with as little as 50 percent capture for small (<2 microns) sizes to 99 percent for larger (>5 microns) sizes, on a mass basis.
Electrostatic Precipitators (ESP)
DRAFT – Assessment of Control Options for BART-Eligible Sources Page 3-12
3-12
ESP’s operate on the principle of electrophoresis, by imparting a charge to the particulates and collecting them on opposed charged plates. Dry vs. wet refers to whether the gas is water cooled and saturated prior to entering the charged plate area, or is collected dry on the plates. In gases with high moisture content, dry ESPs are not suitable because the wet gas would severely limit the ability to collect the “sticky” particulates from the plates. The wet ESP technology is capable of very high removal efficiencies and is well suited for the wet gas environments. Both types of ESPs are capable of greater than 99 percent removal of particle sizes above 1 micron on a mass basis.
Fabric Filters These are essentially “giant” vacuum cleaners. As in the case of the dry ESP,
Fabric Filters (FFs, sometimes called baghouses) are not well suited for wet gas applications. However FFs are extremely efficient in collecting PM including fine (submicron) size fractions.
Cyclones Cyclones are devices that separate particulates from the gas stream through
aerodynamic/centrifugal forces. However, the technology is only effective in removing larger size particles (greater than about five microns).
3.4. Costs of Technology
3.4.1. NOX Technologies A representative summary of range of costs associated with various technologies
for NOX control in industrial boilers is provided in Table III-4, taken from Reference 4. Capital costs and pollutant removal costs (in $/ton of pollutant removed) are given for three different boiler sizes: 1000, 500, and 100 MMBtu/hr. For each boiler size, the range of costs corresponds to a range of capacities from about low (5 to 14 percent of capacity) to high (86 to 93 percent of capacity). Industrial boilers have a wider range of sizes than EGUs and often operate over a wider range of capacities.
Low-NOX Burners (LNBs) The capital costs for coal burners range from $2,500 to $5,100 per MMBtu/hr of
boiler size. The lower end of this range applies when existing burners are modified instead of replaced to achieve lower NOX. Operating costs are negligible unless increased unburned carbon results in lost revenues from ash sales. An outage is generally required when implementing this technology, but coal-flow sensors and adjustable orifices are best installed when a mill is out of service. Low-NOX Burners provide moderate NOX reductions in the range of 30 to 50 percent at moderate to high cost ($200 to $3,000 per ton of NOX removed). The size of the boiler affects both the capital cost
DRAFT – Assessment of Control Options for BART-Eligible Sources Page 3-13
3-13
and the cost per ton. The combination of LNBs and overfire air (OFA), with or without flue gas recirculation (FGR), is more expensive but NOX reduction is higher, as high as 80 percent for gas-fired boilers. From a schedule standpoint, LBB/OFA retrofit projects can require outages of 3 to 6 weeks, depending on factors such as scope of work, integration with other plant outage requirements, etc.
SNCR The capital costs for SNCR application are low making it an attractive option for
moderate NOX reductions (about 40 percent). As discussed above, the NOX reduction that can be achieved will vary from one boiler to another, and depend on the residence time available in the boiler in which the temperatures fall within the window for the SNCR chemistry to take place. Capital costs range from $2,000 to $4,000 per MMBtu/hr for industrial boilers. Operating costs are driven primarily by the consumption of the chemical reagent – usually urea for SNCR - which in turn is dependent upon the efficiency of the control equipment as well as the initial NOX level and the desired percent reduction. These are typically in the range of $1,300 to $10,000/ton of NOX.
An additional consideration important in the overall operating costs for coal-fired boilers is the potential contamination of fly ash by ammonia, making it potentially unsalable.
SCR Capital costs for retrofit SCR systems to industrial boilers are mostly within the
range of $4,000 to $15,000 per MMBtu/hr. Installation of an SCR on a boiler is site-specific and this results in a range of capital costs for SCR systems on boilers. Coal-fired boilers have higher capital costs. The systems must be larger to allow for flow of fly ash through the catalyst without plugging. Catalyst activity deteriorates faster in coal-fired boilers because of the higher levels of contaminants in the flue gas (like arsenic) and the deposition of ash on the catalyst. Catalysts must be replaced more frequently in coal-fired systems, which increases the operating cost. The lower end of this range applies to retrofits with nominal difficulty. The high end of the range would typically be associated with retrofits having significantly impeded construction access, extensive relocations, and difficult ductwork transitions.
In addition to catalyst replacement costs, operating costs are mainly driven by cost of reagent, energy penalty (pressure loss, ammonia vaporization) and dedicated O and M costs. SCR technology offers very high NOX reductions (80 percent or better); the cost per ton of NOX removed is considerably higher than SNCR, although the overall NOX reduction is higher.
3.4.2. SO2 Technologies Both wet and dry scrubbers are in wide commercial use in the U.S. The capital
costs for new or retrofit wet or dry scrubbers are high when compared to the capital costs
DRAFT – Assessment of Control Options for BART-Eligible Sources Page 3-14
3-14
for NOX and PM controls (Khan, 2004b). Dry sorbent injection (DSI) has lower capital costs than a spray dryer absorber (SDA), although DSI can only achieve about 40 percent SO2 reduction. SDA systems can achieve 90 percent reduction. Capital costs for DSI are in the range of $8,600 to $26,000 per MMBtu/hr, depending on the size of the system and on the sulfur content of the fuel. Capital costs for SDA systems are about double that for DSI systems, but the cost per ton of SO2 removed is similar: $400 to $4,000 per ton of SO2 removed. These costs are higher than the costs for scrubbers on EGUs, which are only $100 to $200 per ton of SO2 removed.
Wet FGD systems also remove 90 percent and higher of the SO2, but the capital cost is about 50% higher than the cost for an SDA system. The costs per ton of SO2 removed are similar to the costs for SDA for coal-fired boilers. Costs per ton of SO2 are estimated to be about twice as high for oil-fired boilers as compared to coal-fired boilers.
3.4.3. PM Technologies As with most control technologies, the costs of PM controls involve both capital
and operating costs. A cost-effectiveness indicator, such as $/ton as is typically used for other technologies (e.g. NOX and SO2), is very difficult to address for generic PM control costs, as the range of PM reductions for different fuels and processes is so wide that cost ranges become useless. An attempt to summarize costs in terms of capital and O&M components is presented below.
Capital While it is customary to indicate capital costs on a $/kW basis for power
generation applications, this is not relevant for non-power applications since no electricity is generated. However, one of the main parameters dictating the “sizing” and hence, the costs of a PM control device, is the quantity of flue gas it must handle. As a result, it is more appropriate to generalize capital costs per actual cubic feet per minute (ACFM) of gas flow and is given on a “$/ACFM” basis. The following values represent typical costs for several of these technologies (these numbers reflect unit sizes ranging from utility-size units up to about 2,000,000 ACFM to smaller process down to about 10,000 ACFM))
• Dry ESPs - $15 - $40/ACFM • Wet ESPs - $15 - $40/ACFM • Reverse Air Fabric Filter - $17 - $40/ACFM • Pulse Jet Fabric Filter - $12 - $40/ACFM • Venturi Scrubber - $5 - $20/ACFM • Cyclone - $1 - $5/ACFM
O&M O&M costs are difficult to generalize for such a variety of technologies and
applications, as they are affected by many parameters that include type of fuel, type of

DRAFT – Assessment of Control Options for BART-Eligible Sources Page 3-15
3-15
process, local ash disposal options, local cost of power, etc. O&M costs include fixed costs (FOM) and variable costs (VOM). The costs provided below are presented in $/year-ACFM and reflect costs for coal-based fuels but should reasonably apply to other sources as well.
Fixed O&M • Dry ESPs - $0.25 - $0.65/yr-ACFM • Wet ESPs - $0.15- $0.50/yr-ACFM • Reverse Air Fabric Filter - $0.35 - $0.75/yr-ACFM • Pulse Jet Fabric Filter - $0.50 - $0.90/yr-ACFM • Venturi Scrubber - $0.25 - $0.65/yr-ACFM • Cyclone – Not applicable
Variable O&M • Dry ESPs - $0.45 - $0.60/yr-ACFM • Wet ESPs - $0.25 - $0.50/yr-ACFM • Reverse Air Fabric Filter - $0.70 - $0.80/yr-ACFM • Pulse Jet Fabric Filter - $.90 - $1.1/yr-ACFM • Venturi Scrubber - $1.2 - $1.8/yr-ACFM • Cyclone – Not applicable
DRAFT – Assessment of Control Options for BART-Eligible Sources Page 3-16
3-16
References Fernando, R., The use of petroleum coke in coal-fired plant. IEA Coal Research: London, 2001. Khan, S. Methodology, Assumptions, and References Preliminary NOX Controls Cost Estimates for Industrial Boilers. http://cascade.epa.gov/RightSite/dk_public_collection_item_detail.htm?ObjectType=dk_docket_item&cid=OAR-2003-0053-0170&ShowList=xreferences&Action=view (Accessed February 19, 2004a). Khan, S. Methodology, Assumptions, and References Preliminary SO2 Controls Cost Estimates For Industrial Boilers. http://cascade.epa.gov/RightSite/dk_public_collection_item_detail.htm?ObjectType=dk_docket_item&cid=OAR-2003-0053-0166&ShowList=xreferences&Action=view (Accessed February 14, 2004b). U.S. Environmental Protection Agency, National Air Pollutant Emissions Trends, 1900-1998, U.S. EPA and the States: Working Together for Cleaner Air; Nizich, S. V.; Pope, A. A.; Driver, L. M., EPA-454/R-00-002 (NTIS PB2000-108054); Office of Air Quality Planning and Standards: Research Triangle Park, NC, March 2000.
U.S. Environmental Protection Agency, National Emission Standards for Hazardous Air Pollutants for Industrial/ Commercial/Institutional Boilers and Process Heaters, http://cascade.epa.gov/RightSite/dk_public_collection_detail.htm?ObjectType=dk_docket_collection&cid=OAR-2002-0058&ShowList=items&Action=view (Accessed February 25, 2004).
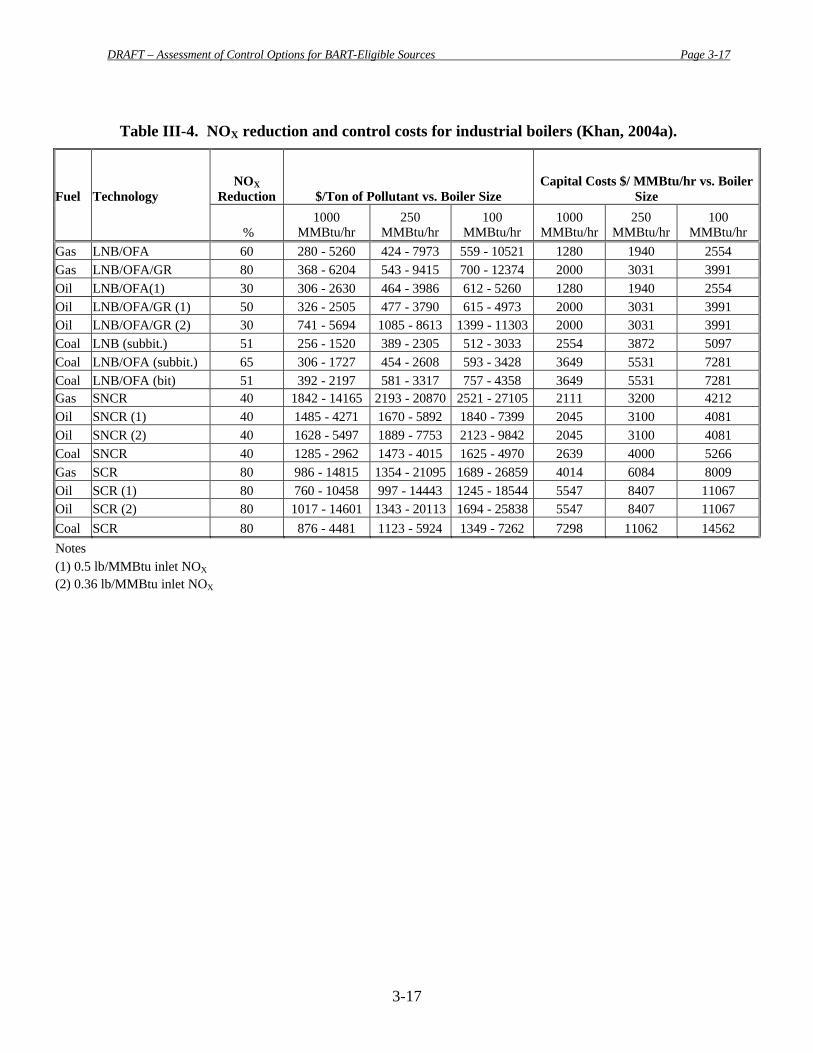
DRAFT – Assessment of Control Options for BART-Eligible Sources Page 3-17
3-17
Table III-4. NOX reduction and control costs for industrial boilers (Khan, 2004a).
Fuel Technology NOX
Reduction $/Ton of Pollutant vs. Boiler Size Capital Costs $/ MMBtu/hr vs. Boiler
Size
% 1000
MMBtu/hr 250
MMBtu/hr 100
MMBtu/hr 1000
MMBtu/hr 250
MMBtu/hr 100
MMBtu/hr Gas LNB/OFA 60 280 - 5260 424 - 7973 559 - 10521 1280 1940 2554 Gas LNB/OFA/GR 80 368 - 6204 543 - 9415 700 - 12374 2000 3031 3991 Oil LNB/OFA(1) 30 306 - 2630 464 - 3986 612 - 5260 1280 1940 2554 Oil LNB/OFA/GR (1) 50 326 - 2505 477 - 3790 615 - 4973 2000 3031 3991 Oil LNB/OFA/GR (2) 30 741 - 5694 1085 - 8613 1399 - 11303 2000 3031 3991 Coal LNB (subbit.) 51 256 - 1520 389 - 2305 512 - 3033 2554 3872 5097 Coal LNB/OFA (subbit.) 65 306 - 1727 454 - 2608 593 - 3428 3649 5531 7281 Coal LNB/OFA (bit) 51 392 - 2197 581 - 3317 757 - 4358 3649 5531 7281 Gas SNCR 40 1842 - 14165 2193 - 20870 2521 - 27105 2111 3200 4212 Oil SNCR (1) 40 1485 - 4271 1670 - 5892 1840 - 7399 2045 3100 4081 Oil SNCR (2) 40 1628 - 5497 1889 - 7753 2123 - 9842 2045 3100 4081 Coal SNCR 40 1285 - 2962 1473 - 4015 1625 - 4970 2639 4000 5266 Gas SCR 80 986 - 14815 1354 - 21095 1689 - 26859 4014 6084 8009 Oil SCR (1) 80 760 - 10458 997 - 14443 1245 - 18544 5547 8407 11067 Oil SCR (2) 80 1017 - 14601 1343 - 20113 1694 - 25838 5547 8407 11067 Coal SCR 80 876 - 4481 1123 - 5924 1349 - 7262 7298 11062 14562 Notes (1) 0.5 lb/MMBtu inlet NOX (2) 0.36 lb/MMBtu inlet NOX
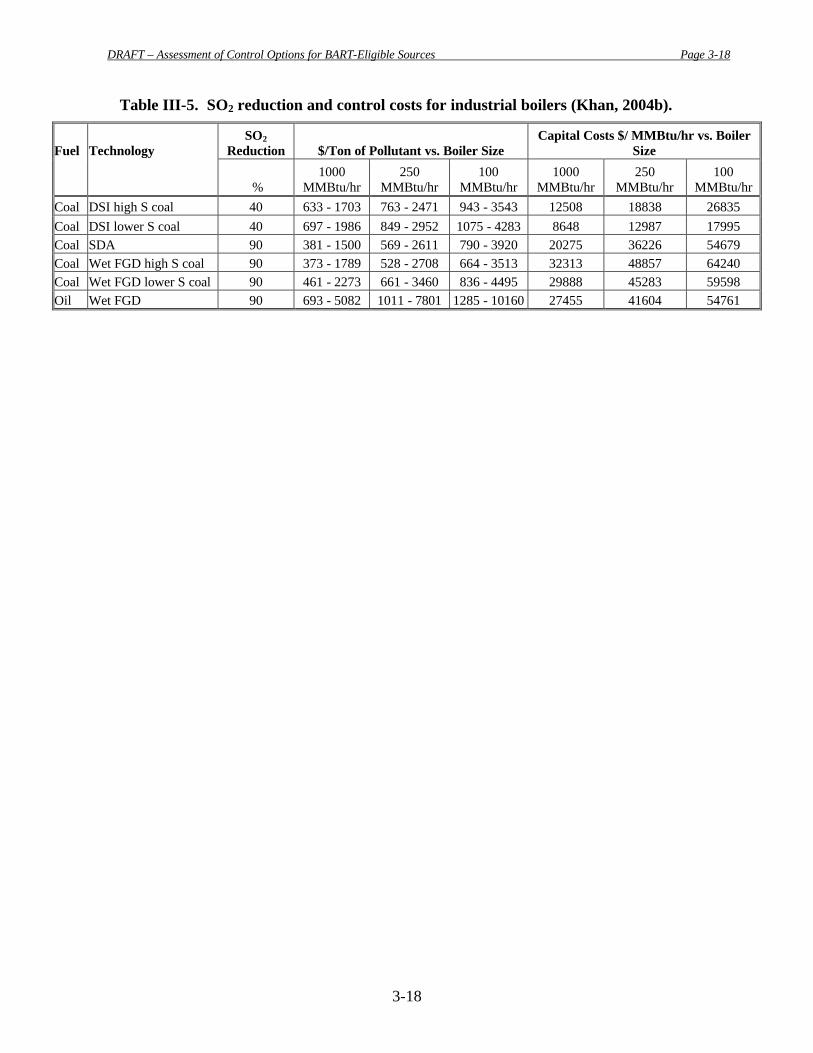
DRAFT – Assessment of Control Options for BART-Eligible Sources Page 3-18
3-18
Table III-5. SO2 reduction and control costs for industrial boilers (Khan, 2004b).
Fuel Technology SO2
Reduction $/Ton of Pollutant vs. Boiler Size Capital Costs $/ MMBtu/hr vs. Boiler
Size
% 1000
MMBtu/hr 250
MMBtu/hr 100
MMBtu/hr 1000
MMBtu/hr 250
MMBtu/hr 100
MMBtu/hr Coal DSI high S coal 40 633 - 1703 763 - 2471 943 - 3543 12508 18838 26835 Coal DSI lower S coal 40 697 - 1986 849 - 2952 1075 - 4283 8648 12987 17995 Coal SDA 90 381 - 1500 569 - 2611 790 - 3920 20275 36226 54679 Coal Wet FGD high S coal 90 373 - 1789 528 - 2708 664 - 3513 32313 48857 64240 Coal Wet FGD lower S coal 90 461 - 2273 661 - 3460 836 - 4495 29888 45283 59598 Oil Wet FGD 90 693 - 5082 1011 - 7801 1285 - 10160 27455 41604 54761
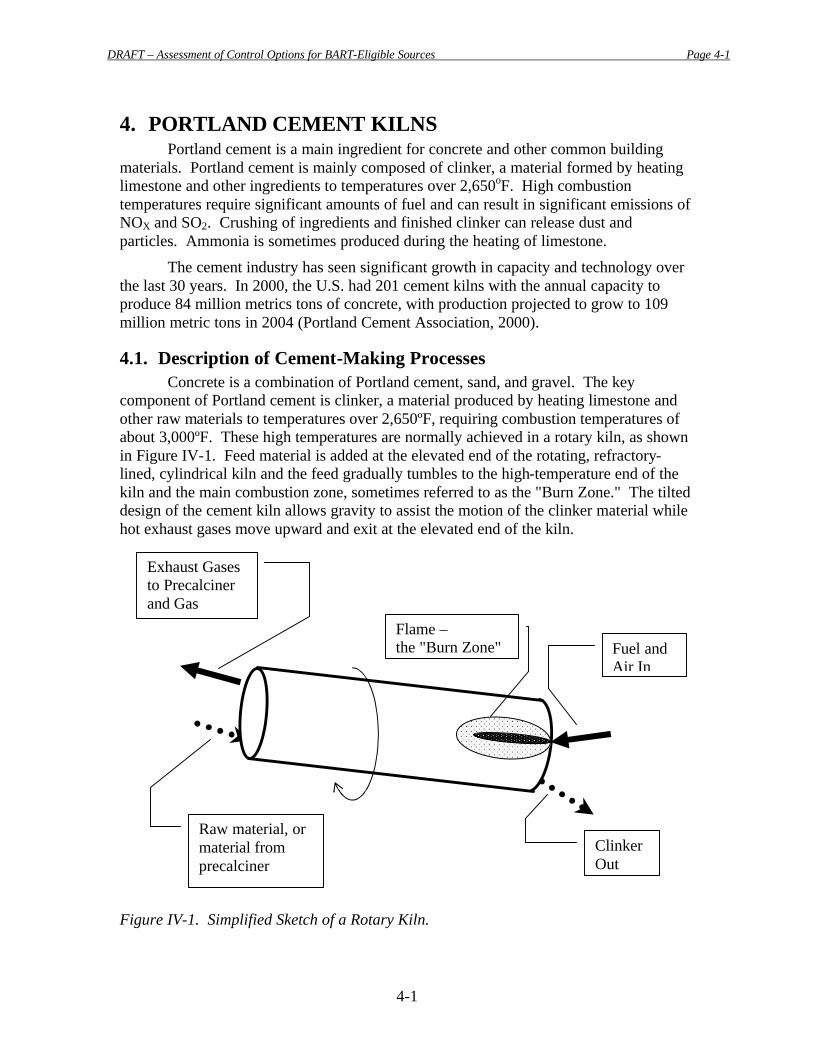
DRAFT – Assessment of Control Options for BART-Eligible Sources Page 4-1
4-1
4. PORTLAND CEMENT KILNS Portland cement is a main ingredient for concrete and other common building
materials. Portland cement is mainly composed of clinker, a material formed by heating limestone and other ingredients to temperatures over 2,650oF. High combustion temperatures require significant amounts of fuel and can result in significant emissions of NOX and SO2. Crushing of ingredients and finished clinker can release dust and particles. Ammonia is sometimes produced during the heating of limestone.
The cement industry has seen significant growth in capacity and technology over the last 30 years. In 2000, the U.S. had 201 cement kilns with the annual capacity to produce 84 million metrics tons of concrete, with production projected to grow to 109 million metric tons in 2004 (Portland Cement Association, 2000).
4.1. Description of Cement-Making Processes Concrete is a combination of Portland cement, sand, and gravel. The key
component of Portland cement is clinker, a material produced by heating limestone and other raw materials to temperatures over 2,650ºF, requiring combustion temperatures of about 3,000ºF. These high temperatures are normally achieved in a rotary kiln, as shown in Figure IV-1. Feed material is added at the elevated end of the rotating, refractory-lined, cylindrical kiln and the feed gradually tumbles to the high-temperature end of the kiln and the main combustion zone, sometimes referred to as the "Burn Zone." The tilted design of the cement kiln allows gravity to assist the motion of the clinker material while hot exhaust gases move upward and exit at the elevated end of the kiln.
Figure IV-1. Simplified Sketch of a Rotary Kiln.
Raw material, or material from precalciner
Clinker Out
Flame – the "Burn Zone"
Exhaust Gases to Precalciner and Gas Cleaning
Fuel and Air In
DRAFT – Assessment of Control Options for BART-Eligible Sources Page 4-2
4-2
Cement kilns fall into four general process categories. Preheater kilns preheat and partially calcine feed material in a series of cyclones or grates prior to admitting the feed to the rotary kiln. This additional heat supplements the heat in the exhaust from the kiln. The calcined feed then enters the rotary kiln at about 1,500ºF to 1,650ºF. Precalciner kilns, on the other hand, utilize a burner in a separate vessel along with a series of cyclones or grates to preheat and calcine the feed. In long kiln systems, the raw feed material is added to the rotary kiln itself as either a powder (“dry”) or a slurry (“wet”). Long wet and long dry kilns do not have preheaters and have much longer rotary kilns, with wet process kilns being the longest - normally several hundred feet long. Preheater and precalciner kilns are more energy efficient than long wet or long dry kilns and typically have greater capacity. A preheater kiln is similar, but fuel is not added and there is no burner on the cyclonic preheater portion. Preheaters could also be replaced with suspension preheaters, but these are less common. If past trends continue, many of the existing long wet kilns and dry kilns are expected to be replaced with precalciner and preheater kilns since precalciner and preheater kilns are more energy efficient and also typically have greater capacity.
Coal is the fuel of choice in cement kilns, primarily because of its low cost, but also because the coal ash contributes somewhat to the product. The current fuel use in cement kilns is about 82% coal; 4% natural gas; and 14% other fuels, mainly combustible waste (industrial waste, tires, sewage sludge, etc.). Fuel nitrogen therefore contributes a small but significant amount to the total NOX for nearly all cement applications (see the section on NOX controls included later).
Recent years have seen Portland cement plant capacity stretched by high demand, making technologies that can increase capacity without increased capital expenditures very attractive. The industry is therefore developing technologies that improve facility’s outputs or reduce their operating costs. Incidentally, some of these technologies also offer the potential to reduce NOX and other emissions.
4.2. Review of BART-Eligible Cement Kilns in the MANE-VU Region NESCAUM’s analysis of BART-eligible sources in the MANE-VU Region6
(NESCAUM, 2004) identified two Portland cement facilities as being eligible for BART. The facilities are shown in Table IV-1. [Editor’s note: Additional facilities are likely to be added when PA and NY inventories are complete]
6 NESCAUM does not believe that there are any BART-eligible sources in the State of Vermont or any of the member Tribes in MANE-VU and thus we have not developed lists for these jurisdictions. In addition, Pennsylvania and the District of Columbia have developed BART-Eligible source lists following their own methodology and any identified sources are contained here and in the final list in Appendix A.
DRAFT – Assessment of Control Options for BART-Eligible Sources Page 4-3
4-3
Table IV-1 BART-Eligible Portland Cement facilities in MANE-VU Region
Facility Kiln type
Capacity, thousands tons/yr
Primary Fuel(s)
St. Lawrence Cement (Hagerstown, MD) Dry 550 Coal
Dragon Products (Thomaston, ME) Wet 392 Coal, petcoke
4.3. Available Control Technologies A number of technologies exist for controlling emissions from cement kilns.
Secondary (post-combustion) control devices can be helpful in reducing emissions, and a variety of these are available. Many technologies and techniques have been developed in response to a specific environmental need and target a specific pollutant, sometimes achieving reduction in other pollutants at the same time. Both secondary controls and process changes are discussed below, grouped by their targeted pollutant. When additional emissions reductions are possible, they are noted with the targeted pollutant. Controls are examined for SO2, NOX, PM, and VOCs.
4.3.1. SO2 Controls In contrast with electric utility boilers, SO2 emissions from rotary kilns producing
cement clinker under oxidizing conditions are nearly independent of fuel sulfur input, but, rather, are closely related to the amount of sulfide (e.g. pyrite) in kiln feed and to the molar ratio of total sulfur to total alkali input to the system. In cement kilns SO2 emissions generally depend on:
• Inherent SO2 removal efficiency of kiln system,
• Form of sulfur (e.g. pyritic) and sulfur concentrations in raw material,
• Molecular ratio between sulfur and alkalis,
• Prevailing conditions (oxidizing or reducing) and their location within kiln, and
• Temperature profile in the kiln system.
Depending upon the level of sulfur in a plant’s limestone compared to the sulfur content of its heating fuel, fuel switching may not be sufficient to reduce SO2 emissions (Tanna and Schipholt, 2004). However, when fuel sulfur levels are high, fuel switching may have a significant benefit of reducing SO2 levels.
In addition to the control techniques used in the electric utility boilers, cement plants may also resort to other basic reductions techniques involving reduction of sulfur input to the kiln, by switching fuels or changing the limestone, or reduction of SO2 emissions from reducing both the sulfur in the sources and using a secondary control device. It is common to achieve some level of SO2 reductions when seeking to reduce another pollutant, usually NOX (technologies targeting another pollutant, but also
DRAFT – Assessment of Control Options for BART-Eligible Sources Page 4-4
4-4
reducing SO2, are described in the NOX and PM sections below). In addition to considering a change in the primary fuel for the kiln, staged combustion with mid-kiln injection of a low-sulfur fuel may be considered for reducing SO2. Including high-pressure air injection at a mid-kiln firing site can limit oxygen in the kiln and suppress SO2 formation (Hansen, 2002). Since these techniques are primarily used to reduce NOX, more information about mid-kiln fuel injection can be found in the section on NOX emissions, but other specific SO2 control technologies applicable to cement kilns are listed below.
Fuel Switching Selecting a fuel with lower sulfur content, a strategy commonly adopted in the
utility boilers, is less effective in cement-making systems, where SO2 emissions are not strongly dependent on fuel sulfur content. Depending upon the level of sulfur in a plant’s limestone compared to the sulfur content of its heating fuel, fuel switching may not be sufficient to reduce SO2 emissions (Tanna and Schipholt, 2004). However, when fuel sulfur levels are high, fuel switching may have a significant benefit in SO2 levels.
Inherent Removal Raw materials, primarily limestone, are preheated in the cement-making process
either in the preheater tower or in the rotary kiln. In either case, the limestone comes in contact with hot combustion exhaust gases. The calcium in the lime reacts with SO2 in the gas, providing in-process removal of sulfur in the kiln system. Removal efficiencies in rotary kiln systems range between 38% and 99% of sulfur input, and 50% to 70% of the remaining SO2 is removed from exhaust gases when passing through an in-line raw mill system (Miller et al., 2001).
Process Alterations The following methods to remove and prevent formation of SO2 by modifying or
controlling conditions in the system are available due to the nature of the Portland cement manufacturing process:
• The oxygen concentration of the exhaust gases can be controlled to ensure sufficient oxygen exists to stabilize alkali and calcium sulfate compounds formed in the process. Concentrations of O2 and, more importantly CO, have a strong influence on the stability of alkali and calcium sulfates in the burning zone. Control of burning- zone O2 and CO concentrations is a widely used industrial practice, and a control technique applicable to all rotary kilns producing cement clinker. The downside of this technique is the more favorable conditions created for generation of NOX in the rotary kiln.
• Burning-zone flame shape can be modified to minimize localized reducing conditions. It has been observed (Hansen, 1986) that flame impingement in the hot zone had a major effect on SO2 emissions from the kiln, even if total oxygen is sufficient to fully combust all fuel. Avoiding flame impingement in the burning zone minimizes SO2 formation. Avoiding flame impingement on the clinker, a technique applicable to all rotary
DRAFT – Assessment of Control Options for BART-Eligible Sources Page 4-5
4-5
kilns producing cement clinker, requires proper solid fuel preparation and proper flame shaping and control.
• Raw materials can be altered to affect the alkali/sulfur molar ratio. SO2 concentrations in kiln exit gases vary with the molar ratio of alkali to sulfur; when alkalis are in excess of sulfur, SO2 emissions are typically low, due to more sulfur being retained in clinker as alkali sulfates. Also, kiln feed containing carbon seems to directly cause SO2 emissions. Changing raw materials may reduce SO2 emissions. Substituting a raw material containing pyritic sulfur or organic sulfur with one containing lesser amounts of these compounds reduces SO2 emissions. Replacement of raw materials, however, is often constrained by economic considerations, while alkali input increase may also be limited by cement product quality specifications on total alkali in cement.
• Alterations to system can influence SO2 emissions. It has been found that an improved distribution of kiln feed may equalize temperatures in bottom stage cyclones and reduce SO2 emission by as much as 20% (Miller, 2001).
Scrubbers
Dry Reagent Injection Steuch and Johansen (1991) found that Ca (OH)2 (hydrated lime) was the most
effective scrubbing agent, particularly when added to the kiln feed and when the exhaust gases were near the dew point. Adding quicklime or hydrated lime into the upper preheater cyclones demonstrated up to 70% removal efficiency (Nielse, 1991).
Several dry reagent systems are available:
• The RMC Pacific process (Sheth, 1991) injects dry Ca(OH)2, and with different stoichiometric ratios (40:1 to 50:1), has obtained efficiencies ranging from 55% to 65%. SO2 removal of 80% was obtained with injection into the roller mill.
• Krupp Polysius Polydesox process uses hydrated lime where SO2 in the raw feed tends to form from pyrites and obtains removal efficiencies of up to 85% (Miller, 2001).
• De-SoX Cyclone, by Fuller Company (Miller, 2001), reduces SO2 emissions in a precalciner kiln by removing a portion of the gases from the precalciner outlet to a cyclone, and from there to the Stage II cyclone where pyritic sulfur in kiln feed is decomposed into SO2. The feed (or “raw meal”), containing freshly produced lime, is discharged into the outlet duct of the second stage (this process is known as hot meal injection). Removal efficiencies of 5 to 30% are claimed.
Lime/Limestone Spray Dryer Absorber
DRAFT – Assessment of Control Options for BART-Eligible Sources Page 4-6
4-6
Design stoichiometric ratios of calcium to sulfur for spray dryer systems in utility boilers are typically between 0.9 and 1.5, with most below 1.0. These SO2 scrubbers are designed for removal efficiencies in excess of 80%.
SO2 reacts with CaCO3, to form CaSO4, a reaction that becomes more complete as the temperature and the fineness of CaCO3 increase. The presence of water vapor also increases conversion.
Most of the spray dryer type SO2 control technologies in the cement industry are applied to preheater or preheater/precalciner kilns. Exhaust gases from long dry kilns are cooled by either spray water introduced into the feed end of the kiln or by dilution air-cooling after the gases leave the kiln. Adding a conditioning tower to replace water sprays or dilution air enables the alkaline slurry system to be used to reduce SO2 emissions (the equivalent of a spray dryer). The range of temperatures for exit gases from long wet kilns does not allow the use of an alkaline slurry spray dryer type scrubber because the addition of the lime slurry may drop the exhaust gases temperature below the acid dew point, creating significant plugging and corrosion problems in the downstream Particulate Control Device (PCD), duct work, and induced draft (ID) fan.
RMC Pacific's Alkaline Slurry Injection System (Sheth, 1991)
RMC Pacific uses a hydrated lime, spray dryer absorber to reduce SO2 emissions. The captured sulfur compounds are returned as a portion of the raw material feedstock to the roller mill, which results in no scrubber effluent or sludge disposal. When SO2 emissions are high and preheater exit gas temperatures are low, sufficient lime slurry cannot be added to reduce SO2 to acceptable levels. With different stoichiometric ratios (40:1 to 50:1), the process has obtained efficiencies ranging from 55% to 65%. SO2 removal of 80% was obtained with injection into the roller mill.
EnviroCare Microfine Lime System (Miller, 2001)
This system uses the existing gas conditioning tower to introduce the scrubbing reagent (water suspension of finely pulverized calcium hydroxide, Ca (OH)2). The small size of the lime particles (3-10 microns) allows the particles to dissolve in water droplets quickly and react with SO2 as it is absorbed into the water droplet. The dried lime continues to react with any remaining SO2 in the downstream kiln system and PCD. Lime injection rate can be optimized through a feedback control loop from an SO2 monitor. EnviroCare claims an SO2 removal efficiency of greater than 90%.
Wet SO2 Scrubbers
Wet scrubbers have been used successfully in the utility industry. Calcium sulfate scaling and cementitious buildup when a wet scrubber is used for acid gas control applied to the exhaust gas from a cement kiln can be avoided if these systems are installed downstream of a high efficiency PCD (e.g., fabric filter). Failure of the PCD can pose difficult problems for a downstream wet scrubber.
DRAFT – Assessment of Control Options for BART-Eligible Sources Page 4-7
4-7
Fuller Company (FLS Miljø) (Miller, 2001)
The Monsanto Dyna Wave wet SO2 scrubber has been installed by the Fuller Company and used on several cement kilns in the U.S. This wet scrubber is designed to remove SO2, halide gases, and some particulate matter.
The scrubber, typically located downstream from the kiln PCD and operated under positive pressure, uses limestone as the absorbent. A slurry (approximately 20% limestone and 80% water) produced in the mixing tank is sprayed countercurrent to the gas flow to cool the gases and react with SO2 forming calcium sulfite (CaSO3) and calcium sulfate (CaSO4), which precipitates. Air is sparged into the sump at the bottom of the tower to oxidize CaSO3 to CaSO4+2H2O (gypsum).
Monsanto EnviroChem DynaWave (Miller, 2001)
DynaWave is a "Reverse Jet" scrubber that can simultaneously accomplish several gas cleaning/process needs: hot gas quenching, particulate removal, and acid gas absorption. The reverse jet is an annular orifice scrubber having one to three large-bore nozzles through which a relatively large volume of scrubbing liquid is injected counter to the gas flow to create a froth zone. The gas collides with the liquid, forcing the liquid radialy outward toward the wall. A standing wave, created at the point the liquid is reversed by the gas, is an extremely turbulent region where the gas absorption and particulate collection occurs.
The system is a tailpipe system generally installed downstream of the PCD, and operates with a saturated gas stream. Therefore, it would likely be applicable to most if not all the cement kilns. A single-stage DynaWave scrubber in full-scale operation has a reported SO2 removal efficiency of about 90%. Monsanto EnviroChem claims that multiple units may be installed in series to achieve whatever removal efficiency is required (e.g., 99.9%).
4.3.2. NOX Controls
The following sections discuss the formation of NOX in cement kilns, potential NOX control techniques, NOX control in the cement industry, and the cost effectiveness of applicable controls.
NOX Formation in Kiln Systems Nitrogen oxides (NOX) are formed during the combustion of fuels in the cement-
making process. In kiln exhaust gases, more than 90% of NOX is NO, with NO2 generally making up the remainder from rotary kilns producing cement clinkers (Gardeik, 1984). There are three different NOX formation mechanisms - thermal, fuel, and feed NOX - typically contributing to NOX emissions.
DRAFT – Assessment of Control Options for BART-Eligible Sources Page 4-8
4-8
Thermal NOX Thermal NOX is formed by oxidation of atmospheric molecular nitrogen at high
temperatures (>1,200 °C). Most NOX formed in the high-temperature environment of the main combustion zone (burning zone) of a kiln is "thermal NOX". Since the flame temperature in a kiln is significantly above that threshold, a considerable amount of thermal NO is generated in the burning zone.
While conditions in the burning zone of a cement kiln favor formation of thermal NOX, those prevalent in secondary combustion zones (e.g. calciners, preheater riser ducts and mid-kiln firing in long wet or dry kilns) with temperatures below 1200°C, are less conducive to significant thermal NOX formation. In that zone, formation of fuel NOX and feed NOx is more prevalent.
The amount of thermal NOX produced is related to fuel type, burning zone temperature, and oxygen content. Therefore, raw materials that are hard to burn (i.e., materials that require more heat input per ton of clinker produced) generate more NOX.
Fuel NOX Fuel NOX is the result of oxidation of nitrogen compounds in fuel. Fuel nitrogen
is only partially converted into NOX during combustion. The amount formed depends on fuel type, precalciner type and precalciner temperature. NOX formed in the secondary combustion zone, primarily fuel NOX (Gardeik, 1984), depends on:
• Nitrogen concentration in the fuel,
• Oxygen concentration in the combustion zone,
• Initial NO concentration in the combustion gas,
• Volatile concentration in the (solid) fuel, and
• Temperature in the secondary combustion zone.
As opposed to the burning zone of the kiln, where higher temperatures result in much higher NOX formation, higher temperatures (up to 1100°C) in the precalciner may actually reduce NOX emissions when a fuel containing nitrogen is used (Nielsen, 1990).
In the design of modern low-NOX calciners, high temperatures and reducing conditions are proven methods for suppressing the formation of fuel NOX generated in the precalciner, and for destroying thermal NOX generated in the burning zone of the rotary kiln (Keefe and Shenk, 2002).
Feed NOX NOX emissions can also result from the oxidation of nitrogen compounds in the
raw material feed to the kiln (feed NOX). The range of nitrogen concentrations in various
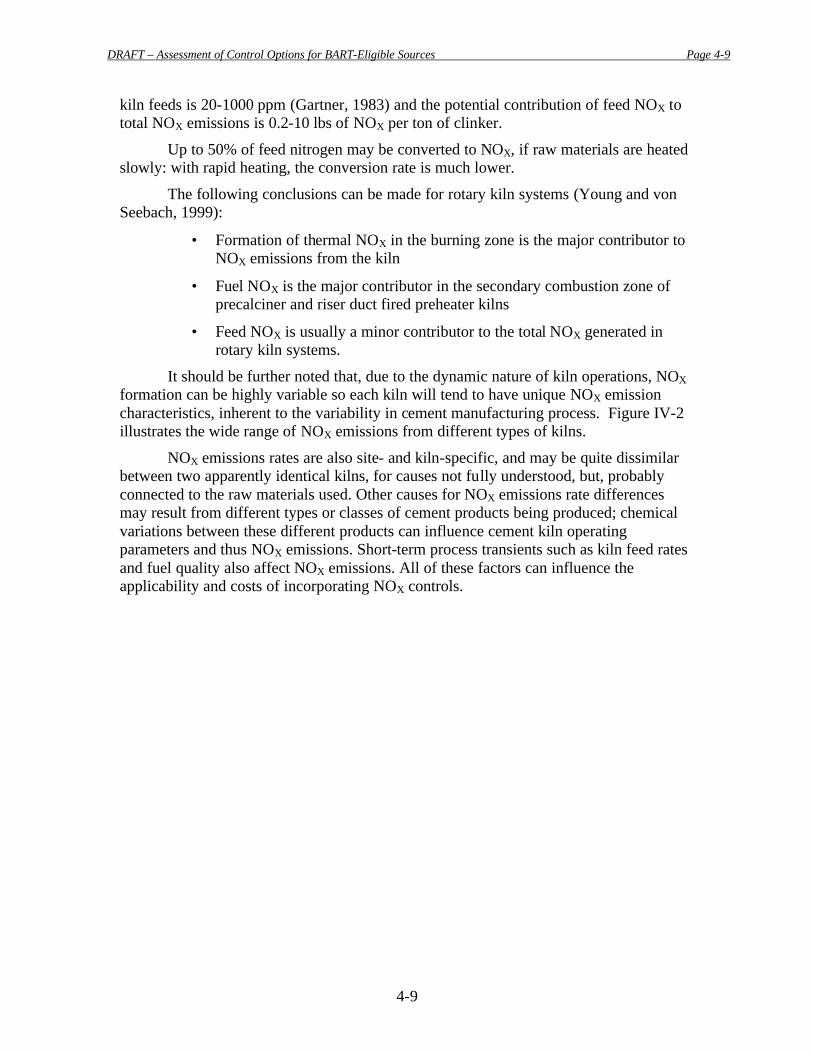
DRAFT – Assessment of Control Options for BART-Eligible Sources Page 4-9
4-9
kiln feeds is 20-1000 ppm (Gartner, 1983) and the potential contribution of feed NOX to total NOX emissions is 0.2-10 lbs of NOX per ton of clinker.
Up to 50% of feed nitrogen may be converted to NOX, if raw materials are heated slowly: with rapid heating, the conversion rate is much lower.
The following conclusions can be made for rotary kiln systems (Young and von Seebach, 1999):
• Formation of thermal NOX in the burning zone is the major contributor to NOX emissions from the kiln
• Fuel NOX is the major contributor in the secondary combustion zone of precalciner and riser duct fired preheater kilns
• Feed NOX is usually a minor contributor to the total NOX generated in rotary kiln systems.
It should be further noted that, due to the dynamic nature of kiln operations, NOX formation can be highly variable so each kiln will tend to have unique NOX emission characteristics, inherent to the variability in cement manufacturing process. Figure IV-2 illustrates the wide range of NOX emissions from different types of kilns.
NOX emissions rates are also site- and kiln-specific, and may be quite dissimilar between two apparently identical kilns, for causes not fully understood, but, probably connected to the raw materials used. Other causes for NOX emissions rate differences may result from different types or classes of cement products being produced; chemical variations between these different products can influence cement kiln operating parameters and thus NOX emissions. Short-term process transients such as kiln feed rates and fuel quality also affect NOX emissions. All of these factors can influence the applicability and costs of incorporating NOX controls.
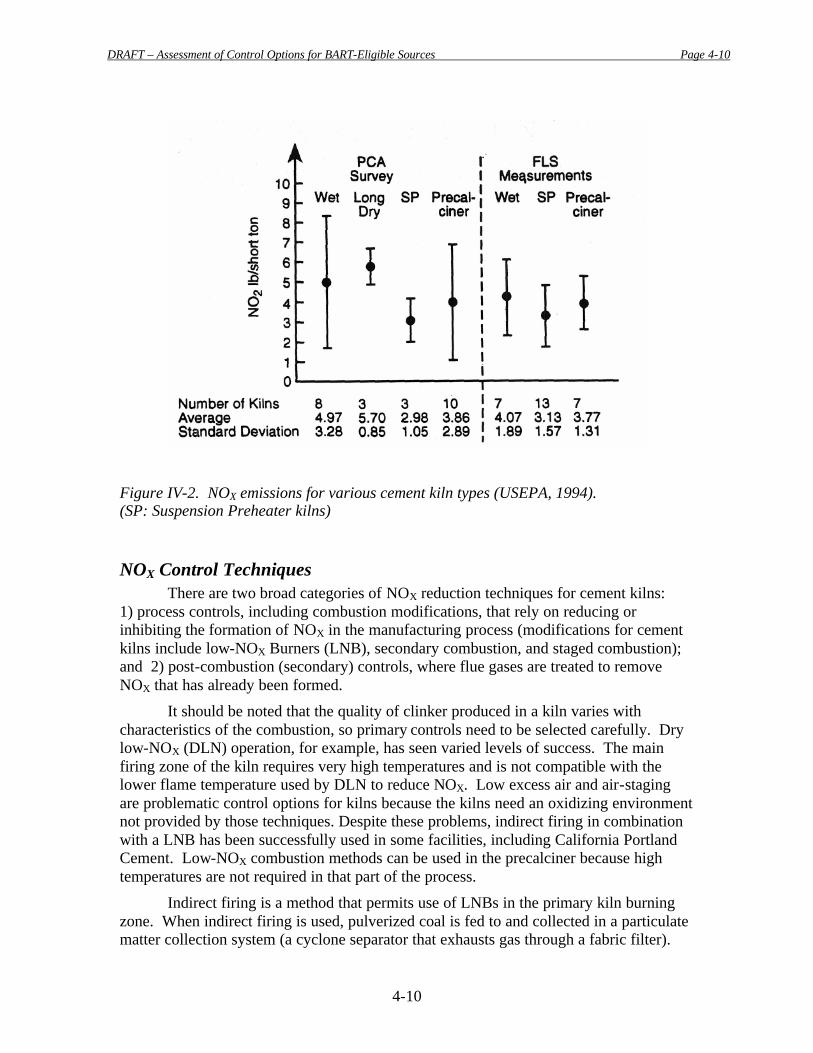
DRAFT – Assessment of Control Options for BART-Eligible Sources Page 4-10
4-10
Figure IV-2. NOX emissions for various cement kiln types (USEPA, 1994). (SP: Suspension Preheater kilns)
NOX Control Techniques There are two broad categories of NOX reduction techniques for cement kilns:
1) process controls, including combustion modifications, that rely on reducing or inhibiting the formation of NOX in the manufacturing process (modifications for cement kilns include low-NOX Burners (LNB), secondary combustion, and staged combustion); and 2) post-combustion (secondary) controls, where flue gases are treated to remove NOX that has already been formed.
It should be noted that the quality of clinker produced in a kiln varies with characteristics of the combustion, so primary controls need to be selected carefully. Dry low-NOX (DLN) operation, for example, has seen varied levels of success. The main firing zone of the kiln requires very high temperatures and is not compatible with the lower flame temperature used by DLN to reduce NOX. Low excess air and air-staging are problematic control options for kilns because the kilns need an oxidizing environment not provided by those techniques. Despite these problems, indirect firing in combination with a LNB has been successfully used in some facilities, including California Portland Cement. Low-NOX combustion methods can be used in the precalciner because high temperatures are not required in that part of the process.
Indirect firing is a method that permits use of LNBs in the primary kiln burning zone. When indirect firing is used, pulverized coal is fed to and collected in a particulate matter collection system (a cyclone separator that exhausts gas through a fabric filter).
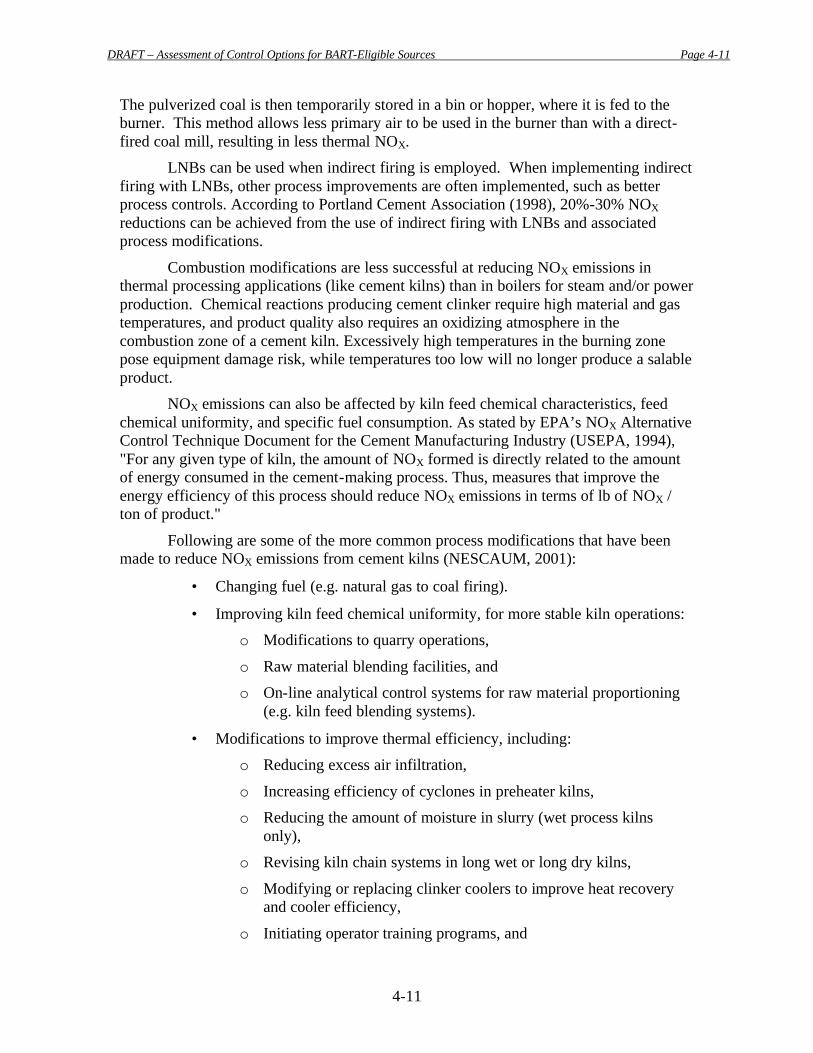
DRAFT – Assessment of Control Options for BART-Eligible Sources Page 4-11
4-11
The pulverized coal is then temporarily stored in a bin or hopper, where it is fed to the burner. This method allows less primary air to be used in the burner than with a direct-fired coal mill, resulting in less thermal NOX.
LNBs can be used when indirect firing is employed. When implementing indirect firing with LNBs, other process improvements are often implemented, such as better process controls. According to Portland Cement Association (1998), 20%-30% NOX reductions can be achieved from the use of indirect firing with LNBs and associated process modifications.
Combustion modifications are less successful at reducing NOX emissions in thermal processing applications (like cement kilns) than in boilers for steam and/or power production. Chemical reactions producing cement clinker require high material and gas temperatures, and product quality also requires an oxidizing atmosphere in the combustion zone of a cement kiln. Excessively high temperatures in the burning zone pose equipment damage risk, while temperatures too low will no longer produce a salable product.
NOX emissions can also be affected by kiln feed chemical characteristics, feed chemical uniformity, and specific fuel consumption. As stated by EPA’s NOX Alternative Control Technique Document for the Cement Manufacturing Industry (USEPA, 1994), "For any given type of kiln, the amount of NOX formed is directly related to the amount of energy consumed in the cement-making process. Thus, measures that improve the energy efficiency of this process should reduce NOX emissions in terms of lb of NOX / ton of product."
Following are some of the more common process modifications that have been made to reduce NOX emissions from cement kilns (NESCAUM, 2001):
• Changing fuel (e.g. natural gas to coal firing).
• Improving kiln feed chemical uniformity, for more stable kiln operations:
o Modifications to quarry operations,
o Raw material blending facilities, and
o On-line analytical control systems for raw material proportioning (e.g. kiln feed blending systems).
• Modifications to improve thermal efficiency, including:
o Reducing excess air infiltration,
o Increasing efficiency of cyclones in preheater kilns,
o Reducing the amount of moisture in slurry (wet process kilns only),
o Revising kiln chain systems in long wet or long dry kilns,
o Modifying or replacing clinker coolers to improve heat recovery and cooler efficiency,
o Initiating operator training programs, and
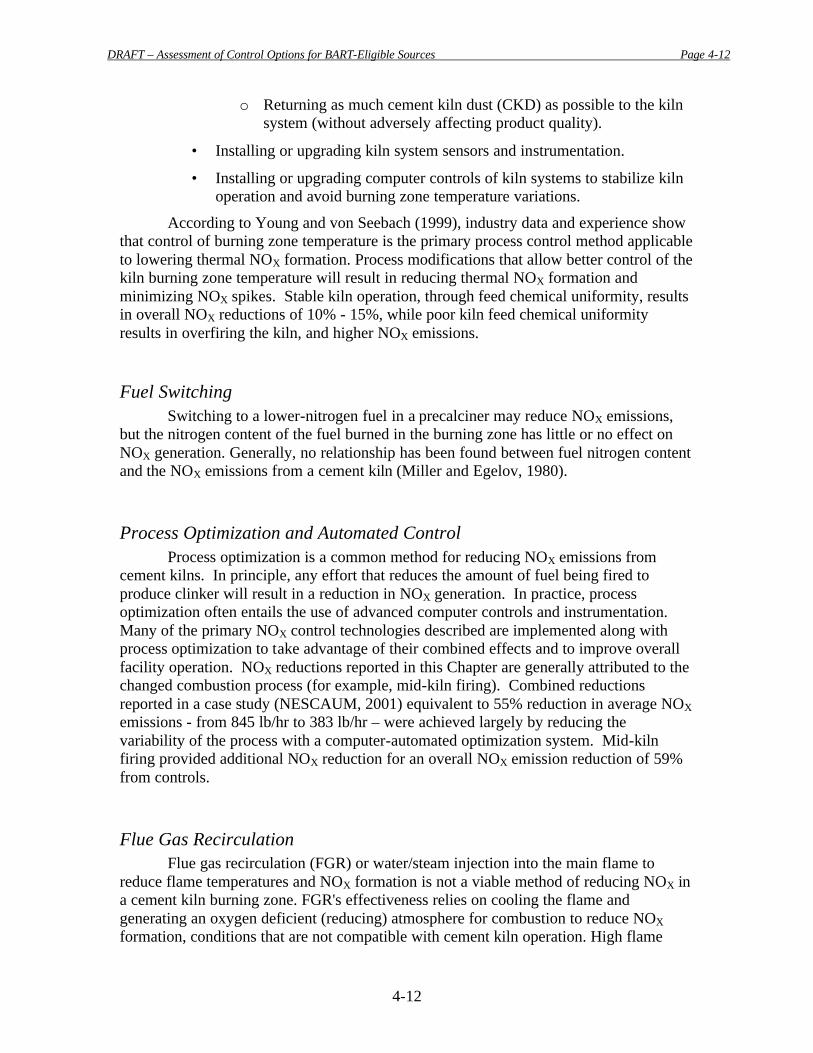
DRAFT – Assessment of Control Options for BART-Eligible Sources Page 4-12
4-12
o Returning as much cement kiln dust (CKD) as possible to the kiln system (without adversely affecting product quality).
• Installing or upgrading kiln system sensors and instrumentation.
• Installing or upgrading computer controls of kiln systems to stabilize kiln operation and avoid burning zone temperature variations.
According to Young and von Seebach (1999), industry data and experience show that control of burning zone temperature is the primary process control method applicable to lowering thermal NOX formation. Process modifications that allow better control of the kiln burning zone temperature will result in reducing thermal NOX formation and minimizing NOX spikes. Stable kiln operation, through feed chemical uniformity, results in overall NOX reductions of 10% - 15%, while poor kiln feed chemical uniformity results in overfiring the kiln, and higher NOX emissions.
Fuel Switching Switching to a lower-nitrogen fuel in a precalciner may reduce NOX emissions,
but the nitrogen content of the fuel burned in the burning zone has little or no effect on NOX generation. Generally, no relationship has been found between fuel nitrogen content and the NOX emissions from a cement kiln (Miller and Egelov, 1980).
Process Optimization and Automated Control Process optimization is a common method for reducing NOX emissions from
cement kilns. In principle, any effort that reduces the amount of fuel being fired to produce clinker will result in a reduction in NOX generation. In practice, process optimization often entails the use of advanced computer controls and instrumentation. Many of the primary NOX control technologies described are implemented along with process optimization to take advantage of their combined effects and to improve overall facility operation. NOX reductions reported in this Chapter are generally attributed to the changed combustion process (for example, mid-kiln firing). Combined reductions reported in a case study (NESCAUM, 2001) equivalent to 55% reduction in average NOX emissions - from 845 lb/hr to 383 lb/hr – were achieved largely by reducing the variability of the process with a computer-automated optimization system. Mid-kiln firing provided additional NOX reduction for an overall NOX emission reduction of 59% from controls.
Flue Gas Recirculation Flue gas recirculation (FGR) or water/steam injection into the main flame to
reduce flame temperatures and NOX formation is not a viable method of reducing NOX in a cement kiln burning zone. FGR's effectiveness relies on cooling the flame and generating an oxygen deficient (reducing) atmosphere for combustion to reduce NOX formation, conditions that are not compatible with cement kiln operation. High flame
DRAFT – Assessment of Control Options for BART-Eligible Sources Page 4-13
4-13
temperature and an oxidizing atmosphere are process requirements to produce a quality clinker product.
Indirect Firing
Conversion from a direct coal firing system to an indirect firing system kiln with a low NOX burner may result in NOX reductions ranging from 0% to about 20% (Kupper et al., 1990; Schrsemli, 1990). Incorrect use of multi-channel (low NOX) burners can increase NOX rather than reduce NOX, and it has been found (Hansen, 1985) that less excess air in the kiln combustion gases results in less NO formation at the same burning zone temperature. NOX reductions of 15% were reported.
Low-NOX Burners LNBs have been successfully used in the primary burn zone and especially in the
precalciner kilns.
Secondary combustion zones have proven effective at reducing NOX emissions in cement kilns. In long kilns, secondary combustion can be partly accomplished by mid-kiln injection of fuel (less than 20% of kiln fuel). NOX emissions are reduced because less fuel is burned in the high temperature environment of the burning zone. Another NOX reducing technique is the use of fuel in the riser duct of preheater kilns, although, because of high prevailing temperatures, such reductions do not always occur. With precalciner kilns, which employ a secondary combustion zone at a much lower temperature than the burning zone, typically 60% of the fuel is burned in the precalciner, with the combustion air coming directly from the clinker cooler, and NOX emissions for these kilns are less than from long wet, long dry, or preheater kiln systems because 60% of the total fuel requirement is burned under lower temperature conditions where negligible amounts of thermal NOX are formed. Furthermore, precalciner kilns have the potential for staged combustion as a NOX control technique. All major equipment suppliers offer "low-NOX” precalciner designs. Fuel burned in a sub-stoichiometric O2 environment creates a strongly reducing atmosphere (relatively high concentrations of CO) that inhibits formation of fuel NOX and destroys a portion of the NOX formed in the kiln burning zone. Additional tertiary combustion air is added later to complete combustion of the fuel.
Staged combustion has become a well-known method for reducing NOX emissions from cement plants, but as NOX and CO emissions limits become more stringent, control via fuel and air staging are coming under reconsideration. Low- NOX calciners combine high temperature combustion and firing under reducing conditions without staging fuel/air.
Low-NOX Precalciners Precalciner kilns can employ LNBs because the temperature in the precalciner can
be low enough to reduce thermal NOX but still be effective in heating the limestone.
DRAFT – Assessment of Control Options for BART-Eligible Sources Page 4-14
4-14
Since roughly 60% of the fuel burned in a precalciner kiln is fired in the precalciner, NOX reductions can be substantial. All new precalciner kilns are equipped with low-NOX burners in the precalciner. Low-NOX precalciners have been shown to reduce NOX by 30%-40% compared to conventional precalciners (Young and von Seebach, 1998). This reduction is from the precalciner-generated NOX, not for the entire kiln.
Several precalciner kilns in the U.S. have recently been retrofitted with these "two-NOX" calciners, and several new kiln lines have been installed using low-NOX precalciner technology. Operating experience indicates a noticeable reduction in NOX per ton of clinker. Industry reports place the NOX reduction potential of staged combustion with a low-NOX precalciner at 30% - 40% when compared to a conventional precalciner kiln system.
Low-NOX precalciner is a proven way to reduce NOX emissions in a cement-making system, and all new cement-making systems are expected to be built with it. They come in two types, “in-line”, commonly used with “normal” fuels (e.g. coal, oil, gas), or “separate-line”, selected for difficult-to-burn fuels (e.g. petroleum coke and anthracite) because its high oxygen atmosphere ensures improved fuel burnout. In-line calciners have lower specific NOX emissions than separate-line ones, but both are capable of meeting current CO/NOX emission standards for any combination of fuel and feed, and both are dependent on the presence of strong reduction and oxidation zones.
CemStar Another approach that has been proven effective in reducing NOX is the patented
CemStar process, originally developed and sold as a method to increase production of clinker from existing kilns while minimizing capital expenditures (Young, 1995; Young, 1996). In the CemStar process, steel or blast furnace slag is introduced as feed material into the kiln. The slag is generally added at the inlet to the rotary kiln (typically after the precalciner or preheater), regardless of kiln type. Unlike normal cement materials, which require significant processing to achieve adequate grain size, the slag need only be crushed to 3/4 to 1-1/2 inch pieces. Minimal processing is necessary because the slag has a low melting temperature and its chemical nature is very similar to the desired clinker. Minimal slag processing permits the equipment for the CemStar to be inexpensive and also reduces energy consumption per unit of clinker produced. Moreover, the CemStar process can be implemented on a kiln quickly with minimal impact to facility operations. The equipment needed is mostly material handling equipment.
The CemStar approach has many advantages: energy input can be reduced, NOX emissions (both lbs/hr and lbs/ton of clinker) can be reduced, and kiln capacity can be increased. Since the steel slag more closely resembles the desired kiln product than do the normal raw materials, kilns with CemStar require less intense firing and allow for a significant reduction of peak burn-zone temperature. The lower burn zone temperature results in less thermal NOX generation. NOX reduction may be expected to be in the range of 20% or more for most kilns. If initial, uncontrolled NOX is high due to thermal NOX, CemStar is likely to provide reductions on the order of 40%-50%. Results of controlled testing of CemStar with baseline conditions resulted in 20% reduction in NOX,
DRAFT – Assessment of Control Options for BART-Eligible Sources Page 4-15
4-15
corresponding with a reduction in average burn-zone temperature of over 200°F. Kiln capacity is increased because each ton of steel slag added to the kiln results in about a ton of additional production, though the precise amount of additional kiln production is dependent on the mineral characteristics of the local raw material. This capacity increase is the reason that many facility owners may initially choose to use CemStar.
TXI, the developer of CemStar, reports that more than 10 plants are currently equipped with the technology. NESCAUM (2001) discusses one application of CemStar on a long-wet process kiln.
Mid-Kiln Firing Mid-kiln firing entails injecting a fuel, usually tires, mid-way through long dry
and long wet kilns. This method has been shown to reduce NOX by about 30% with mid-kiln heat input comprising about 20% of the total heat input (Portland Cement Association, 1998). Results of tests of mid-kiln firing on several kilns are summarized in Table 2 (NESCAUM,2001). The average NOX reduction for these kilns is about 27%. Mid-kiln firing reduces the heat needed, and therefore the thermal NOX produced in the primary burn zone. Fuel NOX will also be reduced because tires and other mid-kiln fuels have low nitrogen contents. Nitrogen content in tires is roughly one fifth that of coal on a mass basis, while heating value on a mass basis is similar (Schrama et al., 1995; Stillwater and Wahlquist, 1998). Coal can be used as a mid-kiln firing fuel, but tires are preferable because they provide a revenue source when kiln operators are paid a tipping fee for taking whole tires. Other revenue-generating fuels could potentially be used as well.
Table IV-2 NOX Reduction at Cement Kilns Using Mid-Kiln Technology (NESCAUM,2001)
Initial NOX (ppm) 936 1372 1342 1359 565 513
Final NOX (ppm) 790 994 600 883 488 456
% Reduction 16% 28% 55% 35% 14% 11%
High-pressure air injection, mentioned in the previous section as a potential
control for SO2 emissions, was primarily developed as a NOX reduction strategy (Hansen, 2002). The technique was designed for use with staged fuel combustion (mid-kiln firing) and mixing air. Mid-kiln firing with mixing air creates stratified thermal layers in the kiln, preventing immediate combustion of the mid-kiln fuel and lowering exit oxygen levels enough that additional CO is produced. Injecting high-pressure air into the kiln provides energy to mix the layers, lowering the main flame temperature and creating a reducing area between the fuel and air injection points, which encourages the destruction of NOX. The technique has been shown to reduce NOX by about 50%, while also reducing CO by 47% and SO2 by 97%.
DRAFT – Assessment of Control Options for BART-Eligible Sources Page 4-16
4-16
Biosolids Injection Biosolids Injection (BSI) is a technology that was developed in the 1990's by the
cement industry for NOX reduction in precalciner and preheater kilns (Biggs, 1995). BSI adds dewatered sewage sludge to the mixing chamber of the precalciner. The dewatered biosolids provide a source of ammonia, producing an SNCR reaction to reduce NOX. At a Mitsubishi Cement Kiln in California, BSI provided about 50% reduction in NOX from about 250 ppm (at 12% oxygen) to 120-125 ppm (at 12% oxygen). BSI has the additional benefit of offering a potential revenue stream because many communities are willing to pay a tipping fee for accepting biosolids. BSI technology may require significant capital equipment expenditures, however. The material handling equipment needed and the moisture in the dewatered biosolids is sufficient to strain the capacity of the fans of many existing facilities. It appears that biosolids injection may be an effective approach for NOX reduction, but it will depend on the specifics of the kiln.
Selective Non-catalytic Reduction Selective Non-catalytic Reduction (SNCR) of NOX is based on the injection of a
reagent, typically NH3 or urea, into the kiln system at a location with an appropriate temperature window 1140 – 2010oF (870 - 1100°C). Some researchers have found that the most effective temperature range is narrower, about 1650 – 2000°F (900 - 1000°C). Temperature is critical because no catalyst is used. At temperatures too high, the reagents will form additional NOX, and, at low temperatures, the reactions proceed slowly and promote the escape of substantial amounts of unreacted ammonia. Under optimum conditions about one mole of NH3 is required to reduce one mole of NOX, but the amount of NH3 is always critically dependent on the reaction temperature. Ammonia slip, which increases rapidly when the molar ratio of NH3 to NO is above one, causes a detached plume and can increase opacity of the stack gases.
Preheater and precalciner kilns operate with kiln gas exit temperatures in the appropriate temperature range. SNCR systems have been used on some preheater kilns in Europe. For wet and long dry kilns, these temperatures exist midway through the kiln. Access to this area is possible only through ports in the kiln shell as used in mid-kiln firing or with scoops used to return cement kiln dust. Ammonia must be added continuously in a fixed molar ratio to NOX in order to be effective and to minimize ammonia slip. Therefore, SNCR is not technically feasible at this time on long wet process or long dry process kilns.
SNCR has been tested in the U.S. on precalciner kilns and is planned for commercial use in other countries (Steuch et al., 1994; Sun et al., 1994). Experience is limited to only a few units worldwide, but some tests have reported significant reductions. Table 3 lists commercial installations of urea SNCR on precalciner kilns and the results of some demonstration programs. Effective operation of SNCR requires availability of a section of kiln with the proper temperature and residence time characteristics for good reduction. The specifics of the installation will determine the level of reduction that is possible. It is unlikely that SNCR can be used effectively on many long kilns (wet or dry) because of the need for access to the proper temperature
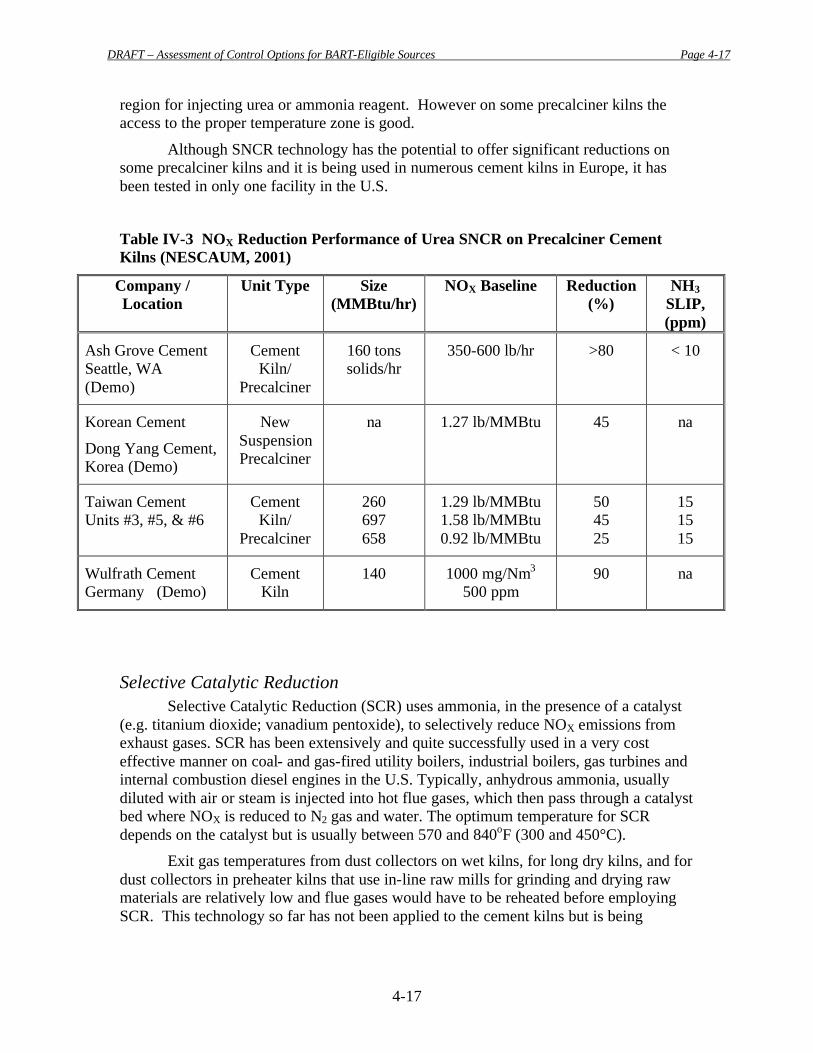
DRAFT – Assessment of Control Options for BART-Eligible Sources Page 4-17
4-17
region for injecting urea or ammonia reagent. However on some precalciner kilns the access to the proper temperature zone is good.
Although SNCR technology has the potential to offer significant reductions on some precalciner kilns and it is being used in numerous cement kilns in Europe, it has been tested in only one facility in the U.S.
Table IV-3 NOX Reduction Performance of Urea SNCR on Precalciner Cement Kilns (NESCAUM, 2001)
Company / Location
Unit Type Size (MMBtu/hr)
NOX Baseline
Reduction (%)
NH3 SLIP, (ppm)
Ash Grove Cement Seattle, WA (Demo)
Cement Kiln/
Precalciner
160 tons solids/hr
350-600 lb/hr >80 < 10
Korean Cement
Dong Yang Cement, Korea (Demo)
New Suspension Precalciner
na 1.27 lb/MMBtu 45 na
Taiwan Cement Units #3, #5, & #6
Cement Kiln/
Precalciner
260 697 658
1.29 lb/MMBtu 1.58 lb/MMBtu 0.92 lb/MMBtu
50 45 25
15 15 15
Wulfrath Cement Germany (Demo)
Cement Kiln
140 1000 mg/Nm3 500 ppm
90 na
Selective Catalytic Reduction Selective Catalytic Reduction (SCR) uses ammonia, in the presence of a catalyst
(e.g. titanium dioxide; vanadium pentoxide), to selectively reduce NOX emissions from exhaust gases. SCR has been extensively and quite successfully used in a very cost effective manner on coal- and gas-fired utility boilers, industrial boilers, gas turbines and internal combustion diesel engines in the U.S. Typically, anhydrous ammonia, usually diluted with air or steam is injected into hot flue gases, which then pass through a catalyst bed where NOX is reduced to N2 gas and water. The optimum temperature for SCR depends on the catalyst but is usually between 570 and 840oF (300 and 450°C).
Exit gas temperatures from dust collectors on wet kilns, for long dry kilns, and for dust collectors in preheater kilns that use in-line raw mills for grinding and drying raw materials are relatively low and flue gases would have to be reheated before employing SCR. This technology so far has not been applied to the cement kilns but is being
DRAFT – Assessment of Control Options for BART-Eligible Sources Page 4-18
4-18
evaluated by some of the state air permitting agencies as Best Available Control Technology (BACT) for some of the new cement kilns being proposed in the U.S.
Combination of Technologies It is not uncommon to combine combustion technologies with post-combustion
technologies for other source types, and this could be done for cement kilns in some cases. It is also possible to combine multiple combustion technologies on cement kilns. For example, one of the case studies in Status Report on NOx Controls for Gas Turbines, Cement Kilns, Industrial Boilers, Internal Combustion Engines; Technologies and Cost Effectiveness (NESCAUM, 2001) combines indirect firing and mid-kiln firing to reduce NOX by a combined amount approaching 50%. It is also reasonable to expect that technologies such as CemStar might be combined with a combustion technology such as mid-kiln firing to provide combined benefits, and it may be feasible to use SNCR or SCR in combination with other controls for cement kilns. The exact amount of reduction will depend upon the regulatory requirements and technical limitations. In some cases the NOX reductions may not be additive.
4.3.3. PM2.5 Controls The particulate matter exiting the kiln system with the exhaust gases is relatively
coarse, with most of the particuate matter having diameters greater than 10 microns, but the concentrations of particles in the exhaust can be several times higher than in a coal-fired power plant. Particulate control devices for cement plants must be able to clean gases with fairly high dust loading.
As is the case for many other industrial sectors, the main control options for fine particles are baghouses (more formally known as Fabric Filters) and electrostatic precipitators (ESPs), described in Section 2.3.2 (EGUs). The following section describes some issues specifically related to cement kilns and the use of these devices, including a new filter system combining a baghouse and an ESP.
Cement kilns primarily utilize baghouses of the reverse-air and pulse-jet types. Both types are usually configured so that the bags can be cleaned during an “off-line” cycle, in which a section of the baghouse is closed off from the main exhaust flow for cleaning. This tends to reduce the need for a high-pressure pulse that causes additional wear on the filtration fabric, allows less time for particles to be collected in the hopper during its brief and frequent use, and requires additional power for operation. The choice between a reverse-air and pulse-jet system is generally made on the basis of the volume of exhaust and production from the kiln. In general, kilns producing less than 1650 stpd (with exhaust volumes below 128,000 acfm) are most efficiently served by a jet-pulse system (D’Lima and Pirwitz, 2000). The decision is more complex for kilns up to 6600 stpd (with exhaust volumes up to 853,000 acfm), for which initial equipment costs are similar but lifetime operation costs are more complicated. D’Lima and Pirwitz (2000) concluded that jet-pulse systems are appropriate for the smallest kilns and reverse-air
DRAFT – Assessment of Control Options for BART-Eligible Sources Page 4-19
4-19
systems are preferred for all larger kilns, even though they may have higher installation costs for kilns of more modest size.
Corrosion in baghouses has been an important topic in the cement kiln control literature (Jansen and Mazeika, 2003; Biege and Shenk, 2001). A 2002 EPA rule [40 CFR Part 63 Subpart LLL (2002)] requires gas temperatures entering the control device not to exceed 400°F (205°C) in order to control dioxin emissions. Water sprays are usually utilized to control exhaust temperature, but adding water vapor to the exhaust stream while lowering exhaust temperature brings the gas near the dew point of some corrosive components. Corrosion issues can be addressed in a number of ways, but all add cost to the use of the control system.
The three components of corrosion are corrosive gases, condensation, and a corrodible surface; reducing any component will reduce corrosion. Corrosive gases can be reduced in a roller mill; this may be one of the most effective methods to reduce corrosion. Many of the gases are absorbed by the feed during the milling process and are therefore not available to form acids in the exhaust. Changing the feed may also reduce some of the acidic gases. Condensation is prevented most easily by keeping the exhaust temperature hot; however, when this is not allowed, it is best to maintain the exhaust temperature as high as possible, preventing drops which may allow acidic condensation. Insulating surfaces and carefully sealing unused sections of the control device can prevent exhaust from leaking into cool areas where it can condense and cause corrosion. Finally, corrosive-resistant materials and acid-resistant coatings can help reduce corrosion in control equipment.
Instead of a baghouse or an ESP, a combined system has become available, utilizing components of both systems. Whereas an in-series, hybrid system has the ESP and baghouse systems in independent compartments, this technology is described as “an ESP in which every other row of discharge electrodes is replaced by a single row of filter bags” (Gebert et al., 2003). In this new system, where the filter bags are directly adjacent or parallel to the ESP electrical field, ESP zones alternate with filter zones, allowing primary collection by the ESP and pre-ionization of the remaining dust for collection on the filter bags. A highly efficient expanded polytetrafluoroethylene (ePTFE) membrane is used as the filter fabric, which can remove an order of magnitude more of fine particulate than ordinary bags. During a pilot system test of a 225 m3/min (9000 acfm) slipstream from a coal-fired power plant in South Dakota, greater than 99.99% removal efficiency was shown. With the ESP fully engaged, bag cleaning was required only every 300 minutes, compared to every fifteen minutes when the ESP was not used. This system has been utilized in full-scale commercial operation at a cement kiln in Italy since September 2002, capturing dust from the cement kiln, raw mill and clicker cooler. Another similar filter is in operation since October 2002 at the coal-fired power plant in South Dakota mentioned above.
The synergy between the two technologies enables operation of the filter bags at high air-to-cloth (A/C) ratios, and, combined with the new compact size for filters, provides the following benefits for a cement plant:
• Ability to reach high control efficiencies in all operation modes,
• Continuous stable operation, and
DRAFT – Assessment of Control Options for BART-Eligible Sources Page 4-20
4-20
• Lower operating costs, due to reduced number of system components.
4.3.4. VOC Controls No controls which specifically targeted VOCs were identified for cement kilns.
4.4. Costs and Availability
4.4.1. Sulfur Dioxide Control The SOx control techniques applicable to the cement industry and the assumed
SOx reductions that the various control technologies can achieve are summarized in Table IV-4.
The achievable SOx reductions vary greatly. Even when the same control technology is applied to kilns of the same type, the removal efficiency will depend on kiln operating parameters, uncontrolled SOx emissions rate, and many other site-specific factors.
Wet-limestone scrubbers and spray dryers can be used as secondary control devices to reduce SO2 emissions from a cement kiln.
Capital and operating costs for spray dryers and wet scrubbers as applied to cement kilns were computed by Young (2002). Both technologies were assumed to be installed after the existing APCD, which would allow the CKD to be recycled back to the kiln. If CKD is not recycled, there is a negative impact on the operating cost of the plant. Table IV-5 summarizes the capital and operating costs in terms of $ per ton of clinker produced for different types of kilns. The capital and operating costs of the spray dryer include a baghouse, new stack and new ID (induced draft) fan. The capital and operating costs for the wet scrubber include new fans and a new stack as well as a new wastewater treatment facility.
Another installation was made in 1998 at Castle Cement’s Ribblesdale (UK) facility (Castle Cement, 2004). Scrubber installation cost £5 million and operational costs are about £750,000 annually. Emissions from one unit were reduced by 90%.
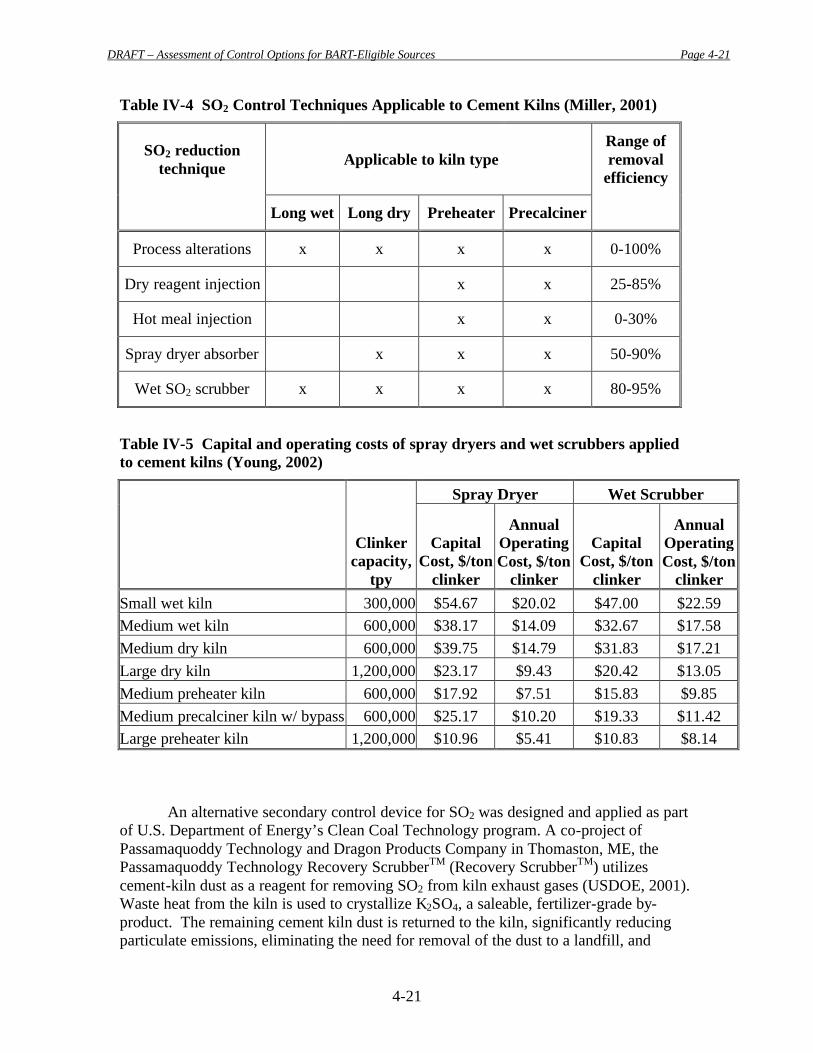
DRAFT – Assessment of Control Options for BART-Eligible Sources Page 4-21
4-21
Table IV-4 SO2 Control Techniques Applicable to Cement Kilns (Miller, 2001)
SO2 reduction technique Applicable to kiln type
Range of removal
efficiency
Long wet Long dry Preheater Precalciner
Process alterations x x x x 0-100%
Dry reagent injection x x 25-85%
Hot meal injection x x 0-30%
Spray dryer absorber x x x 50-90%
Wet SO2 scrubber x x x x 80-95%
Table IV-5 Capital and operating costs of spray dryers and wet scrubbers applied to cement kilns (Young, 2002)
Spray Dryer Wet Scrubber
Clinker capacity,
tpy
Capital Cost, $/ton
clinker
Annual Operating Cost, $/ton
clinker
Capital Cost, $/ton
clinker
Annual Operating Cost, $/ton
clinker Small wet kiln 300,000 $54.67 $20.02 $47.00 $22.59 Medium wet kiln 600,000 $38.17 $14.09 $32.67 $17.58 Medium dry kiln 600,000 $39.75 $14.79 $31.83 $17.21 Large dry kiln 1,200,000 $23.17 $9.43 $20.42 $13.05 Medium preheater kiln 600,000 $17.92 $7.51 $15.83 $9.85 Medium precalciner kiln w/ bypass 600,000 $25.17 $10.20 $19.33 $11.42 Large preheater kiln 1,200,000 $10.96 $5.41 $10.83 $8.14
An alternative secondary control device for SO2 was designed and applied as part of U.S. Department of Energy’s Clean Coal Technology program. A co-project of Passamaquoddy Technology and Dragon Products Company in Thomaston, ME, the Passamaquoddy Technology Recovery ScrubberTM (Recovery ScrubberTM) utilizes cement-kiln dust as a reagent for removing SO2 from kiln exhaust gases (USDOE, 2001). Waste heat from the kiln is used to crystallize K2SO4, a saleable, fertilizer-grade by-product. The remaining cement kiln dust is returned to the kiln, significantly reducing particulate emissions, eliminating the need for removal of the dust to a landfill, and
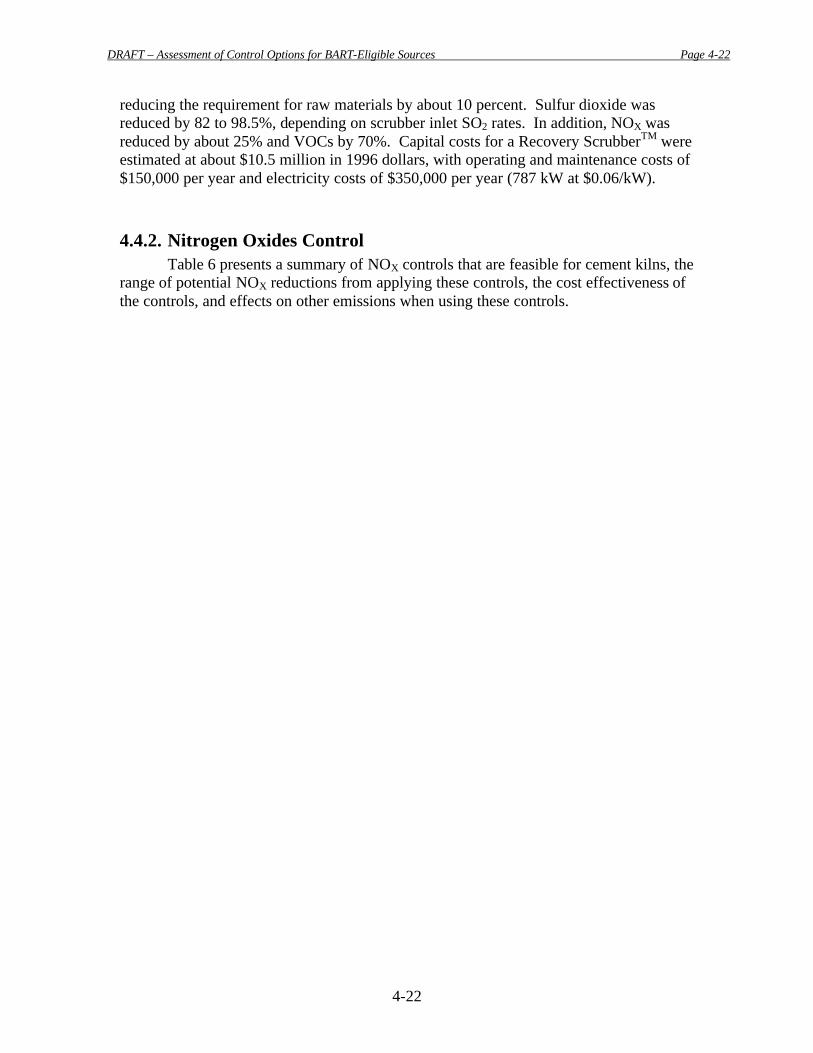
DRAFT – Assessment of Control Options for BART-Eligible Sources Page 4-22
4-22
reducing the requirement for raw materials by about 10 percent. Sulfur dioxide was reduced by 82 to 98.5%, depending on scrubber inlet SO2 rates. In addition, NOX was reduced by about 25% and VOCs by 70%. Capital costs for a Recovery ScrubberTM were estimated at about $10.5 million in 1996 dollars, with operating and maintenance costs of $150,000 per year and electricity costs of $350,000 per year (787 kW at $0.06/kW).
4.4.2. Nitrogen Oxides Control Table 6 presents a summary of NOX controls that are feasible for cement kilns, the
range of potential NOX reductions from applying these controls, the cost effectiveness of the controls, and effects on other emissions when using these controls.
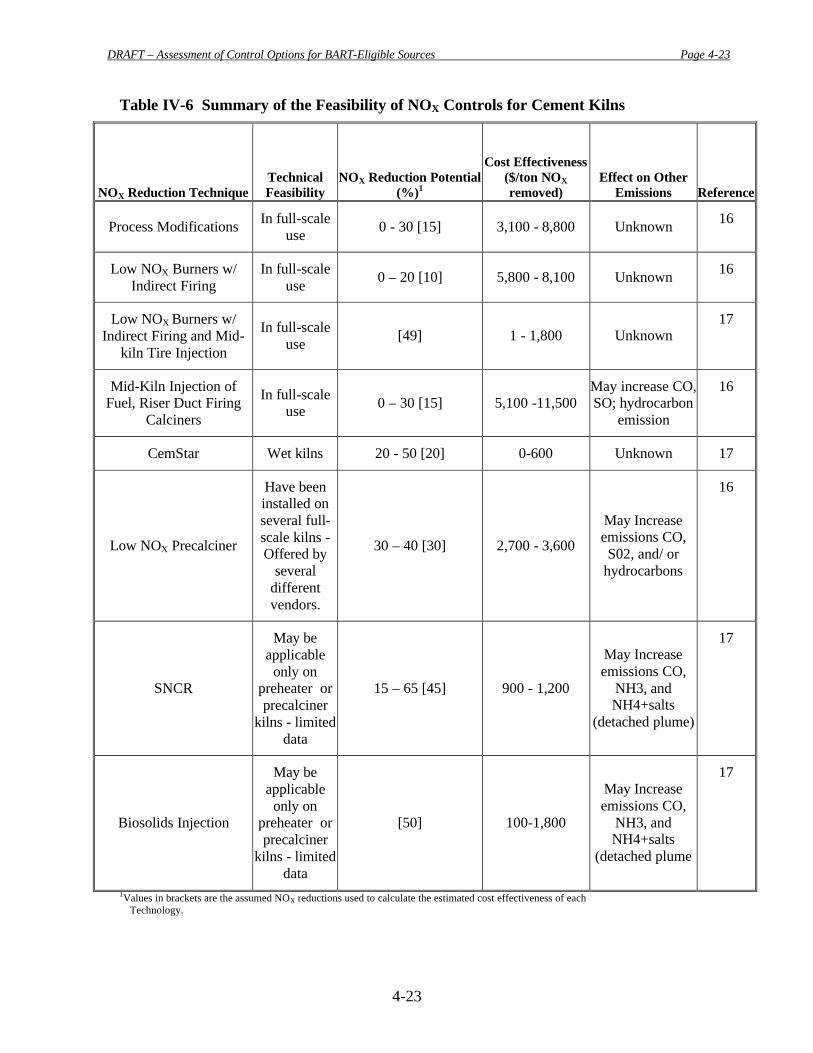
DRAFT – Assessment of Control Options for BART-Eligible Sources Page 4-23
4-23
Table IV-6 Summary of the Feasibility of NOX Controls for Cement Kilns
NOX Reduction Technique Technical Feasibility
NOX Reduction Potential (%)1
Cost Effectiveness ($/ton NOX removed)
Effect on Other Emissions
Reference
Process Modifications In full-scale use 0 - 30 [15] 3,100 - 8,800 Unknown 16
Low NOX Burners w/ Indirect Firing
In full-scale use 0 – 20 [10] 5,800 - 8,100 Unknown 16
Low NOX Burners w/ Indirect Firing and Mid-
kiln Tire Injection
In full-scale use [49] 1 - 1,800 Unknown
17
Mid-Kiln Injection of Fuel, Riser Duct Firing
Calciners
In full-scale use 0 – 30 [15] 5,100 -11,500
May increase CO, SO; hydrocarbon
emission
16
CemStar Wet kilns 20 - 50 [20] 0-600 Unknown 17
Low NOX Precalciner
Have been installed on several full- scale kilns - Offered by
several different vendors.
30 – 40 [30] 2,700 - 3,600
May Increase emissions CO, S02, and/ or
hydrocarbons
16
SNCR
May be applicable
only on preheater or precalciner
kilns - limited data
15 – 65 [45] 900 - 1,200
May Increase emissions CO,
NH3, and NH4+salts
(detached plume)
17
Biosolids Injection
May be applicable
only on preheater or precalciner
kilns - limited data
[50] 100-1,800
May Increase emissions CO,
NH3, and NH4+salts
(detached plume
17
1Values in brackets are the assumed NOX reductions used to calculate the estimated cost effectiveness of each Technology.
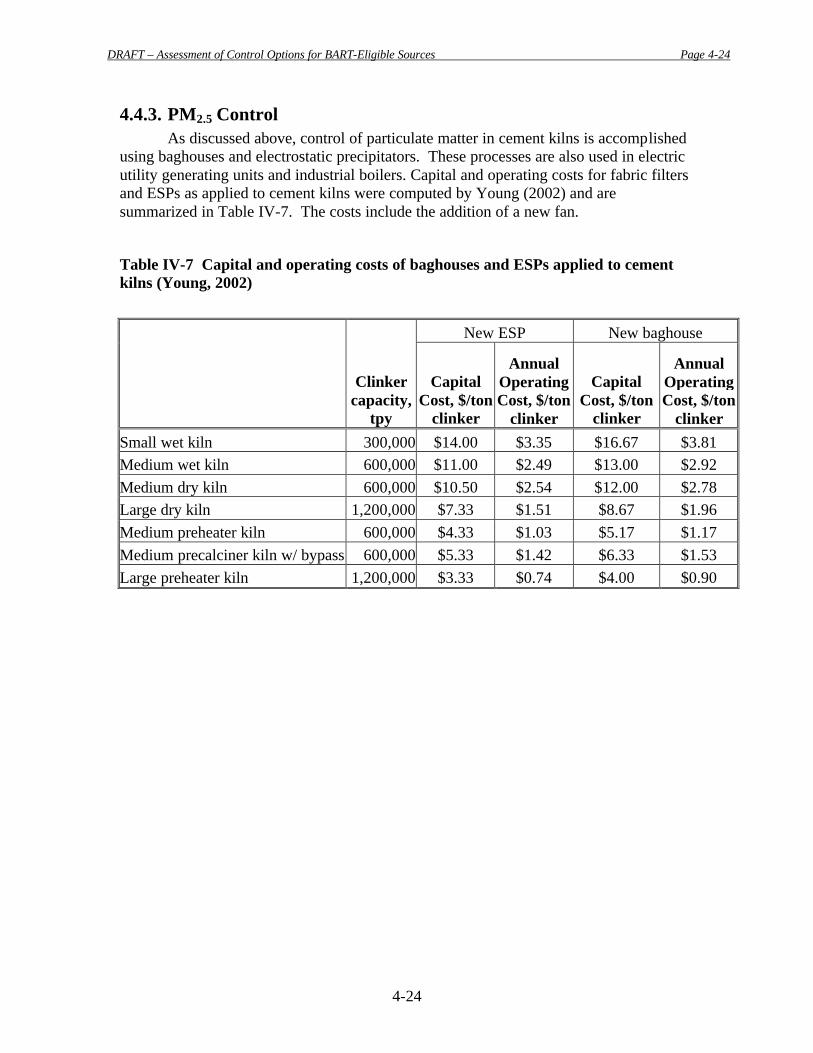
DRAFT – Assessment of Control Options for BART-Eligible Sources Page 4-24
4-24
4.4.3. PM2.5 Control As discussed above, control of particulate matter in cement kilns is accomplished
using baghouses and electrostatic precipitators. These processes are also used in electric utility generating units and industrial boilers. Capital and operating costs for fabric filters and ESPs as applied to cement kilns were computed by Young (2002) and are summarized in Table IV-7. The costs include the addition of a new fan.
Table IV-7 Capital and operating costs of baghouses and ESPs applied to cement kilns (Young, 2002)
New ESP New baghouse
Clinker capacity,
tpy
Capital Cost, $/ton
clinker
Annual Operating Cost, $/ton
clinker
Capital Cost, $/ton
clinker
Annual Operating Cost, $/ton
clinker Small wet kiln 300,000 $14.00 $3.35 $16.67 $3.81 Medium wet kiln 600,000 $11.00 $2.49 $13.00 $2.92 Medium dry kiln 600,000 $10.50 $2.54 $12.00 $2.78 Large dry kiln 1,200,000 $7.33 $1.51 $8.67 $1.96 Medium preheater kiln 600,000 $4.33 $1.03 $5.17 $1.17 Medium precalciner kiln w/ bypass 600,000 $5.33 $1.42 $6.33 $1.53 Large preheater kiln 1,200,000 $3.33 $0.74 $4.00 $0.90
DRAFT – Assessment of Control Options for BART-Eligible Sources Page 4-25
4-25
References
Biege, NW and RE Shenk. “Strategies for Reducing Cement Kiln Baghouse Corrosion Problems.” IEEE/PCA Cement Industry Technical Conference, Vancouver, British Columbia; May 2001. Biggs, H.O. "BioSolids Injection Technology: an Innovation in Cement Kiln NOX Control." Proceedings of the 31st International Cement Seminar. TP 881 .I5, 1995. Castle Cement. “http://www.castlecement.co.uk/env_emm.htm” 5 May 2004. D’Lima, Hector and W. Pirwitz. “Cement Kiln Baghouse: 20 Year Life Cycle Comparison, Jet Pulse vs. Reverse Air.” IEEE-IAS/PCA Cement Industry Technical Conference; Salt Lake City, UT: May 2000. Gardeik. H.O. et.al., Research Institute of the Cement Industry, Dusseldorf; Behavior of nitrogen oxides in rotary kiln plants of the cement industry; Trans of ZKG No.10/84 Gartner, E.M.; Nitrogenous Emissions from Cement Kiln Feeds; Interim Report on Project HM7140-4330; For presentation at Rule 1112 Ad Hoc Committee Meeting South Coast Air Quality Management District, El Monte, CA; June 7, 1983 Jansen, A. and L. Mazeika. “Alternative Solutions for Corrosion Problems in Cement Plant Pollution Control Equipment.” IEEE-IAS/PCA 44th Cement Industry Technical Conference; Dallas, TX: May 2003. Gebert, R., et al. “A New Filter System, Combining a Fabric Filter and Electrostatic Precipitator for Effective Pollution Control Be hind Cement Kilns.” IEEE-IAS/PCA 44th Cement Industry Technical Conference; Dallas, TX: May 2003. Hansen, E.R., The Use of Carbon Monoxide and Other Gases for Process Control; 27th I.E.E.E. Cement Industry Technical Conference Proceedings, May 1985 Hansen, E.R., “Panel Discussion: Reduction of Clinker Alkali and SO2, NOX Emissions from Preheater Kilns,” Portland Cement Association, GTC Fall Meeting, September, 1986. Hansen, Eric R. “Staged Combustion for NOX Reduction Using High Pressure Air Injection” IEEE-IAS/PCA 43rd Cement Industry Technical Conference; Jacksonville, FL: May 2002. Keefe, B.P. and R.E.Shenk, “Staged Combustion for Low-NOX Calciners; Sept, 2002 Kupper, D., et. al.; Trends on Desulfurization and Denitification Techniques in the Cement Industry; Proceeding of Emerging Technologies in Resource Recovery and Emission Reduction in the Cement Industry; Sponsored by the Portland Cement Association, Dallas, TX; September, 1990

DRAFT – Assessment of Control Options for BART-Eligible Sources Page 4-26
4-26
Miller, F.M. and A.H. Egelov; Relationship between cement kiln operation and content of NOX is kiln gases; Zement-Kalk-Gips International; Weisbaden, Germany, 1980. Miller, F.M. et. al. “Formation and Techniques of Control of Sulfur Dioxide and Other Sulfur Compounds in Portland Cement Kiln Systems. Portland Cement Association R&D Serial No. 2460, 2001. NESCAUM, Status Report on NOX Controls for Gas Turbines, Cement Kilns, Industrial Boilers, Internal Combustion Engines; Technologies and Cost Effectiveness, Amar, P., Staudt, J., Northeast States for Coordinated Air Use Management, Boston, MA, January, 2001. NESCAUM, Technical Memorandum #6: Development of a List of BART-Eligible Sources in the MANE-VU Region. Boston, MA; May, 2004. Nielse, P.B., “Die SO2 – und NOX-Emissionen bei modernen Zementdrehofen_Anlagen mit Blick auk=f zukünftige Verordnungen (SO2 and NOX Emissions from Modern Cement Kilns with a View of Future Regulations),” Zement-Kalk-Gips, Vol. 44, No.9, 1991 pp. 449-456 Nielsen, P.B., and O.L.Jepsen; An Overview of the Formation of SOx and NOX in Various Pyroprocessing Systems; Presented at: IEEE Cement Industry Technical Conference, XXXII; Tarpon Springs, FL, May, 1990 Portland Cement Association. "Report on NOX Formation and Variability in Portland Cement Kiln Systems Potential Control Techniques and Their Feasibility and Cost Effectiveness." PCA R&D Serial No. 2227, December, 1998. Portland Cement Association, U.S and Canadian Portland Cement Industry: Plant Information Summary, Data as of December 31, 2000. Schrsemli, Dr. W.; Experience with Measures to Reduce SO2 and NOX Emissions from Cement Kilns In; Proceeding of Emerging Technologies in Resource Recovery and Emissions Reduction in the Cement Industry; Sponsored by the Portland Cement Association, Dallas, TX; September, 1990 Schrama, H., Blumenthal, M., and Weatherhead, E. C. "A Survey of Tire Burning Technology for the Cement Industry." IEEE Cement Industry Technical Conference. San Juan, Puerto Rico: June 4-9, 1995. Sheth, S.H., “SO2 Emissions History and Scrubbing System—Santa Cruz Plant, California, RMC Limestone,” 33rd IEEE Cement Industry Conference, Mexico City, Mexico, May, 1991. Steuch, H.E., and Johansen, V., “Some Facts on SO2 Emissions”, Rock Products, Vol. 94, No.6, 1991, pp.65-71
DRAFT – Assessment of Control Options for BART-Eligible Sources Page 4-27
4-27
Steuch, H.E., Hille, J., Sun, W.H., Bisnett, M.J, and Kirk, D.W. "Reduction of NOX Emissions from a Dry Process Preheater Kiln with Calciner Through the Use of the NOXOUT Process." Portland Cement Association Meeting of the General Technical Committee. Seattle, WA: September 18-21, 1994. Stillwater, M.A. and Wahlquist, C.J. "Building a Successful Tire Derived Fuel Program." Proceedings of the 34th International Cement Seminar. December 6-9, 1998, Salt Lake City, UT. Sun, W.H., Bisnett, M.J., et al. "Reduction of NOX Emissions from Cement Kiln/Calciner through the Use of the NOXOUT Process." International Specialty Conference on Waste Combustion in Boilers and Industrial Furnaces. Air and Waste Management Association. Kansas City, MO: April 21, 1994. Tanna, B. and B. Schipholt. “Waste-Derived Fuel Use in Cement Kilns” ERAtech Group, LLC http://www.eratech.com/papers/wdf.htm, accessed September, 2004. U.S. Department of Energy, NETL. Cement Kiln Flue Gas Recovery Scrubber Project: A DOE Assessment. DOE/NETL-2002/1163, November 2001. U.S. Environmental Protection Agency. “Alternative Control Techniques Document -- NOX Emissions from Cement Manufacturing.” EPA453/R-94-004, March, 1994. Young, R.D. "Method and Apparatus for Using Steel Slag in Cement Clinker Production." U.S. Patent No. 5,421,880. Issued June 6, 1995. Young, R.D. "Method and Apparatus for Using Blast-Furnace Slag in Cement Clinker Production." U.S. Patent No. 5,494,515. Issued February 27, 1996.
Young, G.L. Review of Model Kiln Scenarios and Cost Estimates for Control of Hazardous Air Pollutants. Portland Cement Association, Report SP127, 2002.
Young, G. L. and von Seebach, M. " NOX Variability Emission and Control from Portland Cement Kilns." Proceedings of the 34th International Cement Seminar, December 6-9, 1998 Young, G.L. and von Seebach, Michael; NOX Abatement in Kiln Plants in the Cement Industry, Zement-Kalk-Gips, Volume 52, Number 6, 1999
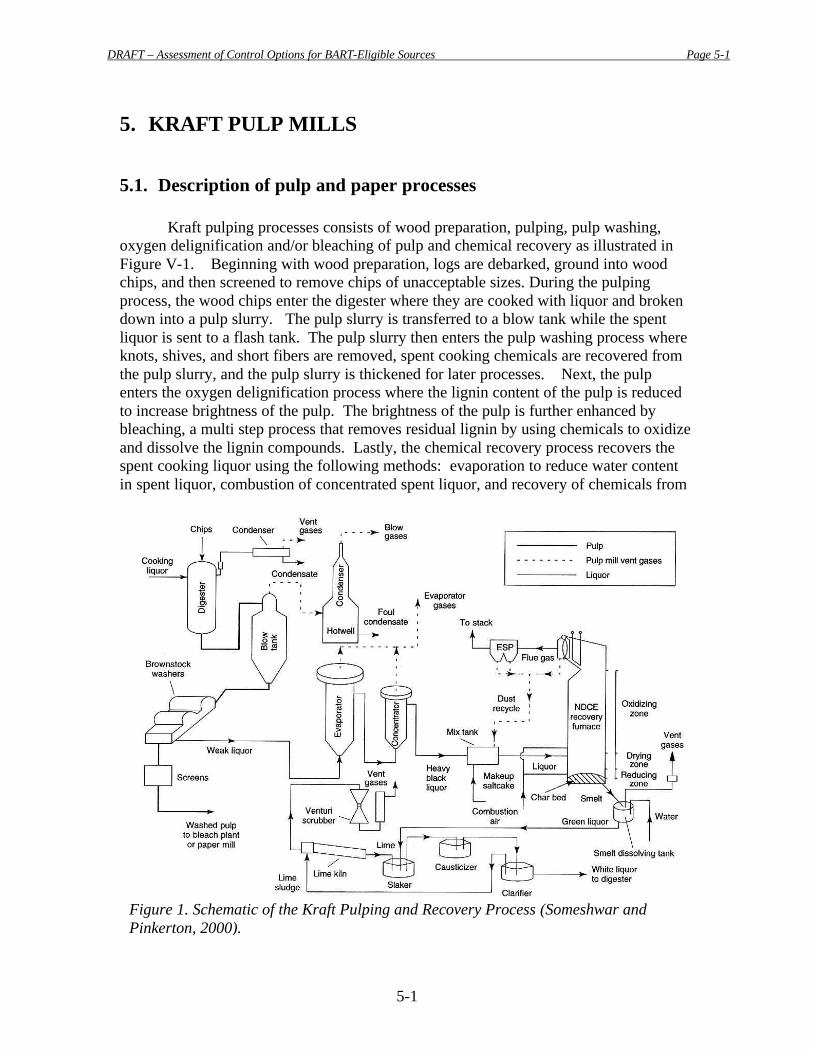
DRAFT – Assessment of Control Options for BART-Eligible Sources Page 5-1
5-1
5. KRAFT PULP MILLS
5.1. Description of pulp and paper processes
Kraft pulping processes consists of wood preparation, pulping, pulp washing, oxygen delignification and/or bleaching of pulp and chemical recovery as illustrated in Figure V-1. Beginning with wood preparation, logs are debarked, ground into wood chips, and then screened to remove chips of unacceptable sizes. During the pulping process, the wood chips enter the digester where they are cooked with liquor and broken down into a pulp slurry. The pulp slurry is transferred to a blow tank while the spent liquor is sent to a flash tank. The pulp slurry then enters the pulp washing process where knots, shives, and short fibers are removed, spent cooking chemicals are recovered from the pulp slurry, and the pulp slurry is thickened for later processes. Next, the pulp enters the oxygen delignification process where the lignin content of the pulp is reduced to increase brightness of the pulp. The brightness of the pulp is further enhanced by bleaching, a multi step process that removes residual lignin by using chemicals to oxidize and dissolve the lignin compounds. Lastly, the chemical recovery process recovers the spent cooking liquor using the following methods: evaporation to reduce water content in spent liquor, combustion of concentrated spent liquor, and recovery of chemicals from
Figure 1. Schematic of the Kraft Pulping and Recovery Process (Someshwar and Pinkerton, 2000).
DRAFT – Assessment of Control Options for BART-Eligible Sources Page 5-2
5-2
combustion products. The regeneration of lime, which is used for recovering sodium, is an additional step of the kraft chemical recovery process not found in the acid sulfite, mechanical, or semi chemical processes.
Acid Sulfite and semi chemical processes are very similar to the kraft process, however, the acid sulfite process differs from the kraft process in the type of cooking liquor used and the semi chemical process differs from the kraft process in the use of lower temperatures, more dilute cooking liquor or shorter cooking time, and mechanical disintegration. Mechanical pulping uses high-energy refining systems to produce pulp from chips and bleaching agents are used to decolorize lignin instead of removing lignin. (Someshwar and Pinkerton, 2000; Pinkerton, 2000).
5.2. Review of BART-Eligible Pulp and Paper facilities in the MANE-VU Region
There are 10 facilities with BART-Eligible industrial boilers in the MANE-VU region. Table III-2 contains a list of these sources based on a previous NESCAUM report (2003) and follow-up review by state permitting authorities. 7 [Editor’s note: additional facilities may be added after NY and PA have completed their inventory].
Table V-1 BART-eligible pulp and paper facilities.
State Company/Facility City/Town Category
Maryland WESTVACO FINE PAPERS Luke kraft pulp Maine Domtar - Pulp & Paper Baileyville kraft pulp Maine Fort James - OldTown Old Town kraft pulp Maine IP Androscoggin Jay kraft pulp
Maine Lincoln Pulp and Paper Lincoln kraft pulp
Maine Madison Paper Madison kraft pulp
Maine Mead WestVaco Rumford kraft pulp
Maine SD Warren - Somerset Skowhegan kraft pulp
Maine SD Warren Co. Westbrook kraft pulp
New Hampshire Pulp & Paper Mills (33007-00001-11) Berlin kraft pulp
5.3. Available Control Technologies The pulp and paper production, consisting of chemical, mechanical, and semi
chemical processes, has a number of potential sources of SOx, NOX, particulates, and VOC emissions (Pinkerton, 2000). The major chemical wood pulping processes are kraft, acid sulfite, and semi chemical pulping. Kraft pulping accounts for 80% of the
7 NESCAUM does not believe that there are any BART-eligible sources in the State of Vermont or any of the member Tribes in MANE-VU and thus we have not developed lists for these jurisdictions. In addition, Pennsylvania and the District of Columbia have developed BART-Eligible source lists following their own methodology and any identified sources are contained here and in the final list in Appendix A.
DRAFT – Assessment of Control Options for BART-Eligible Sources Page 5-3
5-3
pulp produced in the U.S, mechanical and semi chemical pulping, for 10% and 6%, respectively and sulfite or soda chemical process accounts for the remaining pulping capacity (Someshwar and Pinkerton, 2000).
A variety of technologies exist for controlling emissions from pulp and paper facilities. Secondary control devices can be helpful in reducing emissions, and a number of them are available. Many facilities have found that significant emissions reductions can be achieved through process changes at the facility. Both secondary controls and process changes are discussed below, grouped by their targeted pollutant. When additional emissions reductions are possible, they are noted with the main (or targeted) pollutant. The sections below will describe the potential sources of significant SOx, NOX, particulates, and VOC emissions in the major pulping processes and the measures used to control them.
5.3.1. SO2 Controls In a kraft mill, SO2 is a product of the incineration of black liquor in the recovery
furnace; black liquor is made up of 3-5% sulfur by weight of dissolved solids. The majority of the sulfur exits the furnace in the smelt; however, typically less than 1% can be emitted as a gas or particulate, resulting in average SO2 concentrations of 0-500 ppm in stack gases. Recovery furnace SO2 emissions are a function of liquor properties such as sulfidity (sulfur-to-sodium ratio), heating value, and solids content; combustion air and liquor firing patterns; furnace design features; furnace load; auxiliary fuel use; and stack gas oxygen content. To reduce SO2 emissions from the recovery furnace, the temperature in the lower furnace must be uniform. This has been achieved by optimizing liquor and combustion air properties and firing patterns. Reducing liquor sulfidity has also been used as a control strategy for SO2 emissions. Flue gas desulfurization as an effective control strategy is uncertain due to the mostly low and unpredictable levels of SO2 emitted.
In a lime kiln, SO2 is produced from the combustion of fuel oil or non condensable gases (NCG). On average, lime kiln SO2 emissions are very low due to the capture of SO2 from the alkaline material inside the kiln and the venturi scrubber usually installed immediately after the kiln.
In semi chemical processes, only neutral sulfite semi chemical (NSSC) pulping emits SO2 emissions as a result of the combustion of sulfur-containing semi chemical spent liquor in a fluidized bed combustor. Limited data shows an SO2 emission factor for a fluidized bed combustor burning NSSC liquor as 1 lb SO2/a.d. ton of pulp.
A major source of SO2 in acid sulfite processes is from the digester and blow tank areas. During a hot blow, significant quantities of SO2 can be released into the blow gases ranging from 10 to 70 pounds per ton of pulp. Using an alkaline solution to scrub the blow gases, 97% of SO2 can be recovered and returned to the acid-preparation system. While this approach is possible using sodium and NH3 bases, magnesium and calcium bases need slurry scrubbers deemed less practical. Scrubbing becomes
DRAFT – Assessment of Control Options for BART-Eligible Sources Page 5-4
5-4
impractical when during a cold blow, only 4 to 20 pounds SO2 per pulp are released into the blow gases.
SO2 can also escape from acid bisulfite washers and screens which can result in uncontrolled emissions generally ranging from 1 to 4 lb SO2/ton pulp but can get up to as much as 16 lb SO2/ton pulp. The gases emitted from the washers and screens are hooded and then directed to a direct-contact scrubber where the SO2 is scrubbed from the gases. (Someshwar and Pinkerton, 2000; Pinkerton, 2000).
5.3.2. NOX Controls NOX is produced from the incineration of black liquor in the kraft recovery
furnace with black liquor containing 0.05% to 0.25% nitrogen by weight of liquor solids content. Normal NOX emissions from kraft recovery furnaces are less than 100 ppm. NOX emissions are mainly a result of fuel NOX since the maximum temperature in the recovery furnace is approximately 2400oF and the temperature required for formation of significant amounts of thermal NOX is greater than 2800oF. NCASI studied the origins of NOX emissions from kraft recovery furnaces and concluded that the two most important factors affecting NOX emissions, in order of importance, were the black liquor nitrogen content and excess oxygen in the zone where most of the liquor combustion occurs. Since it is difficult to alter the liquor N content, the best approach to minimizing NOX in recovery furnaces is staged-air combustion. Currently, most recovery furnaces already optimally use staged combustion and emit less than 100ppm NOX.
NOX is produced in the kraft lime kiln from the combustion of fossil fuels, such as natural gas and residual fuel oil. Due to the design of the lime kiln, SNCRs and SCRs are not viable NOX reduction techniques. Installing Low-NOX Burners (LNBs) is also not a practical NOX reduction technique according to a BACT analysis conducted on a new lime kiln in 1997. The installation of LNBs had a negative influence on the efficiency, energy usage, and calcining capacity of the lime kiln. Hence, like the recovery furnace, combustion modification such as decreasing excess air is the best way to reduce NOX emissions. However, since the mechanisms of NOX formation and NOX emission reduction are not completely known, NOX reduction strategies should be considered on a case-by-case basis.
Some NOX emissions result from the burning of stripper off gases (SOGs) with significant ammonia and methanol content and combustion of NCG in the kiln, thermal oxidizer, or boiler. When SOGs containing methanol and ammonia are incinerated, the ammonia could potentially oxidize to produce NOX. NH3 will oxidize to NOX when injected into gases above 2000oF to 2200oF, reduce NOX to N2 when gas temperatures range from about 1600oF to 2200oF, and remain as NH3 in temperatures below 1600oF. However, the degree of NH3 conversion to NOX and the expected baseline level of NOX emissions from pulp process units burning NCG and SOGs are not known.
NOX emissions are expected during combustion of liquor in recovery furnaces for both semi chemical and acid sulfite processes. (Pinkerton, 2000; Someshwar, 1999).
DRAFT – Assessment of Control Options for BART-Eligible Sources Page 5-5
5-5
5.3.3. PM2.5 Controls Measurable particulate emissions sources in a kraft mill are recovery furnaces,
smelt-dissolving tanks, and lime kilns while fugitive particulate emissions sources are coal piles, paved and unpaved roads, bulk material handling such as lime, limestone, or starch, and wood handling. Particulate emissions from recovery furnaces are controlled by ESPs with particulate removal efficiencies of 90% in older units and 99% in newer units. Demister pads, packed towers or venturi scrubbers are used to achieve particulate emissions control in smelt-dissolving tanks, and venturi scrubbers and ESPs are used for control in lime kilns. Controlled mean particulate emission factors from smelt dissolving tank vents and kraft lime kilns are 0.13 lb/ton black liquor solids and 1.82 lb/ton of reburned lime product, respectively. Fugitive emissions are controlled by wetting; using chemical agents, building enclosures, and windscreens; paving or wetting roads; and modifying handling equipment.
In semi chemical processes, particulate emissions only become a concern when recovery furnaces are used. These emissions are controlled by using ESPs, wet ESPs or venturi scrubbers. In acid sulfite processes, the burning of both ammonium and magnesium base liquors will result in the release of particulate matter in the form of ammonium salts and magnesium oxide, respectively. The ammonium salts are removed when the flue gas exiting the absorption unit enters a series of fabric mesh pads called “candles.” The magnesium oxide particulates are removed using multiple cyclones, a series of 3 or 4 packed tower absorbers, and in addition, some mills use venturi scrubbers and/or a SO2 scrubber. Controlled particulate emissions of ammonia salt particles are <0.5 gr/dscf @ 8% O2 and for magnesium oxide, 0.05 to 0.1 gr/dscf correct to 8% O2. (Someshwar and Pinkerton, 2000).
5.3.4. VOC Controls VOC emissions sources in a kraft mill are recovery furnaces and lime kilns. In a
recovery furnace, VOC emissions are produced from incomplete combustion or from the contact between the black liquor and flue gas where volatile material from the liquor can transfer to the flue gas. Factors that affect recovery-furnace VOC emissions are the level of excess air used and the degree of mixing achieved within the furnace. To lower recovery-furnace VOC emissions, the residence time, oxygen content, temperature, and level of turbulence in the furnace combustion zone must be increased. However, increasing these parameters will increase NOX emissions.
VOC emissions from lime kilns are also produced from incomplete combustion. In addition, VOC emissions can be a result of VOCs entering the kiln with the liquid part of the lime mud and VOCs being present in the scrubber makeup water. These additional VOCs are then emitted into the flue gas when the lime mud is heated and the flue gas exiting the kiln strips the VOCs from the scrubber makeup water. VOC emissions from lime kilns tend to be small with the majority being methanol.
In semi chemical and acid sulfite pulping processes, VOC emissions are a product of incomplete combustion in the fluidized bed combustor or in a specialized recovery furnace. Semi chemical VOCs can also be introduced into the flue gas if flue gas comes
DRAFT – Assessment of Control Options for BART-Eligible Sources Page 5-6
5-6
in contact with pulping liquor. VOCs from both semi chemical and acid sulfite pulping processes can enter the flue gas if the flue gas is able to strip organic compounds such as methanol from the scrubber makeup water. According to limited data, VOC emissions can significantly be reduced by improving combustion conditions and controlling liquor firing.
Mechanical pulping processes only emit VOCs and steam into the atmosphere. The VOCs in wood are emitted with the steam when wood undergoes cooking and refining processes. A study conducted by NCASI showed that VOC emission rates were proportional to steam emission rates. This data suggests that in order to decrease VOC emissions, the temperature in the exhaust gas must be reduced below the boiling point of water. (Someshwar and Pinkerton, 2000; Pinkerton, 2000).
5.4. Costs and availability According to John Pinkerton at the National Council of the Paper Industry for Air and Stream Improvement (NCASI) (Pinkerton, 2004), pulp and paper industry representatives have been working with several engineering firms to evaluate to assess the costs and emission reduction potential of SO2 and NOX control technologies. Many of the technologies are candidates for evaluation as part of a BART site-specific engineering analysis. Particulate matter (PM) control strategies were also evaluated by NASCI. Information on applicability and cost is summarized in Tables V-2 through V-5 for Kraft Recovery Furnaces, Lime Kilns, Wood and Wood/Gas boilers and Wood/Coal and Wood/Oil boilers.
Information on the technologies referenced in the tables was collected by NASCI based on installation of processes or evaluation of these processes as part of New Source Review (NSR) Best Available Control Technology (BACT) or Lowest Achievable Emission Rate (LAER) analyses, state Reasonably Available Control Technology (RACT) evaluations in ozone non-attainment areas, the USEPA NOX SIP Call, or for other reasons.
The range in costs and emission reductions reflects the fact that site-specific factors play a critical role in determining how cost-effective various technologies will be in practice. Existing facilities do not always adequate or appropriate space for new equipment, which adds uncertainty to the capital and operating cost, as well at to the achievable emissions reductions. Hence the range of costs cited in the tables.
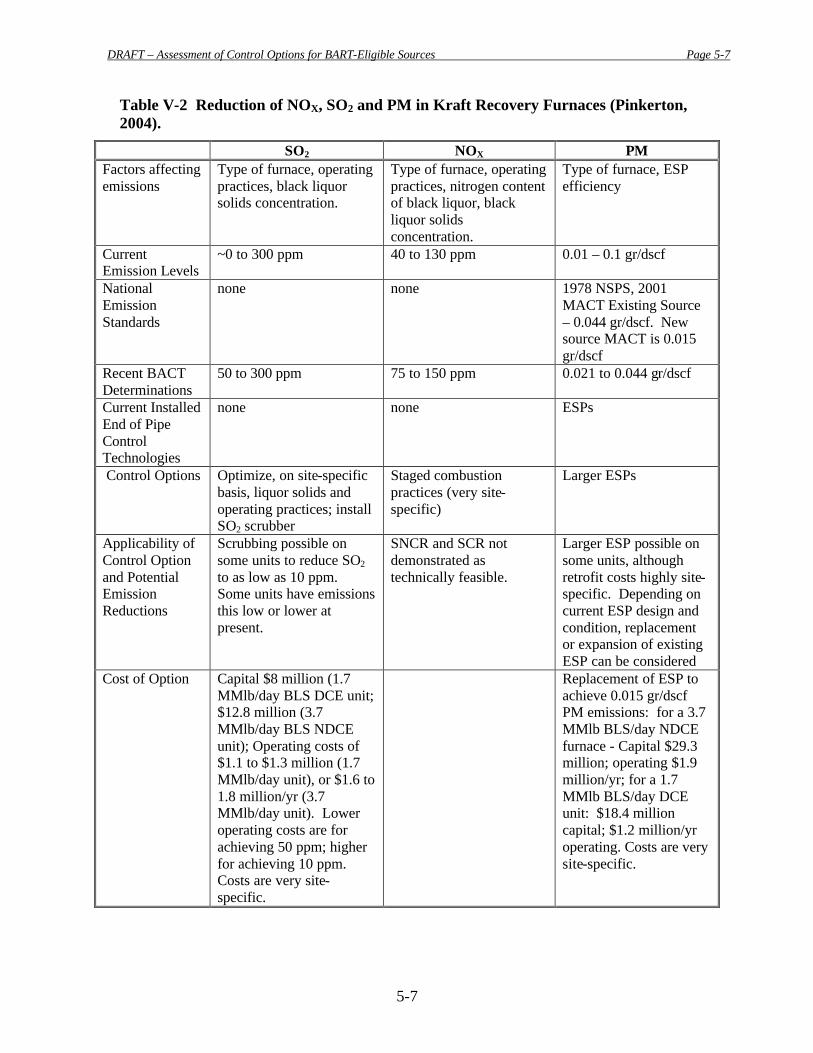
DRAFT – Assessment of Control Options for BART-Eligible Sources Page 5-7
5-7
Table V-2 Reduction of NOX, SO2 and PM in Kraft Recovery Furnaces (Pinkerton, 2004).
SO2 NOX PM Factors affecting emissions
Type of furnace, operating practices, black liquor solids concentration.
Type of furnace, operating practices, nitrogen content of black liquor, black liquor solids concentration.
Type of furnace, ESP efficiency
Current Emission Levels
~0 to 300 ppm 40 to 130 ppm 0.01 – 0.1 gr/dscf
National Emission Standards
none none 1978 NSPS, 2001 MACT Existing Source – 0.044 gr/dscf. New source MACT is 0.015 gr/dscf
Recent BACT Determinations
50 to 300 ppm 75 to 150 ppm 0.021 to 0.044 gr/dscf
Current Installed End of Pipe Control Technologies
none none ESPs
Control Options Optimize, on site-specific basis, liquor solids and operating practices; install SO2 scrubber
Staged combustion practices (very site-specific)
Larger ESPs
Applicability of Control Option and Potential Emission Reductions
Scrubbing possible on some units to reduce SO2 to as low as 10 ppm. Some units have emissions this low or lower at present.
SNCR and SCR not demonstrated as technically feasible.
Larger ESP possible on some units, although retrofit costs highly site-specific. Depending on current ESP design and condition, replacement or expansion of existing ESP can be considered
Cost of Option Capital $8 million (1.7 MMlb/day BLS DCE unit; $12.8 million (3.7 MMlb/day BLS NDCE unit); Operating costs of $1.1 to $1.3 million (1.7 MMlb/day unit), or $1.6 to 1.8 million/yr (3.7 MMlb/day unit). Lower operating costs are for achieving 50 ppm; higher for achieving 10 ppm. Costs are very site-specific.
Replacement of ESP to achieve 0.015 gr/dscf PM emissions: for a 3.7 MMlb BLS/day NDCE furnace - Capital $29.3 million; operating $1.9 million/yr; for a 1.7 MMlb BLS/day DCE unit: $18.4 million capital; $1.2 million/yr operating. Costs are very site-specific.
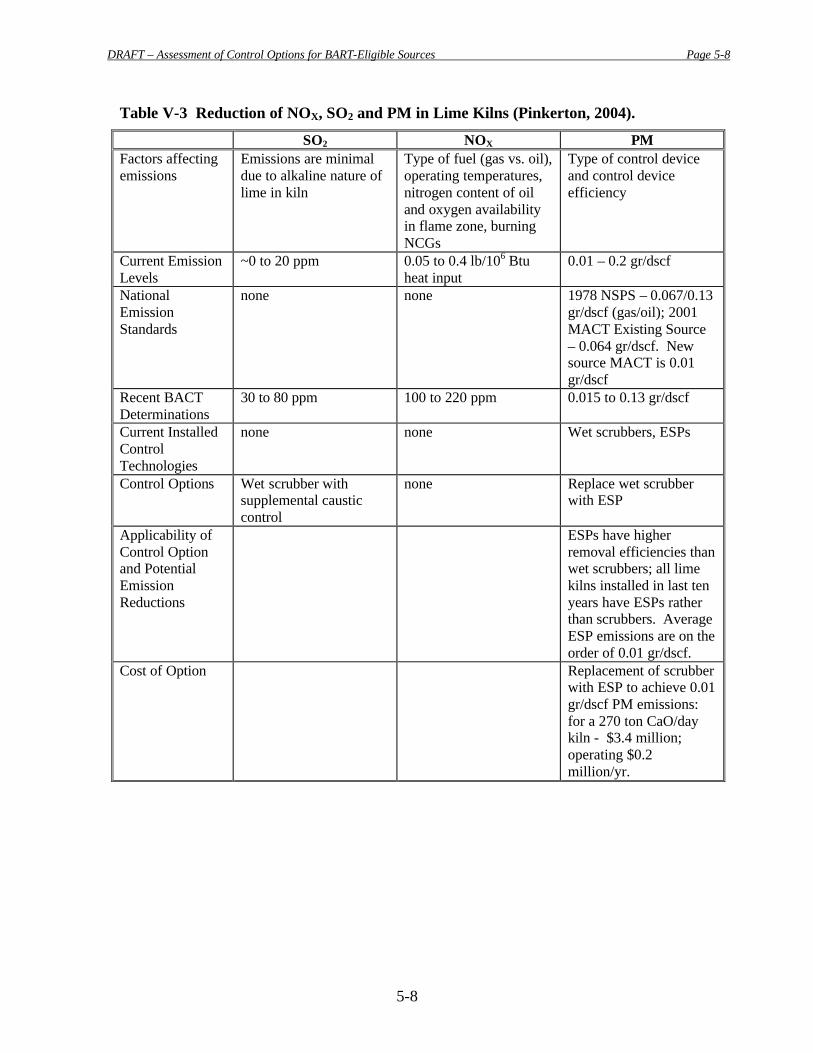
DRAFT – Assessment of Control Options for BART-Eligible Sources Page 5-8
5-8
Table V-3 Reduction of NOX, SO2 and PM in Lime Kilns (Pinkerton, 2004).
SO2 NOX PM Factors affecting emissions
Emissions are minimal due to alkaline nature of lime in kiln
Type of fuel (gas vs. oil), operating temperatures, nitrogen content of oil and oxygen availability in flame zone, burning NCGs
Type of control device and control device efficiency
Current Emission Levels
~0 to 20 ppm 0.05 to 0.4 lb/106 Btu heat input
0.01 – 0.2 gr/dscf
National Emission Standards
none none 1978 NSPS – 0.067/0.13 gr/dscf (gas/oil); 2001 MACT Existing Source – 0.064 gr/dscf. New source MACT is 0.01 gr/dscf
Recent BACT Determinations
30 to 80 ppm 100 to 220 ppm 0.015 to 0.13 gr/dscf
Current Installed Control Technologies
none none Wet scrubbers, ESPs
Control Options Wet scrubber with supplemental caustic control
none Replace wet scrubber with ESP
Applicability of Control Option and Potential Emission Reductions
ESPs have higher removal efficiencies than wet scrubbers; all lime kilns installed in last ten years have ESPs rather than scrubbers. Average ESP emissions are on the order of 0.01 gr/dscf.
Cost of Option Replacement of scrubber with ESP to achieve 0.01 gr/dscf PM emissions: for a 270 ton CaO/day kiln - $3.4 million; operating $0.2 million/yr.
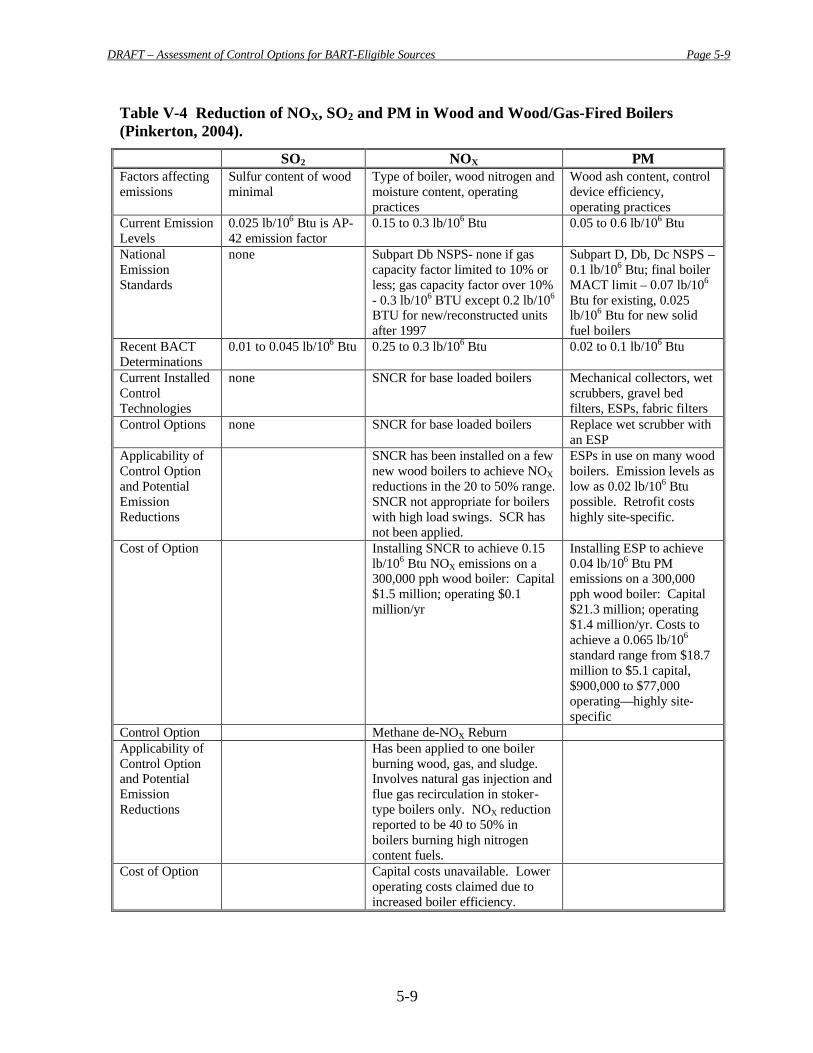
DRAFT – Assessment of Control Options for BART-Eligible Sources Page 5-9
5-9
Table V-4 Reduction of NOX, SO2 and PM in Wood and Wood/Gas-Fired Boilers (Pinkerton, 2004).
SO2 NOX PM Factors affecting emissions
Sulfur content of wood minimal
Type of boiler, wood nitrogen and moisture content, operating practices
Wood ash content, control device efficiency, operating practices
Current Emission Levels
0.025 lb/106 Btu is AP-42 emission factor
0.15 to 0.3 lb/106 Btu 0.05 to 0.6 lb/106 Btu
National Emission Standards
none Subpart Db NSPS- none if gas capacity factor limited to 10% or less; gas capacity factor over 10% - 0.3 lb/106 BTU except 0.2 lb/106 BTU for new/reconstructed units after 1997
Subpart D, Db, Dc NSPS – 0.1 lb/106 Btu; final boiler MACT limit – 0.07 lb/106 Btu for existing, 0.025 lb/106 Btu for new solid fuel boilers
Recent BACT Determinations
0.01 to 0.045 lb/106 Btu 0.25 to 0.3 lb/106 Btu 0.02 to 0.1 lb/106 Btu
Current Installed Control Technologies
none SNCR for base loaded boilers Mechanical collectors, wet scrubbers, gravel bed filters, ESPs, fabric filters
Control Options none SNCR for base loaded boilers Replace wet scrubber with an ESP
Applicability of Control Option and Potential Emission Reductions
SNCR has been installed on a few new wood boilers to achieve NOX reductions in the 20 to 50% range. SNCR not appropriate for boilers with high load swings. SCR has not been applied.
ESPs in use on many wood boilers. Emission levels as low as 0.02 lb/106 Btu possible. Retrofit costs highly site-specific.
Cost of Option Installing SNCR to achieve 0.15 lb/106 Btu NOX emissions on a 300,000 pph wood boiler: Capital $1.5 million; operating $0.1 million/yr
Installing ESP to achieve 0.04 lb/106 Btu PM emissions on a 300,000 pph wood boiler: Capital $21.3 million; operating $1.4 million/yr. Costs to achieve a 0.065 lb/106 standard range from $18.7 million to $5.1 capital, $900,000 to $77,000 operating—highly site-specific
Control Option Methane de-NOX Reburn Applicability of Control Option and Potential Emission Reductions
Has been applied to one boiler burning wood, gas, and sludge. Involves natural gas injection and flue gas recirculation in stoker-type boilers only. NOX reduction reported to be 40 to 50% in boilers burning high nitrogen content fuels.
Cost of Option Capital costs unavailable. Lower operating costs claimed due to increased boiler efficiency.
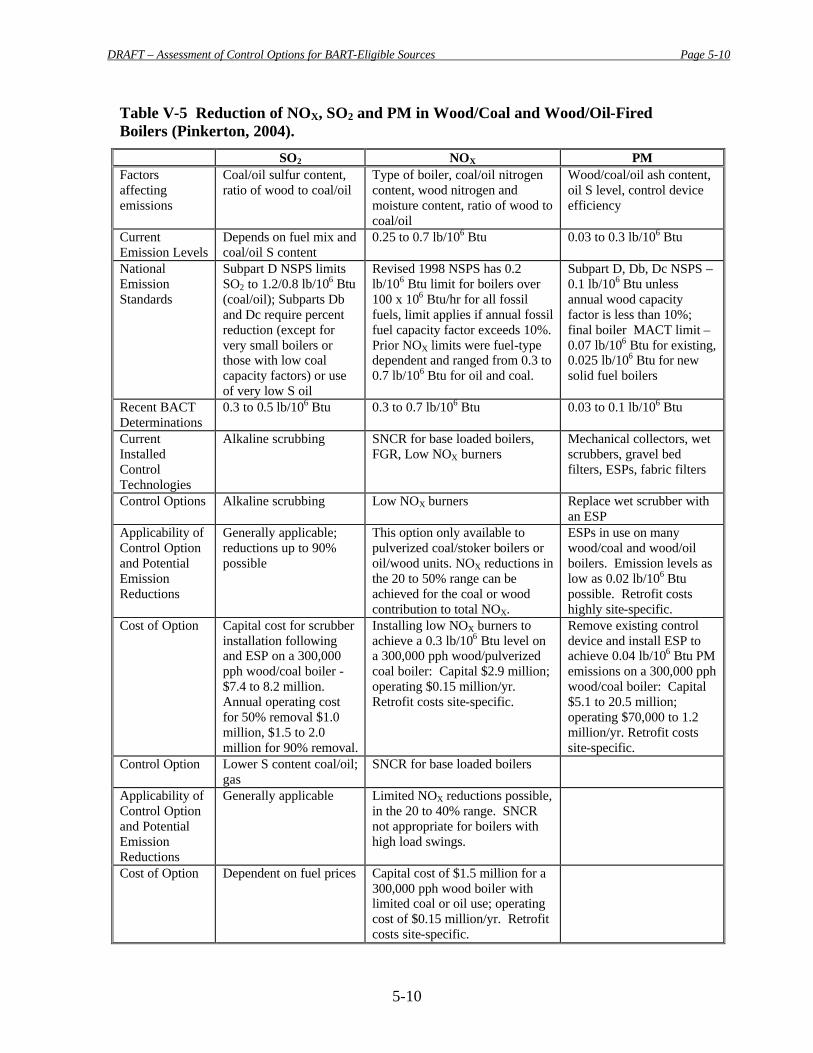
DRAFT – Assessment of Control Options for BART-Eligible Sources Page 5-10
5-10
Table V-5 Reduction of NOX, SO2 and PM in Wood/Coal and Wood/Oil-Fired Boilers (Pinkerton, 2004).
SO2 NOX PM Factors affecting emissions
Coal/oil sulfur content, ratio of wood to coal/oil
Type of boiler, coal/oil nitrogen content, wood nitrogen and moisture content, ratio of wood to coal/oil
Wood/coal/oil ash content, oil S level, control device efficiency
Current Emission Levels
Depends on fuel mix and coal/oil S content
0.25 to 0.7 lb/106 Btu 0.03 to 0.3 lb/106 Btu
National Emission Standards
Subpart D NSPS limits SO2 to 1.2/0.8 lb/106 Btu (coal/oil); Subparts Db and Dc require percent reduction (except for very small boilers or those with low coal capacity factors) or use of very low S oil
Revised 1998 NSPS has 0.2 lb/106 Btu limit for boilers over 100 x 106 Btu/hr for all fossil fuels, limit applies if annual fossil fuel capacity factor exceeds 10%. Prior NOX limits were fuel-type dependent and ranged from 0.3 to 0.7 lb/106 Btu for oil and coal.
Subpart D, Db, Dc NSPS – 0.1 lb/106 Btu unless annual wood capacity factor is less than 10%; final boiler MACT limit – 0.07 lb/106 Btu for existing, 0.025 lb/106 Btu for new solid fuel boilers
Recent BACT Determinations
0.3 to 0.5 lb/106 Btu 0.3 to 0.7 lb/106 Btu 0.03 to 0.1 lb/106 Btu
Current Installed Control Technologies
Alkaline scrubbing SNCR for base loaded boilers, FGR, Low NOX burners
Mechanical collectors, wet scrubbers, gravel bed filters, ESPs, fabric filters
Control Options Alkaline scrubbing Low NOX burners Replace wet scrubber with an ESP
Applicability of Control Option and Potential Emission Reductions
Generally applicable; reductions up to 90% possible
This option only available to pulverized coal/stoker boilers or oil/wood units. NOX reductions in the 20 to 50% range can be achieved for the coal or wood contribution to total NOX.
ESPs in use on many wood/coal and wood/oil boilers. Emission levels as low as 0.02 lb/106 Btu possible. Retrofit costs highly site-specific.
Cost of Option Capital cost for scrubber installation following and ESP on a 300,000 pph wood/coal boiler - $7.4 to 8.2 million. Annual operating cost for 50% removal $1.0 million, $1.5 to 2.0 million for 90% removal.
Installing low NOX burners to achieve a 0.3 lb/106 Btu level on a 300,000 pph wood/pulverized coal boiler: Capital $2.9 million; operating $0.15 million/yr. Retrofit costs site-specific.
Remove existing control device and install ESP to achieve 0.04 lb/106 Btu PM emissions on a 300,000 pph wood/coal boiler: Capital $5.1 to 20.5 million; operating $70,000 to 1.2 million/yr. Retrofit costs site-specific.
Control Option Lower S content coal/oil; gas
SNCR for base loaded boilers
Applicability of Control Option and Potential Emission Reductions
Generally applicable Limited NOX reductions possible, in the 20 to 40% range. SNCR not appropriate for boilers with high load swings.
Cost of Option Dependent on fuel prices Capital cost of $1.5 million for a 300,000 pph wood boiler with limited coal or oil use; operating cost of $0.15 million/yr. Retrofit costs site-specific.
DRAFT – Assessment of Control Options for BART-Eligible Sources Page 5-11
5-11
References Someshwar, A. V.; Pinkerton, J. E., “Wood Processing Industry” in Air Pollution Engineering Manual, 2nd ed.; Davis, W. T., John Wiley & Sons, Inc.: New York City, 2000; 780-801. Pinkerton, J. E., “Pulp and Paper Air Pollution Problems” in Industrial Environmental Control Pulp and Paper Industry, 3rd ed.; Springer, A. M., Tappi Press: Atlanta, 2000; 501-526. Someshwar, A. V. A., Review of NOX Emission Control Strategies for Industrial Boilers, Kraft Recovery Furnaces, and Lime Kilns; NACSI: Research Triangle Park, 1999; 22-27. Pinkerton, J.E., National Council of the Paper Industry for Air and Stream Improvement (NCASI), [email protected], 2004.
DRAFT – Assessment of Control Options for BART-Eligible Sources Page 6-1
6-1
6. CONCLUSION
As states prepare to conduct BART determinations for their eligible facilities, preliminary information has been collected on the availability, costs and efficiencies of a variety of technology options. Depending on the requirements contained in the final BART regulations, anticipated for April 2005, states will have to decide what level of cost and what degree of visibility improvement is considered reasonable before completing BART determinations. MANE-VU has reviewed technology options for four of the 26 BART-eligible source categories. For EGUs, industrial boilers, cement plants and paper and pulp facilities, we present typical control options and costs. Facility specific reviews will be needed to determine specific controls and costs for each BART-Eligible source in the region.
6.1. EGUs The presumptive level of control for previously uncontrolled EGU boilers as
included in the proposed BART regulations include FGD (Scrubber) technology with an SO2 control efficiency of approximately 95 percent. Chapter 2 points out that the average scrubber operating today does not achieve this level of control (existing scrubbers have a range of efficiencies between 30 and 97 percent); however, new installations are achieving rates even higher than 95 percent removal. Additional measures which can be considered for SO2 control include the use of low-sulfur coal (compliance coal) (typically XX percent SO2 reduction), spray dry adsorption (60-95 percent removal), dry scrubbing (40-60 percent removal) or circular fluidized-bed adsorption technology (80-98 percent removal). SO2 control is highly cost effective with operational costs in the $100-200 per ton range.
NOX control technologies can be grouped into combustion controls (including low-NOX burners (LNBs), overfire air, off-stoichiometric firing, selective or biased burner firing, reburning, burners-out-of-service, and air staging) and post-combustion controls (include selective non-catalytic reduction (SNCR) and selective catalytic reduction (SCR) processes). Combustion controls result in typical NOX reductions of 15 to 60 percent, depending on the specific boiler and combination of controls. SCR achieves a 90-95 percent reduction whereas SNCR achieves 25-50 percent reduction in NOX. Costs for NOX removal range from $200-500/ton for some of the low yield techniques to $1000 to $1500/ton for SCR with 90-95 percent removal efficiency.
Particulate matter (PM) control technologies include electrostatic precipitators (ESPs), fabric filters (FFs) (also called “baghouses”), and particulate scrubbers (PS). These technologies typically achieve greater than 95 percent removal of total particulate mass with over 80 percent removal of PM smaller than 0.3 um (with the exception of particulate scrubbers which achieve only 30-85 percent removal for this smaller size fraction). Mechanical collectors have even lower trapping efficiencies. PM controls are in place on virtually all EGUs already, hence the issue that will be faced in conducting BART determinations is how these existing controls will interface with proposed controls for other pollutants.
DRAFT – Assessment of Control Options for BART-Eligible Sources Page 6-2
6-2
6.2. Industrial Boilers For industrial boilers, many of the same control technologies for EGUs are
applicable to this source category including: low sulfur coal, wet and dry FGD (or scrubber) technology for SO2, combustion modifications and SCR and SNCR technology for NOX, and ESP, fabric filter and wet scrubbing techniques for PM. However, industrial boilers have a wider range of sizes than EGUs and often operate over a wider range of capacities. Thus cost estimates for the same technologies will generally range, depending on the capacity of the boiler and typical operating conditions. High end cost estimates for NOX removal can be over $10,000/ton.
6.3. Cement Kilns Designing a system of emission controls for cement kilns are somewhat more
complicated given that the quality of clinker produced in a kiln varies with characteristics of the combustion, it is possible to combine combustion technologies with post-combustion technologies for cement kilns in some cases and it is also possible to combine multiple combustion technologies on cement kilns. As a result, primary controls need to be selected carefully taking engineering and cost decisions into account for each specific kiln.
Control options for SO2 include in-process removal, process changes (e.g. combustion optimization, flame shape adjustment or raw material changes), and the use of wet or dry scrubbers. For NOX, both process modifications (e.g. combustion modifications, low-NOX burners, secondary combustion or staged combustion) as well as post combustion controls need to be selected carefully. Particulate control devices for cement plants must be able to clean gases with fairly high dust loading given that the concentrations of particles in the exhaust can be several times higher than in a coal-fired power plant. In addition, PM technologies are affected by the presence of corrosive gases which can be reduced most effectively in a roller mill. While fabric filters (baghouses) and electrostatic precipitators are still the most common means of PM control at cement plants, a number of novel techniques and procedures are used to deal with the unique issues face by cement kilns.
Costs for SO2 controls at cement kilns will vary widely depending on control options selected and process variables (e.g. whether material is recycled in the control process). Capital cost for typical wet/dry scrubbing post-combustion controls have been estimated in the $10-50/ton of clinker produced with operating costs in the $5-20/ton of clinker range. PM controls are similarly estimated in the $3-15/ton of clinker range for capital costs and $0-30/ton clinker for operating costs on an annual basis. NOX has not been estimated on a per ton of clinker basis, but estimates vary between 0 and $10,000/ton of NOX reduced.
6.4. Pulp Mills Paper and pulp facilities have perhaps the widest range of operational
configurations and thus possibilities for reducing pollutant emissions. A variety of
DRAFT – Assessment of Control Options for BART-Eligible Sources Page 6-3
6-3
technologies exist for controlling emissions from pulp and paper facilities. Secondary control devices can be helpful in reducing emissions for some processes, and a number of them are available. Many facilities have found that significant emissions reductions can be achieved through process changes at the facility. Both secondary controls and process changes are presented as options.
For Kraft mill recovery furnaces, combustion modifications can be effective at reducing SO2, NOX, and VOCs. Reducing the liquor sulfidity can also help reduce SO2 emissions. PM control for recovery furnaces is typically achieved through the use of ESPs or wet ESPs.
Lime kilns are also a significant source of visibility impairing pollutants; however, there are fewer options for effectively reducing SO2 emissions. Combustion modifications can reduce NOX and VOC emissions and Venturi scrubbers and ESPs are commonly used for PM control.
Demister pads, packed towers and Venturi scrubbers are used to reduce PM emissions from smelt dissolving tanks.
The range in costs and emission reductions reflects the fact that site-specific factors play a critical role in determining how cost-effective various technologies will be in practice. Existing facilities do not always adequate or appropriate space for new equipment, which adds uncertainty to the capital and operating cost, as well at to the achievable emissions reductions. Hence a wide range of costs have been cited.
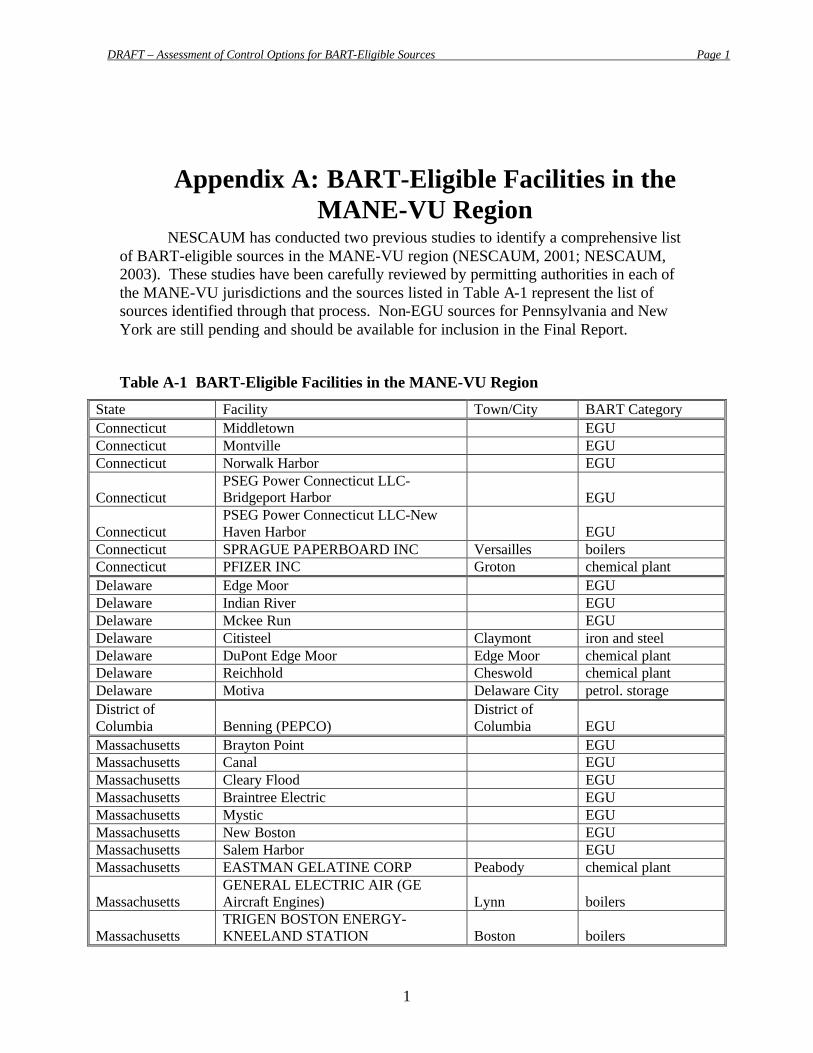
DRAFT – Assessment of Control Options for BART-Eligible Sources Page 1
1
Appendix A: BART-Eligible Facilities in the MANE-VU Region
NESCAUM has conducted two previous studies to identify a comprehensive list of BART-eligible sources in the MANE-VU region (NESCAUM, 2001; NESCAUM, 2003). These studies have been carefully reviewed by permitting authorities in each of the MANE-VU jurisdictions and the sources listed in Table A-1 represent the list of sources identified through that process. Non-EGU sources for Pennsylvania and New York are still pending and should be available for inclusion in the Final Report.
Table A-1 BART-Eligible Facilities in the MANE-VU Region
State Facility Town/City BART Category Connecticut Middletown EGU Connecticut Montville EGU Connecticut Norwalk Harbor EGU
Connecticut PSEG Power Connecticut LLC- Bridgeport Harbor EGU
Connecticut PSEG Power Connecticut LLC-New Haven Harbor EGU
Connecticut SPRAGUE PAPERBOARD INC Versailles boilers Connecticut PFIZER INC Groton chemical plant Delaware Edge Moor EGU Delaware Indian River EGU Delaware Mckee Run EGU Delaware Citisteel Claymont iron and steel Delaware DuPont Edge Moor Edge Moor chemical plant Delaware Reichhold Cheswold chemical plant Delaware Motiva Delaware City petrol. storage District of Columbia Benning (PEPCO)
District of Columbia EGU
Massachusetts Brayton Point EGU Massachusetts Canal EGU Massachusetts Cleary Flood EGU Massachusetts Braintree Electric EGU Massachusetts Mystic EGU Massachusetts New Boston EGU Massachusetts Salem Harbor EGU Massachusetts EASTMAN GELATINE CORP Peabody chemical plant
Massachusetts GENERAL ELECTRIC AIR (GE Aircraft Engines) Lynn boilers
Massachusetts TRIGEN BOSTON ENERGY-KNEELAND STATION Boston boilers
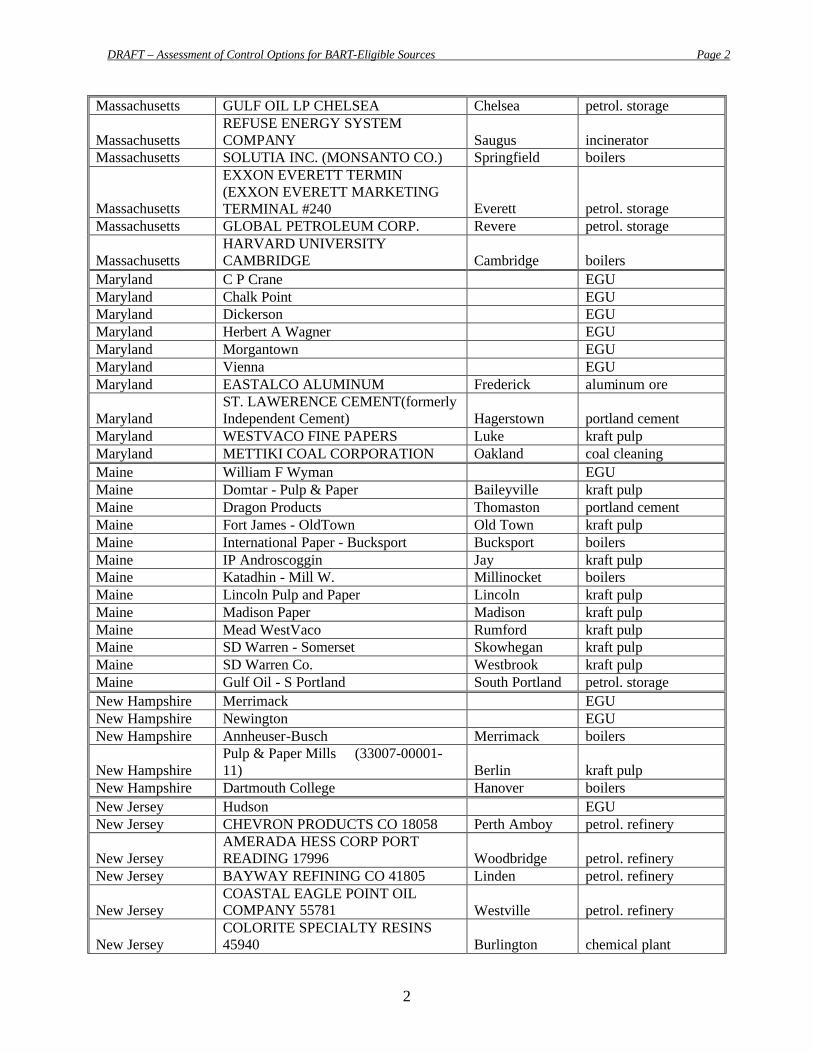
DRAFT – Assessment of Control Options for BART-Eligible Sources Page 2
2
Massachusetts GULF OIL LP CHELSEA Chelsea petrol. storage
Massachusetts REFUSE ENERGY SYSTEM COMPANY Saugus incinerator
Massachusetts SOLUTIA INC. (MONSANTO CO.) Springfield boilers
Massachusetts
EXXON EVERETT TERMIN (EXXON EVERETT MARKETING TERMINAL #240 Everett petrol. storage
Massachusetts GLOBAL PETROLEUM CORP. Revere petrol. storage
Massachusetts HARVARD UNIVERSITY CAMBRIDGE Cambridge boilers
Maryland C P Crane EGU Maryland Chalk Point EGU Maryland Dickerson EGU Maryland Herbert A Wagner EGU Maryland Morgantown EGU Maryland Vienna EGU Maryland EASTALCO ALUMINUM Frederick aluminum ore
Maryland ST. LAWERENCE CEMENT(formerly Independent Cement) Hagerstown portland cement
Maryland WESTVACO FINE PAPERS Luke kraft pulp Maryland METTIKI COAL CORPORATION Oakland coal cleaning Maine William F Wyman EGU Maine Domtar - Pulp & Paper Baileyville kraft pulp Maine Dragon Products Thomaston portland cement Maine Fort James - OldTown Old Town kraft pulp Maine International Paper - Bucksport Bucksport boilers Maine IP Androscoggin Jay kraft pulp Maine Katadhin - Mill W. Millinocket boilers Maine Lincoln Pulp and Paper Lincoln kraft pulp Maine Madison Paper Madison kraft pulp Maine Mead WestVaco Rumford kraft pulp Maine SD Warren - Somerset Skowhegan kraft pulp Maine SD Warren Co. Westbrook kraft pulp Maine Gulf Oil - S Portland South Portland petrol. storage New Hampshire Merrimack EGU New Hampshire Newington EGU New Hampshire Annheuser-Busch Merrimack boilers
New Hampshire Pulp & Paper Mills (33007-00001-11) Berlin kraft pulp
New Hampshire Dartmouth College Hanover boilers New Jersey Hudson EGU New Jersey CHEVRON PRODUCTS CO 18058 Perth Amboy petrol. refinery
New Jersey AMERADA HESS CORP PORT READING 17996 Woodbridge petrol. refinery
New Jersey BAYWAY REFINING CO 41805 Linden petrol. refinery
New Jersey COASTAL EAGLE POINT OIL COMPANY 55781 Westville petrol. refinery
New Jersey COLORITE SPECIALTY RESINS 45940 Burlington chemical plant
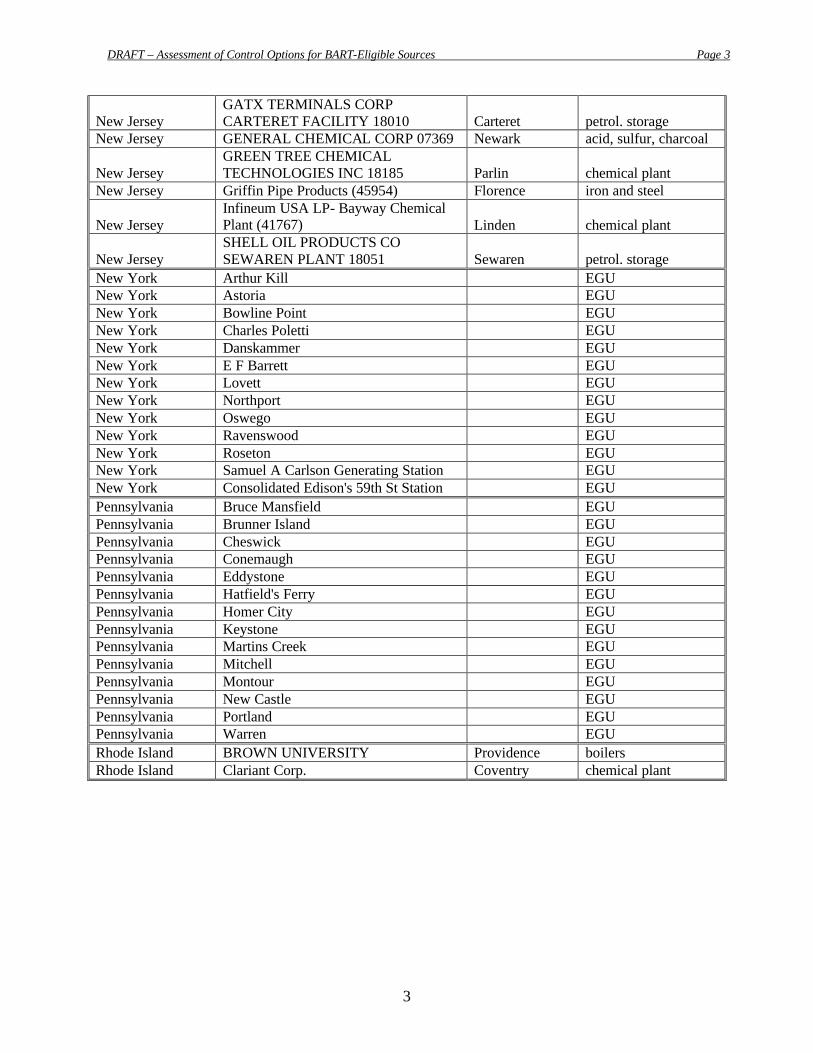
DRAFT – Assessment of Control Options for BART-Eligible Sources Page 3
3
New Jersey GATX TERMINALS CORP CARTERET FACILITY 18010 Carteret petrol. storage
New Jersey GENERAL CHEMICAL CORP 07369 Newark acid, sulfur, charcoal
New Jersey GREEN TREE CHEMICAL TECHNOLOGIES INC 18185 Parlin chemical plant
New Jersey Griffin Pipe Products (45954) Florence iron and steel
New Jersey Infineum USA LP- Bayway Chemical Plant (41767) Linden chemical plant
New Jersey SHELL OIL PRODUCTS CO SEWAREN PLANT 18051 Sewaren petrol. storage
New York Arthur Kill EGU New York Astoria EGU New York Bowline Point EGU New York Charles Poletti EGU New York Danskammer EGU New York E F Barrett EGU New York Lovett EGU New York Northport EGU New York Oswego EGU New York Ravenswood EGU New York Roseton EGU New York Samuel A Carlson Generating Station EGU New York Consolidated Edison's 59th St Station EGU Pennsylvania Bruce Mansfield EGU Pennsylvania Brunner Island EGU Pennsylvania Cheswick EGU Pennsylvania Conemaugh EGU Pennsylvania Eddystone EGU Pennsylvania Hatfield's Ferry EGU Pennsylvania Homer City EGU Pennsylvania Keystone EGU Pennsylvania Martins Creek EGU Pennsylvania Mitchell EGU Pennsylvania Montour EGU Pennsylvania New Castle EGU Pennsylvania Portland EGU Pennsylvania Warren EGU Rhode Island BROWN UNIVERSITY Providence boilers Rhode Island Clariant Corp. Coventry chemical plant