assessment of compensation measures source control … · it provides a decision-support tool...
TRANSCRIPT
1
Assessment of compensation measures – Source Control
Solutions - in urban drainage systems under climate change
Miguel Gonçalves
Insti tuto Superior Técnico
Lisbon, Portugal
[email protected] isboa.pt
Abstract:. In this paper a planning analysis of implementing some compensation measures in a small drainage
basin in Lisbon, Av. Almirante Reis, is presented. The main objective is to study if the measures that are used can
mitigate the increasing stormwater runoff due to climate change. Potential Best Management Practices (BMPs)
were first selected and placed in the right areas. Then SUSTAIN (System for Urban Stormwater Treatment And
Integration), a decision support system software, was used to get the optimal dimensions for the BMPs. With
those, SWMM (Storm Water Management Model) is used to study the impacts that the group of BMPs chosen
have in the drainage system. Thus, it is possible to assess whether these measures can compensate or not the
decreasing performances of the urban drainage systems due to climate change. Based on the results, BMPs
have a positive impact, although it is not enough. Therefore, BMPs should not be seen as the “one and only”
solution, but more as one of the solutions among a group of different measures.
Keywords: Climatic changes; Stormwater runoff; BMPs; SUSTAIN; SWMM; Optimal
1 INTRODUCTION
Nowadays, cities are experiencing a significant growth, manly due to the increasing world population and the
migratory movements to the urban centres. This urban growth leads to the increase of impervious surfaces and
thereafter an increasing of the stormwater runoff, which causes a decreasing in the performance of the drainage
systems. Worsening all this, the world is experiencing climatic changes that aggravate even more the drainage
systems performances. With this decreasing come serious consequences in terms of flooding, transport of
pollutants and contamination of natural systems. Therefore, the need for solutions and adaption to all this
changes is nowadays a very important subject, existing under study and experimentation several solutions to this
matter.
To mitigate the negative impacts of urbanization, some in recent years have proposed the use of BMPs for
stormwater runoff quality and quantity control (Davis, 2005); (Field, et al., 2006); (Jia, Yao et al., 2014). There are
presently many BMPs, such as bio-retention cells, porous pavement, green roofs, etc., that could be used at a
certain site. Others believe in solutions more i-tech, like the Real Time Control (RTC) of urban sewer systems,
which have some applications that were well succeeded (DWA, 2005). Nevertheless, the application of these
solutions is residual comparing with the international panorama, which implies that the effectiveness of the
application of each one of these solutions may not be the best, due to the lack of experience and results. With
that in mind, all these solutions are first modelled in software’s that help analysing the results and deciding
whether the application will or won’t do the effects needed.
In this study, is analysed the effectiveness of using BMPs in a small drainage basin in Lisbon considering climate
changes in the precipitation regime and in the river Tagus tide. For that are used two different decision support

2
systems, SUSTAIN and SWMM, which will help deciding the optimal sizes of the BMPs and if those have the
effectiveness needed.
2 APPLICATION OF BMPs AND SUSTAINBLE URBAN WATER MANAGEMENT
The use of BMPs in stormwater management aims to reduce the excessive runoff and the pollutants loads that
enter into the drainage system. Source control measures could be non-structural such as alternative layouts of
roads and buildings, minimizing imperviousness and maximizing the use of soils and vegetation. On the other
hand, structural measures include the construction near the source of the stormwater, of systems such as
infiltration and rainwater re-use facilities or green roofs (Barbosa, Fernandes, & David, 2012). In this study, are
used four different types of BMPs: Detention Ponds, Green Roofs, Porous Pavement and Infiltration Trenches. All
these BMPs have different characteristics and the place in the urban basin where these should be is a complex
but essential step for urban runoff control planning (Jia, Yao et al., 2014). Actually, with this type of measure it is
possible to rethink some urban areas that need rehabilitation, not just in terms of buildings but socially as well. In
fact some of the BMPs used can induct really big differences in the urban area. That’s why the application of
these solutions must be linked with the urban management and design. The BMPs planning process, often by
necessity, need to involve considerations on relevant urban development planning schemes such as urban
master planning, land use planning, landscape planning, drainage system planning, water pollution control
planning, etc.
With these new solutions to solve the cities drainage problems, a new concept arises – SUWM (Sustainable
Urban Water Management) or WSUD (Water Sensitive Urban Design). The main objective of these concepts is
allying the rehabilitation of the urban areas and at the same time enhancing the quality and quantity of the
stormwater runoff. Thus, cities could treat the stormwater runoff, not as nuisance but more as resource. This new
way of managing stormwater involves implementing a range of decentralised solutions and the disconnection of
waterways from impervious surfaces, using BMPs and green infrastructures. Thus, SUWM differs from traditional
models in its core aims, the type of infrastructures and how the urban water cycle is managed (Marlow, Moglia,
Cook, & Beale, 2013). Next, the main objectives that SUWM tend to achieve:
• Stormwater runoff volumes reduction
• Quality control of the stormwater runoff
• Enhance urban design and rehabilitation
• Reuse of stormwater and sewer water
Concluding, the core objective of SUWM is adapting the actual urban water cycle to a more natural water cycle.
Below is presented an image that shows this objective and the SUWM concept (Water by Design, 2009).
Figure 1 – The Urban Water Cycle showing changes to the Natural Water Cycle with traditional urban development and with SUWM

3
3 INTRODUCING SUSTAIN AND SWMM – DECISION SUPORT SYSTEMS
Nowadays, with technology advances, all these new solutions and new infrastructures are first modelled and
studied with software’s, normally addressed as decision support systems. In Urban Stormwater management,
especially when using solutions that have lack of expertise, it is very common the use of this kind of software’s. In
this study, there are used two different decision support systems – SUSTAIN and SWMM, in this chapter is made
a little introduction to each one.
3.1 SUSTAIN – System for Urban Stormwater Treatment And Integration
SUSTAIN was developed by the US EPA to evaluate alternative plans for stormwater runoff management in
urban and developing areas (US EPA, 2009). It provides a decision-support tool capable of evaluating the optimal
location, type, size and cost of BMPs needed to meet water quality and quantity goals. It is built on a platform
interface ArcGIS, which provides the user access to the framework components: A BMP sitting tool, a watershed
runoff and routing module, a BMP simulation module, a BMP cost analysis module, an optimization module and a
post processor (Jia, Yao et al., 2014); (Lee, et al., 2012).
Each module in the framework serves a specific function. The BMP sitting tool uses ArcGIS and user guided rules
to determine site suitability. The land simulation module is used to generate runoff time series data to drive the
BMP simulation. The conveyance module provides routing capabilities between land segments or BMPs or both.
The process-based BMP module provides simulation of management practises by using a combination of
hydrological processes. The cost database is organized according to BMP construction components. The
optimization module is designed to efficiently search for this combination results in a cost-effectiveness curve (US
EPA, 2009). This curve provides valuable information on the minimum costs at various reduction goals, like runoff
reduction or pollutant reductions.
Figure 2 – Sample cost-effectiveness curve
3.2 SWMM – Storm Water Management Model
The Water Supply and Water Resources Division of the US EPA produced SWMM with assistance from the
consulting firm CDM, Inc. This software is widely used throughout the world for planning, analysis and design
related to storm water runoff, combined sewers, sanitary sewers and other drainage systems in urban areas.
SWMM is a dynamic rainfall-runoff simulation model used for single event or long-term simulation of runoff
quantity and quality from primarily urban areas. The runoff component operates on a collection of subcatchment
areas that receive precipitation and generate runoff and pollutant loads. The routing portion of SWMM transports
this runoff trough a system of pipes, channels, storage/treatments devices, pumps and regulators. SWMM tracks
the quantity and quality of runoff generated within each subcatchment, and the flow rate, flow depth, and quality
of water in each pipe and channel during a simulation period comprised of multiple time steps (US EPA, 2010).
With this tool, it is possible to evaluate the flow in the drainage system and conclude whether it is well designed or
it needs adjustments. Actually, SUSTAIN code is based on SWMM’s code, that is why modules in each software
are almost the same.

4
4 CASE STUDY – DRAINAGE BASIN OF AV. ALMIRANTE REIS
4.1 Case study site
Av. Almirante Reis was chosen, because it represents a very good example of an urban drainage basin with
problems of flash flooding and it has great influence in the occurrence of this phenomenon in the downstream
basins and streets. Another aspect that was regarded is the fact that this urban basin has a great potential for
urban rehabilitation, so it would be easier to implement some of the BMP’s and urban strategic measures like
SWUM. In Figure 3, at the image on the right is represented some of Lisbon’s sites that are affected by flash
flooding; the blue bar represents Av. Almirante Reis, which has an average of ten flash floods per decade. At the
image on the left, it is possible to view some buildings from Av. Almirante Reis where it is easy to view the
advanced state of degradation and abandonment. Thus, these urban areas have a great potential for
rehabilitation and use of SWUM measures.
Figure 3 – Main Lisbon sites that are affected by flash floods and some images of Av. Almirante Reis buildings
Av. Almirante Reis is one of the main Lisbon avenues, well in the centre of the city it’s a complete urban
developed site, with a total of 350 ha, it has a highly rate of impervious areas. The limits of the urban drainage
basin that were defined are represented in the Figure 4.
Figure 4 – Delimitation of Av. Almirante Reis urban drainage basin
4.1.1 Soil type
When using source control measures, infiltration is one of the main aspects that is needed to be accounted. Thus,
knowing the soil type of your study area, namely the infiltration rate and porosity, is very important for the success
of your model. Since SUSTAIN uses the Green-Ampt method to compute the amount of infiltration of rainfall on
the pervious land area, where the input parameters can be determined from physical measurements, the Lisbon
Geological Cart was consulted so these parameters could be obtained (Câmara Municipal de Lisboa, 2010). With
the information gathered from these sources, was possible to define the average characteristics of the soil:
5
• Suction Head – 198,12 mm
• Saturated Hydraulic Conductivity – 4,5 mm/h
• Initial moisture content – 0,15 (Humid soils); 0,3 (Dry Soils)
4.1.2 Urban occupation
Besides the soil type and the limits of the study area, is very important to define the pervious and impervious
areas. In SUSTAIN this definition is mandatory and, in this study were identified four types of different areas,
where buildings; streets; parking lots were considered 90% impervious and the other area type is 10%
impervious, this last area are mainly, gardened places.
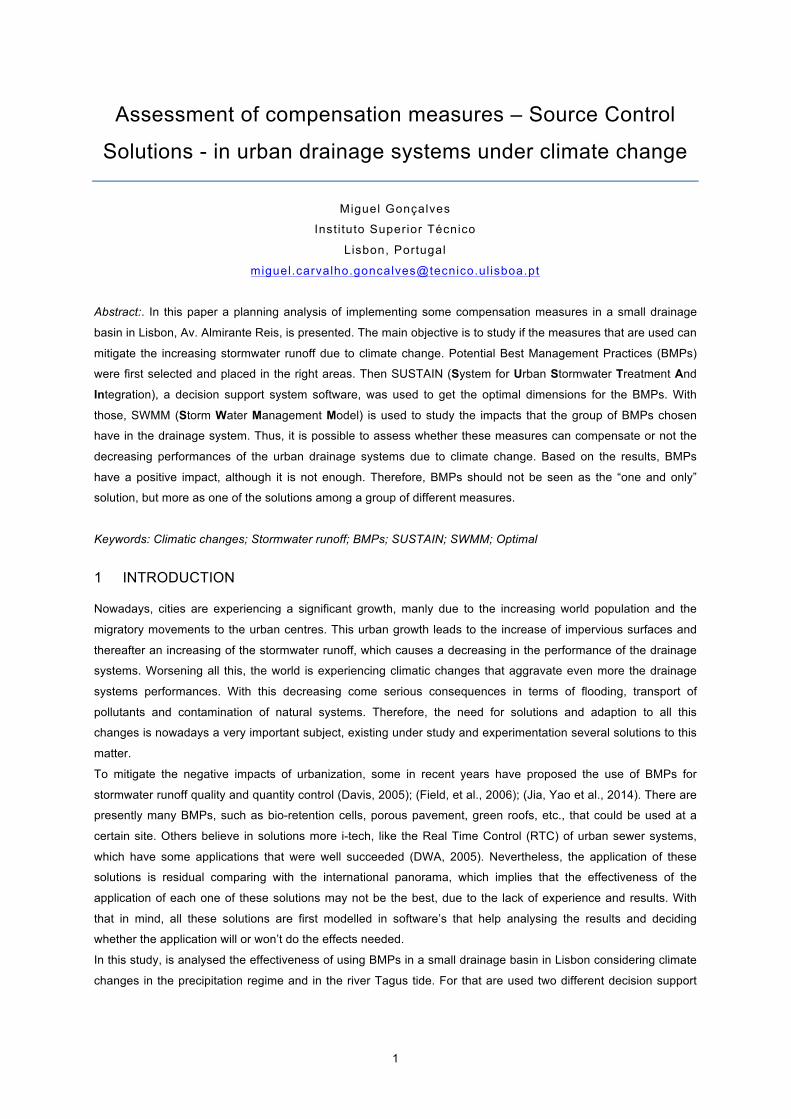
4.1.3 Precipitation event
Since one of the objectives is to study the effectiveness of the application of BMP’s in reducing precipitation
runoff, another parameter that is essential defining is the precipitation event. In Figure 5, it is represented the
precipitation even that was applied in the SUSTAIN and SWMM models. In both models, it was applied this
precipitation event aggravated in 20% or without this aggravation. This change was made, because it was
considered that with climate change these extreme events would become 20% more intense. For the SUSTAIN
model it was analysed three different return periods (T5; T10 and T20)
Figure 5 – Precipitation event applied in the SUSTAIN and SWMM models
4.2 SUSTAIN model and results
The main objective of this model is to define the optimum size, of each BMP, that can provide the biggest
reduction in runoff. In the end, the best solution will be the one that has more effectiveness for fewer costs.
Since the study area is a complete developed urban area, the areas where the source control measures were
applied, were chosen with the idea of requalification of urban spaces. For example, the dry ponds were placed in
areas where buildings were completely unoccupied and abandoned.
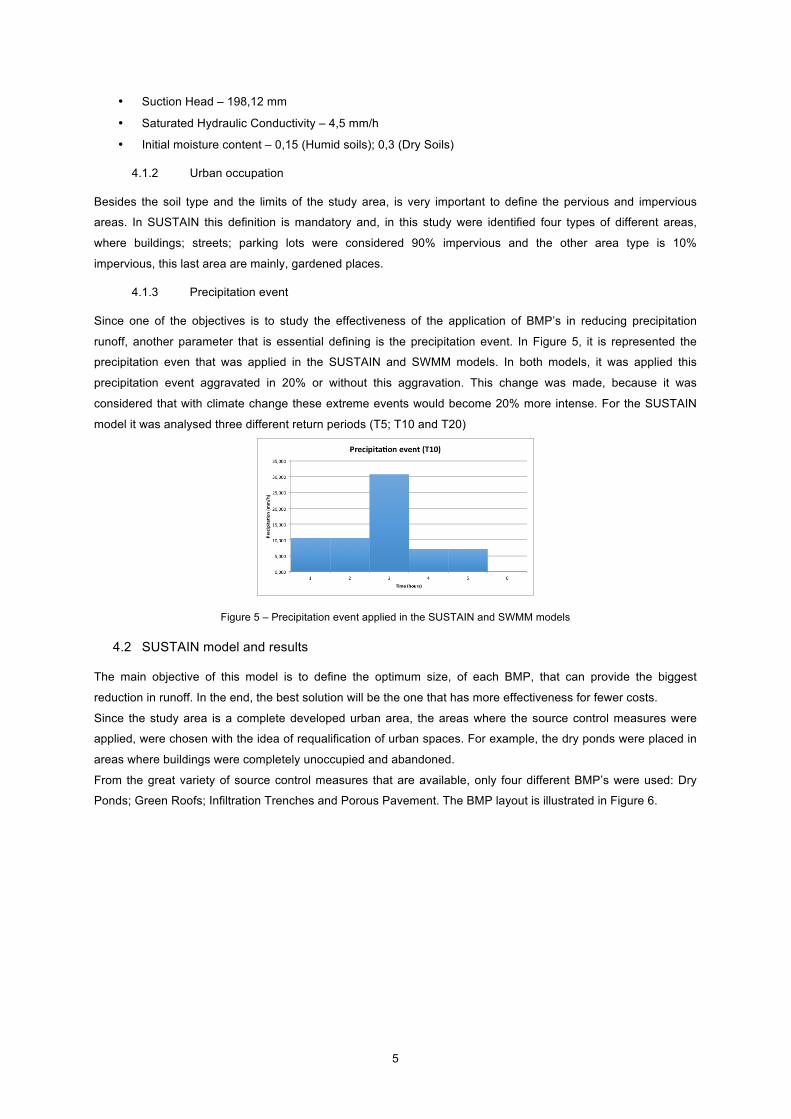
From the great variety of source control measures that are available, only four different BMP’s were used: Dry
Ponds; Green Roofs; Infiltration Trenches and Porous Pavement. The BMP layout is illustrated in Figure 6.
6
Figure 6 – BMP layout
These BMP’s were placed in several places along the drainage basin, with a variable dimension. This means the
only thing that was chosen, was the place where the BMP were placed, the optimum dimension is the output from
the SUSTAIN model. Dry ponds, infiltration trenches and porous pavement, had their length as variable. Green
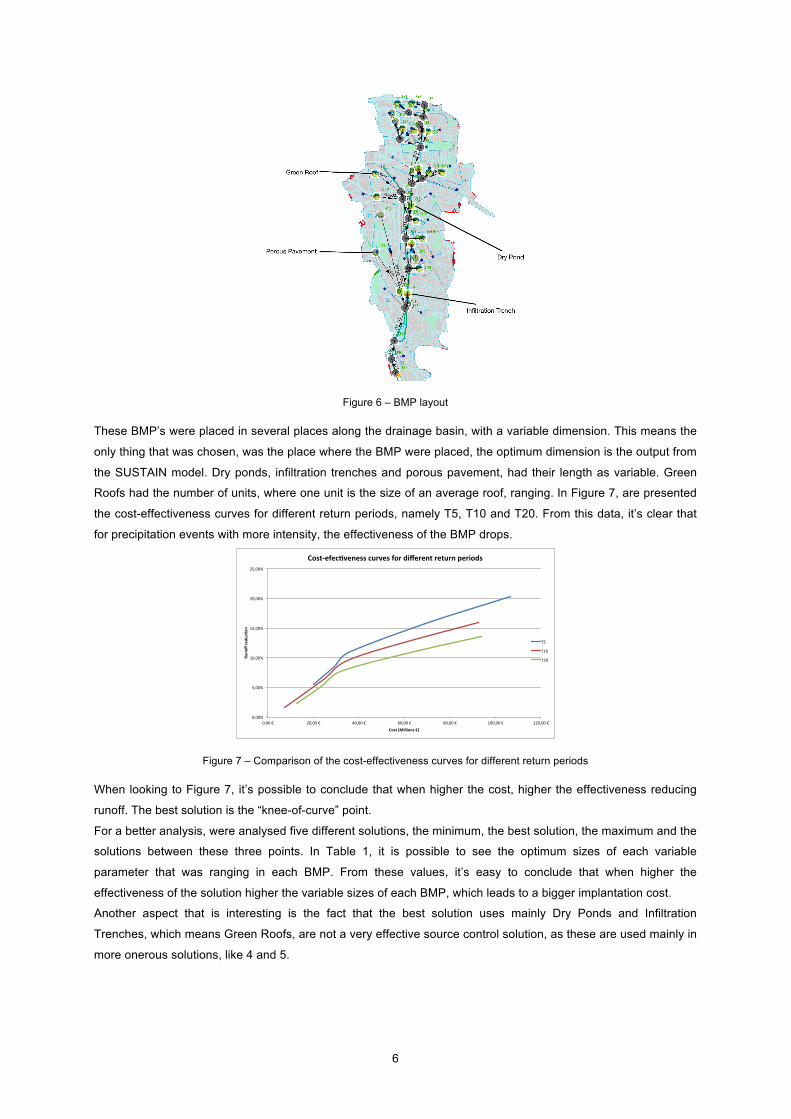
Roofs had the number of units, where one unit is the size of an average roof, ranging. In Figure 7, are presented
the cost-effectiveness curves for different return periods, namely T5, T10 and T20. From this data, it’s clear that
for precipitation events with more intensity, the effectiveness of the BMP drops.
Figure 7 – Comparison of the cost-effectiveness curves for different return periods
When looking to Figure 7, it’s possible to conclude that when higher the cost, higher the effectiveness reducing
runoff. The best solution is the “knee-of-curve” point.
For a better analysis, were analysed five different solutions, the minimum, the best solution, the maximum and the
solutions between these three points. In Table 1, it is possible to see the optimum sizes of each variable
parameter that was ranging in each BMP. From these values, it’s easy to conclude that when higher the
effectiveness of the solution higher the variable sizes of each BMP, which leads to a bigger implantation cost.
Another aspect that is interesting is the fact that the best solution uses mainly Dry Ponds and Infiltration
Trenches, which means Green Roofs, are not a very effective source control solution, as these are used mainly in
more onerous solutions, like 4 and 5.
0,00%$
5,00%$
10,00%$
15,00%$
20,00%$
25,00%$
$0,00$€$ $20,00$€$ $40,00$€$ $60,00$€$ $80,00$€$ $100,00$€$ $120,00$€$
Runo
ff&redu
c+on
&
Cost&(Millions&€)&
Cost5efec+veness&curves&for&different&return&periods&
T5$
T10$
T20$

7
Table 1 – BMP variables parameters analysis for a T5 precipitation event
4.3 SWMM model and results
The main objective of this model is to input the optimum sizes of the BMP’s obtained from SUSTAIN, in a model
of the drainage system of the basin Av. Almirante Reis. Thus, it’s possible to study the influence that the BMP’s
have in the drainage system, in terms of flow, volume and flow depth.
The model of the drainage system that was used was developed with the SI-GEA project, where were modelled
the unitary drainage system of the Av. Almirante Reis e Av. da Liberdade. This model presents the main conduit,
of both drainage systems, and the outfalls to river Tagus, which means these drainage systems are affected by
the tide. In this study the tide was considered fixed at 1,9 meters, so we could have an adverse situation without
the probability of the precipitation event overlapping the low tide.
In this model were inserted the BMP’s from the best solution for a return period of 5 years (seventh column of
Table 1), these source control solutions were introduced with the LID-BMP module that SWMM has available. In
Table 2, it’s presented a summary of the BMP’s sizes that were obtained from SUSTAIN and inserted in SWMM.
It’s important referring that the total cost for this solution is approximately 35,4 millions €.
Table 2 – Summary of the BMP dimensions obtained from SUSTAIN and inserted in SWMM
To analyse the effect of these BMP’s in the drainage system, 4 scenarios were made.
• Scenario 1: This scenario represents the city and its drainage system nowadays, without any
compensation measures. It also represents the climate that we live nowadays, this means no climatic
Minimum Maximum 1)*)Min 2 3)*)Best)sol. 4 5)*)Máx
Dry)Pond)1 Length 0 81 6 3 78 78 75
Dry)Pond)2 Length 0 93 3 90 90 93 93
Dry)Pond)3 Length 0 114 111 111 111 111 114
Green)Roof)1 Nº)of)Units 0 25 5 5 10 5 10
Green)Roof)2 Nº)of)Units 0 20 5 0 0 5 10
Green)Roof)3 Nº)of)Units 0 35 5 15 15 15 25
Green)Roof)4 Nº)of)Units 0 70 10 5 10 40 60
Green)Roof)5 Nº)of)Units 0 240 20 30 20 40 210
Green)Roof)6 Nº)of)Units 0 140 0 0 0 80 140
Green)Roof)7 Nº)of)Units 0 100 0 0 0 60 60
Green)Roof)8 Nº)of)Units 0 240 10 10 20 10 220
Green)Roof)9 Nº)of)Units 0 120 10 20 20 30 90
Green)Roof)10 Nº)of)Units 0 220 10 10 0 190 210
Green)Roof)11 Nº)of)Units 0 90 10 10 10 50 80
Green)Roof)12 Nº)of)Units 0 200 20 20 20 180 180
Porous)Pavament)1 Length 0 32 15 30 27 15 9
Porous)Pavement)2 Length 0 32 6 6 6 6 6
Porous)Pavament)3 Length 0 60 42 12 12 36 30
Porous)Pavement)4 Length 0 63 51 51 60 18 24
Porous)Pavament)5 Length 0 66 18 42 42 30 48
Infiltration)Trench)1 Length 0 381 111 99 183 333 252
Infiltration)Trench)2 Length 0 342 60 339 333 276 243
Infiltration)Trench)3 Length 0 576 459 195 522 453 75
Infiltration)Trench)4 Length 0 639 63 201 51 585 468
BMP
Variabe)ParametersSolution
Variable)dimensionValues)Range
BMP Length*(m) Volume*(m3) Total*volume*(m3) %*of*occupied*area*of*the*basin
Dry*pond*1 78 12776,4
Dry*Pond*2 90 17010
Dry*Pond*3 111 25874,1
BMP Length*(m) Area*(m2) Total*Area*(m2) %*of*occupied*area*of*the*basin
Porous*Pavement*1 27 729
Porous*Pavement*2 6 36
Porous*Pavement*3 12 144
Porous*Pavement*4 60 3600
Porous*Pavement*5 42 1764
BMP Length*(m) Area*(m2) Total*Area*(m2) %*of*occupied*area*of*the*basin
Infiltration*Trench*1 183 384,3
Infiltration*Trench*2 333 699,3
Infiltration*Trench*3 522 1096,2
Infiltration*Trench*4 51 107,1
BMP Nº*of*units Unit*area*(m2) Total*Area*(m2) %*of*occupied*area*of*the*basin
Green*Roofs 125 300 37500 1,08%
55660,5 0,76%
6273 0,18%
2286,9 0,07%
8
changes were inserted, the tide is considered at 1,9 meters and the precipitation event it’s not
aggravated.
• Scenario 2: This scenario is equal to the first in terms of climate properties, but with source control
measures applied.
• Scenario 3: This scenario is represents the future in terms of climate changes and urban development.
The precipitation events are aggravated in 20% and the tide is increased in 0,5 meters, finally the BMP’s
are applied in this scenario, representing the urban development.
• Scenario 4: It’s the worst-case scenario, the urban area with no BMP’s and all the considered future
climate changes.
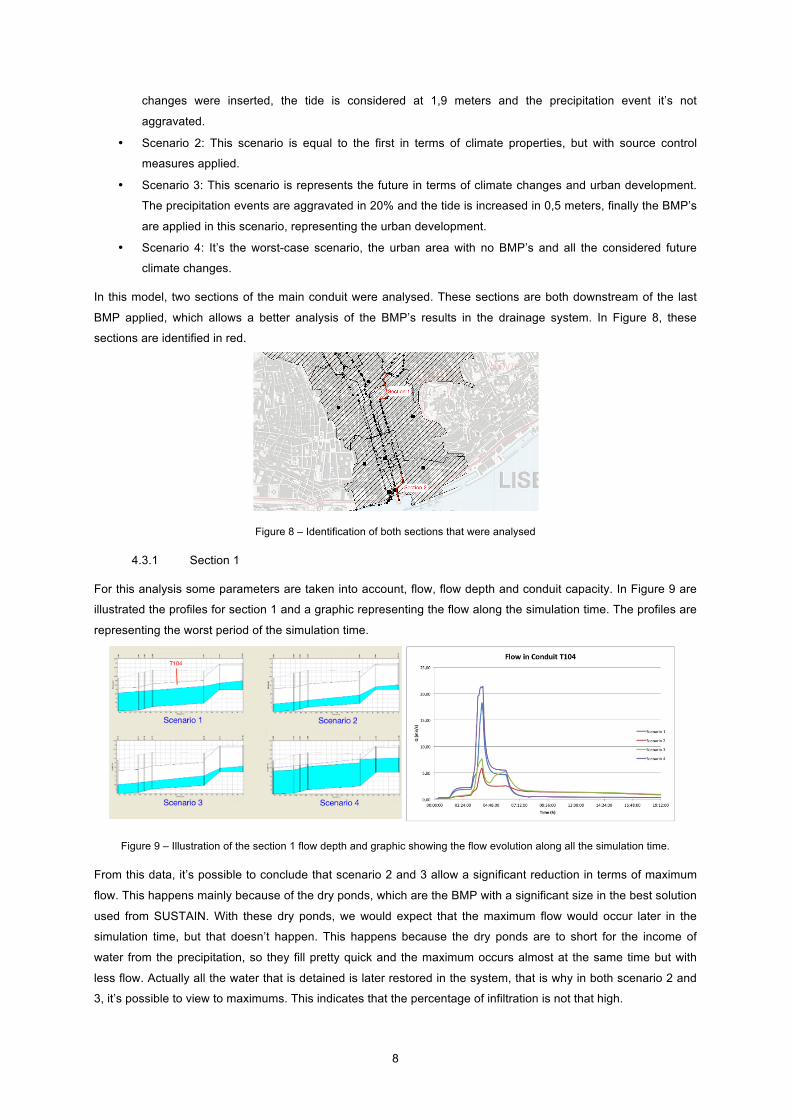
In this model, two sections of the main conduit were analysed. These sections are both downstream of the last
BMP applied, which allows a better analysis of the BMP’s results in the drainage system. In Figure 8, these
sections are identified in red.
Figure 8 – Identification of both sections that were analysed
4.3.1 Section 1
For this analysis some parameters are taken into account, flow, flow depth and conduit capacity. In Figure 9 are
illustrated the profiles for section 1 and a graphic representing the flow along the simulation time. The profiles are
representing the worst period of the simulation time.
Figure 9 – Illustration of the section 1 flow depth and graphic showing the flow evolution along all the simulation time.
From this data, it’s possible to conclude that scenario 2 and 3 allow a significant reduction in terms of maximum
flow. This happens mainly because of the dry ponds, which are the BMP with a significant size in the best solution
used from SUSTAIN. With these dry ponds, we would expect that the maximum flow would occur later in the
simulation time, but that doesn’t happen. This happens because the dry ponds are to short for the income of
water from the precipitation, so they fill pretty quick and the maximum occurs almost at the same time but with
less flow. Actually all the water that is detained is later restored in the system, that is why in both scenario 2 and
3, it’s possible to view to maximums. This indicates that the percentage of infiltration is not that high.
9
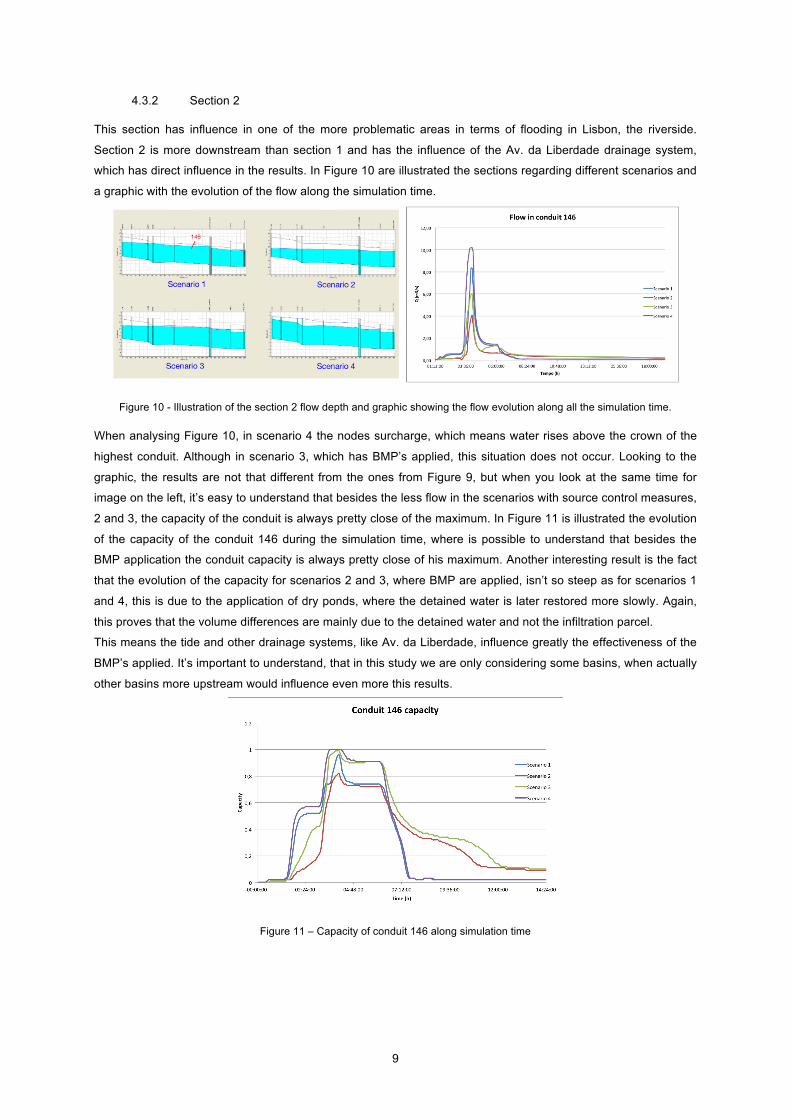
4.3.2 Section 2
This section has influence in one of the more problematic areas in terms of flooding in Lisbon, the riverside.
Section 2 is more downstream than section 1 and has the influence of the Av. da Liberdade drainage system,
which has direct influence in the results. In Figure 10 are illustrated the sections regarding different scenarios and
a graphic with the evolution of the flow along the simulation time.
Figure 10 - Illustration of the section 2 flow depth and graphic showing the flow evolution along all the simulation time.
When analysing Figure 10, in scenario 4 the nodes surcharge, which means water rises above the crown of the
highest conduit. Although in scenario 3, which has BMP’s applied, this situation does not occur. Looking to the
graphic, the results are not that different from the ones from Figure 9, but when you look at the same time for
image on the left, it’s easy to understand that besides the less flow in the scenarios with source control measures,
2 and 3, the capacity of the conduit is always pretty close of the maximum. In Figure 11 is illustrated the evolution
of the capacity of the conduit 146 during the simulation time, where is possible to understand that besides the
BMP application the conduit capacity is always pretty close of his maximum. Another interesting result is the fact
that the evolution of the capacity for scenarios 2 and 3, where BMP are applied, isn’t so steep as for scenarios 1
and 4, this is due to the application of dry ponds, where the detained water is later restored more slowly. Again,
this proves that the volume differences are mainly due to the detained water and not the infiltration parcel.
This means the tide and other drainage systems, like Av. da Liberdade, influence greatly the effectiveness of the
BMP’s applied. It’s important to understand, that in this study we are only considering some basins, when actually
other basins more upstream would influence even more this results.
Figure 11 – Capacity of conduit 146 along simulation time

10
5 CONCLUSIONS
A list of feasible BMP’s at appropriate location was planned and the best dimensions for each BMP were obtained
regarding cost-effectiveness. Than these BMP’s were inserted in a model of the drainage system, in order to
study the direct influence that this source control measures had in the drainage system. It’s important mentioning
that this study regards a futuristic scenario with low probability of being adopted. This is a study from an academic
perspective, where we wanted to study the effectiveness of the mass application of source control measures.
The results show that these solutions can lead to the mitigation of the negative impacts that the urban centres are
experiencing, but not with the efficiency needed, especially in the riverside. Actually these measures are too
expensive for the efficiency presented, which is why source control measures are still seen as additional solutions
for the traditional systems. Thus, with all the measures and techniques that we can use to mitigate this problem,
the BMP’s should not be seen as the “one and only” solution, but more as one of the solutions among a group of
different measures that are used to adapt the drainage systems in the cities.
6 REFERENCES
Barbosa, A. E., Fernandes, J. N., & David, L. M. (2012). Key issues for sustainble urban stormwater
management. IWA - Water Research , 46 (2012), 6787-6798.
Câmara Municipal de Lisboa. (2010). Relatório Sintese de Caracterização Biófisica de Lisboa. Lisbon: Câmara
Municipal de Lisboa.
Davis, A. (2005). Green engineering principles promote low-impact development. Environmental Science
Technology , 39 (16), 338A-344A.
DWA. (2005). Framework for Planning of Real Time Control of Sewer Networks (Vol. M180E).
Field, R., Struck, S. D., Tafuri, A. N., Ports, A. M., Clar, M., Clark, S., et al. (2006). BMP Technology in Urban
Watersheds: Current and Future Directions. ASCE .
Jia, H., Yao, H., Tang, Y., Yu, S. L., Field, R., & Tafuri, N. A. (2014). LID-BMPs planning for urban runoff control
and the case study in China. Journal of Environmental Management , 149 (2015), 65-76.
Lee, J. G., Selvakumar, A., Alvi, K., Riverson, J., Zhen, J. X., Shoemaker, L., et al. (2012). A watershed-scale
design optimization model for stormwater best management pratices. Environmental Model Software's , 37, 6-18.
Marlow, D. R., Moglia, M., Cook, S., & Beale, D. J. (2013). Towards sustainble urban water management: A
critical reassessment. IWA - Water Research , 47, 7150-7161.
US EPA. (2010). Storm Water Management Model - User's Manual. Cincinnati, OH, USA: National Risk
Management Research Laboratory.
US EPA. (2009). SUSTAIN - A Framework for Placement of Best Management Practices in Urban Watersheds to
Protect Water Quality . Cincinnati, OH, USA: Office of Research and Development.
Water by Design. (2009). Concept design guidelines for water urban sensitive design Version 1. Brisbane:
Healthy Waterways.