assessment of clonality for production cell lines via high resolution imaging
TRANSCRIPT

Takeda California
Assessment of Clonality for Production Cell Lines via
High-Resolution Imaging
Melisa Carpio, MS
May 19, 2015
IBC’s Cell Line Development & Engineering Conference

Takeda California1
THE FDA MANDATES MONOCLONALITY FOR
ALL COMMERCIAL PRODUCTION CELL LINES
For recombinant products, the cell
substrate is the transfected cell
containing the desired sequences,
which has been cloned from a single
cell progenitor.” – ICH Q5D

Takeda California
WHY DID WE CHOOSE THE CELL METRIC?
High quality images
Automatic focusing
Direct visual reading of whole well
Unlimited number of data points
Digital record of cells
High-throughput
10 plate incubated stacker
3-4 minutes per plate

Takeda California
ASSESSMENT STRATEGY
What were our goals?
Be able to clearly track growth of a single cell to confluence
Determine media conditions that fosters growth of single cells
Reliably deposit single cells into a single well of a 96WP
How did we achieve our goals?
Evaluate liquid versus semisolid media for cell tracking
Screen different media and additives to optimize colony growth
Examine seeding densities that yield 1 cell/well

Takeda California
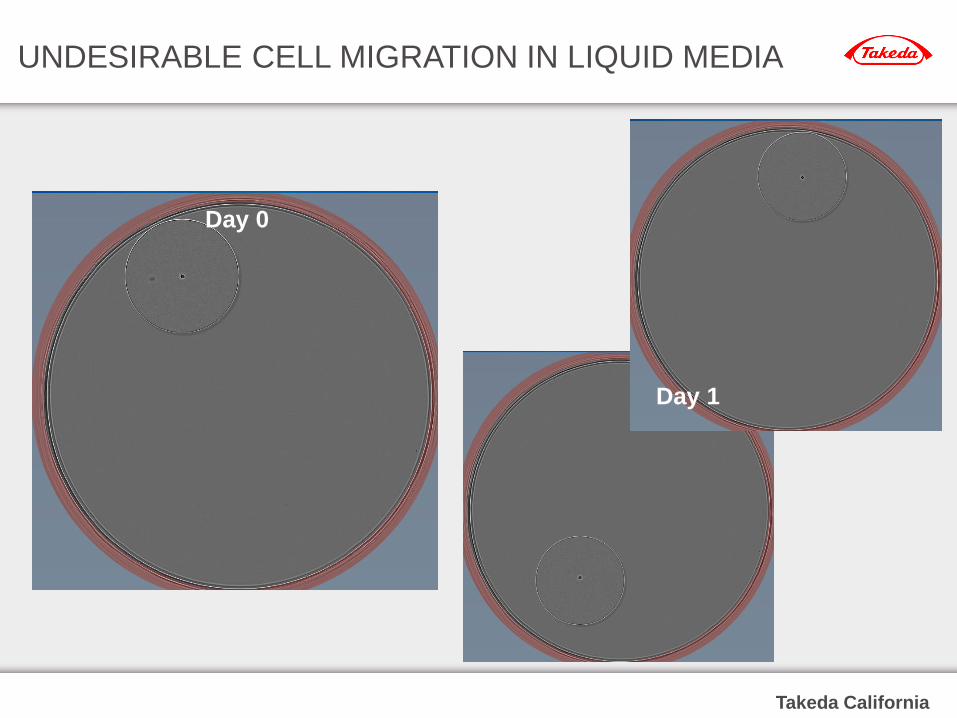
UNDESIRABLE CELL MIGRATION IN LIQUID MEDIA
Images of single cells are clearly observed
BUT cells tend to migrate during daily handling
Day 0 Day 1
Takeda California
UNDESIRABLE CELL MIGRATION IN LIQUID MEDIA
Day 0
Day 1

Takeda California
DOES SEMI-SOLID MEDIA SOLVE THE PROBLEM?
Semisolid #1 Semisolid #2
Semisolid #3 Semisolid #4
Significant debris
was present in
three of the four
media tested
Semisolid #4 was
chosen for further
optimization
Takeda California
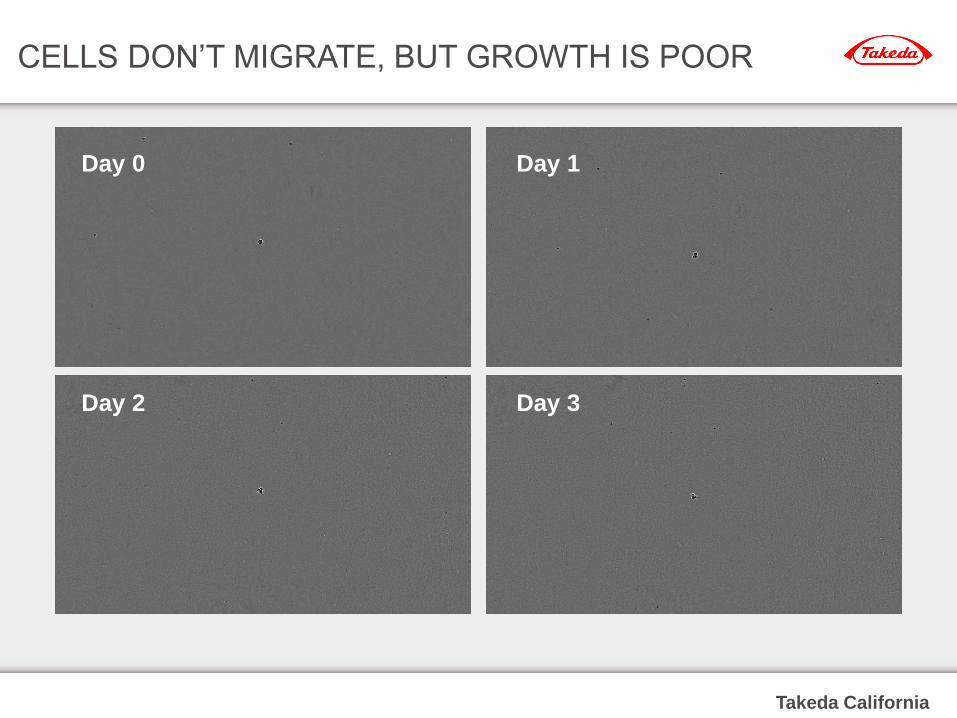
CELLS DON’T MIGRATE, BUT GROWTH IS POOR
Day 0 Day 1
Day 2 Day 3

Takeda California
DOES AN ADDITIVE HELP GROWTH?
Using a known additive did improve growth
Further optimization is still necessary, however
Cells at D0Number
Observed*
Colonies at
D19*
0 50 0
1 29 5
> 1 17 5* values represent averages observed in 96 well plates

Takeda California
A SINGLE CELL CAN BE TRACKED TO CONFLUENCE
Day 0 Day 1 Day 2
Day 3 Day 7 Day 19

Takeda California
COLONIES CAN BE SCALED TO YIELD SIMILAR TITERS
96WP 24WP 6WP SF #1 SF #2 Fed-Batch
Titer from Cell Metric Clones
375 ± 174 mg/L
Titer from Legacy Process
296 ± 208 mg/L
Scale-up was done to test direct transfer from semi-solid to liquid media
Takeda California
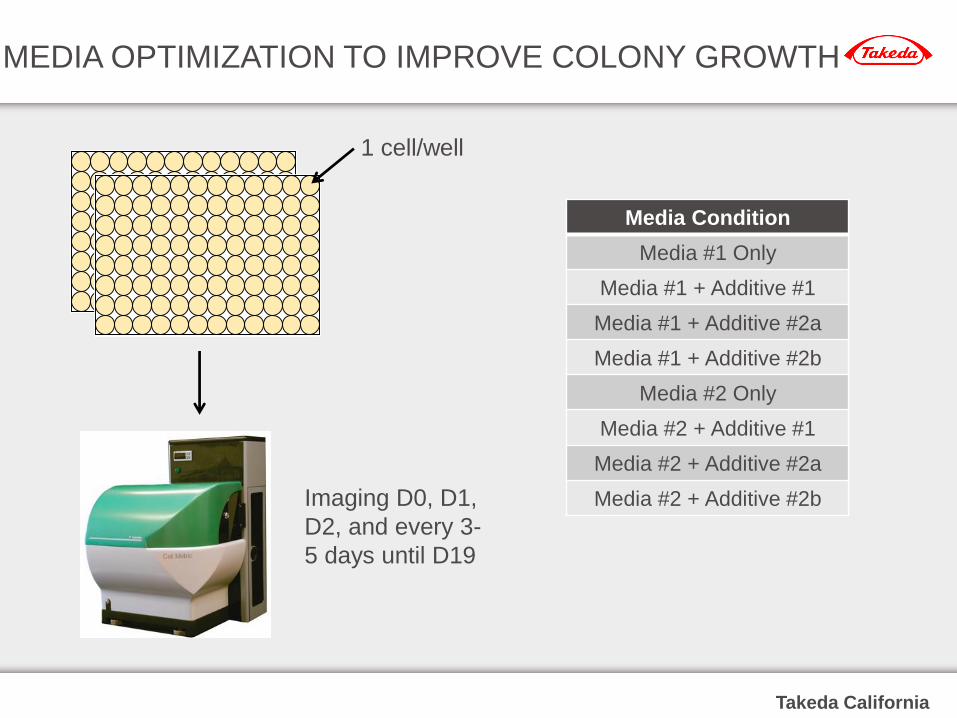
MEDIA OPTIMIZATION TO IMPROVE COLONY GROWTH
Media Condition
Media #1 Only
Media #1 + Additive #1
Media #1 + Additive #2a
Media #1 + Additive #2b
Media #2 Only
Media #2 + Additive #1
Media #2 + Additive #2a
Media #2 + Additive #2b
1 cell/well
Imaging D0, D1,
D2, and every 3-
5 days until D19

Takeda California
Media #1 Only Media #1 + Additive #1
Media #1 + Additive #2a Media #1 + Additive #2b

Takeda California
Media #2 Only Media #2 + Additive #1
Media #2 + Additive #2a Media #2 + Additive #2b

Takeda California
MEDIA #2 + ADDITIVES IMPROVED GROWTH
Media ConditionColonies from
1 cell/well*
Colonies from
>1 cell/well*
Edge + False
Negatives*
Media #1 Only 0 1 0
Media #1 + Additive #1 5 4 1
Media #1 + Additive #2a 9 8 0
Media #1 + Additive #2b 7 9 0
Media #2 Only 5 11 2
Media #2 + Additive #1 14 15 5
Media #2 + Additive #2a 14 27 13
Media #2 + Additive #2b 12 41 4
* values represent average number of colonies observed in a 96 well plate at Day19

Takeda California
1.0 cell/well 0.75 cells/well
0.50 cells/well 0.25 cells/well
WHAT SEEDING DENSITY IS OPTIMAL FOR 1 CPW?

Takeda California
LOWER SEEDING DENSITIES ARE BETTER
Both 0.50 and 0.25 cells/well had >50% of the colonies coming from 1
cell/well
Seeding Density
(cells/well)
Colonies from
1 cell/well*
Colonies from
>1 cell/well*
Edge + False
Negatives*
1.0 21 23 13
0.75 17 17 10
0.50 15 9 6
0.25 11 4 2
* values represent average number of colonies observed in a 96 well plate at Day16

Takeda California
VALIDATON: SOME WELLS ARE EASY TO ANALYZE
Day 0 Day 1 Day 2 Day 8
Day 0 Day 1 Day 5 Day 19
1 c
ell/
well
>1
cel/w
ell

Takeda California
GROWTH CAN BE TRACKED AT EDGE OF WELL
Day 0 Day 1 Day 2
Day 8 Day 12 Day 16
Takeda California
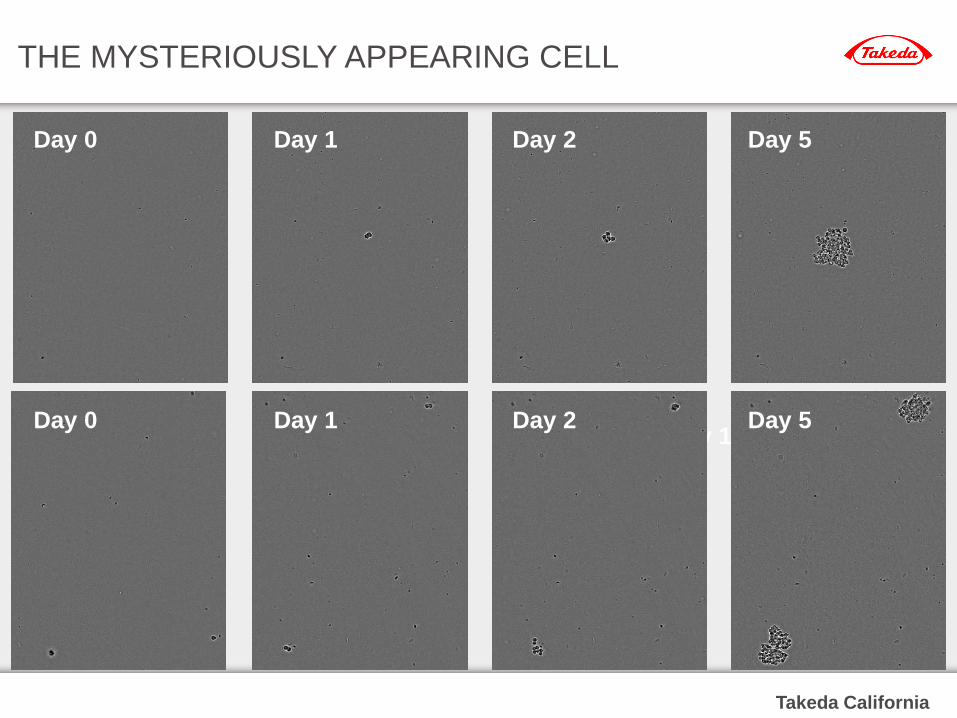
THE MYSTERIOUSLY APPEARING CELL
Day 0
Day 16
Day 1 Day 2 Day 5
Day 0 Day 1 Day 2 Day 5
Takeda California
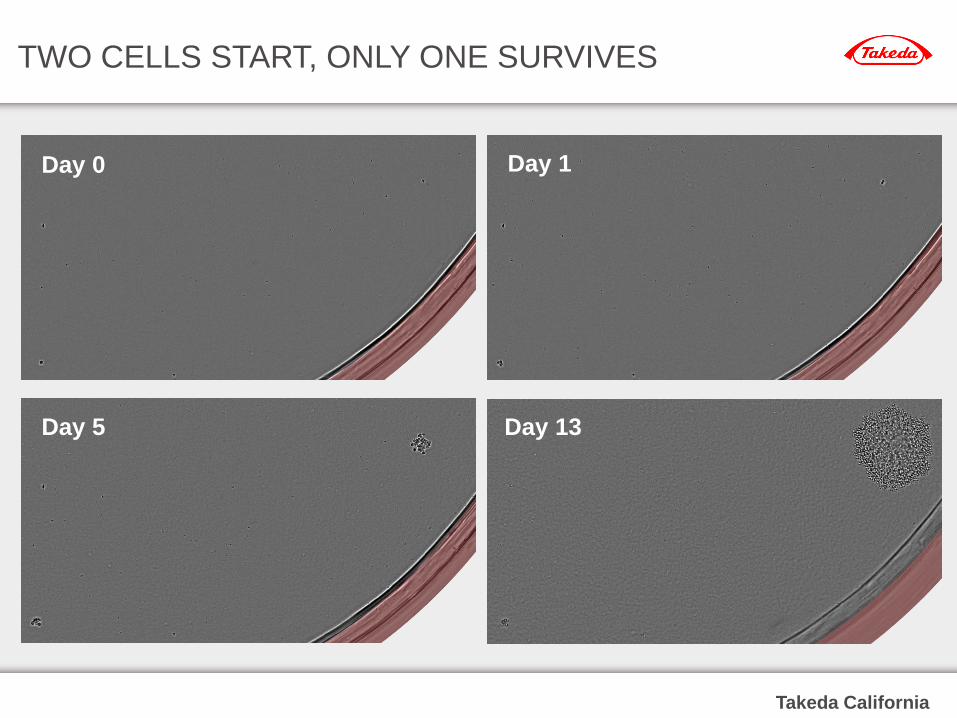
TWO CELLS START, ONLY ONE SURVIVES
Day 0 Day 1
Day 5 Day 13

Takeda California
SUMMARY OF INITIAL EVALUATION & NEXT STEPS
Be able to clearly track growth of a single cell to confluence
Semi-solid media is being used
Determine media conditions that fosters growth of single cells
A Media #2 and additive combination was identified
Reliably deposit single cells into a single well of a 96WP
Lowering the cell density increases the number of colonies
coming from 1 cell/well
Work is on-going to validate the system
Reduce the occurrence of false negatives
Is one round of subcloning sufficient?

Takeda California
ACKNOWLEDGEMENTS
Takeda California
Bhavya Kadambi
Elizabeth Stangle
Sanjay Patel
Solentim
Sky Jiang
Dave Elverd
Ian Taylor