assessment for effective intervention formative assessment
TRANSCRIPT
https://doi.org/10.1177/1534508417708183
Assessment for Effective Intervention2017, Vol. 43(1) 6 –20© Hammill Institute on Disabilities 2017Reprints and permissions: sagepub.com/journalsPermissions.navDOI: 10.1177/1534508417708183aei.sagepub.com
Special Series Article
With the ever-increasing emphasis on data-based decision making in schools, the flexibility, usability, and dependabil-ity of the data used to inform these decisions is critical. Multitiered service delivery models task educators with determining student response to evidence-based practices across tiers. Evaluating the effects of evidence-based pre-vention and intervention is predicated on the collection of reliable and valid data in a contextually appropriate manner. Unfortunately, the availability of efficient and technically adequate measures of behavior sensitive to change has lagged behind the development of those for academic achievement. Whereas the delivery of academic interven-tions is driven by a variety of academic General Outcome Measures (GOMs; Shinn & Shinn, 2002), most notably curriculum-based measurement (CBM; Deno, 2005), the availability of behavioral measures with comparable effi-ciency, technical adequacy, and sensitivity to change is less extensive (Chafouleas, 2011). Limited availability of such assessments is problematic, given maladaptive student behavior in classrooms is frequently identified as one of the most pressing issues facing educators (Liaupsin, Scott, Morris, & Mather, 2008). Many scholars and educators believe relief from this pressing issue lies in a data-driven, multitiered approach to delivery of behavioral supports in
schools (Burns & Gibbons, 2012; Fletcher & Vaughn, 2009; Jiménez, 2010).
Within multitiered, problem-solving-oriented service delivery models such as response to intervention (RtI; Burns & Gibbons, 2012), multitiered systems of support (MTSS; Gresham, 2008), or positive behavior interventions and supports (PBIS; Sugai & Simonsen, 2012), intervention selection and implementation may be best conceptualized as an experiment or, if necessary, a series of experiments. This experimental approach further illustrates the impor-tance of reliable and valid data with which to test hypothe-ses for interventions. Each experiment tests a hypothesis generated by educators’ belief that an identified evidence-based practice has a high probability of affecting student performance in a desired way. Measurement of dependent variables via repeated assessment conducted prior to and during implementation of school-based interventions allows
708183 AEIXXX10.1177/1534508417708183Assessment for Effective InterventionSims et al.research-article2017
1The University of Alabama, Tuscaloosa, USA2University of Missouri, Columbia, USA
Corresponding Author:Wesley A. Sims, Wichita State University, 1845 Fairmount St, Wichita, KS 67260, USA. Email: [email protected]
Formative Assessment Using Direct Behavior Ratings: Evaluating Intervention Effects of Daily Behavior Report Cards
Wesley A. Sims, PhD1, Chris Riley-Tillman, PhD2, and Daniel R. Cohen, MPH2
AbstractThis study examined the treatment sensitivity of Direct Behavior Rating–Single Item Scales (DBR-SIS) in response to an evidence-based intervention delivered in a single-case, multiple-baseline design. DBR-SIS was used as a formative assessment in conjunction with a frequently used intervention in schools, a Daily Behavior Report Card (DRC). The intervention and concurrent assessment were conducted by five teachers in a rural Midwestern elementary school with five male students displaying mild to moderate behavioral challenges in the classroom. Study findings indicated DBR-SIS displays appropriate treatment sensitivity following intervention implementation. Agreement in the documentation of response and nonresponse to intervention implementation between DBR-SIS and systematic direct observation (SDO) data was evident across visual and empirical analyses. In addition, through a multiple-baseline design, this study documented negligible to no change in student behavior following implementation of a DRC in an applied classroom setting. These findings support previous calls for continued examination of the forms and components of DRC employed in schools. Finally, the study found educators rated the use of a combined DRC intervention and progress monitoring with DBR-SIS as favorable.
Keywordsdirect behavior rating, Daily Behavior Report Card, behavior, intervention, behavior assessment, formative assessment, progress monitoring, single-case design research, MTSS, problem solving
Sims et al. 7
for the evaluation of this hypothesis. The term experiment is frequently associated with scholarly research. However, when conducting such experiments with evidence-based interventions as part of service delivery, educators do not seek to establish or further an evidence base for an interven-tion, rather they seek to determine whether a student responds to an intervention. An experimental, hypothesis testing perspective acknowledges even the most efficacious interventions will not positively affect learning, perfor-mance, or functioning of all students. Therefore, document-ing positive, negative, small, large, or negligible intervention effects to guide intervention activities is the paramount con-cern for educators in the applied school setting. This docu-mentation of intervention effects (or lack thereof) may be best termed sensitivity to change (Chafouleas, Sanetti, Kilgus, & Maggin, 2012) or treatment sensitivity (Fuchs & Fuchs, 1999). Numerous interrelated contextual factors have made establishing a clear and consistent definition of treatment sensitivity is and how to evaluate it difficult (Kazdin, 2005). Variability in human behavior, variability in evaluators, limited availability of assessment measures, emphasis on diagnostic assessments, acceptability of assessments, the limited scope or focus of available assess-ments, and the limited utility of findings have discouraged scholarly attention for assessment of treatment sensitivity (Kazdin, 2005). Fuchs and Fuchs (1999) conceptualized treatment sensitivity as the detection of (small) gains in skill acquisition. These gains are then compared with normative information to determine whether sufficient progress has resulted from intervention implementation (Fuchs & Fuchs, 1999). The Evidence Based Intervention Network (EBI Network; www.ebi.missouri.edu) discusses the concept of treatment sensitivity as a level or amount of measurable change in the assessment outcome; the smallest level of per-formance needed to affect measurement (EBI Network, 2015). Beaton, Bombardier, Katz, and Wright (2001) described treatment sensitivity as responsiveness, or the ability of an instrument to accurately detect change when it occurs. The concept of responsiveness or treatment sensi-tivity has been identified as critical in studies of treatment effectiveness, economic appraisals, and program evalua-tions (Beaton et al., 2001).
Well-functioning multitiered service delivery systems contain embedded assessment processes across universal, selective, and indicated levels of service delivery (Miller, Patwa, & Chafouleas, 2014). There are currently a variety of assessment tools that measure student behavior or per-ceptions of student behavior in schools, each with its own unique, contextually influenced strengths and limitations. When selecting an assessment, contextually influenced strengths and limitations should be considered carefully. For example, in a tiered service delivery framework, forma-tive assessment tools are used to evaluate intervention effectiveness over time. Therefore, a significant
consideration for selecting a progress monitoring tool should be the ability of the measure to detect gains, negli-gible response, or worsening of skill acquisition or perfor-mance over time. These data then become the basis for data-based decision making. In this regard, one of the most usable behavior assessment tools available is the Direct Behavior Rating–Single Item Scales (DBR-SIS, Christ, Riley-Tillman, & Chafouleas, 2009). Available research suggests DBR-SIS is well suited for use as a formative assessment as it possesses appropriate treatment sensitivity. Chafouleas and colleagues (2012) found strong evidence of treatment sensitivity across a variety metrics including absolute change, percent of nonoverlapping data (PND), percentage of change, effect size, Reliable Change Index (RCI) when used to evaluate the effects of evidence-based intervention. This study also noted finding consistent with previous research, indicating statistically significant asso-ciations between DBR-SIS behavior domains and system-atic direct observation (SDO; Chafouleas et al., 2012).
DBR-SIS emerged from the direct behavior rating assessment methodology, a class of assessment tools with two common features, (a) observation of student behavior and (b) ratings of student behavior immediately following the observation. To date, a wealth of research has proven DBR-SIS to be a flexible, efficient, and defensible approach to student behavior assessment (Chafouleas, Kilgus, & Hernandez, 2009; Chafouleas, Riley-Tillman, & Christ, 2009; Christ, Riley-Tillman, & Chafouleas, 2009; Riley-Tillman, Christ, Chafouleas, & Boice-Mallach, 2011). The National Center for Intensive Intervention (NCII) recog-nizes the DBR-SIS academically engaged and disruptive domains as one of few reliable and valid behavior assess-ments that are appropriately sensitive to change (American Institutes for Research, n.d.). The evidence supporting DBR-SIS suggests it is particularly advantageous given it assesses student behavior in a reliable, valid, flexible, and defensible manner while using low inference and minimally taxing methods and procedures (Volpe & Briesch, 2012). Although the evidence base for DBR-SIS now appears ample, it is critical to continue to explore the utility of DBR-SIS across a variety of applications and interpretations.
This study presents finding from an examination of DBR-SIS’s utility as a formative assessment with which to guide data-based decision making within a problem-solving service delivery framework. This study examined DBR-SIS’s treat-ment sensitivity or sensitivity to change, in response to an evidence-based intervention delivered in a single-case, multi-ple-baseline design. Like many other assessments, evaluation of DBR-SIS has focused primarily on the development of the assessment and psychometric evidence supporting the broad behavior domains (Chafouleas et al., 2012). To date, a single study has examined DBR-SIS’s sensitivity to change. This suggests, additionally, scrutiny of the utility of DBR-SIS as a formative assessment is warranted. This study presents
8 Assessment for Effective Intervention 43(1)
results from a project evaluating the use of DBR-SIS to eval-uate the effects of a frequently used evidence-based interven-tion, Daily Behavior Report Cards (DRCs; Riley-Tillman, Chafouleas, & Briesch, 2007). This study included four goals. First, this study examined the treatment sensitivity of DBR-SIS data. Second, this study sought to examine the agreement or consistency between DBR-SIS and SDO data. Third, this project sought to evaluate the effects of the DRC intervention on study participants. Finally, the social validity of this joint use of DBR-SIS and DRC for intervention and assessment was evaluated. Specific goals of this study included the following:
1. To examine the treatment sensitivity of DBR-SIS, or the degree to which this measure captures interven-tion effects (or lack thereof).
2. To examine consistency between DBR-SIS and SDO in assessing intervention effects.
3. Evaluate the effects of a DRC intervention for the five students included in this study.
4. Examine the social validity of a combined DRC intervention with concurrent progress monitoring with DBR-SIS.
Method
Participants
To identify possible participants, teachers were given a description of the proposed study and asked to identify stu-dents with mild to moderate attention maintained behav-iors. Attention maintained behavioral challenges were targeted based on the functional match between such behavior and DRC interventions (McIntosh, Campbell, Carter, & Rossetto Dickey, 2009). Study descriptions and consent forms were sent home to potential intervention participants. The first five students who returned com-pleted consent forms were included in the study. The five student–teacher combinations were from a rural Midwestern elementary school serving approximately 350 students in Grades 3 to 5. Each grade level was represented in this study, with two student–teacher combinations in fourth and fifth grades. Class sizes ranged between 20 and 25 students in each of the participating classrooms. No student partici-pants were reported to have received any ongoing psycho-pharmacological, medical, behavioral, or mental health treatment at the time of this study. This participant group was homogeneous as all students were White males not currently receiving special education services and all teachers were White females teaching in general education classrooms.
Teacher–Student Pair 1. Student 1’s intervention and DBR-SIS ratings were completed by a teacher in her third year
teaching fourth grade. She reported having a bachelor’s degree and elementary teaching certificate from the state in elementary education. Student 1 was a 10-year, 8-month-old White male in fourth grade. During this school year, Student 1 received minor disciplinary actions for being out of his seat, talking out, talking to peers, noncompliance with teacher directions, and failing to complete work. No academic concerns were noted for this student. He was reported to perform at or above grade level in all subject areas. Current supplemental supports for this student included a behavior improvement plan (BIP) developed and implemented by the classroom teacher with no remarkable improvements.
Teacher–Student Pair 2. Intervention implementation and DBR-SIS ratings for Student 2 were completed by an ele-mentary certified teacher in her fifth year teaching third grade and 18th year teaching overall. She reported her edu-cation level was a master’s +15 (15 or more hours of grad-uate-level course work). Student 2 was a 9-year, 6-month-old White male in third grade. Student 2 was identified for par-ticipation primarily for concerns with “staying on task in the classroom.” The teacher believed the student’s off-task behavior interfered with work completion and class partici-pation, which negatively impacted his report card grades. At the time of this study, this student had received seven office discipline referrals for defiance, physical aggression, and inappropriate language. Student 2’s off-task behaviors included, (apparently) daydreaming for longer than 5 s, calling out, talking to peers, touching others, and getting out of his seat. The teacher reported minor academic concerns for this student in regard to his reading fluency. To address these concerns, he received an individualized reading inter-vention targeting reading fluency 4 times each week with a student teacher.
Teacher–Student Pair 3. Intervention and DBR-SIS ratings for Student 3 were completed by an elementary certified teacher in her fourth year teaching fifth grade. This was her sixth year teaching overall. She was a White female and had a master’s degree in literacy. Student 3 was an 11-year, 9-month-old White male in fifth grade with problematic behaviors that included talking to peers, calling out answers, and being out of his seat. This student received 10 office discipline referrals and one 2-day suspension. Infractions resulting in these referrals included defiance, disrespect, noncompliance, physical aggression, and disruption. This student’s suspension was for physical aggression. At the time of this study, this student was not receiving any supple-mental academic supports. This student was reported to per-form in the top third of his grade in all academic subject areas. Interviews with the teacher indicated Student 3’s most difficult time of day was late in the school day during math, his strongest subject.
Sims et al. 9
Teacher–Student Pair 4. Student 4’s intervention and DBR-SIS ratings were completed by a White female in her fourth year teaching. All of her teaching experience came at the fourth-grade level. She reported having a bachelor’s degree and elementary teaching certification from the state depart-ment of education. Student 4 was a 10-year, 7-month-old White male in fourth grade with problematic behaviors that included defiance, arguing or talking back, physical aggres-sion toward peers, being out of his seat, inattention, and talk-ing to peers. This student is reported to have been referred to the office and suspended this school year. Behavior infrac-tions resulting in these disciplinary infractions included physical aggression, defiance, disrespect, and classroom dis-ruption. The teacher reported Student 4 received additional supports in reading and math. The classroom teacher worked with him in math multiple times per week in a small group setting and supplemental guided reading support was deliv-ered by a high school volunteer twice weekly.
Teacher–Student Pair 5. Student 5’s intervention implementa-tion and DBR-SIS ratings were completed by a White female teacher in her third year teaching fifth grade. This was also her third year of teaching overall. She reported having a bachelor’s degree and elementary teaching certificate from the state in elementary education. Student 5 was an 11-year, 2-month-old White male in fifth grade. He was reported to have trouble with disruptive and off-task behavior. These behaviors looked like talking out, calling out answers, talking to peers, getting out of his seat, and not engaging in class-room instructional activities for more than 5 s. Student 5 was reported to perform at or above grade level in all academic subjects. He received no documented office discipline refer-rals in the school year this study occurred.
Measures
DBR-SIS. DBR-SIS is a brief set of ratings of student behav-ior following a direct observation period (Chafouleas, Riley-Tillman, & Sugai, 2007). DBR-SIS asks teachers to rate the proportion of time a target student is actively engaged, disruptive, and respectful during a specified observation period, often group instruction, in an academic subject or a larger portion of the school day (e.g., first half of the day). After the observation period ends, teachers rate the portion of the observation the target student engaged in behaviors making up broad behavior domains (academi-cally engaged = AE, respectful = R, disruptive = D) behav-iors using a 0- to 10-point scale. The scale includes an anchor system based on percentage of an observation period a target displayed behaviors consistent with a given DBR behavior domain (e.g., 0 = 0%, 5 = 50%, and 10 = 100%).
SDO. Twenty-minute momentary time sampling observa-tions were conducted using a protocol created for this study.
Observations were conducted by graduate research assis-tants who completed a 1-hr training followed by reliability checks for this observation procedure. Observers were required to reach 90% reliability before conducting in-study observations. This protocol was developed based on a model provided by the State-Event Classroom Observation System (SECOS). For this momentary time sampling pro-cedure, observers indicated whether participating students displayed or engaged in target behaviors (e.g., actively engage, disruption, and respect) at the end of a 20-s interval (i.e., rating occurred on the 20th second of each interval). SDO target behaviors were selected based on their align-ment with operational definitions of DBR-SIS. The total number of intervals at which a targeted behavior was observed was divided by the total number of intervals to determine a percentage. This represented the percentage of an observation period that a targeted behavior was observed.
User Rating Profile–Intervention Revised (URP-IR). The URP-IR (Briesch, Chafouleas, Neugebauer, & Riley-Tillman, 2013) asks individuals to respond to a series of items exam-ining the perceived usability of an intervention. Items are scored using ratings from 1 to 6. Lower scores indicate dis-agreement with statements in regard to intervention usabil-ity, whereas higher scores indicate agreement with these statements (e.g., 1 = strongly disagree, 2 = disagree, 3 = slightly disagree, 4 = slightly agree, 5 = agree, and 6 = strongly agree). The revised URP-IR, developed by Briesch and colleagues (2013), yielded a four-factor structure that provides information concerning intervention usage in the areas of acceptability, understanding, feasibility, and sys-tems support. Internal consistency was high for acceptabil-ity (α = .96), understanding (α = .90), feasibility (α = .90), and systems support (α = .84) factors of the URP-IR (Cha-fouleas, Briesch, Riley-Tillman, & McCoach, 2009). Dis-criminant validity for the URP-IR are noted in large correlations between the subscales of Acceptability and Integrity (r = .66), Acceptability and Feasibility (r = .60), and Integrity and Feasibility (r = .61; Chafouleas, Riley-Tillman, Briesch, & Chanese, 2008).
Procedure
Teachers participating in this study completed a 40-min video-based DBR-SIS training and reliability check for DBR-SIS. Data collection training was conducted for all observers participating in the study. This training included reliability checks for the SDO collection procedure. Observers were required to reach interrater reliability of 90% or above before collecting data for this study.
After obtaining consent for participating students, the first of three formal consultation meetings were scheduled. A standardized consultation process consistent with the pro-cess outlined by Erchul and Martens (2010) was used to
10 Assessment for Effective Intervention 43(1)
guide intervention implementation. This school-based con-sultation process consisted of an initial Problem Identification Interview (PII), followed by a Problem Analysis Interview (PAI), and later the Problem Evaluation Interview (PEI).
Through the PII, problematic behaviors were identi-fied. Data collection with DBR-SIS as the primary out-come measure with SDO serving as a concurrent evaluation mechanism began following the PII. Data collection began in baseline phases and continued through implementation of DRC for each case. For 20% of all SDO observations overall, multiple raters were used to allow for calculation of interrater agreement (IOA). Interrater reliability was calculated by dividing the number of intervals for which the observers agreed by the number of intervals observed. If at any point IOA dropped below 90%, observers were to meet with the study’s coordinating researcher to determine whether additional reliability training and practice were required. At no point during the study did interrater reli-ability drop below 90%. Average percent agreement for all SDO categories including academic engagement, respect-ful, and disruptive behavior were greater than 90%. A similar IOA procedure was not conducted for teacher DBR-SIS ratings.
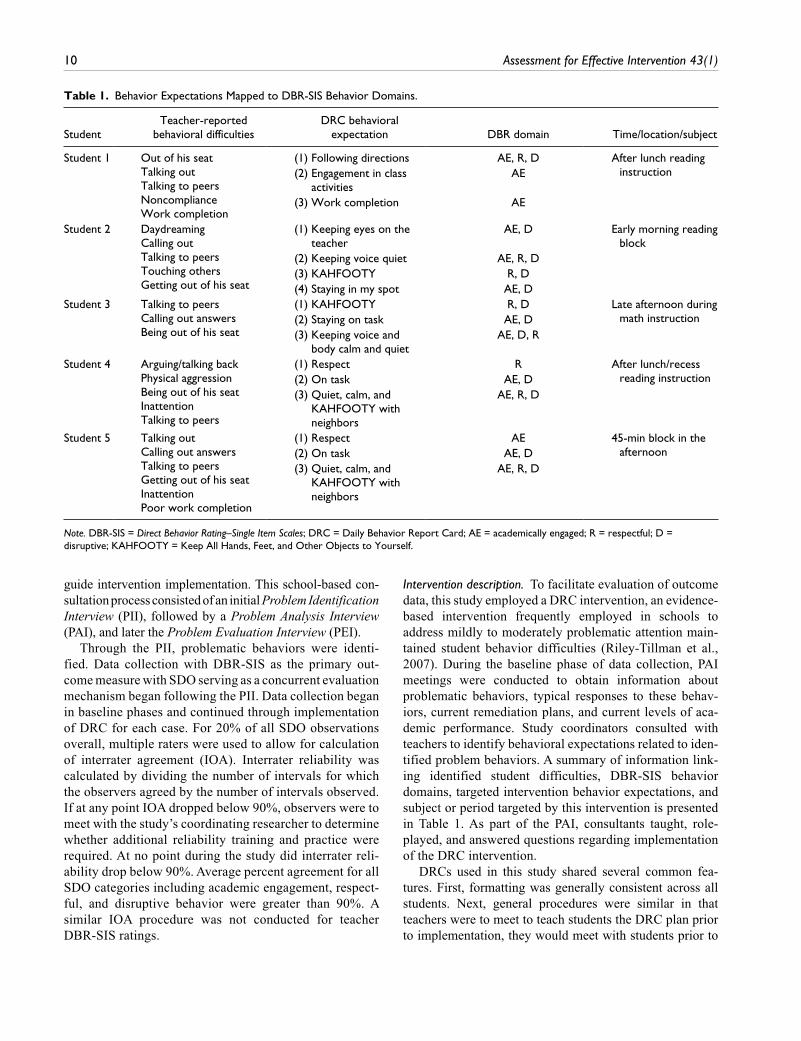
Intervention description. To facilitate evaluation of outcome data, this study employed a DRC intervention, an evidence-based intervention frequently employed in schools to address mildly to moderately problematic attention main-tained student behavior difficulties (Riley-Tillman et al., 2007). During the baseline phase of data collection, PAI meetings were conducted to obtain information about problematic behaviors, typical responses to these behav-iors, current remediation plans, and current levels of aca-demic performance. Study coordinators consulted with teachers to identify behavioral expectations related to iden-tified problem behaviors. A summary of information link-ing identified student difficulties, DBR-SIS behavior domains, targeted intervention behavior expectations, and subject or period targeted by this intervention is presented in Table 1. As part of the PAI, consultants taught, role-played, and answered questions regarding implementation of the DRC intervention.
DRCs used in this study shared several common fea-tures. First, formatting was generally consistent across all students. Next, general procedures were similar in that teachers were to meet to teach students the DRC plan prior to implementation, they would meet with students prior to
Table 1. Behavior Expectations Mapped to DBR-SIS Behavior Domains.
StudentTeacher-reported
behavioral difficultiesDRC behavioral
expectation DBR domain Time/location/subject
Student 1 Out of his seatTalking outTalking to peersNoncomplianceWork completion
(1) Following directions AE, R, D After lunch reading instruction(2) Engagement in class
activitiesAE
(3) Work completion AE
Student 2 DaydreamingCalling outTalking to peersTouching othersGetting out of his seat
(1) Keeping eyes on the teacher
AE, D Early morning reading block
(2) Keeping voice quiet AE, R, D(3) KAHFOOTY R, D(4) Staying in my spot AE, D
Student 3 Talking to peersCalling out answersBeing out of his seat
(1) KAHFOOTY R, D Late afternoon during math instruction(2) Staying on task AE, D
(3) Keeping voice and body calm and quiet
AE, D, R
Student 4 Arguing/talking backPhysical aggressionBeing out of his seatInattentionTalking to peers
(1) Respect R After lunch/recess reading instruction(2) On task AE, D
(3) Quiet, calm, and KAHFOOTY with neighbors
AE, R, D
Student 5 Talking outCalling out answersTalking to peersGetting out of his seatInattentionPoor work completion
(1) Respect AE 45-min block in the afternoon(2) On task AE, D
(3) Quiet, calm, and KAHFOOTY with neighbors
AE, R, D
Note. DBR-SIS = Direct Behavior Rating–Single Item Scales; DRC = Daily Behavior Report Card; AE = academically engaged; R = respectful; D = disruptive; KAHFOOTY = Keep All Hands, Feet, and Other Objects to Yourself.
Sims et al. 11
the time period in which the DRC would be used, behav-ioral expectations were limited to no more than five, teach-ers were asked to send DRCs home for parents daily, and rewards would be delivered daily. During implementation, student–teacher meetings prior to intervention periods included a review of the behavioral expectations, how points were earned, and how and when points would be redeemed. DRC points awarded each day were converted to points (DRC score of 5 is the equivalent 5 points) and points were accumulated over time and redeemed for rewards. Rewards for DRCs used in the study were arranged on a menu grouped into a hierarchy with more costly (time, resources, or money) rewards requiring more points to access. Examples of rewards on menus included candy, computer time, extra recess, lunch with the teacher, and pizza. Students could earn an extra point each day for obtaining a parent signature on the DRC each day. Finally, all DRCs in this study were abbreviated to encompass a smaller, targeted instructional period. Often DRCs encom-pass larger time periods such as an entire school day.
Social validity. Following completion of the intervention phase, consultants met with participating teachers for PEI meetings. Consultants presented intervention results, dis-cussed results, collected permanent products, and adminis-tered the URP-IR.
Analytic Plan
Treatment sensitivity/DBR-SIS–SDO agreement. This study employed a single-subject, multiple-baseline A-B design to allow for the examination of changes in dependent/outcome variables (DBR-SIS scores) following the introduction of the independent variable (DRC intervention). Treatment sensitivity and consistency/agreement in responsiveness to intervention effects between DBR-SIS and SDO data were examined in three ways. First, similarity in visual analy-sis of level, trend, immediacy/latency, and variability was examined. Next, phase means of data sources were com-pared. Finally, consistency between data-based decisions regarding intervention effectiveness was compared.
Intervention effects. RtI effects were evaluated using DBR-SIS data. Study coordinators conducted intervention activities in a manner consistent with What Works Clear-inghouse (WWC; Clearinghouse, 2014) guidelines for single-case design research. Intervention and data collec-tion activities included at least six phases (i.e., at least three baseline and three intervention phases across three cases, in this case five for each). In addition, a minimum of five data points were obtained within each of the phases, with phases occurring concurrently across participants (Clearinghouse, 2014). In keeping with prevailing analytic recommendations for establishing relationships within in single-case designs
(see Kratochwill et al., 2010; Riley-Tillman & Burns, 2010), two forms of data analysis were conducted: visual inspection of graphed data and empirical statistical analyses. Empirical analysis included calculation of Tau-U statistic. Tau-U is a nonoverlap technique that adjusts for trend in data. Tau-U was employed to control for trend and allow for identifica-tion of modest changes to the effect size, not always identi-fied by other nonoverlap techniques. Finally, to examine the social validity of this DRC intervention and associated prog-ress monitoring using DBR-SIS, URP-IR scores across sev-eral domains making up overall usability were calculated.
Results
Implementation Fidelity
Implementation fidelity is critical to making reliable deci-sions about intervention effects. Fidelity of DRC implemen-tation was first documented through the formal consultation process. Fidelity to the consultation process was assessed by calculating the steps completed on the Problem Identification Inventory, Problem Analysis Inventory, and Problem Evaluation Inventory completed by the consultant with the teacher. For all cases, 100% of formal consultation steps were completed. Implementation fidelity of the DRC inter-vention was evaluated via follow-up observations, check-ins, and collection of permanent products. Fidelity checks targeted per-correct conversations around targeted DRC behaviors prior to a rating period, rating of target behaviors following an observation period, teacher–student discussion of DRC ratings, distribution of incentives, and sharing of DRC with parents or guardians daily. In two instances for the same teacher, implementation of the DRC was judged to be inconsistent with procedures outlined in the PAI. For Student–Teacher Pair 2, the teacher initially neglected to dis-cuss DRC target behaviors prior to each rating period and did not send the DRC home at the end of each day. These inconsistencies were discovered after the first observation following the transition to intervention phase (second over-all day of intervention). Consultants met with this teacher and DRC procedures were revisited and corrections were made. Given implementation fidelity was strong, any effects noted in student performance can be reliably attributed to impact of the DRC intervention.
Treatment Sensitivity
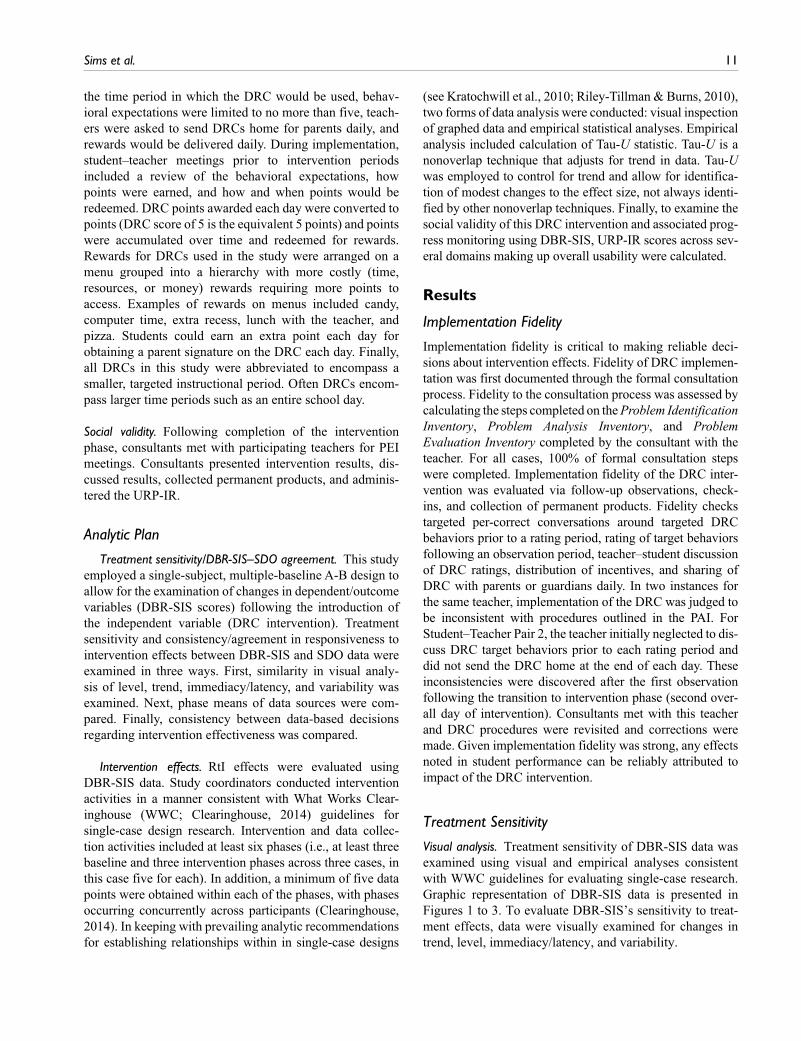
Visual analysis. Treatment sensitivity of DBR-SIS data was examined using visual and empirical analyses consistent with WWC guidelines for evaluating single-case research. Graphic representation of DBR-SIS data is presented in Figures 1 to 3. To evaluate DBR-SIS’s sensitivity to treat-ment effects, data were visually examined for changes in trend, level, immediacy/latency, and variability.
12 Assessment for Effective Intervention 43(1)
Figure 1. Graphic representation of DBR and SDO academically engaged data.Note. BL = Baseline; DBR = direct behavior rating; SDO = systematic direct observation.
Sims et al. 13
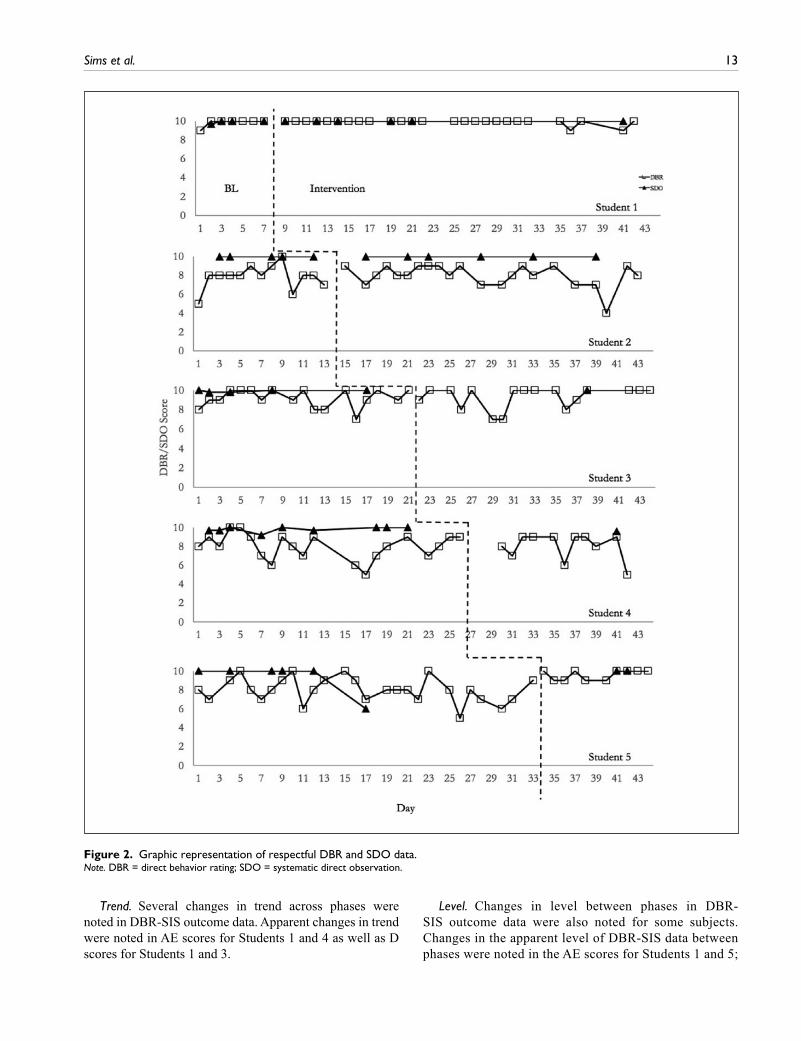
Trend. Several changes in trend across phases were noted in DBR-SIS outcome data. Apparent changes in trend were noted in AE scores for Students 1 and 4 as well as D scores for Students 1 and 3.
Level. Changes in level between phases in DBR-SIS outcome data were also noted for some subjects. Changes in the apparent level of DBR-SIS data between phases were noted in the AE scores for Students 1 and 5;
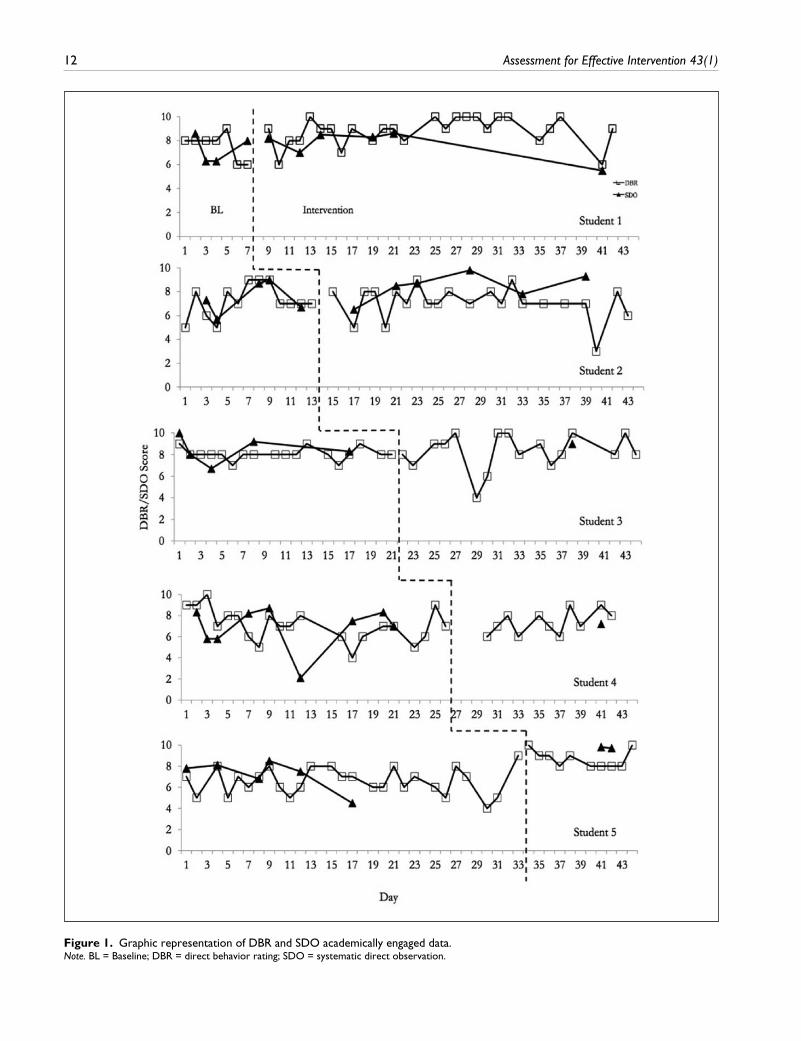
Figure 2. Graphic representation of respectful DBR and SDO data.Note. DBR = direct behavior rating; SDO = systematic direct observation.
14 Assessment for Effective Intervention 43(1)
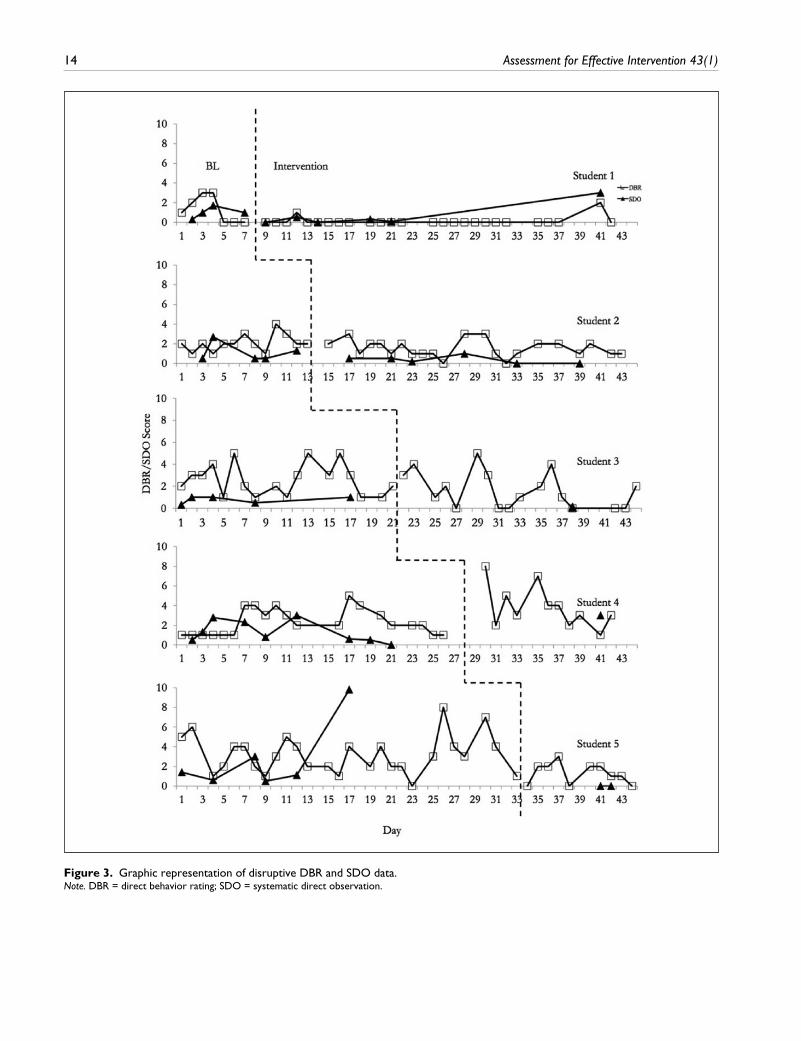
Figure 3. Graphic representation of disruptive DBR and SDO data.Note. DBR = direct behavior rating; SDO = systematic direct observation.
Sims et al. 15
R scores for Students 1, 4, and 5; and D scores for Stu-dents 1, 4, and 5.
Immediacy/latency. Immediacy/latency changes across phases were also evident in the DBR-SIS data. Changes in immediacy/latency of DBR-SIS scores were noted in the AE for Student 5, R for Student 5, and D for Students 4 and 5.
Variability. Several changes in variability are evident between phases in DBR-SIS outcome data. Apparent changes in variability were noted in AE scores for Students 2, 4, and 5; R scores for Students 4 and 5; and D scores for Students 1 and 5.
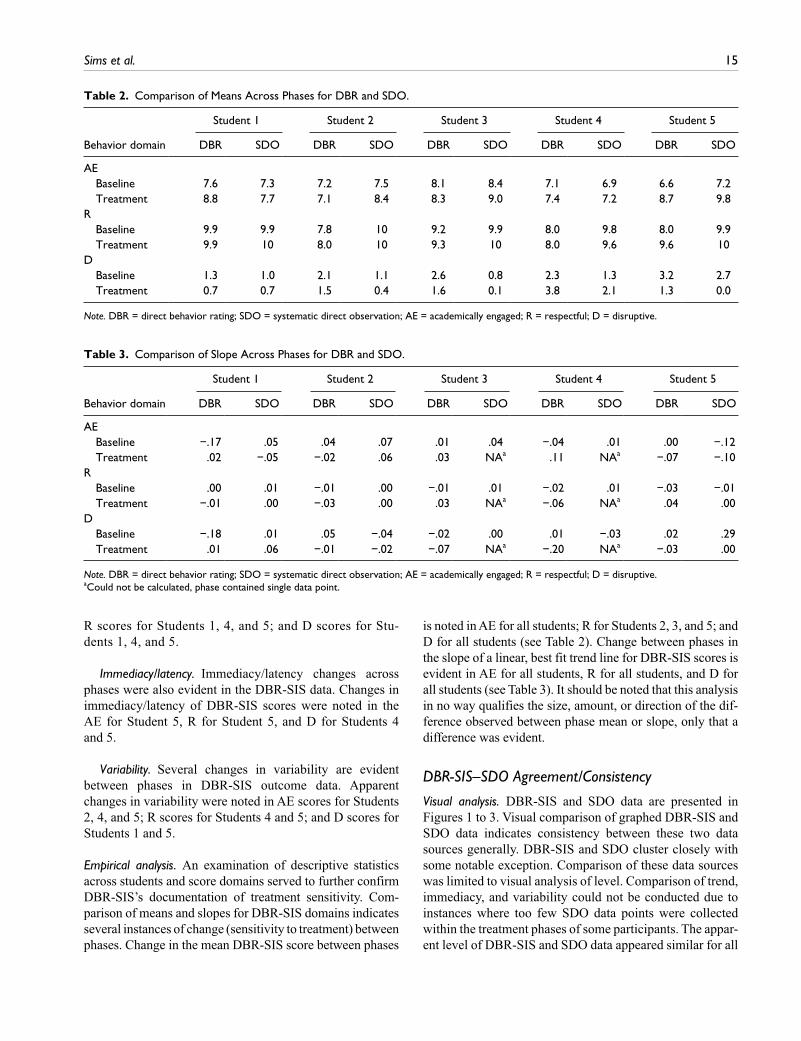
Empirical analysis. An examination of descriptive statistics across students and score domains served to further confirm DBR-SIS’s documentation of treatment sensitivity. Com-parison of means and slopes for DBR-SIS domains indicates several instances of change (sensitivity to treatment) between phases. Change in the mean DBR-SIS score between phases
is noted in AE for all students; R for Students 2, 3, and 5; and D for all students (see Table 2). Change between phases in the slope of a linear, best fit trend line for DBR-SIS scores is evident in AE for all students, R for all students, and D for all students (see Table 3). It should be noted that this analysis in no way qualifies the size, amount, or direction of the dif-ference observed between phase mean or slope, only that a difference was evident.
DBR-SIS–SDO Agreement/Consistency
Visual analysis. DBR-SIS and SDO data are presented in Figures 1 to 3. Visual comparison of graphed DBR-SIS and SDO data indicates consistency between these two data sources generally. DBR-SIS and SDO cluster closely with some notable exception. Comparison of these data sources was limited to visual analysis of level. Comparison of trend, immediacy, and variability could not be conducted due to instances where too few SDO data points were collected within the treatment phases of some participants. The appar-ent level of DBR-SIS and SDO data appeared similar for all
Table 2. Comparison of Means Across Phases for DBR and SDO.
Behavior domain
Student 1 Student 2 Student 3 Student 4 Student 5
DBR SDO DBR SDO DBR SDO DBR SDO DBR SDO
AE Baseline 7.6 7.3 7.2 7.5 8.1 8.4 7.1 6.9 6.6 7.2 Treatment 8.8 7.7 7.1 8.4 8.3 9.0 7.4 7.2 8.7 9.8R Baseline 9.9 9.9 7.8 10 9.2 9.9 8.0 9.8 8.0 9.9 Treatment 9.9 10 8.0 10 9.3 10 8.0 9.6 9.6 10D Baseline 1.3 1.0 2.1 1.1 2.6 0.8 2.3 1.3 3.2 2.7 Treatment 0.7 0.7 1.5 0.4 1.6 0.1 3.8 2.1 1.3 0.0
Note. DBR = direct behavior rating; SDO = systematic direct observation; AE = academically engaged; R = respectful; D = disruptive.
Table 3. Comparison of Slope Across Phases for DBR and SDO.
Behavior domain
Student 1 Student 2 Student 3 Student 4 Student 5
DBR SDO DBR SDO DBR SDO DBR SDO DBR SDO
AE Baseline −.17 .05 .04 .07 .01 .04 −.04 .01 .00 −.12 Treatment .02 −.05 −.02 .06 .03 NAa .11 NAa −.07 −.10R Baseline .00 .01 −.01 .00 −.01 .01 −.02 .01 −.03 −.01 Treatment −.01 .00 −.03 .00 .03 NAa −.06 NAa .04 .00D Baseline −.18 .01 .05 −.04 −.02 .00 .01 −.03 .02 .29 Treatment .01 .06 −.01 −.02 −.07 NAa −.20 NAa −.03 .00
Note. DBR = direct behavior rating; SDO = systematic direct observation; AE = academically engaged; R = respectful; D = disruptive.aCould not be calculated, phase contained single data point.
16 Assessment for Effective Intervention 43(1)
students within all phases for academically engaged, seven of 10 phases for respectful behavior, and six of 10 phases for disruptive behavior. Although level appeared different in seven of 30 phases overall, these differences appeared slight. A point-by-point visual comparison indicated the typical difference between DBR-SIS and SDO appeared to be less than 2 points. It appeared that in five instances, the DBR-SIS–SDO difference fell between 2 and 3 points. Finally, it appeared that in two instances the difference exceeded 3 points. These rare, but extreme differences were noted in AE score for Student 4 on Day 4 and Day 12 as well as in the D score for Student 5 on Day 17. When examined collectively, these limited instances of poor agreement between DBR-SIS and SDO did effect interpre-tation of data.
Empirical analysis. Similar agreement is noted in the exam-ination of empirical information for these data sources. The difference between mean academic engagement DBR-SIS and SDO scores across all students ranged from a difference of 0.3 to −0.6 points for baseline phases and of 0.2 to 1.3 points for treatment phases (see Table 2). The differences between mean respectful DBR-SIS and SDO scores across all students ranged from 0 to 2.2 points for baseline phases and 0.1 to 2 for treatment phases. The dif-ference between mean disruptive DBR-SIS and SDO scores across all students ranged from 0.3 to 1.8 points for baseline phases and 0 to 1.7 for treatment phases. The mean difference across all students and phases was .12 points. Finally, a final metric for comparison of these data sources focused on the data-based decisions reached as the result reviewing each of the sources. This is to say deci-sion making for intervention effectiveness using DBR-SIS and SDO data was compared for consistency (e.g., using either data source results in the same conclusions regard-ing intervention effectiveness). Reviewing DBR-SIS and SDO data results in a determination of remarkable improvement in AE and D outcome data for Student 5. Small intervention effects were noted in AE for Student 1. Nonresponse was consistent across the remaining behav-ior domains of participating students.
Intervention Effects
Visual analysis. Unlike treatment sensitivity, to evaluate intervention effectiveness, visual analysis examined respon-siveness for significant or noteworthy desirable changes in trend, level, immediacy, latency, and variability.
Trend. An apparent change in trend was noted in AE scores for Student 1. A downward trend for the AE scores of Student 1 appeared in the baseline phase. Following imple-mentation of the intervention, the trend appears to change to a slightly positive trajectory.
Level. Changes between phases in the level of DBR-SIS outcome data were also noted for some subjects. A notewor-thy change in level was noted in the AE, R, and D scores for Student 5. The level, or apparent phase mean, appears to shift in the desired direction (down for D) following inter-vention implementation.
Immediacy/latency. Immediacy/latency change across phase was evident in all DBR-SIS data for Student 5. Note-worthy and desired change was noted between the last three data points of the baseline phase and first three data points of the intervention phase of AE, R, and D scores for Student 5.
Variability. Noteworthy change in data variability between phases was noted in DBR-SIS outcome data in the AE, R, and D scores for Student 5 and D scores for Student 1. A decrease in variability or increase in stability is noted for these students in their respective behavior domains.
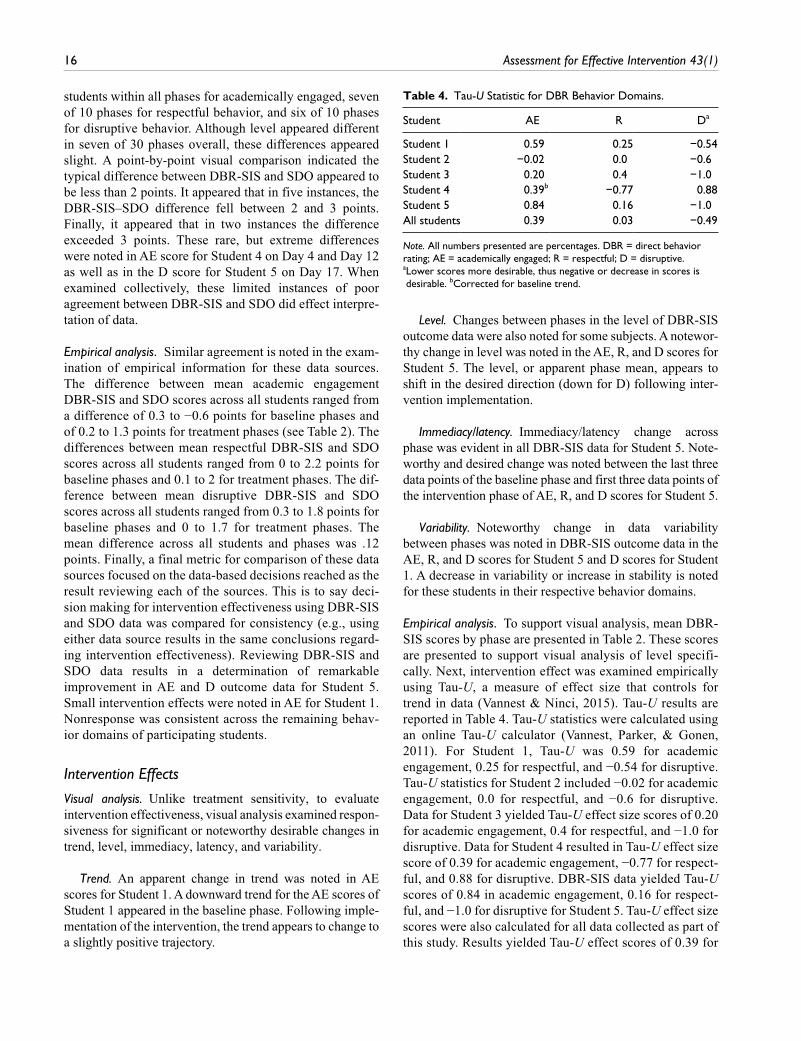
Empirical analysis. To support visual analysis, mean DBR-SIS scores by phase are presented in Table 2. These scores are presented to support visual analysis of level specifi-cally. Next, intervention effect was examined empirically using Tau-U, a measure of effect size that controls for trend in data (Vannest & Ninci, 2015). Tau-U results are reported in Table 4. Tau-U statistics were calculated using an online Tau-U calculator (Vannest, Parker, & Gonen, 2011). For Student 1, Tau-U was 0.59 for academic engagement, 0.25 for respectful, and −0.54 for disruptive. Tau-U statistics for Student 2 included −0.02 for academic engagement, 0.0 for respectful, and −0.6 for disruptive. Data for Student 3 yielded Tau-U effect size scores of 0.20 for academic engagement, 0.4 for respectful, and −1.0 for disruptive. Data for Student 4 resulted in Tau-U effect size score of 0.39 for academic engagement, −0.77 for respect-ful, and 0.88 for disruptive. DBR-SIS data yielded Tau-U scores of 0.84 in academic engagement, 0.16 for respect-ful, and −1.0 for disruptive for Student 5. Tau-U effect size scores were also calculated for all data collected as part of this study. Results yielded Tau-U effect scores of 0.39 for
Table 4. Tau-U Statistic for DBR Behavior Domains.
Student AE R Da
Student 1 0.59 0.25 −0.54Student 2 −0.02 0.0 −0.6Student 3 0.20 0.4 −1.0Student 4 0.39b −0.77 0.88Student 5 0.84 0.16 −1.0All students 0.39 0.03 −0.49
Note. All numbers presented are percentages. DBR = direct behavior rating; AE = academically engaged; R = respectful; D = disruptive.a Lower scores more desirable, thus negative or decrease in scores is desirable. bCorrected for baseline trend.
Sims et al. 17
academically engaged, 0.03 for respectful, and −0.49 for disruptive.
Social Validity
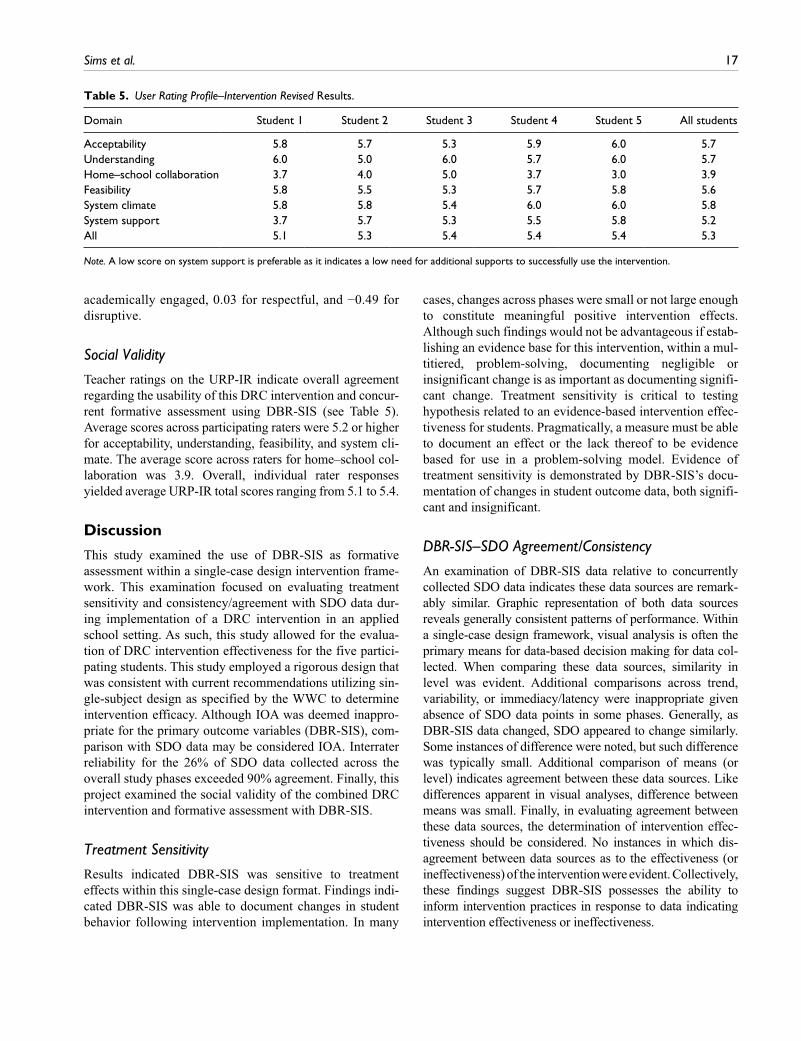
Teacher ratings on the URP-IR indicate overall agreement regarding the usability of this DRC intervention and concur-rent formative assessment using DBR-SIS (see Table 5). Average scores across participating raters were 5.2 or higher for acceptability, understanding, feasibility, and system cli-mate. The average score across raters for home–school col-laboration was 3.9. Overall, individual rater responses yielded average URP-IR total scores ranging from 5.1 to 5.4.
Discussion
This study examined the use of DBR-SIS as formative assessment within a single-case design intervention frame-work. This examination focused on evaluating treatment sensitivity and consistency/agreement with SDO data dur-ing implementation of a DRC intervention in an applied school setting. As such, this study allowed for the evalua-tion of DRC intervention effectiveness for the five partici-pating students. This study employed a rigorous design that was consistent with current recommendations utilizing sin-gle-subject design as specified by the WWC to determine intervention efficacy. Although IOA was deemed inappro-priate for the primary outcome variables (DBR-SIS), com-parison with SDO data may be considered IOA. Interrater reliability for the 26% of SDO data collected across the overall study phases exceeded 90% agreement. Finally, this project examined the social validity of the combined DRC intervention and formative assessment with DBR-SIS.
Treatment Sensitivity
Results indicated DBR-SIS was sensitive to treatment effects within this single-case design format. Findings indi-cated DBR-SIS was able to document changes in student behavior following intervention implementation. In many
cases, changes across phases were small or not large enough to constitute meaningful positive intervention effects. Although such findings would not be advantageous if estab-lishing an evidence base for this intervention, within a mul-titiered, problem-solving, documenting negligible or insignificant change is as important as documenting signifi-cant change. Treatment sensitivity is critical to testing hypothesis related to an evidence-based intervention effec-tiveness for students. Pragmatically, a measure must be able to document an effect or the lack thereof to be evidence based for use in a problem-solving model. Evidence of treatment sensitivity is demonstrated by DBR-SIS’s docu-mentation of changes in student outcome data, both signifi-cant and insignificant.
DBR-SIS–SDO Agreement/Consistency
An examination of DBR-SIS data relative to concurrently collected SDO data indicates these data sources are remark-ably similar. Graphic representation of both data sources reveals generally consistent patterns of performance. Within a single-case design framework, visual analysis is often the primary means for data-based decision making for data col-lected. When comparing these data sources, similarity in level was evident. Additional comparisons across trend, variability, or immediacy/latency were inappropriate given absence of SDO data points in some phases. Generally, as DBR-SIS data changed, SDO appeared to change similarly. Some instances of difference were noted, but such difference was typically small. Additional comparison of means (or level) indicates agreement between these data sources. Like differences apparent in visual analyses, difference between means was small. Finally, in evaluating agreement between these data sources, the determination of intervention effec-tiveness should be considered. No instances in which dis-agreement between data sources as to the effectiveness (or ineffectiveness) of the intervention were evident. Collectively, these findings suggest DBR-SIS possesses the ability to inform intervention practices in response to data indicating intervention effectiveness or ineffectiveness.
Table 5. User Rating Profile–Intervention Revised Results.
Domain Student 1 Student 2 Student 3 Student 4 Student 5 All students
Acceptability 5.8 5.7 5.3 5.9 6.0 5.7Understanding 6.0 5.0 6.0 5.7 6.0 5.7Home–school collaboration 3.7 4.0 5.0 3.7 3.0 3.9Feasibility 5.8 5.5 5.3 5.7 5.8 5.6System climate 5.8 5.8 5.4 6.0 6.0 5.8System support 3.7 5.7 5.3 5.5 5.8 5.2All 5.1 5.3 5.4 5.4 5.4 5.3
Note. A low score on system support is preferable as it indicates a low need for additional supports to successfully use the intervention.
18 Assessment for Effective Intervention 43(1)
Intervention Effects
This study further explored the forms and components of DRCs interventions. In this study, the overall effectiveness of the DRC intervention ranged from negligible to small. Although small positive intervention effects were docu-mented for Student 5 in AE and D outcome data, this study failed to document a functional relationship between the DRC intervention and desired changes in targeted outcome variables as determined by WWC standards. This authentic implementation of a DRC intervention documented one of the required three replications of intervention effects. As such, no observed intervention effects can be directly attrib-uted to the DRC intervention. To support visual analysis, Tau-U measures of effect size of DBR-SIS and SDO data were calculated. Vannest and colleagues (2015) stated that context plays a significant role in interpreting Tau-U mea-sures of effect given in some contexts. In such cases, small changes may be just as meaningful as large statistical effects sizes. This idea may be applicable here given students in this study were identified as having mild to moderate behavior problems. The mild nature of problems experienced by stu-dents in the study is generally reflected in baseline ratings of behavior. For example, ratings of 8 or higher for AE and R or 3 or lower for D on DBR-SIS leave little room for marked improvement numerically. Practically, however, in the per-ception of teachers, a decrease in disruptive behavior from a rating of 3 to 1 may be very noteworthy. Therefore, small improvements may be deemed meaningful by those inter-preting the improvement (e.g., teachers). Generally, when interpreting Tau-U, a 0.20 improvement may be considered a small change, 0.20 to 0.60 a moderate change, 0.60 to 0.80 a large change, and above 0.80 a large to very large change (Vannest & Ninci, 2015). Even with this in mind, the absence of clear intervention effects cannot be ignored. The inability of this study to document intervention effects across multi-ple participants is significant given the inconsistency with previous evidence supporting the use of DRCs in schools. Ample prior research has established DRCs as an evidence-based practice (Chafouleas et al., 2007; Riley-Tillman, Chafouleas, Sassu, Chanese, & Glazer, 2008; Vannest, Davis, Davis, Mason, & Burke, 2010; Volpe & Fabiano, 2013). Although this study did not seek to validate the prac-tice of DRC interventions in absolute, these findings indi-cate additional scrutiny of the varied forms, components, and procedures of DRCs, a concern previously noted by Vannest and Ninci (2015). In addition, the severity of target behaviors that the DRC is effective with should be consid-ered, as in this study, the DRC was not highly effective with children who had mild to moderate behavior problems. Despite widespread acceptance and use by educators, the variability in DRCs raises questions regarding which com-ponents or combination of components make DRCs effec-tive (Vannest et al., 2010).
Usability
Finally, the usability of the DRC intervention and associ-ated progress monitoring using DBR-SIS was well received by the teachers. This study found good teacher acceptance for this intervention–progress monitoring combination. Teacher ratings on URP-IR indicated the DRC and DBR-SIS intervention–formative assessment combination in this format was easily acceptable, understandable, feasible, and not overly resource taxing. Teachers’ responses indicated a less favorable rating of the home–school collaboration component of this project. Given these less favorable user ratings and smaller intervention effects, educators should likely consider greater home involvement than was used in this project.
Limitations and Future Directions
Several limitations are noted for this study. The study popu-lation was composed of voluntary, homogeneous elemen-tary school boys from a rural middle-class community. This may make generalization of these finding to individuals with varying demographic characteristics difficult. As noted previously, no evidence-based practice should be consid-ered efficacious for all individuals all the time. These results should be considered evidence that continued exploration of DRC interventions in varied formats and structures war-rants additional scholarly inquiry. Further inquiry on these and related topics should be more mindful of timing of data collection within the school year, and timing for this study may not have been optimal. This coincided with several activities (e.g., high-stakes testing, spring break) that may have interfered with more typical or consistent instructional schedules and routines for participants. In addition, the tim-ing of this study within the school year limited ongoing data collection or evaluation of long-term intervention effects. This timing may have posed a barrier to the collection of SDO IOA data. Availability of observers at times coinciding with DRC-targeted times became problematic as this study progressed. This prevented the collection of IOA data for 20% of SDO observations within each phase. Although WWC (Clearinghouse, 2014) standards for single-case design research call for IOA calculation of 20% of primary outcome variable data, this was not feasible for this out-come variable. Limitations of applied research in schools prevented the presence of two teachers in a classroom to complete DBR-SIS ratings for each student. Similarly, col-lection of IOA for DBR-SIS was deemed inappropriate based on the large role contextual factors play in teacher completion of DBR-SIS. This is to say that participants completed DBR-SIS following their engagement in instruc-tional activities and concurrent observation of student behavior. Given these contextual factors could not be dupli-cated, additional rating of DBR-SIS would have resulted in
Sims et al. 19
data representative of an external observer. Given external observations were already occurring, study coordinators determined DBR-SIS ratings for IOA would contribute no additional meaningful data. Finally, taking steps to allow for such IOA information to be collected would have resulted in a significant deviation from what this interven-tion and associated data collection would entail in a natural applied environment by adding additional adults into the classroom, which could influence student and adult behav-ior unduly. Finally, SDO may be viewed as a measure of agreement between multiple observers’ ratings of student behavior (consistent with a stated research questions for this study). A final limitation is noted in the oversight of university-based principal investigators. Consultation activities were conducted by graduate research assistants, which may have influenced teacher participation in inter-vention activities, either positively or negatively. It may be beneficial to conduct further studies with less university-based oversight.
Conclusion
In conclusion, this study found that DBR-SIS displayed good treatment sensitivity when used in conjunction with an evidence-based intervention. In addition, DBR-SIS tracked intervention response and nonresponse consistently when compared with SDO data. This contributes further to the evidence base supporting the varied uses of DBR-SIS. In addition, this version of the DRC did not consistently increase academic engagement and decreased disruptive behavior following the initiation of the intervention. Finally, these findings suggest that the combination of the DRC intervention and DBR-SIS formative assessment is accept-able to implementers. In summary, this study does add to the literature base supporting DBR-SIS as a defensible for-mative assessment while raising some questions about use of the DRC intervention with children who have mild behavior issues.
Declaration of Conflicting Interests
The authors declared no potential conflicts of interest with respect to the research, authorship, and/or publication of this article.
Funding
The authors disclosed receipt of the following financial support for the research, authorship, and/or publication of this article: Funding for this research was provided by The Institute of Education Sciences.
References
American Institutes for Research. (n.d). Behavioral progress mon-itoring tools chart. National Center on Intensive Intervention at American Institutes for Research. Retrieved from http://www.intensiveintervention.org/resources/tools-charts
Beaton, D. E., Bombardier, C., Katz, J. N., & Wright, J. G. (2001). A taxonomy for responsiveness. Journal of Clinical Epidemiology, 54, 1204–1217.
Briesch, A. M., Chafouleas, S. M., Neugebauer, S. R., & Riley-Tillman, T. C. (2013). Assessing influences on inter-vention implementation: Revision of the Usage Rating Profile–Intervention. Journal of School Psychology, 51, 81–96.
Burns, M. K., & Gibbons, K. (2012). Implementing response-to-intervention in elementary and secondary schools: Procedures to assure scientific-based practices. New York, NY: Routledge.
Chafouleas, S. M. (2011). Direct behavior rating: A review of the issues and research in its development. Education & Treatment of Children, 34, 575–591.
Chafouleas, S. M., Briesch, A. M., Riley-Tillman, T. C., & McCoach, D. B. (2009). Moving beyond assessment of treat-ment acceptability: An examination of the factor structure of the Usage Rating Profile–Intervention (URP-IR). School Psychology Quarterly, 24, 36–47.
Chafouleas, S. M., Kilgus, S. P., & Hernandez, P. (2009). Using Direct Behavior Rating (DBR-SIS) to screen for school social risk: A preliminary comparison of methods in a kin-dergarten sample. Assessment for Effective Intervention, 34, 214–223.
Chafouleas, S. M., Riley-Tillman, T. C., Briesch, A. M., & Chanese, J. A. (2008). Generating usable knowledge: Initial development and validation of the Usage Rating Profile for Interventions (URP-I). Canadian Journal of School Psychology, 23, 175–189.
Chafouleas, S. M., Riley-Tillman, T. C., & Sugai, G. M. (2007). School-based behavioral assessment: Informing intervention and instruction. New York, NY: Guilford Press.
Chafouleas, S. M., Sanetti, L. M., Kilgus, S. P., & Maggin, D. M. (2012). Evaluating sensitivity to behavioral change using Direct Behavior Rating Single-Item Scales. Exceptional Children, 78, 491–505.
Christ, T. J., Riley-Tillman, T. C., & Chafouleas, S. M. (2009). Foundation for the development and use of direct behavior rating (DBR-SIS) to assess and evaluate student behavior. Assessment for Effective Intervention, 34, 201–213.
Clearinghouse, W. W. (2014). Procedures and standards hand-book (Version 30). Princeton, NJ: US Department of Education, Institute of Education Sciences.
Deno, S. L. (2005). Problem-solving assessment. In R. Brown-Chidsey (Ed.), Assessment for intervention: A problem-solv-ing approach (pp. 10–40). New York, NY: Gilford.
Erchul, W. P., & Martens, B. K. (2010). School consultation: Conceptual and empirical bases of practice. New York, NY: Springer.
Evidence Based Intervention Network. (2015, July 7). Sensitivity to change. Glossary of Terms. Retrieved from http://ebi.mis-souri.edu/?s=sensitivity
Fletcher, J. M., & Vaughn, S. (2009). Response to intervention: Preventing and remediating academic difficulties. Child Development Perspectives, 3(1), 30–37.
Fuchs, L. S., & Fuchs, D. (1999). Monitoring student progress toward the development of reading competence: A review of three forms of classroom-based assessment. School Psychology Review, 28, 659–671.
20 Assessment for Effective Intervention 43(1)
Gresham, F. M. (2008). Best practices in diagnosis in a mul-titier problem-solving approach. Best Practices in School Psychology, 2, 281–294.
Jiménez, J. E. (2010). Response to Intervention (RtI) Model: a promising alternative for identifying students with learning disabilities? Psicothema, 22, 932–934.
Kazdin, A. E. (2005). Evidence-based assessment for children and adolescents: Issues in measurement development and clinical application. Journal of Clinical Child & Adolescent Psychology, 34, 548–558.
Kratochwill, T. R., Hitchcock, J., Horner, R. H., Levin, J. R., Odom, S. L., Rindskopf, D. M., & Shadish, W. R. (2010). Single-case designs technical documentation. Princeton, NJ: What Works Clearinghouse.
Liaupsin, C. J., Scott, T. M., Morris, R. J., & Mather, N. (2008). Disruptive behavior. In R. Morris & N. Mather (Eds.), Evidence-based interventions for students with learning and behavioral challenges (pp. 59–78). New York, NY: Routledge.
McIntosh, K., Campbell, A. L., Carter, D. R., & Rossetto Dickey, C. (2009). Differential effects of a tier two behavior inter-vention based on function of problem behavior. Journal of Positive Behavior Interventions, 11, 82–93.
Miller, F. G., Patwa, S. S., & Chafouleas, S. M. (2014). Using Direct Behavior Rating–Single Item Scales to assess student behavior within multi-tiered systems of support. Journal of Special Education Leadership, 27, 76–85.
Riley-Tillman, T. C., & Burns, M. K. (2010). Evaluating edu-cational interventions: Single-case design for measuring response to intervention. New York, NY: Guilford Press.
Riley-Tillman, T. C., Chafouleas, S. M., & Briesch, A. M. (2007). A school practitioner’s guide to using daily behavior report cards to monitor student behavior. Psychology in the Schools, 44, 77–89.
Riley-Tillman, T. C., Chafouleas, S. M., Sassu, K. A., Chanese, J. A., & Glazer, A. D. (2008). Examining the agreement of
direct behavior ratings and systematic direct observation data for on-task and disruptive behavior. Journal of Positive Behavior Interventions, 10, 136–143.
Riley-Tillman, T. C., Christ, T. J., Chafouleas, S. M., & Boice-Mallach, C. H. (2011). The impact of observation duration on the accuracy of data obtained from direct behavior rating (DBR-SIS). Journal of Positive Behavior Interventions, 13, 119–128.
Saudargas, R. A., & Lentz, F. E. (1986). Estimating percent of time and rate via direct observation: A suggested observational pro-cedure and format. School Psychology Review, 15, 36–48.
Shinn, M. R., & Shinn, M. M. (2002). Administration and scor-ing of reading curriculumbased measurement (R-CBM) for use in general outcome measurement. Eden Prairie, MN: Edformation.
Sugai, G., & Simonsen, B. (2012). Positive behavioral interven-tions and supports: History, defining features, and misconcep-tions. Storrs: Center for PBIS & Center for Positive Behavioral Interventions and Supports, University of Connecticut.
Vannest, K. J., Davis, J. L., Davis, C. R., Mason, B. A., & Burke, M. D. (2010). Effective intervention for behavior with a daily behavior report card: A meta-analysis. School Psychology Review, 39(4), 654–672.
Vannest, K. J., & Ninci, J. (2015). Evaluating intervention effects in single-case research designs. Journal of Counseling & Development, 93, 403–411.
Vannest, K. J., Parker, R. I., & Gonen, O. (2011). Single case research: Web based calculators for SCR analysis. College Station: Texas A&M University.
Volpe, R. J., & Briesch, A. M. (2012). Generalizability and dependability of single-item and multiple-item direct behav-ior rating scales for engagement and disruptive behavior. School Psychology Review, 41, 246–261.
Volpe, R. J., & Fabiano, G. A. (2013). Daily behavior report cards: An evidence-based system of assessment and interven-tion. New York, NY: Guilford Press.