assessment and calculation of btex
TRANSCRIPT
ASSESSMENT AND CALCULATION OF BTEX PERMEATION
THROUGH HDPE WATER PIPE
FINAL REPORT
JULY 10, 2012
Prepared for:
HDPE Municipal Advisory Board
Plastics Pipe Institute® (PPI)
Prepared by:
Dae Hyun (Dan) Koo, Ph.D., P.E.

I
TABLE OF CONTENTS
1.0 INTRODUCTION ---------------------------------------------------------------------------P. 1
2.0 BTEX DEFINITIONS AND PROPERTIES -------------------------------------------- P. 3
3.0 REGULATIONS AND HEALTH EFFECTS --------------------------------------------P. 6
4.0 BTEX TRANSPORT MECHANISMS ----------------------------------------------------------P. 9
4.1 Volatilization ------------------------------------------------------------------------------- P. 9
4.2 Dissolution ---------------------------------------------------------------------------------- P. 10
4.3 Sorption ------------------------------------------------------------------------------------- P. 11
4.4 Biodegradation ----------------------------------------------------------------------------- P. 12
4.5 Summary ------------------------------------------------------------------------------------ P. 12
5.0 BTEX PERMEATION CALCULATION METHODOLOGY ------------------------------ P. 13
5.1 Steady State Permeation Coefficient Equation ---------------------------------------- P. 13
5.2 Condition Variables – Saturated and Unsaturated Ground Water -------------------P. 16
5.3 Condition Variables – Stagnation Effect in Contaminated Ground ---------------- P. 18
5.4 Condition Variables – Internal Water Flow Effect in Contaminated Ground ----- P. 20
5.5 Condition Variables – PE Pipe Thickness Effect in Contaminated Ground ------- P. 21
5.6 Condition Variables –Different Ground Temperatures ------------------------------ P. 24
5.7 Condition Variables– Ground Soil Type ---------------------------------------------- P. 28
6.0 BTEX PERMEATION CALCULATION ------------------------------------------------------ P. 30
7.0 FUTURE RESEARCH---------------------------------------------------------------------------- P. 35
8.0 CONCLUSIONS ----------------------------------------------------------------------------------- P. 36
9.0 REFERENCES ------------------------------------------------------------------------------------- P. 38

II
LIST OF TABLES
Table 1. Bulk Concentration of contaminant in the Soil Pore Water (C bulk) ---------------------P. 5
Table 2. Chemical and Physical Properties of BTEX Compounds -------------------------------- P. 6
Table 3. National Primary Drinking Water Regulations for Organic Chemical (BTEX) ------- P. 8
Table 4. Comparison of Drinking Water Standards -------------------------------------------------- P. 8
Table 5. Taste and Odor Thresholds for Pure Compounds Compared to MCLs --------------- P. 9
Table 6. Permeation Rates in Saturated and Unsaturated Ground Conditions ------------------ P. 18
Table 7. Pipe Wall Thickness Correction Factor (γ) ---------------------------------------------- P. 23
Table 8. Diffusion Coefficient per Temperature Change in Water ------------------------------- P. 26
Table 9. Input Parameters for BTEX Permeation Calculations ---------------------------------- P. 31
Table 10. BTEX Permeation Results Scenario 1 – Groundwater Saturated and Pipe-water Flows -
--------------------------------------------------------------------------------------------------- P. 33
Table 11. BTEX Permeation Results Scenario 2 – Groundwater Saturated and Pipe-water
Stagnates ------------------------------------------------------------------------------------------------- P. 33
Table 12. BTEX Permeation Results Scenario 3 – Groundwater Unsaturated and Pipe-water
Flows ------------------------------------------------------------------------------------------------------ P. 34
Table 13. BTEX Permeation Results Scenario 4 – Groundwater Unsaturated and Pipe-water
Stagnates ------------------------------------------------------------------------------------------------- P. 35
LIST OF FIGURES
Figure 1. BTEX Components in Gasoline ------------------------------------------------------------- P. 4
Figure 2. Flow Diagram for BTEX Contamination Calculation Process ------------------------ P.15
Figure 3. Regression Model for Permeation Correction Factor by Thickness of PE Pipe -----P. 24
Figure 4. Linear Regression for Benzene Diffusion Coefficient vs. Temperature ------------- P. 27
Figure 5. Linear Regression for Toluene Diffusion Coefficient vs. Temperature -------------- P. 27
Figure 6. Linear Regression for Ethylbenzene Diffusion Coefficient vs. Temperature ------- P. 28
Figure 7. Linear Regression for Xylene (total) Diffusion Coefficient vs. Temperature ------- P. 28

1.0 INTRODUCTION
The water industry in Europe has extensively used HDPE (High Density Polyethylene) pipe for
drinking water supply and distribution systems for many decades. In the US and Canada, the
adoption of HDPE water pipe continues to increase in municipal and utility applications.
Compared to other pipe materials such as steel, ductile iron, concrete and PVC, HDPE pipes
have many advantages such as flexibility, corrosion and biological resistance, fatigue (Jana 2012)
and seismic resistance (Eldinger and Davis 2012) and availability of various types of joints, such
as a leak free fusible joints and mechanical joints and provides the lowest life cycle costs
(CSIRO 2008).
As indicated in the AWWA pipe standards (such as AWWA C110, C200, C905, C906, and etc),
underground pipelines can be contaminated by various chemical organic substances during
service. Hydrocarbon permeation occurs by external contamination sources existing around the
water pipe systems. Subsequently the contaminants diffuse through the pipe wall and joints into
the water carried in the pipe. AWWA Standards include similar Permeation Requirements for
pipes and gaskets and refer the user to consult with the manufacturer regarding permeation of
pipe walls, jointing materials, etc., before selecting materials for use in such areas. As such, the
Plastics Pipe Institute contracted with the Purdue School of Engineering at IUPUI to develop this
report to assist the users with these applications.
BTEX is an acronym for four hydrocarbon compounds, including Benzene, Toluene,
Ethylbenzene, and Xylenes. BTEX is known to be highly volatile organic compounds and is the
main source of ground contamination caused by petroleum related contamination such as Fuel
tank leakage. Because of their small molecular size and high solubility in water, BTEX has the
2
potential to permeate through pipes and gasket joints under certain conditions as will be
discussed later in this report. Hydrocarbon permeation occurs through polymeric gasket joints
and other plastic piping materials. Water quality is compromised only when the permanent
contamination amount exceeds safe limits.
Research has been performed to measure diffusion and permeation coefficients for PE products,
such as a PE film, which is mainly used as a landfill barrier (Joo et al. 2004 and 2005, Park et al.
1996, Sangam and Rowe 2001, Park and Nibras1993). Research for PE pipe material permeation
was most recently published in 2008 by AWWA Research Foundation (AWWA RF, currently
Water RF); this AWWA RF report provides BTEX diffusion coefficients and permeation rates
for a 1-inch diameter Iron Pipe Size (IPS) HDPE water pipe in various lab settings (Ong et al.
2008). However, Ong et al (2008) only tested a thin wall 1- inch diameter HDPE pipe that is
primarily used for service connection in many water systems. Distribution and transmission pipe
are thicker. Thus, using 1-inch diameter pipe permeation rates to predict the performance of
thicker distribution and transmission pipes can over-estimate the rate of permeation. In addition,
the previous Water RF research was limited to the 1” service tube; testing was not conducted for
the wider selections of HDPE pipe sizes used in water supply and distribution pipelines in
various geotechnical and operating conditions from actual job sites. This presents a technical
challenge to most engineers. A practical application of previous AWWA RF findings evidently
requires numerous engineering assumptions and extensive understanding of chemical permeation
and BTEX transport mechanisms prior to selecting HDPE as a valid water pipeline material
designed for a potentially BTEX contaminated site. This report provides a step-by-step BTEX
permeation estimation methodology and suggests guidelines for incorporating jobsite
geotechnical and design variables including bulk concentration of BTEX in soil, ground

3
temperature, groundwater saturation, flow velocity, water stagnation, pipe thickness, and soil
characteristics. The methodology in this report will be used to perform example calculations
based on existing regulatory limits and common design practices.
2.0 BTEX DEFINITIONS AND PROPERTIES
Hydrocarbon (organic) compounds are major environmental contamination sources in
groundwater. BTEX is acronym for a group of hydrocarbon organic compounds including
Benzene, Ethylbenzene, Toluene, and three isomers of Xylene referring to total Xylene. BTEX is
defined as “Volatile, monocyclic aromatic compounds present in coal tar, petroleum products,
and various organic chemical product formulations” (Cohen and Mercer, 1993) and “the most
soluble of the major gasoline compounds and, therefore, are common indicators of gasoline
contamination” (Wilson and Moore, 1998). Generally, gasoline consists of BTEX
(approximately 18 percent by weight) and other hydrocarbons (approximately 82 percent by
weight). Figure 1 shows percentages of each BTEX component weight out of 18 percent BTEX
by weight (Christensen and Elton, 1996).

4
Figure 1. BTEX Components in Gasoline (Christensen and Elton, 1996)
When BTEX transports through the ground, it is mixed with existing ground water. The actual
mixture of each BTEX compound in the groundwater is different because of different levels of
solubility. The recent AWWA RF report (Ong et al. 2008) demonstrated a solubility test and
measurement. A mixture of 350 mL (mililiter) of gasoline with3.5 liters of deionized water in a 4
liter glass bottle was agitated by a magnetic stirrer for 48 hours to prepare BTEX solution
samples. Table 1 shows aqueous gasoline solutions prepared by Ong et al. (2008). Three diluted
aqueous solutions of varying concentrations in Table 1 were obtained by diluting the 100%
dissolved BTEX concentration with deionized water at a ratio of 1:1, 1:9, 1:99, respectively.
These solutions are used as bulk concentration (Cbulk) to estimate BTEX permeation rate

5
(Pm).The actual concentration of BTEX contaminants in contaminated ground water may be
significantly different when it is compared to the percent of weight in regular gasoline shown in
Figure 1. Table 1 indicates that Benzene has the highest solubility. In other words, Benzene
dissolved in the water to the highest degree amongst the other organic compounds and it can be
dispersed as contaminated groundwater moves through underground soil layers.
Table 1.Bulk Concentration of contaminant in the Groundwater (Soil Pore Water) (C bulk)
Aqueous Gasoline Solutions
Total BTEX Benzene Toluene Others
100 % 136.6 mg/L
(0.1366 mg/cm3) 67.5 mg/L
(0.0675 mg/cm3) 56.2 mg/L
(0.0562 mg/cm3) 12.9 mg/L
(0.0129 mg/cm3)
50 % 63.9 mg/L
(0.0639 mg/cm3) 31.2 mg/L
(0.0312 mg/cm3) 26.3 mg/L
(0.0263 mg/cm3) 6.4mg/L
(0.0064 mg/cm3)
10 % 12.6 mg/L
(0.0126 mg/cm3) 6 mg/L
(0.006 mg/cm3) 5.2 mg/L
(0.0052 mg/cm3) 1.4 mg/L
(0.0014 mg/cm3)
1 % 1.2 mg/L
(0.0012 mg/cm3) 0.6 mg/L
(0.0006 mg/cm3) 0.5 mg/L
(0.0005 mg/cm3) 0.1 mg/L
(0.0001 mg/cm3)
Note: Data from Ong et al (2008).
Table 2 presents the BTEX chemical and physical properties. The molecular weight is calculated
by multiplying the atomic weight of each element in a chemical formula by the number of atoms
in the formula, then adding all of these products together (Convert units 2011). The soil organic
carbon-water partitioning coefficient (KOC) is an important property to estimate the mobility of
BTEX compounds (Guo et al. 2004). KOCis a ratio of the mass of a chemical, including BTEX,
absorbed in the soil in the equilibrium BTEX concentration solution. According to the general
rule of KOC, the lower the KOC values, the higher the mobility of BTEX through groundwater-
saturated soil. The soil type and properties must be taken into consideration to estimate the

6
mobility of BTEX in the soil (Yang et al. 1995). The absorption of BTEX compounds in soil
particles are significantly governed by specific types and properties of soils. However, Koc
values in various soil types for BTEX compounds have not been known for engineer’s practice.
Vapor pressure is the pressure of the gas in equilibrium compared to a liquid or solid status at a
given temperature. BTEX is a highly volatile organic compound. Thus, it tends to evaporate in
atmosphere relatively easier than other hydrocarbons. In other words, the higher the vapor
pressure, the more volatilization from the liquid or dissolved status from the contaminated
ground.
Table 2. Chemical and Physical Properties of BTEX Compounds
Parameters Benzene Toluene Ethylbenzene Xylenes
Formula C6H6 C6H5CH3 C6H5CH2CH3 C6H4(CH3)2
Molar weight (g/mol) 78.12 92.15 106.18 106.18
Density (g/ml) 0.88 0.87 0.87 0.87a
Soil organic carbon-water partitioning coefficient (KOC)
97 242 622 570a
Vapor Pressureb
A 17.1 6.63 2.86 2.48
B 0.0547 0.0473 0.0445 0.0442
Note: Data from Weast et al. (1990), Carey and Sundberg (1990), and Fetter (1998).
a: Average Values;
b: At a given temperature (T), vapor pressure (P)=exp(-0.05223 a/T +b).
3.0 REGULATIONS AND HEALTH EFFECTS
The US EPA has established National Primary Drinking Water Regulations (NPDWR)
controlling the Maximum Containment Levels (MCLs) for the nation’s drinking water systems in

7
a wide range of microorganisms, disinfectants, disinfection byproducts, inorganic and organic
chemicals, and radio nuclides (EPA 2009). NPDWR currently applies to approximately 170,000
public water systems, including 54,000 community water systems and 89,000 transient non-
community water systems, in the United States. Post-treatment contamination of the distribution
system may affect public health risks if the contamination exceeds MCLs for more than a year.
Special groups may be particularly sensitive to the effects of certain chemicals (Quevauviller and
Thompson 2006).
Table 3 presents the latest NPDWR for BTEX. Benzene is the only BTEX compounds classified
as a human genotoxic and carcinogen substance. Other BTEX compounds are neither carcinogen
nor regulated contaminants in Canada and the European Union as shown in Table 4.Public heath
goals, referring to the Maximum Contaminant Level Goals (MCLG),are also established by
USEPA, yet it is not currently mandated by federal regulations. Potential health effects from
long-term exposure above MCLs are presented in Table 3. Canada and the European Union (EU)
do not regulate Ethylbenzene, Toluene, and total Xylene in their drinking water quality standards.
In most instances, drinking water contamination reports have been made by ordinary customers,
who detected odor and taste change (USEPA 2002). Table 5 presents odor and taste thresholds
for BTEX compounds. Water customers can easily detect Ethylbenzene, and Xylene before
consumption because of strong odor. A Benzene contamination level less than 0.5mg/L is almost
impossible to detect by an ordinary human being. Benzene is identified as a carcinogen whereas
Toluene, Xylene, and Ethylbenzene are not as shown in Table 4.Thus, Benzene permeation is the
foremost issue and Benzene permeation estimation should take more consideration than the three
other volatile hydrocarbons.

8
Table 3. National Primary Drinking Water Regulations for Organic Chemical (BTEX)
Contaminant MCL
(mg/L)
Public Health Goal
(MCLG) (mg/L)
Potential Health Effects from Long-term
Exposure above the MCL
Common Sources of Contaminant in Drinking Water
Benzene 0.005 0 Anemia, Increased risk of cancer
Discharge from factories Leaching from gas storage tanks and landfills
Toluene 1 1 Nervous system, Liver or kidney problems
Discharge from petroleum factories
Ethylbenzene 0.7 0.7 Liver or kidney problems
Discharge from petroleum refineries
Xylenes (total)
10 10 Nervous system damage
Discharge from petroleum factories Discharge from chemical factories
Data: EPA (2009) National Primary Drinking Water Regulations
Table 4. Comparison of Drinking Water Standards
Canada
World Health
Organization (WHO)
EU USEPA Human
Carcinogenicity*
MAC (mg/L) Guideline
Value (mg/L) Parametric
Value (mg/L) MCL (mg/L)
Benzene 0.005 0.01 0.001 0.005 Genotoxic and
carcinogen
Ethylbenzene N/A 0.3 N/A 0.7 No
Toluene N/A 0.7 N/A 1.0 No
Xylenes (total)
N/A 0.5 N/A 10.0 No
Data: SDWF (2011)
N/A: not regulated contaminants or insufficient data to prove adverse health effect
*: Human carcinogenicity is referenced from Stern and Lagos (2008), USEPA (2000, 2002, 2005), and American Cancer Society.

9
Table 5. Taste and Odor Thresholds for Pure Compounds Compared to MCLs
Contaminant MCL
(mg/L) Taste Threshold
(mg/L) Odor Threshold
(mg/L) Detect Before Risk
Benzene 0.005 0.5 – 4.5 2.0 No
Toluene 1 No Data 2.9* No Data
Ethylbenzene 0.7 0.029 0.029 Yes
Xylenes (total)
10 No Data 2.2 Yes
Data: EPA (2002). Permeation and Leaching
*: Data from J.E. Amoore and E. Hautala (1983)
4.0 BTEX TRANSPORT MECHANISMS
As discussed in previous sections, BTEX is one of the main groundwater contamination sources
due to several reasons including: 1) wide use of petroleum products such as gasoline, 2) BTEX
makes up a significant percentage of petroleum products, and 3) BTEX’s high solubility in
ground water. There are four major BTEX transport mechanisms distributing BTEX through the
ground;1) volatilization, 2) dissolution, 3) sorption, and 4) biodegradation (Christensen and Elton,
1996). As the BTEX transport mechanisms progress, the concentration level of BTEX will be
reduced over time.
4.1 Volatilization
BTEX, a group of volatile organic compounds, vaporizes into atmosphere when it is exposed to
the ground surface. Vapor pressure properties presented in Table 2are obtained from the pure
BTEX components. Higher vapor pressures indicate that BTEX molecules will evaporate out of
10
BTEX solutions quickly from contaminated groundwater or absorbed in soil particles. However,
volatilization can be limited if the urban built environment is covered by an impermeable surface
restraining the vaporization process into the atmosphere. In addition, an impermeable surface
prohibits BTEX spill from entering into ground. Vegetation on the surface may increase
volatilization.
4.2 Dissolution
BTEX has relatively high solubility when mixed with water. Each component of BTEX has
different degrees of dissolution. Dissolved BTEX concentration is expressed as a percentage of
aqueous saturation in Table 1. Benzene shows the highest solubility in groundwater amongst
Benzene, Toluene, Ethylbenzene, and total Xylene. According to Yang et al. (1995), BTEX
moves with groundwater in response to natural hydraulic gradients, eventually migrating over
large boundary areas, and diluting in groundwater. Ong et al (2008) demonstrated that the
permeation rates of BTEX through PE pipes were strongly dependent on the BTEX bulk
concentration outside of the pipe. Bulk solutions in various BTEX concentration levels were
made as shown in Table 1.The aqueous saturation degree of contaminated groundwater around
the buried PE water pipe is a significant factor to estimate the quantity of BTEX permeation. The
amount of Benzene permeation increases where the ground is fully saturated and an HDPE water
pipe exterior is completely exposed to 100% dissolved BTEX contaminated ground water. The
external bulk concentration of BTEX reduces as contaminated groundwater dilutes the aqueous
concentration dispersing BTEX into the surrounding groundwater. Underground water saturation,
influence zone, and time can be significant factors. However, those two factors are site-specific
conditions and only measured from the site.
11
4.3 Sorption
Sorption is defined as the attachment of the organic contaminants to the soil surface or matrix
(Christensen and Elton, 1996). From the geotechnical engineering perspective, the sorption
process takes place when the soil is unsaturated. The unsaturated soil zone is defined as the soil
layers between the ground water table and the surface. Thus, this sorption process holds BTEX
compounds in soil structure and inhibits their movement through soil particles. Sorption is
controlled by many factors, including properties of organic contaminants and soil. Higher
polarity and solubility attribute to increase organic contaminants, for example, Benzene is to be
absorbed easily in soil and increases affinity between soil matrix and organic compounds (Zytner
1994 and Ong et al. 2008). When the quantity of BTEX is not sufficient to reach the
underground HDPE pipes and/or groundwater is unsaturated, sorption traps organic
contaminants and slows groundwater migration.
Most distribution mains and service connections are typically buried in unsaturated soil zone
within 10 ft from ground surface. This unsaturated soil zone develops negative suction pressure
and typically increases the water content close to the groundwater table (Fredlund and Rahardijo
1993). However, the groundwater table level fluctuates by precipitation, percolation, topography,
and soil properties such as hydraulic conductivity and particle sizes of the soil. The degree of
groundwater saturation is a significant factor in determining if BTEX dissolves in groundwater
or absorbs in soil. AWWA RF report (Ong et al. 2008) only covers dry soil and 100% aqueous
condition for their permeation experiments.

12
4.4 Biodegradation
Many organic compounds can be degraded by natural microbial activity. The microbial
degradation (biodegradation) of BTEX is a predominant mechanism for the natural remediation
process. According to Kim et al. (2003), the availability of BTEX during microbial degradation
process is often limited due to sorption and entrapment in the soil structure. Zang and Bouwer
(1997) tested microbial degradation for Benzene and Toluene. They found that the rate of
biodegradation decreased with the increasing hydrophobicity, soil to water ratio, soil particle size,
and soil organic carbon content. The effect of biodegradation is greatly inconsistent and affected
by the concentration of microbial population and BTEX concentration (Kim et al. 2003). The
biodegradation process certainly attenuates the BTEX contamination level in soil and
groundwater. It is an extremely complex biochemical process to generalize into a permeation
calculation. The biodegradation factors include, but are not limited to, existence of oxygen, type
of bacteria, existence of hydrogen peroxide, and soil properties (Kim et al. 2006).
4.5 Summary
All four mechanisms are considered as passive natural remediation processes. Volatilization,
sorption, and biodegradation may cause a significant degree of BTEX contamination attenuation.
However, those three mechanisms are difficult to control as independent factors in permeation
estimating formulas because of the complicated interaction between all existing natural
conditions and site-specific properties. When evaluating BTEX permeation for HDPE pipe,
engineers should take into consideration that the long-term attenuation process occurs naturally;
this long-term process reduces the bulk concentrations of contaminants (C bulk). C bulk is the most
13
important factor for the BTEX permeation calculation methodology presented in the following
section.
5.0 BTEX PERMEATION CALCULATION METHODOLOGY
5.1 Steady State Permeation Coefficient Equation
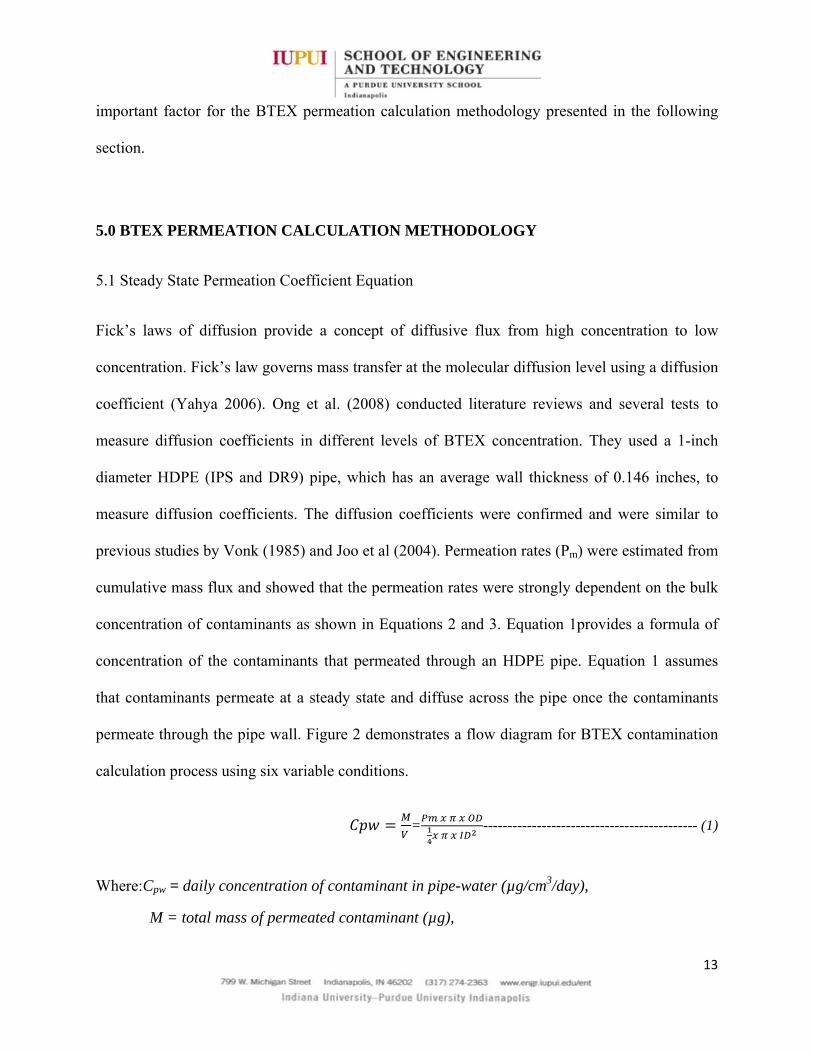
Fick’s laws of diffusion provide a concept of diffusive flux from high concentration to low
concentration. Fick’s law governs mass transfer at the molecular diffusion level using a diffusion
coefficient (Yahya 2006). Ong et al. (2008) conducted literature reviews and several tests to
measure diffusion coefficients in different levels of BTEX concentration. They used a 1-inch
diameter HDPE (IPS and DR9) pipe, which has an average wall thickness of 0.146 inches, to
measure diffusion coefficients. The diffusion coefficients were confirmed and were similar to
previous studies by Vonk (1985) and Joo et al (2004). Permeation rates (Pm) were estimated from
cumulative mass flux and showed that the permeation rates were strongly dependent on the bulk
concentration of contaminants as shown in Equations 2 and 3. Equation 1provides a formula of
concentration of the contaminants that permeated through an HDPE pipe. Equation 1 assumes
that contaminants permeate at a steady state and diffuse across the pipe once the contaminants
permeate through the pipe wall. Figure 2 demonstrates a flow diagram for BTEX contamination
calculation process using six variable conditions.
=
-------------------------------------------- (1)
Where:Cpw = daily concentration of contaminant in pipe-water (µg/cm3/day),
M = total mass of permeated contaminant (µg),

14
V = volume of water in the pipe (cm3),
Pm = steady permeation rate of the contaminant (µg/cm2/day),
ID = inside diameter of pipe (cm), and
OD = outside diameter of pipe (cm).

15
Figure 2.IUPUI Flow Diagram for BTEX Contamination Calculation Process

16
5.2 Condition Variables - Saturated and Unsaturated Ground Water
According to Ong et al. (2008), degree of groundwater saturation is a significant factor to control
the permeation rate because of high solubility of BTEX contaminant in the saturated
groundwater. For example, if the dissolved bulk concentrations of contaminants are 100%
saturated in the groundwater and an entire pipe exterior surface area is exposed, the Benzene
permeation rate would be at its maximum.
The AWWA RF report tested a 1-inch diameter HDPE water pipe in the theoretically worst-case
condition and submerged the pipe submerged in various dissolution levels of BTEX mixed water.
Benzene and Toluene were detected in the pipe-water. Ethylbenzene and total Xylene are only
detected at insignificantly low level. These results can be explained by the higher solubility of
Benzene in water and the higher mass fraction of Toluene in BTEX as shown in Table 1. Ong et
al. (2008) proposed permeation rates for Benzene and Toluene under 100% saturated
groundwater condition as shown in Equations 2 and 3. Although Ethylbenzene and Xylene
permeation are negligible, Ethyl benzene and Xylene may be estimated at approximately10% of
the Benzene permeation rate for design convenience. This approach will remind engineers in
practice to consider potential Ethylbenzene and Xylene presence in the pipe-water.
Benzene: Pm (µg/cm2/day) = 0.0079 * Cbulk1.1323, where Cbulk = mg/L ------------------- (2)
Toluene: Pm (µg/cm2/day) = 0.0087 * Cbulk1.1444, where Cbulk = mg/L ------------------- (3)
Ethylbenzene: Pm (µg/cm2/day) = 0.00079 * Cbulk1.1323, where Cbulk = mg/L ------------ (4)
Xylene (total): Pm (µg/cm2/day) = 0.00079 * Cbulk1.1323, where Cbulk = mg/L ---------- (5)
*Note: Cbulk = mg/cm3 shall be converted to mg/L to use this equation by multiplying 1000

17
*Note: Ethylbenzene and Xylene compounds, including m-Xylene and o+p- Xylene, are not
notably detected in the pipe-water
Soil porosity and water content have an effect on the BTEX contaminants transport through the
soil structure, thus porosity and water content significantly affect the permeation through the
HDPE pipe. Benzene permeates HDPE water pipe at a much lower rate in an unsaturated
groundwater condition as compared to a 100% groundwater saturation condition described
earlier. Permeation rate in unsaturated groundwater condition changes as groundwater and BTEX
contamination level changes due to sorption in soil particles and volatilization. Ong et al. (2008)
propose permeation rates for Toluene and Xylene under an unsaturated groundwater condition as
shown in Equations 7 and 9. Tests were conducted to add bulk concentrations(C bulk) of dissolved
BTEX in dry soil. Ong et al. (2008) did not provide permeation rates for Benzene and
Ethylbenzene because of insignificantly low permeation level. Although Benzene and
Ethylbenzene permeation are negligible, Benzene and Ethylbenzene may be estimated at
approximately 10% of Toluene permeation rate for design convenience. This is same approach
used for Ethylbenzene and Xylene in 100% groundwater saturated condition.
Benzene: Pm (µg/cm2/day) = 0.00002 * Cbulk1.6054, where Cbulk = mg/kg in dry soil------ (6)
Toluene: Pm (µg/cm2/day) = 0.0002 * Cbulk1.6054, where Cbulk = mg/kg in dry soil------ (7)
Ethylbenzene: Pm (µg/cm2/day) = 0.00002 * Cbulk1.6054, where Cbulk = mg/kg in dry soil------ (8)
Xylene (total): Pm (µg/cm2/day) = 0.000003 * Cbulk2.2594, where Cbulk = mg/kg in dry soil -------- (9)
*Note: Unit for Cbulk is mg/kg for unsaturated conditions.
18
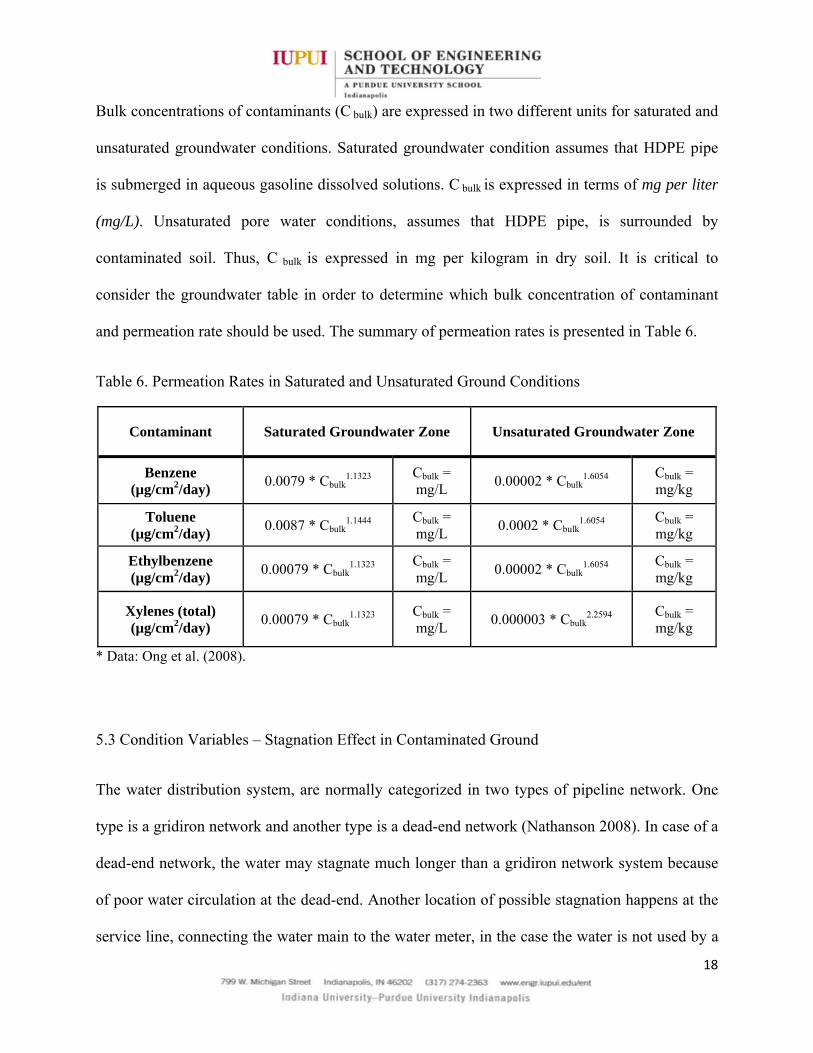
Bulk concentrations of contaminants (C bulk) are expressed in two different units for saturated and
unsaturated groundwater conditions. Saturated groundwater condition assumes that HDPE pipe
is submerged in aqueous gasoline dissolved solutions. C bulk is expressed in terms of mg per liter
(mg/L). Unsaturated pore water conditions, assumes that HDPE pipe, is surrounded by
contaminated soil. Thus, C bulk is expressed in mg per kilogram in dry soil. It is critical to
consider the groundwater table in order to determine which bulk concentration of contaminant
and permeation rate should be used. The summary of permeation rates is presented in Table 6.
Table 6. Permeation Rates in Saturated and Unsaturated Ground Conditions
Contaminant Saturated Groundwater Zone Unsaturated Groundwater Zone
Benzene (µg/cm2/day)
0.0079 * Cbulk1.1323
Cbulk = mg/L
0.00002 * Cbulk1.6054
Cbulk = mg/kg
Toluene (µg/cm2/day)
0.0087 * Cbulk1.1444
Cbulk = mg/L
0.0002 * Cbulk1.6054
Cbulk = mg/kg
Ethylbenzene (µg/cm2/day)
0.00079 * Cbulk1.1323
Cbulk = mg/L
0.00002 * Cbulk1.6054
Cbulk = mg/kg
Xylenes (total) (µg/cm2/day)
0.00079 * Cbulk1.1323
Cbulk = mg/L
0.000003 * Cbulk2.2594
Cbulk = mg/kg
* Data: Ong et al. (2008).
5.3 Condition Variables – Stagnation Effect in Contaminated Ground
The water distribution system, are normally categorized in two types of pipeline network. One
type is a gridiron network and another type is a dead-end network (Nathanson 2008). In case of a
dead-end network, the water may stagnate much longer than a gridiron network system because
of poor water circulation at the dead-end. Another location of possible stagnation happens at the
service line, connecting the water main to the water meter, in the case the water is not used by a
19
service customer for a significant period. The stagnation effect in the pipe degrades pipe-water
quality as exposure time and the area increases in BTEX contamination.
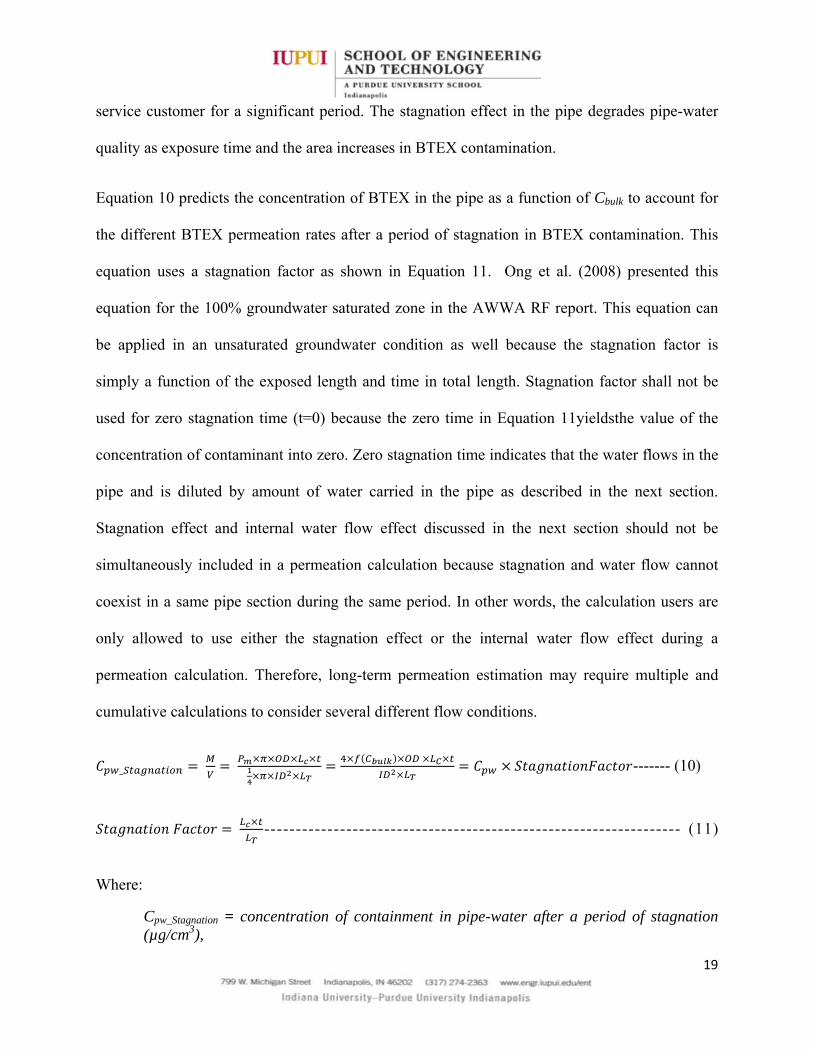
Equation 10 predicts the concentration of BTEX in the pipe as a function of Cbulk to account for
the different BTEX permeation rates after a period of stagnation in BTEX contamination. This
equation uses a stagnation factor as shown in Equation 11. Ong et al. (2008) presented this
equation for the 100% groundwater saturated zone in the AWWA RF report. This equation can
be applied in an unsaturated groundwater condition as well because the stagnation factor is
simply a function of the exposed length and time in total length. Stagnation factor shall not be
used for zero stagnation time (t=0) because the zero time in Equation 11yieldsthe value of the
concentration of contaminant into zero. Zero stagnation time indicates that the water flows in the
pipe and is diluted by amount of water carried in the pipe as described in the next section.
Stagnation effect and internal water flow effect discussed in the next section should not be
simultaneously included in a permeation calculation because stagnation and water flow cannot
coexist in a same pipe section during the same period. In other words, the calculation users are
only allowed to use either the stagnation effect or the internal water flow effect during a
permeation calculation. Therefore, long-term permeation estimation may require multiple and
cumulative calculations to consider several different flow conditions.
_ ------- (10)
------------------------------------------------------------------ (11)
Where:
Cpw_Stagnation = concentration of containment in pipe-water after a period of stagnation (µg/cm3),

20
M = total mass of permeated contaminant (µg),
V = volume of water in the pipe (cm3),
Pm = steady permeation rate of the contaminant (µg/cm2/day); Pm is shown as a function of Cbulk, or f(Cbulk) to account for permeation rate for different BTEX
t = period of stagnation (days),
Lc = length of contaminated pipe (cm),
LT = total length of pipe (cm),
ID = inside diameter of pipe (cm), and
OD = outside diameter of pipe (cm).
5.4 Condition Variables – Internal Water Flow Effect in Contaminated Ground
The water flow rate in the pipe affects the concentration of contaminants. The flow velocity is a
variable factor to estimate the amount of BTEX residuals in a given time and length. The flow
velocity fluctuates by the water consumption and the pressure throughout a water distribution
system. The flow velocity in the water pipe directly increases as the water pressure increases to
meet higher water demands through same size of pipe. The peak hourly demand is the highest
point of water consumption per day, thus the concentration of contaminants changes by hourly
demand of water supply. According to AWWA RF manual (2000), the minimum unidirectional
flow velocity to remove biofilm and loose deposits is 5 ft/sec and a velocity of 12 ft/sec to
remove sand from siphons. Jana Lab (2012) published a survey that documented a 6.7 ft/sec for
average maximum design normal flow and 11.6 ft/sec for average maximum design fire flow.
Thus, flow velocity 5 ft/sec is chosen as a normal flow value for the permeation estimation
calculations.
To take into account the flow velocity effect uniformly in pipe-water contamination, flow
velocity is, assumed to be, steady during period (t) in Equation 12. The Equation 12 is derived

21
from integration of Equation 13into Equation 1. The unit of flow velocity is cm/day. Flow
velocity is usually expressed in terms of meter per second or feet per second. A conversion factor
is used as multiplying conversion factor (2,633,472) in ft/s to get cm/day, for example, 3 – 5ft/s is
equal to 7,900,416 – 13,167,360cm/day. Flow factor (Equation 13) and stagnation factor
(Equation 11) should be used in entirely separated calculation process as shown in Figure 2.
_ ------------- (12)
- ----------------------------------------------------------------------------------- (13)
Where:
Cpw_Flow = concentration of containment in pipe-water at a flow rate (µg/cm3),
M = total mass of permeated contaminant (µg),
V = volume of water in the pipe (cm3),
Pm = steady permeation rate of the contaminant (µg/cm2/day),
t = period of stagnation (days),
Lc = length of contaminated pipe (cm),
OD = outside diameter of pipe (cm),
q = water flow rate (cm3/day), and
v = average water flow velocity (cm/day).
5.5 Condition Variables – PE Pipe Thickness Effect in Contaminated Ground
The permeation rates are the results of empirical tests using 1” IPS, SDR 9, standard size
HDPE pipe for a water distribution system. Small size pipes are more vulnerable to
permeation than larger size pipes. Table 7 shows pipe wall thickness correction factors from
the AWWA RF report (Ong et al. 2008). 1” IPS SDR 9 pipe has a correction factor as one,
22
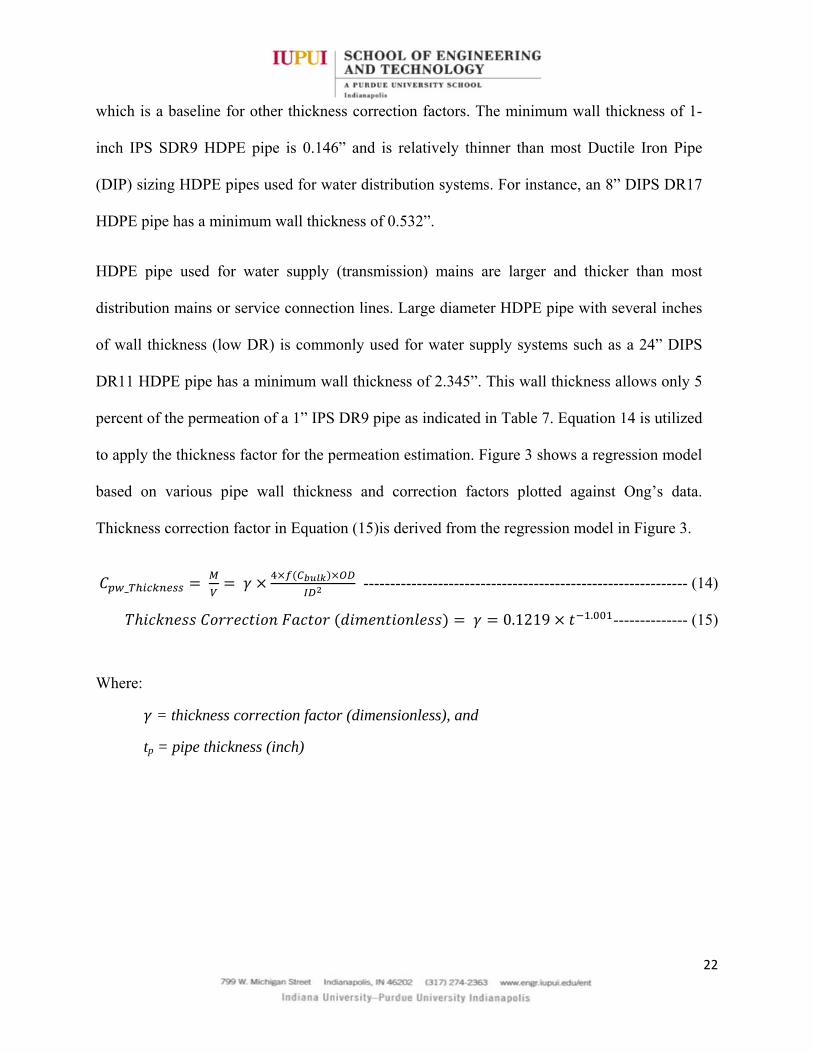
which is a baseline for other thickness correction factors. The minimum wall thickness of 1-
inch IPS SDR9 HDPE pipe is 0.146” and is relatively thinner than most Ductile Iron Pipe
(DIP) sizing HDPE pipes used for water distribution systems. For instance, an 8” DIPS DR17
HDPE pipe has a minimum wall thickness of 0.532”.
HDPE pipe used for water supply (transmission) mains are larger and thicker than most
distribution mains or service connection lines. Large diameter HDPE pipe with several inches
of wall thickness (low DR) is commonly used for water supply systems such as a 24” DIPS
DR11 HDPE pipe has a minimum wall thickness of 2.345”. This wall thickness allows only 5
percent of the permeation of a 1” IPS DR9 pipe as indicated in Table 7. Equation 14 is utilized
to apply the thickness factor for the permeation estimation. Figure 3 shows a regression model
based on various pipe wall thickness and correction factors plotted against Ong’s data.
Thickness correction factor in Equation (15)is derived from the regression model in Figure 3.
_ ------------------------------------------------------------- (14)
0.1219 . -------------- (15)
Where:
= thickness correction factor (dimensionless), and
tp = pipe thickness (inch)

23
Table 7. Pipe Wall Thickness Correction Factor (γ)
HDPE Pipe Wall Thickness (inch) Correction Factor (dimensionless)
0.069 1.769 0.097 1.258
0.122 1.000
0.123 0.992
0.154 0.793
0.155 0.787
0.202 0.604
0.235 0.519
0.238 0.513
0.307 0.401
0.598 0.204
0.861 0.142
1.128 0.108
1.384 0.088
1.645 0.074 1.908 0.064 2.171 0.056 2.432 0.050 2.695 0.045 3.218 0.038
* Data: Ong et al. (2008)

24
Figure 3. Regression Model for Permeation Correction Factor by Thickness of PE Pipe
5.6 Condition Variables –Different Ground Temperatures
Diffusion coefficients tend to increase as temperature increases. All tests shown in the AWWA
RF report were conducted at ambient room temperature at approximately 23 °C (73.4 °F) (Ong et
al. 2008). The ground temperature depends on many factors including soil properties such as
thermal conductivity, degree of groundwater saturation, presence of a geothermal source, and the

25
atmosphere temperature. Water distribution pipes are buried under minimum required cover
depth regulated by design standards. Although ground temperature tends to be more stable than
atmosphere temperature, it still affects permeation rates. according to a water temperature survey
in the United States, average temperature of water in water distribution systems is approximately
14 °C (57 °F) and average temperatures range is between 3°C (39 °F) and 29 °C (84 °F) (Jana
Lab 2010).There is no reference data regarding BTEX permeation rate changes versus the
ground temperature changes. However, it is obvious that the magnitude of permeation may be
over estimated if the ground temperature is lower than the baseline temperature at 23 °C. Joo et
al. (2004) recommended that the effects of temperature on diffusion coefficients should be
considered for practical applications.
USEPA (2011) provides a web tool for site assessment using the Hayduk and Laudie (HL)
method for estimating the diffusivity of BTEX in water as shown in Equation (16).
. . . -------------------------------------------------------------------------------------- (16)
Where:
DBW = the diffusion coefficient of compound B in water (cm2/s),
nw= the temperature corrected viscosity of water, and
VB = the LaBas molar volume increments.
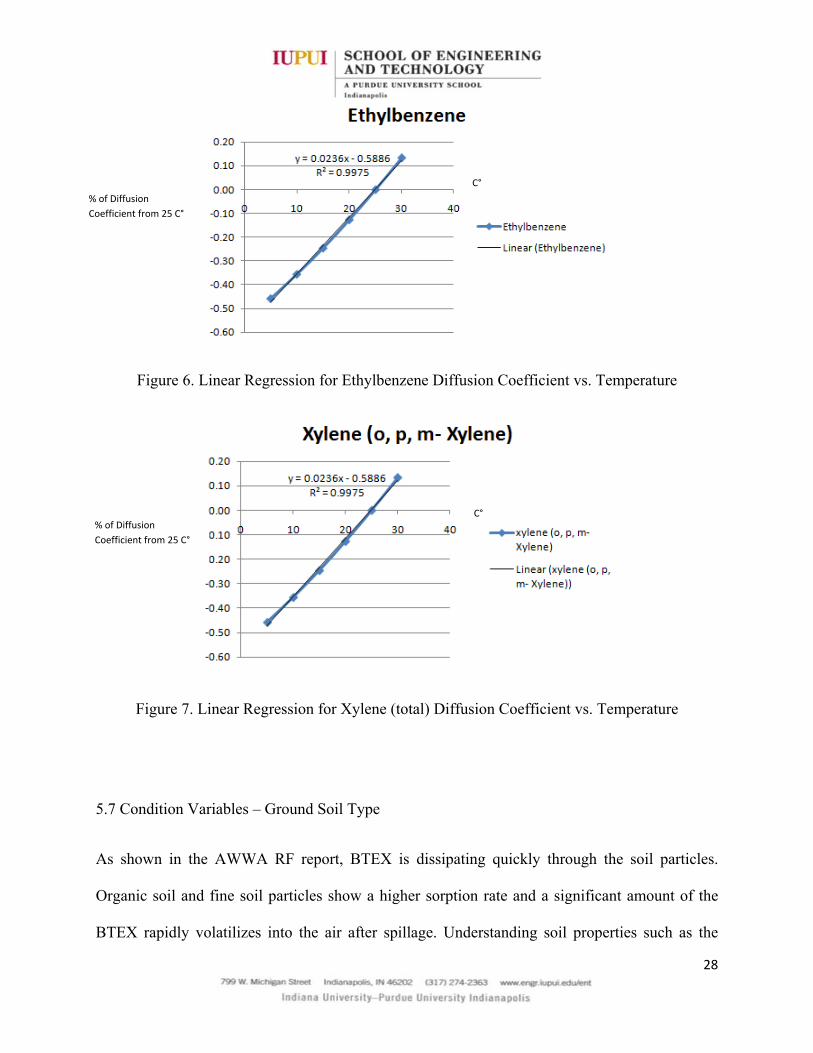
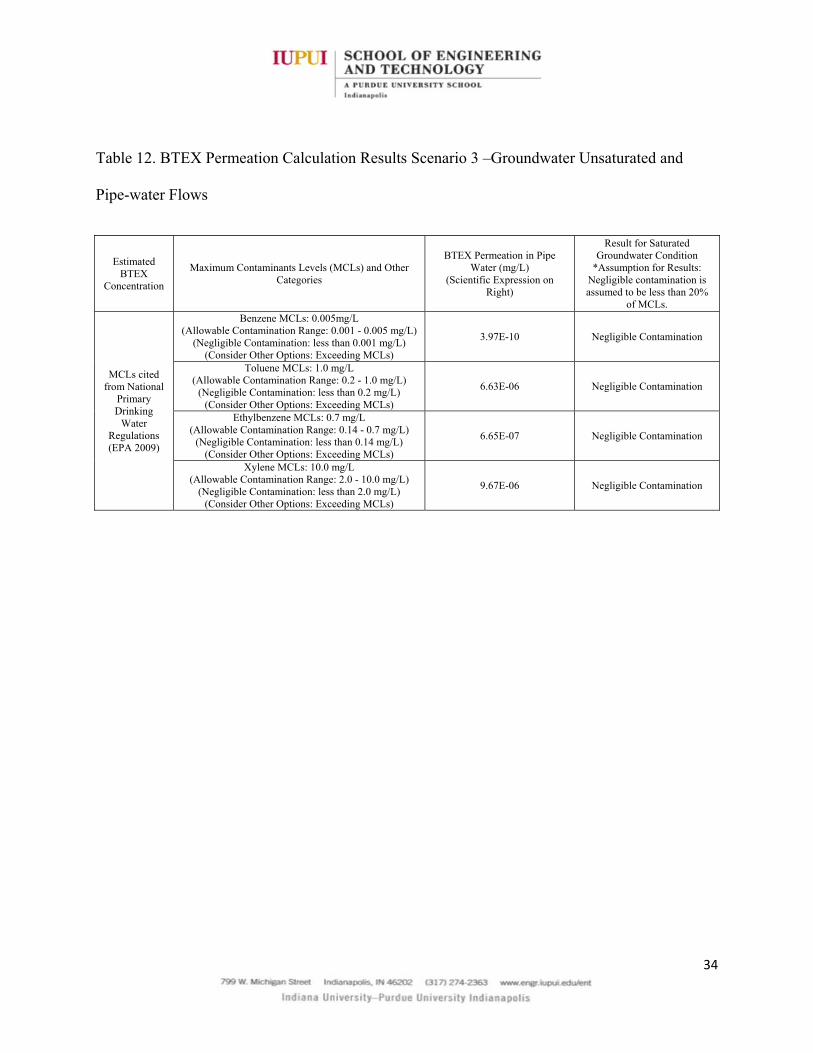
Diffusion coefficients upon various temperatures as shown in Table 8 are acquired from the
USEPA web tool and use 5°C incremental ranging from 5°C to 30°C. The results of diffusion
coefficients consistently and gradually increase as temperature increases. Fick’s first law for
mass flux of organic compounds gives the proportionality between diffusion coefficients and

26
concentration of contaminants. The permeation rate is empirically correlated to the diffusion
coefficient. Therefore, the permeation rate may drop nearly 25% at 15 °C as compared to
ambient temperature baseline at 25°C. The calculation process in section 6 applies temperature
factors from BTEX linear regression models in Figures 4, 5, 6, and 7. The regression model is
based on the Table 8 data and indicates the percentage change of the diffusion coefficients from
the baseline temperature of 25°C.
Table 8. Diffusion Coefficient per Temperature Change in Water
Benzene
°C Estimated Diffusion Coefficient in Water (cm2/sec)
Change of Diffusion Coefficient in Percent (25°CDiffusion Coefficient is used as a baseline value)
5 0.00000560 ‐46 %
10 0.00000560 ‐46 %
15 0.00000777 ‐25 %
20 0.00000899 ‐13 %
25 0.00001030 0 %
30 0.00001170 14 %
Ethylbenzene
5 0.00000447 ‐46 %
10 0.00000531 ‐35 %
15 0.00000621 ‐25 %
20 0.00000719 ‐13 %
25 0.00000823 0 %
30 0.00000933 13 %
Toluene
5 0.00000495 ‐46 %
10 0.00000588 ‐35 %
15 0.00000688 ‐24 %
20 0.00000796 ‐13 %
25 0.00000910 0 %
30 0.00001030 13 %
Xylene (o, p, m‐ Xylene)
5 0.00000447 ‐46 %
10 0.00000531 ‐35 %
15 0.00000621 ‐25 %
20 0.00000719 ‐13 %
25 0.00000823 0 %
30 0.00000933 13 %

27
Figure 4. Linear Regression for Benzene Diffusion Coefficient vs. Temperature
Figure 5. Linear Regression for Toluene Diffusion Coefficient vs. Temperature
% of Diffusion
Coefficient from 25 C°
% of Diffusion
Coefficient from 25 C°
C°
C°
28
Figure 6. Linear Regression for Ethylbenzene Diffusion Coefficient vs. Temperature
Figure 7. Linear Regression for Xylene (total) Diffusion Coefficient vs. Temperature
5.7 Condition Variables – Ground Soil Type
As shown in the AWWA RF report, BTEX is dissipating quickly through the soil particles.
Organic soil and fine soil particles show a higher sorption rate and a significant amount of the
BTEX rapidly volatilizes into the air after spillage. Understanding soil properties such as the
% of Diffusion
Coefficient from 25 C°
% of Diffusion
Coefficient from 25 C°
C°
C°

29
coefficient of permeability, also known as the hydraulic conductivity, are very important to
estimate the BTEX transport through groundwater in underground soil structures. The typical
value of the permeability coefficient of clean gravel is a million times larger than that of typical
clay (Das 1985). The groundwater permeability concept is based on 100% groundwater
saturation through porous soil media. (The void space between soil particles is completely filled
with groundwater.) The permeation rates shown in Equations2, 3, 4 and 5are obtained from 100%
saturated groundwater condition.
The permeation rates in unsaturated groundwater zone are significantly affected by soil type.
Various soil types in BTEX contaminated sites will have significantly different degrees of
sorption and capillary force. Ong et al (2008) used only three soil types; 1) silica sand, 2) sand-
top soil mixture, and 3) organic top soil. Civil engineering practice uses standard soil
classification systems in accordance with ASTM and AASHTO. BTEX permeation rates shall be
tested in accordance with standard soil classification systems such as the unified soil
classification system to be used as reference data for all other types of soils. The AWWA RF
report shows approximately four (4) times the cumulative mass of total BTEX permeation
between silica sand and organic top soil. The organic content of the silica sand was 0 percent
while the organic top soil had an organic content of 5 percent. An HDPE pipe buried in soil high
in organic matter may have a significantly lower permeation rate. The soil type factor is added in
the permeation estimation calculation in section 6. The author recommends using the soil factors
less than 1 when soil contains organic matter and fine particles.

30
6.0 BTEX PERMEATION CALCULATION
Figure 2 is a flow chart for the calculation of BTEX permeation through HDPE pipe. There are
two decision (branching) points in the flow chart: (1) Is the ground water level above the pipe?
(2) Is water flowing in the pipe? Thus, four possible BTEX permeation scenarios can occur as
follows:
1. Pipe below the groundwater level, referred to as the groundwater saturated case, and
water flowing inside the pipe see results in Table 10
2. Pipe above the groundwater level in dry, unsaturated soil, referred to as the
groundwater unsaturated case, and water flowing inside the pipe see results in Table
11
3. Pipe below the groundwater level and water stagnate inside the pipe see results in
Table 12
4. Pipe above the groundwater level and water stagnate inside the pipe see results in
Table 13
An example calculation is given below for each of the four permeation scenarios. Table 9 shows
the input parameters used for the four examples. The bulk concentrations for BTEX organic
contaminants are randomly selected to be 50% aqueous BTEX solution, which is equal to 50
percent bulk concentration, dissolved in the saturated groundwater. Other input parameters such
as 100 percent bulk concentration can be simulated using the same permeation estimation
methodology shown in Figures 8 and 9.The BTEX concentration in dry soil is based on the
residential surface soil regulatory guidance values (RGVs).State environmental agencies in the

31
United States have different contamination level thresholds that require regulatory action.
Jennings (2009) conducted statistical analysis for BTEX RGVs data. Fifty (50) percent
probability values are used for concentration level in Table 9.
Other input values for the calculation include stagnation period (Tables11 and 13), flow velocity
(Tables 10 and 12), length of contaminated pipe and total length of pipe, and pipe dimension, as
shown in Table 9.Tables 10, 11, 12,and 13present permeation calculation results. Appendices 1,
2, 3 and 4 show the step-by-step procedures of the four categorized permeation calculations. The
result cell indicates one of four categories depending on estimated BTEX permeation in pipe-
water. Four categories in the result cell are:
1) “Negligible Contamination”: permeated BTEX contamination is less than 20 percent.
2) “Allowable”: permeated BTEX contamination ranges between 20 percent and 100 percent
MCLs.
3) “Consider other options”: permeated BTEX contamination exceeds 100 percent MCLs.
4) “Invalid Calculation _ Use other parameters”: consider other input parameters.

32
Table 9. Input Parameters for BTEX Permeation Calculations
Input Parameters Groundwater Saturated Soil and BTEX 50% Saturated Solution(see results in
Table 10 and 11) Groundwater Unsaturated Soil
Benzene 31.2a Cbulk = mg/L 1.0c Cbulk = mg/kg
Toluene 26.3a Cbulk = mg/L 100.0c Cbulk = mg/kg
Ethylbenzene 3.2b Cbulk = mg/L 100.0c Cbulk = mg/kg
Xylenes (total) 3.2b Cbulk = mg/L 200.0c Cbulk = mg/kg
Stagnation 1 day (24 hours) 1 day (24 hours)
Flow Velocity 1.524 m/s (5ft/s) 1.524 m/s (5ft/s)
Length of contaminated pipe (LC)
100 ft 100 ft
Total length of pipe (LT) 1,000ft 1,000 ft
Ground Temperature 15 °C (59 °F) 15 °C (59 °F)
Soil Factor 0.9 0.9
HDPE Pipe Size 16 inch, DIPS, 200 psi, DR 9, (1.933”
Thickness) 16 inch, DIPS, 200 psi, DR 9,
(1.933” Thickness) Note: a Data from Table 1, bEstimated as 50% of others (mixture of Ethylbenzene and Total Xylenes) in Table 1, c50% probability value from Jennings (2009)

33
Table 10. BTEX Permeation Calculation Results Scenario 1 –Groundwater Saturated and Pipe-
water Flows
Estimated BTEX
Concentration
Maximum Contaminants Levels (MCLs) and Other Categories
BTEX Permeation in Pipe Water (mg/L)
(Scientific Expression on Right)
Result for Saturated Groundwater Condition
*Assumption for Results: Negligible contamination is assumed to be less than 20%
of MCLs.
MCLs cited from National
Primary Drinking
Water Regulations (EPA 2009)
Benzene MCLs: 0.005mg/L (Allowable Contamination Range: 0.001 - 0.005 mg/L)
(Negligible Contamination: less than 0.001 mg/L) (Consider Other Options: Exceeding MCLs)
7.71E-06 Negligible Contamination
Toluene MCLs: 1.0 mg/L (Allowable Contamination Range: 0.2 - 1.0 mg/L)
(Negligible Contamination: less than 0.2 mg/L) (Consider Other Options: Exceeding MCLs)
7.28E-06 Negligible Contamination
Ethylbenzene MCLs: 0.7 mg/L (Allowable Contamination Range: 0.14 - 0.7 mg/L)
(Negligible Contamination: less than 0.14 mg/L) (Consider Other Options: Exceeding MCLs)
5.85E-08 Negligible Contamination
Xylene MCLs: 10.0 mg/L (Allowable Contamination Range: 2.0 - 10.0 mg/L)
(Negligible Contamination: less than 2.0 mg/L) (Consider Other Options: Exceeding MCLs)
5.85E-08 Negligible Contamination
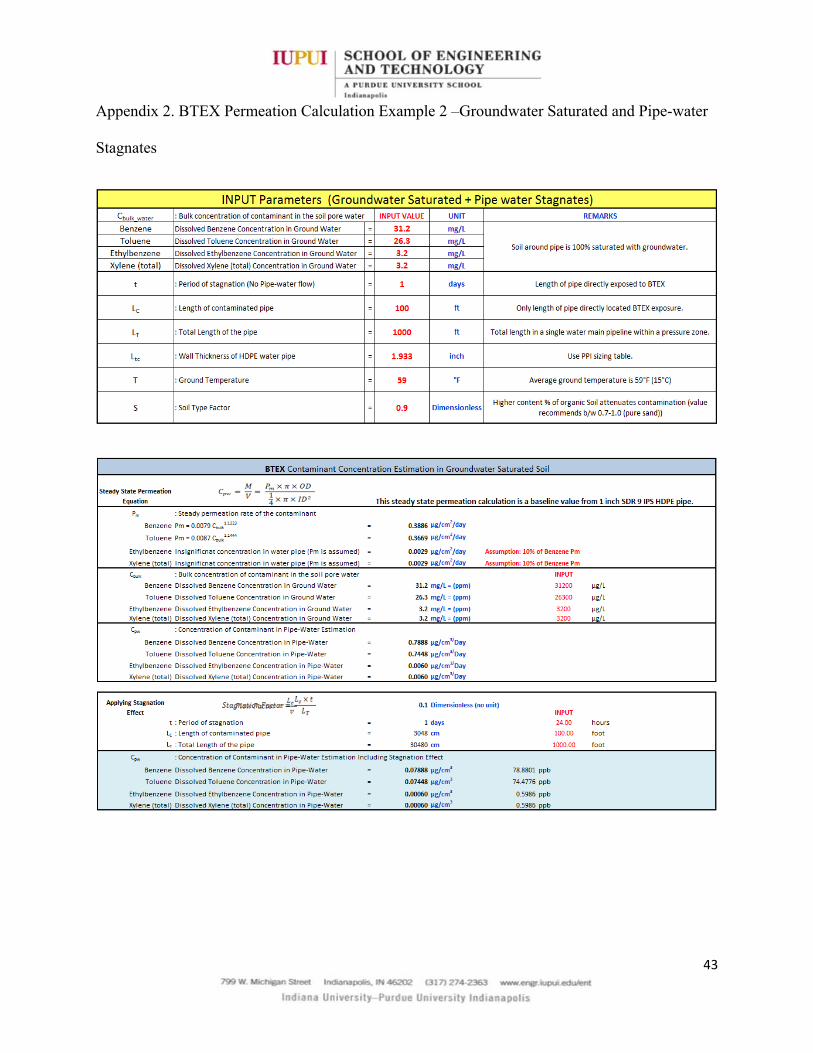
Table 11. BTEX Permeation Calculation Results Scenario 2 –Groundwater Saturated and Pipe-
water Stagnates
Estimated BTEX
Concentration
Maximum Contaminants Levels (MCLs) and Other Categories
BTEX Permeation in Pipe Water (mg/L)
(Scientific Expression on Right)
Result for Saturated Groundwater Condition
*Assumption for Results: Negligible contamination is assumed to be less than 20%
of MCLs.
MCLs cited from National
Primary Drinking
Water Regulations (EPA 2009)
Benzene MCLs: 0.005mg/L (Allowable Contamination Range: 0.001 - 0.005 mg/L)
(Negligible Contamination: less than 0.001 mg/L) (Consider Other Options: Exceeding MCLs)
3.33E-03 Allowable
Toluene MCLs: 1.0 mg/L (Allowable Contamination Range: 0.2 - 1.0 mg/L)
(Negligible Contamination: less than 0.2 mg/L) (Consider Other Options: Exceeding MCLs)
3.15E-03 Negligible Contamination
Ethylbenzene MCLs: 0.7 mg/L (Allowable Contamination Range: 0.14 - 0.7 mg/L)
(Negligible Contamination: less than 0.14 mg/L) (Consider Other Options: Exceeding MCLs)
2.53E-05 Negligible Contamination
Xylene MCLs: 10.0 mg/L (Allowable Contamination Range: 2.0 - 10.0 mg/L)
(Negligible Contamination: less than 2.0 mg/L) (Consider Other Options: Exceeding MCLs)
2.53E-05 Negligible Contamination
34
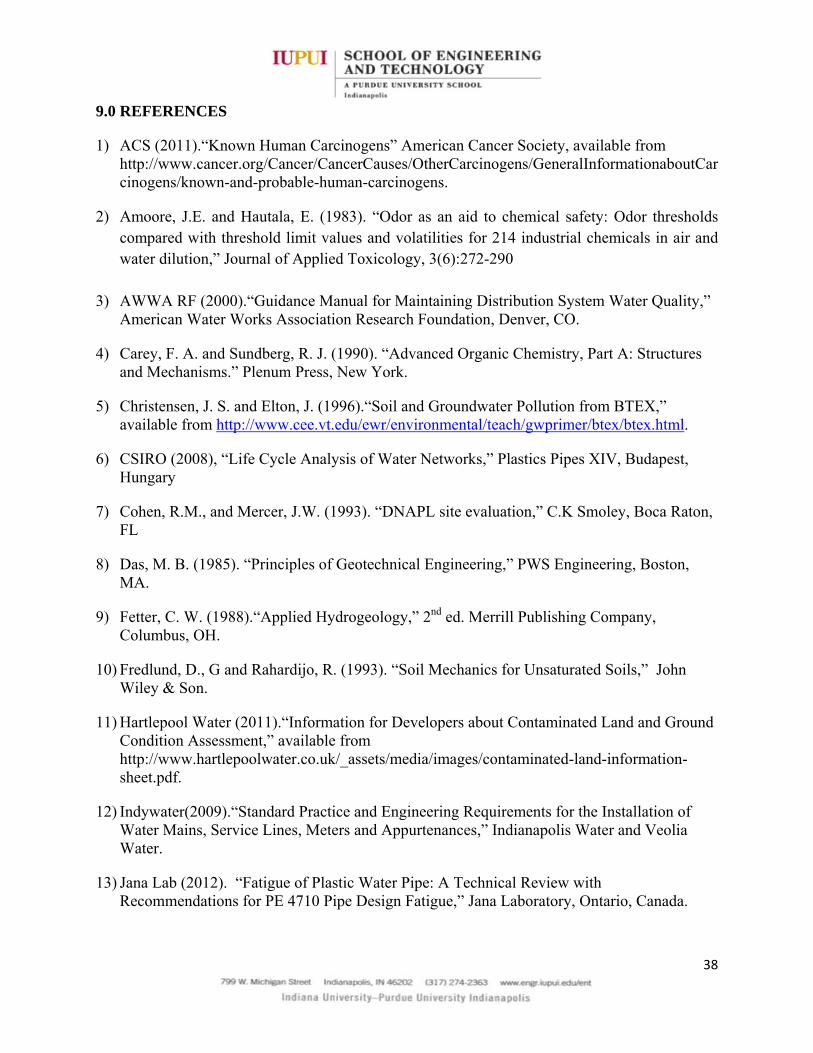
Table 12. BTEX Permeation Calculation Results Scenario 3 –Groundwater Unsaturated and
Pipe-water Flows
Estimated BTEX
Concentration
Maximum Contaminants Levels (MCLs) and Other Categories
BTEX Permeation in Pipe Water (mg/L)
(Scientific Expression on Right)
Result for Saturated Groundwater Condition
*Assumption for Results: Negligible contamination is assumed to be less than 20%
of MCLs.
MCLs cited from National
Primary Drinking
Water Regulations (EPA 2009)
Benzene MCLs: 0.005mg/L (Allowable Contamination Range: 0.001 - 0.005 mg/L)
(Negligible Contamination: less than 0.001 mg/L) (Consider Other Options: Exceeding MCLs)
3.97E-10 Negligible Contamination
Toluene MCLs: 1.0 mg/L (Allowable Contamination Range: 0.2 - 1.0 mg/L)
(Negligible Contamination: less than 0.2 mg/L) (Consider Other Options: Exceeding MCLs)
6.63E-06 Negligible Contamination
Ethylbenzene MCLs: 0.7 mg/L (Allowable Contamination Range: 0.14 - 0.7 mg/L)
(Negligible Contamination: less than 0.14 mg/L) (Consider Other Options: Exceeding MCLs)
6.65E-07 Negligible Contamination
Xylene MCLs: 10.0 mg/L (Allowable Contamination Range: 2.0 - 10.0 mg/L)
(Negligible Contamination: less than 2.0 mg/L) (Consider Other Options: Exceeding MCLs)
9.67E-06 Negligible Contamination

35
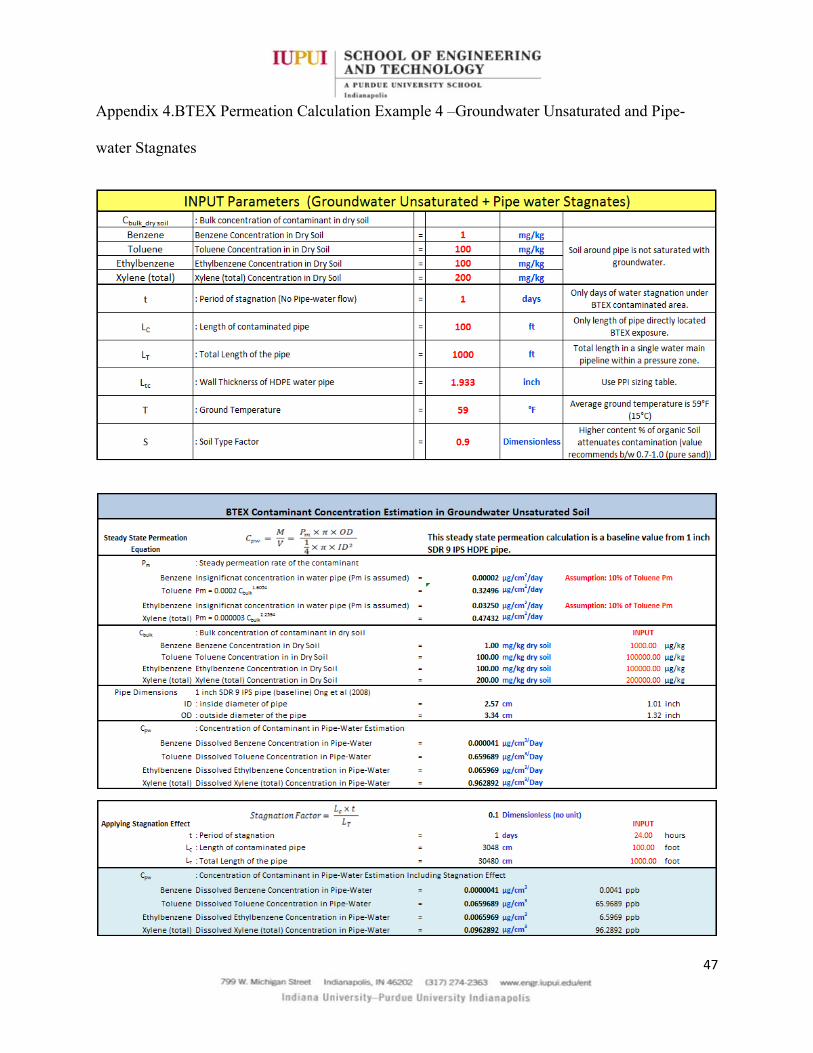
Table 13. BTEX Permeation Calculation Results Scenario 4 –Groundwater Unsaturated and
Pipe-water Stagnates
Estimated BTEX
Concentration
Maximum Contaminants Levels (MCLs) and Other Categories
BTEX Permeation in Pipe Water (mg/L)
(Scientific Expression on Right)
Result for Saturated Groundwater Condition
*Assumption for Results: Negligible contamination is assumed to be less than 20%
of MCLs.
MCLs cited from National
Primary Drinking
Water Regulations (EPA 2009)
Benzene MCLs: 0.005mg/L (Allowable Contamination Range: 0.001 - 0.005 mg/L)
(Negligible Contamination: less than 0.001 mg/L) (Consider Other Options: Exceeding MCLs)
1.71E-07 Allowable
Toluene MCLs: 1.0 mg/L (Allowable Contamination Range: 0.2 - 1.0 mg/L)
(Negligible Contamination: less than 0.2 mg/L) (Consider Other Options: Exceeding MCLs)
2.86E-03 Negligible Contamination
Ethylbenzene MCLs: 0.7 mg/L (Allowable Contamination Range: 0.14 - 0.7 mg/L)
(Negligible Contamination: less than 0.14 mg/L) (Consider Other Options: Exceeding MCLs)
2.87E-04 Negligible Contamination
Xylene MCLs: 10.0 mg/L (Allowable Contamination Range: 2.0 - 10.0 mg/L)
(Negligible Contamination: less than 2.0 mg/L) (Consider Other Options: Exceeding MCLs)
4.18E-03 Negligible Contamination
7.0 FUTURE RESEARCH
A BTEX permeation calculation methodology for water industry’s use is presented in this report.
Further research and testing may require simulating real field environments. The small-scale
experiments using a glass jar and 1” HDPE pipe shown in the AWWA RF report may not
adequately demonstrate a real field full-scale permeation process. A real-field test for permeation
rates in a 6 inch or 8 inch distribution pipe would be helpful. Another theoretical approach using
conventional geotechnical concept may strengthen the concept based on Fick’s law.
Geotechnical consideration may include, but not limited to, groundwater migration, permeability
of soil, pore-water pressure, and backfill conditions in trench. Design consideration may include
type of water pipeline, for example, transmission main, distribution main, and service connection.
Several design manuals approve only metallic pipe materials as non-permeable pipe materials in
the organic contaminated site including BTEX contamination (Indy Water 2009, Hartlepool

36
Water 2011, and WRAS 2002). However, specific guidance regarding the contamination
threshold and magnitude, and effective boundary is not addressed in water design manuals.
Research for engineering methodology to determine the boundary limits of the contaminated site
and BTEX permeation field-testing data collection will improve the existing permeation
calculation methodology presented in this report.
8.0 CONCLUSIONS
This report presents an engineering methodology for calculating the BTEX permeation through
HDPE water pipe. The report also includes various aspects of BTEX transport mechanisms,
health effects and regulations, and properties of BTEX associated with permeation process. The
AWWA RF report proposes a BTEX permeation methodology based on several lab experiments.
Although this report works mostly within the existing permeation calculation methodology in the
AWWA RF report, it reinforces various engineering variables and aspects to incorporate into the
BTEX permeation calculation methodology so this proposed calculation can be used in
engineering practice.
This report also shows that conclusions drawn about permeation through 1” HDPE pipe in the
AWWA RF report may be overly conservative for larger diameter HDPE pipes because of the
significance of pipe wall thickness in reducing permeation. For instance, 24”DIPS DR11 pipe
has a minimum wall thickness of 2.345”. The permeation rate through this wall is about one-
twentieth of that of the 1” test pipe. The dilution by water flow in HDPE pipes can be considered
due to significant BTEX contamination reduction.
The BTEX permeation calculation methodology is demonstrated using plausible input
parameters to simulate the calculation process through four examples in Figures 8, 9, 10, and 11

37
using six variables. Units in the examples are converted into common engineering expressions in
order to avoid any unit-conversion mistake. The calculation provides numerical and verbal
expression results. Verbal expression helps the user understand magnitude of permeation
estimation in the pipe-water. The BTEX permeation methodology is fully expanded throughout
the report to develop a computerized BTEX permeation calculator. The example calculations
show that the presence of BTEX contamination in soil along an HDPE water pipe does not
necessarily mean that the drinking water in the pipe will exceed regulatory limits. This report
may assist engineers and others when they need to make an engineering decision for water pipe
material selection.
38
9.0 REFERENCES
1) ACS (2011).“Known Human Carcinogens” American Cancer Society, available from http://www.cancer.org/Cancer/CancerCauses/OtherCarcinogens/GeneralInformationaboutCarcinogens/known-and-probable-human-carcinogens.
2) Amoore, J.E. and Hautala, E. (1983). “Odor as an aid to chemical safety: Odor thresholds compared with threshold limit values and volatilities for 214 industrial chemicals in air and water dilution,” Journal of Applied Toxicology, 3(6):272-290
3) AWWA RF (2000).“Guidance Manual for Maintaining Distribution System Water Quality,” American Water Works Association Research Foundation, Denver, CO.
4) Carey, F. A. and Sundberg, R. J. (1990). “Advanced Organic Chemistry, Part A: Structures and Mechanisms.” Plenum Press, New York.
5) Christensen, J. S. and Elton, J. (1996).“Soil and Groundwater Pollution from BTEX,” available from http://www.cee.vt.edu/ewr/environmental/teach/gwprimer/btex/btex.html.
6) CSIRO (2008), “Life Cycle Analysis of Water Networks,” Plastics Pipes XIV, Budapest, Hungary
7) Cohen, R.M., and Mercer, J.W. (1993). “DNAPL site evaluation,” C.K Smoley, Boca Raton, FL
8) Das, M. B. (1985). “Principles of Geotechnical Engineering,” PWS Engineering, Boston, MA.
9) Fetter, C. W. (1988).“Applied Hydrogeology,” 2nd ed. Merrill Publishing Company, Columbus, OH.
10) Fredlund, D., G and Rahardijo, R. (1993). “Soil Mechanics for Unsaturated Soils,” John Wiley & Son.
11) Hartlepool Water (2011).“Information for Developers about Contaminated Land and Ground Condition Assessment,” available from http://www.hartlepoolwater.co.uk/_assets/media/images/contaminated-land-information-sheet.pdf.
12) Indywater(2009).“Standard Practice and Engineering Requirements for the Installation of Water Mains, Service Lines, Meters and Appurtenances,” Indianapolis Water and Veolia Water.
13) Jana Lab (2012). “Fatigue of Plastic Water Pipe: A Technical Review with Recommendations for PE 4710 Pipe Design Fatigue,” Jana Laboratory, Ontario, Canada.

39
14) Jana Lab (2010). “Technical Report: Impact of Portable Water Disinfectants on PE pipe,” Jana Laboratory, Ontario, Canada.
15) Jennings, A.A (2009).“Statistical Analysis of BTEX Surface Soil Regulatory Guidance values,” Journal of Environmental Engineering, Vol. 135, No. 9.
16) Joo, J., Kim, J., and Nam, K. (2004).“Mass Transfer of Organic Compounds in Dilute Aqueous Solutions into HDPE Geomembranes,” Journal of Environmental Engineering, ASCE, Vol. 130, No. 2.
17) Joo, J., Nam, K, and Kim, J. (2005).“Estimation of Mass Transport Parameters of Organic Compounds through High Density Polyethylene Geomembranes Using a Modified Double-Compartment Apparatus,” Journal of Environmental Engineering, ASCE, Vol. 131, No. 5.Kim, S., Hwang, I., Kim, D., Lee, S., and Jury, W., A. (2003).“Effect of Sorption on Benzene Biodegradation in sandy soil,” Environmental toxicology and chemistry, Vol. 22, No. 10.
18) Kim, S., Kim, D., and Yun, S. (2006). “Attenuation of Aqueous Benzene in Soils Under Saturated Flow Conditions,” Environmental Technology, Vol. 27, No. 1.
19) Nathanson, J., A. (2008). “Basic Environmental Technology,” Pearson Prentice Hall.
20) Ong, S. K., Gaunt, J. A., Mao, F., and Cheng C. L. (2008).“Impact of Hydrocarbons on PE/PVC Pipes and Pipe Gaskets,” American Water Works Association Research Foundation, Denver, CO.
21) Park, J., and Nibras, M. (1993).“Mass Flux of Organic Chemicals through Polyethylene Geomembranes,” Water Environment Research, Vol. 65, No. 3.
22) Park, J., Sakti, J., and Hoopes, J. (1996).“Transport of Aqueous Organic Compounds in Thermoplastic Geomembranes II: Mass Flux Estimates and Practical Implications,” Journal of Environmental Engineering, Vol. 122, No. 9.
23) Quevauviller, P., and Thompson, K., C. (2006), “Analytical Methods for drinking water,” John Wiley & Sons, Ltd.
24) Sangam, H. P., and Rowe, R. K. (2001). “Mitigation of Dilute Aqueous Organic Pollutants Through HDPE Geomembranes,” Geotextiles and Geomembranes, Vol. 19, No. 6.
25) SDWF (2011). “Comparison Chart of Drinking Water from Around the World,” Safe Drinking Water Foundation, accessed May 10, 2011, available from http://www.safewater.org/PDFS/resourceswaterqualityinfo/RegulationsGuidelinesComparisons.pdf.
26) Stern, B. R. and Lagos, G. (2008).“Human and Ecological Risk Assessment,” Taylor & Francis Group, LLC.
40
27) USEPA (2009).“National Primary Drinking Water Regulations,” the United States Environmental Protection Agency, available from http://water.epa.gov/drink/contaminants/upload/mcl-2.pdf.
28) USEPA (2002).“Permeation and Leaching,” the United States Environmental Protection Agency, available from http://water.epa.gov/lawsregs/rulesregs/sdwa/tcr/upload/permeationandleaching.pdf.
29) USEPA (2011).“EPA On-line Tools for Site Assessment Calculation,” the United States Environmental Protection Agency, available from http://www.epa.gov/athens/learn2model/part-two/onsite/estdiffusion.html.
30) Eldinger, J., and Davis, C. A (2012).“Recent Earthquates: Implications for U.S. Water Utilities,” Water Research Foundation.
31) WRAS (2002). “The Selection of Materials for Water Supply Pipes to be Laid in Contaminated Land,” Water Regulations Advisory Scheme (WRAS), October 2002, No 9-04-03, Issue 1, available from http://www.wras.co.uk/PDF_Files/9-04-03%20Contaminated%20Land%20IGN.pdf.
32) Weast, R.C., Lide, D. R., Astle, M. J., and Berger, W. H. (1990).“CRC Handbook of Chemistry and Physics,” CRC Press, Inc., Boca Raton, FL.
33) Wilson, W.E., and Moore, J.E. (1998). “Benzene, Toluene, Ethylbenzene, Xylene, in Wilson, W.E., and Moore, J.E., eds., Glossary of Hydrology,” American Geological Institute, Alexandria, Virginia.
34) Yahya, S. M. (2006). “Fundamentals of Compressible Flow,” New Age International Ltd Publishers, New Delhi, INDIA
35) Yang, J., Spencer, R. D., Mersmann, M. A., and Gates, T. M. (1995).“Ground Water Contaminant Plume Differentiation and Source Determination Using BTEX Concentration Ratios,” Ground Water, Vol. 33 No.6.
36) Zang, W., and Bouwer, E., J. (1997).“Biodegradation of Benzene, Toluene, and naphthalene in soil-water slurry microcosms,” Biodegradation, Vol 8.No. 3.

41
Appendix 1. BTEX Permeation Calculation Example 1 –GroundwaterSaturated and Pipe-water
Flows

42
43
Appendix 2. BTEX Permeation Calculation Example 2 –Groundwater Saturated and Pipe-water
Stagnates

44

45
Appendix 3. BTEX Permeation Calculation Example 3 –Groundwater Unsaturated and Pipe-
water Flows

46
47
Appendix 4.BTEX Permeation Calculation Example 4 –Groundwater Unsaturated and Pipe-
water Stagnates

48