assessing welfare reform in the u.s.: from cash assistance to low-wage employment
DESCRIPTION
ASSESSING WELFARE REFORM IN THE U.S.: FROM CASH ASSISTANCE TO LOW-WAGE EMPLOYMENT Sheldon Danziger, Henry J. Meyer Distinguished University Professor of Public Policy, University of Michigan APRIL 2006. Background Policy Context. - PowerPoint PPT PresentationTRANSCRIPT
ASSESSING WELFARE REFORM IN THE U.S.: FROM CASH ASSISTANCE TO
LOW-WAGE EMPLOYMENT
Sheldon Danziger, Henry J. Meyer Distinguished University Professor of Public Policy, University of Michigan
APRIL 2006
Background Policy ContextBackground Policy Context
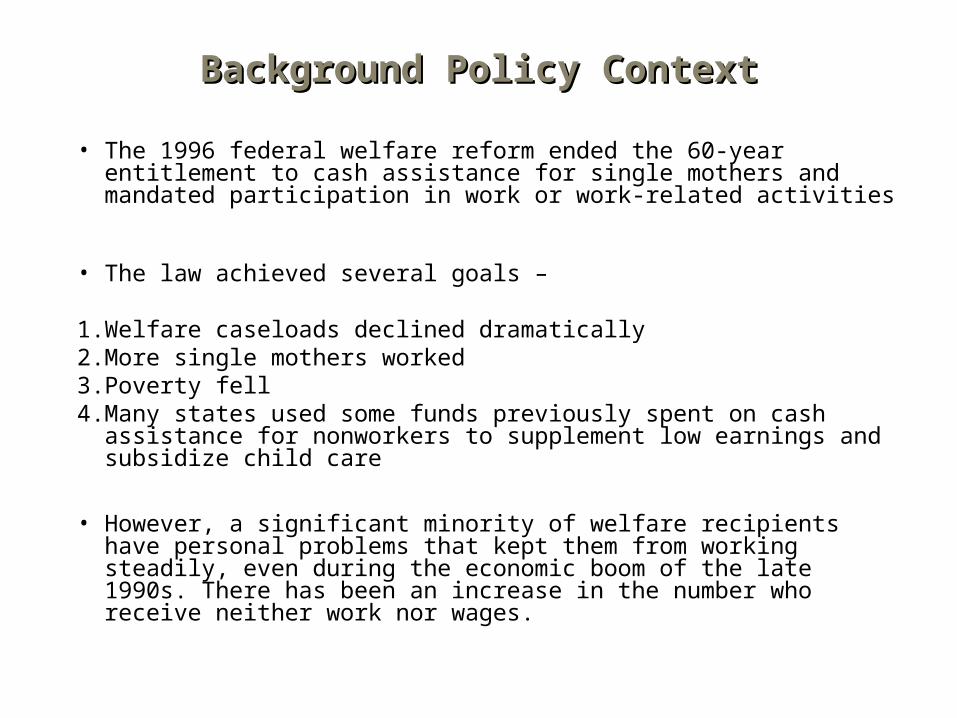
• The 1996 federal welfare reform ended the 60-year entitlement to cash assistance for single mothers and mandated participation in work or work-related activities
• The law achieved several goals –
1. Welfare caseloads declined dramatically2. More single mothers worked 3. Poverty fell 4. Many states used some funds previously spent on cash assistance for
nonworkers to supplement low earnings and subsidize child care
• However, a significant minority of welfare recipients have personal problems that kept them from working steadily, even during the economic boom of the late 1990s. There has been an increase in the number who receive neither work nor wages.
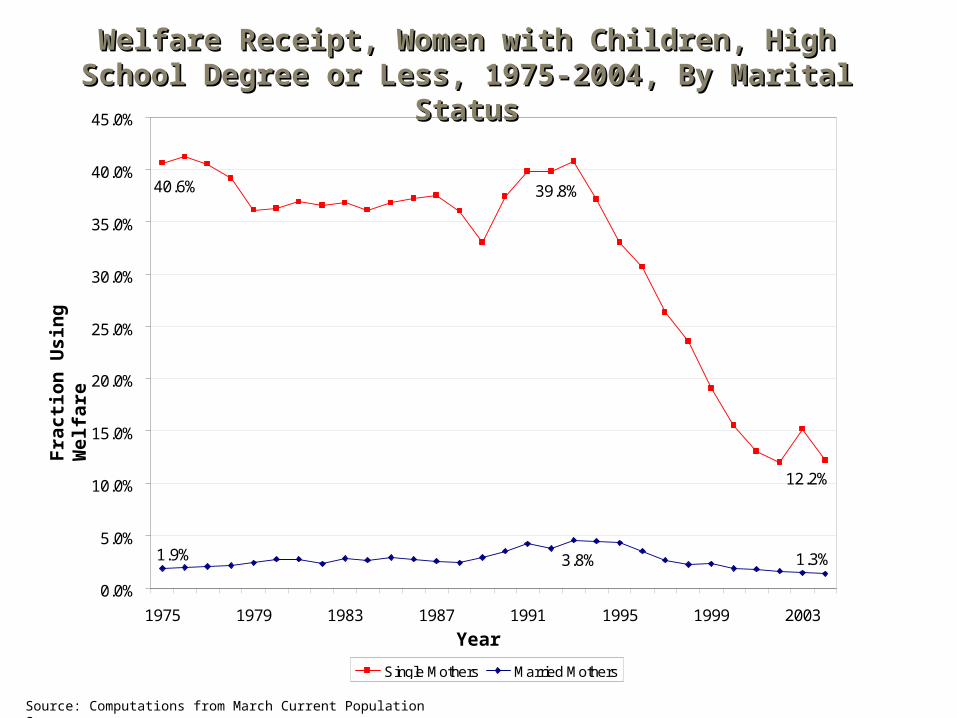
Welfare Receipt, Women with Children, High Welfare Receipt, Women with Children, High School Degree or Less, 1975-2004, By Marital School Degree or Less, 1975-2004, By Marital
StatusStatus
Fra
cti
on
Usi
ng
Wel
fare
Year
Source: Computations from March Current Population Surveys
40.6% 39.8%
12.2%
1.9% 3.8% 1.3%
0.0%
5.0%
10.0%
15.0%
20.0%
25.0%
30.0%
35.0%
40.0%
45.0%
1975 1979 1983 1987 1991 1995 1999 2003
Single Mothers Married Mothers
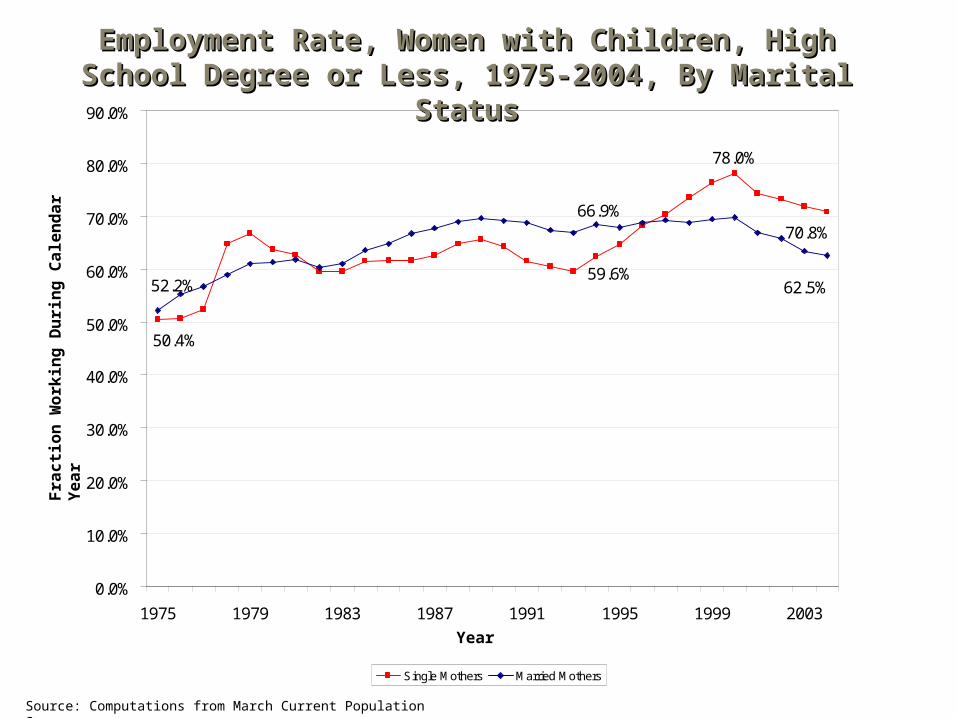
Employment Rate, Women with Children, High Employment Rate, Women with Children, High School Degree or Less, 1975-2004, By Marital School Degree or Less, 1975-2004, By Marital
StatusStatus
Fra
cti
on
Wo
rkin
g D
uri
ng
Ca
len
da
r Y
ea
r
Year
Source: Computations from March Current Population Surveys
52.2%
66.9%
62.5%
50.4%
59.6%
70.8%
78.0%
0.0%
10.0%
20.0%
30.0%
40.0%
50.0%
60.0%
70.0%
80.0%
90.0%
1975 1979 1983 1987 1991 1995 1999 2003
Single Mothers Married Mothers
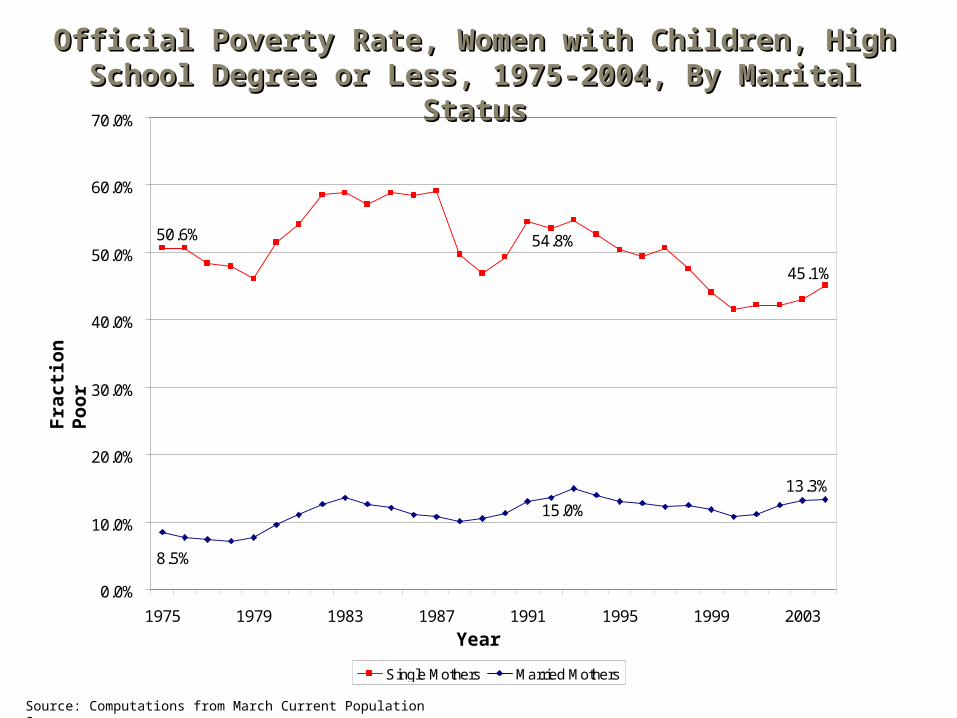
Official Poverty Rate, Women with Children, High Official Poverty Rate, Women with Children, High School Degree or Less, 1975-2004, By Marital School Degree or Less, 1975-2004, By Marital
StatusStatus
Fra
cti
on
Po
or
Source: Computations from March Current Population Surveys
Year
50.6% 54.8%
45.1%
13.3%
15.0%
8.5%
0.0%
10.0%
20.0%
30.0%
40.0%
50.0%
60.0%
70.0%
1975 1979 1983 1987 1991 1995 1999 2003
Single Mothers Married Mothers

Women’s Employment Study OverviewWomen’s Employment Study Overview
Longitudinal study of white non-Hispanic and African American women who received TANF (single parent case) in February 1997
Sample drawn from one urban Michigan county.
Response rates:
• 1997 – 86% (753 women)
• 1998 – 93% (693 women)
• 1999 – 91% (632 women)
• 2001 – 91% (577 women)
• 2003 – 93% (536 women)
No evidence that attrition bias is a problem.
0%
10%
20%
30%
40%
50%
60%
70%
80%
90%
100%
Feb-97 Aug-97 Feb-98 Aug-98 Feb-99 Aug-99 Feb-00 Aug-00 Feb-01 Aug-01 Feb-02 Aug-02 Feb-03 Aug-03 Feb-04 Aug-04
Food Assistance Welfare Work
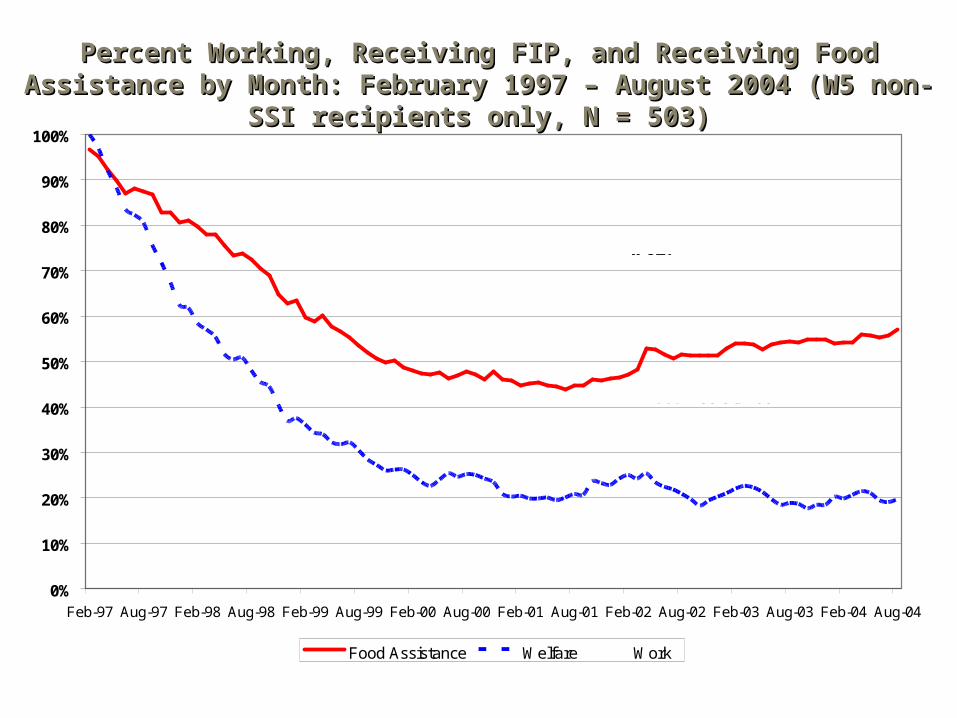
Work
Food Assistance
Welfare
96.6%
43.5%
79.1%
68.6%
18.3%
22.7%
43.9%
54.1%
19.7%
57.1%
Percent Working, Receiving FIP, and Receiving Food Percent Working, Receiving FIP, and Receiving Food Assistance by Month: February 1997 – August 2004 (W5 non-Assistance by Month: February 1997 – August 2004 (W5 non-
SSI recipients only, N = 503)SSI recipients only, N = 503)
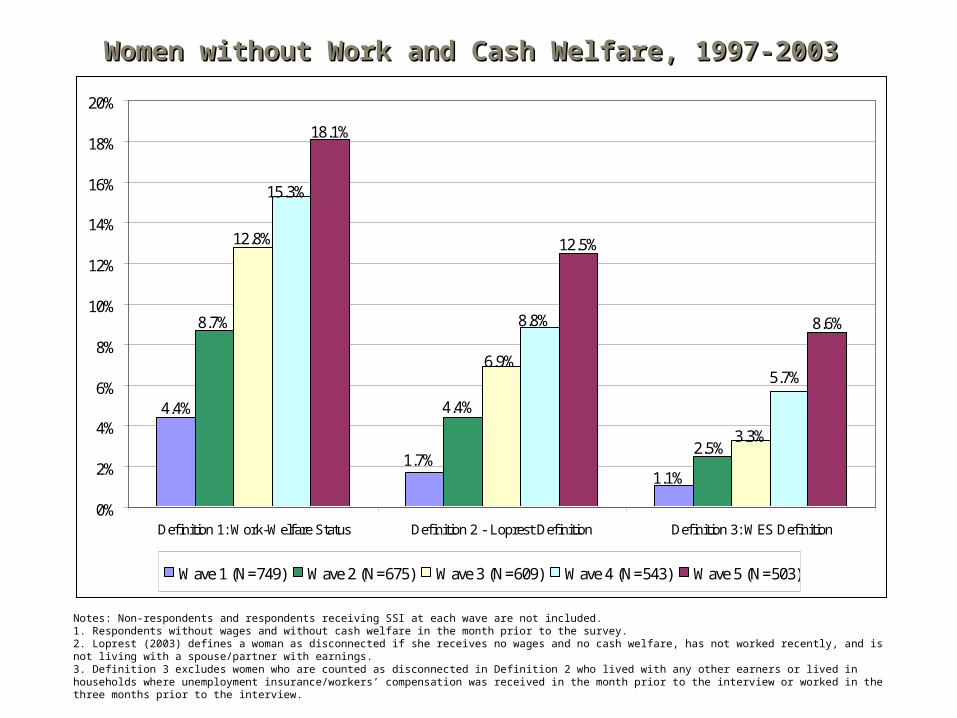
Women without Work and Cash Welfare, 1997-2003 Women without Work and Cash Welfare, 1997-2003
Notes: Non-respondents and respondents receiving SSI at each wave are not included. 1. Respondents without wages and without cash welfare in the month prior to the survey.2. Loprest (2003) defines a woman as disconnected if she receives no wages and no cash welfare, has not worked recently, and is not living with a spouse/partner with earnings.3. Definition 3 excludes women who are counted as disconnected in Definition 2 who lived with any other earners or lived in households where unemployment insurance/workers’ compensation was received in the month prior to the interview or worked in the three months prior to the interview.
1.1%
4.4%
1.7%2.5%
4.4%
8.7%
3.3%
6.9%
12.8%
5.7%
8.8%
15.3%
8.6%
12.5%
18.1%
0%
2%
4%
6%
8%
10%
12%
14%
16%
18%
20%
Definition 1: Work-Welfare Status Definition 2 - Loprest Definition Definition 3: WES Definition
Wave 1 (N=749) Wave 2 (N=675) Wave 3 (N=609) Wave 4 (N=543) Wave 5 (N=503)
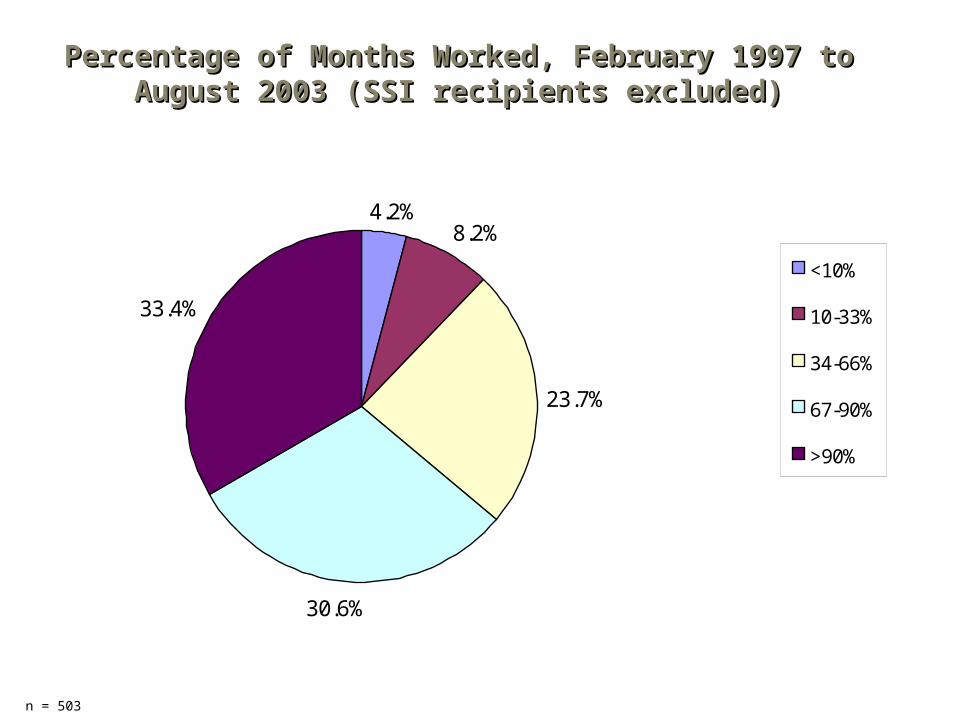
4.2%8.2%
23.7%
30.6%
33.4%
<10%
10-33%
34-66%
67-90%
>90%
Percentage of Months Worked, February 1997 to Percentage of Months Worked, February 1997 to August 2003 (SSI recipients excluded)August 2003 (SSI recipients excluded)
n = 503
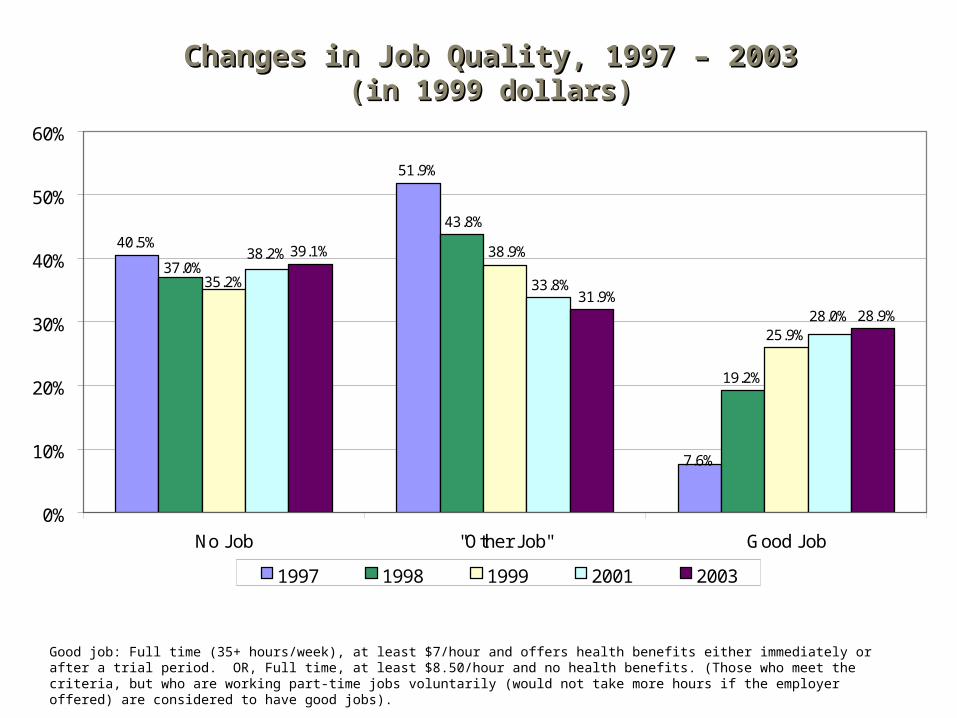
40.5%
51.9%
19.2%
25.9%
39.1%
7.6%
43.8%
37.0%38.9%
35.2%
28.0%
33.8%
38.2%
28.9%31.9%
0%
10%
20%
30%
40%
50%
60%
No Job "Other Job" Good Job
1997 1998 1999 2001 2003
Good job: Full time (35+ hours/week), at least $7/hour and offers health benefits either immediately or after a trial period. OR, Full time, at least $8.50/hour and no health benefits. (Those who meet the criteria, but who are working part-time jobs voluntarily (would not take more hours if the employer offered) are considered to have good jobs).
Changes in Job Quality, 1997 – 2003Changes in Job Quality, 1997 – 2003(in 1999 dollars)(in 1999 dollars)
Good job: Full time (35+ hours/week), at least $7/hour and offers health benefits either immediately or after a trial period. OR, Full time, at least $8.50/hour and no health benefits. (Those who meet the criteria, but who are working part-time jobs voluntarily (would not take more hours if the employer offered) are considered to have good jobs).
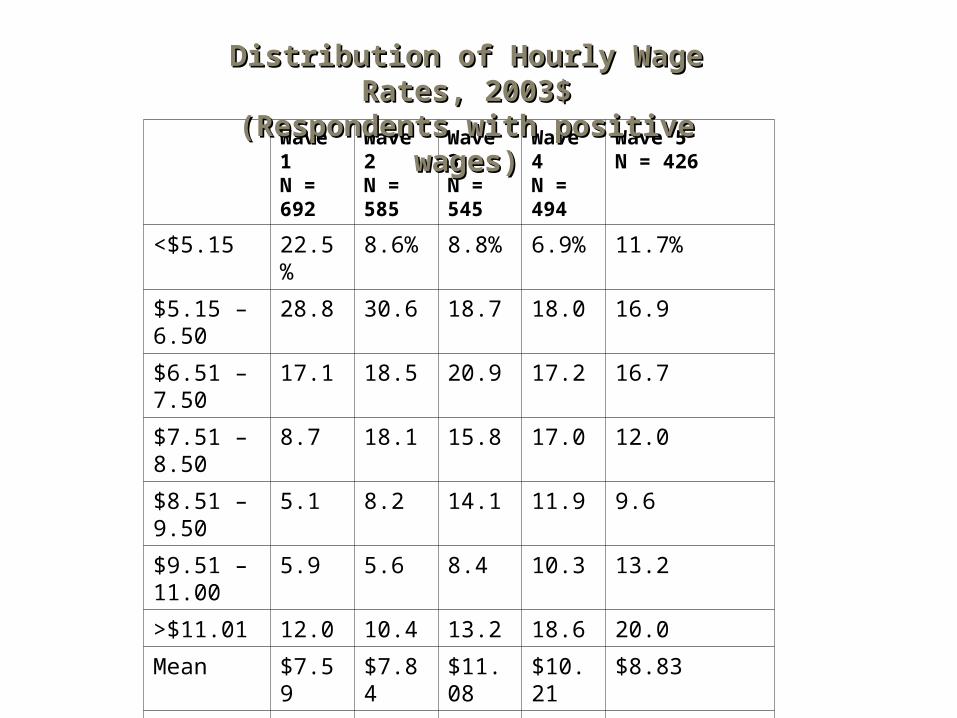
Wave 1N = 692
Wave 2N = 585
Wave 3N = 545
Wave 4N = 494
Wave 5N = 426
<$5.15 22.5% 8.6% 8.8% 6.9% 11.7%
$5.15 – 6.50
28.8 30.6 18.7 18.0 16.9
$6.51 – 7.50
17.1 18.5 20.9 17.2 16.7
$7.51 – 8.50
8.7 18.1 15.8 17.0 12.0
$8.51 – 9.50
5.1 8.2 14.1 11.9 9.6
$9.51 –11.00
5.9 5.6 8.4 10.3 13.2
>$11.01 12.0 10.4 13.2 18.6 20.0
Mean $7.59 $7.84 $11.08 $10.21 $8.83
Median $6.42 $7.06 $7.68 $7.97 $8.00
Distribution of Hourly Wage Distribution of Hourly Wage Rates, 2003$Rates, 2003$
(Respondents with positive (Respondents with positive wages)wages)

27.2%
21.4%
26.1%
17.8%
3.2%
6.8%
24.2%26.1%
6.0%
33.4%
30.4%
3.8% 4.0%
23.8%
22.4%
0%
5%
10%
15%
20%
25%
30%
35%
40%
Welfare Work/No Welfare No Work/No Welfare
1997 1998 1999 2001 2003
Percent of Respondents with No Health Percent of Respondents with No Health Insurance by Work/Welfare Status (w5 Rs Only, Insurance by Work/Welfare Status (w5 Rs Only,
n=536)n=536)
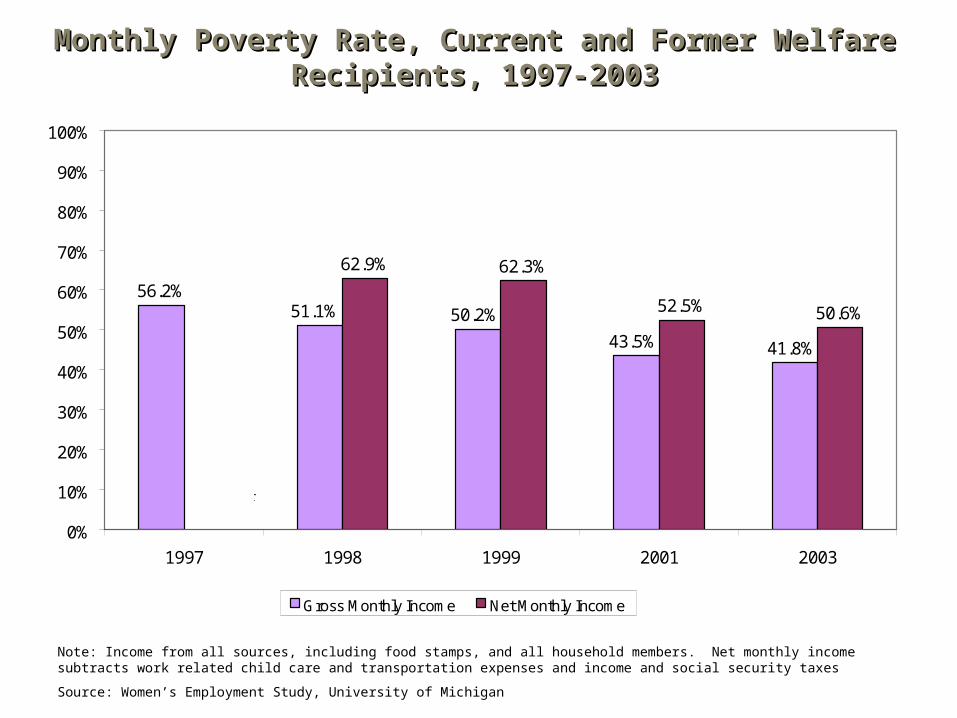
Monthly Poverty Rate, Current and Former Welfare Monthly Poverty Rate, Current and Former Welfare Recipients, 1997-2003Recipients, 1997-2003
Note: Income from all sources, including food stamps, and all household members. Net monthly income subtracts work related child care and transportation expenses and income and social security taxes
Source: Women’s Employment Study, University of Michigan
56.2%
62.9% 62.3%
52.5% 50.6%
41.8%43.5%
50.2%51.1%
0%
10%
20%
30%
40%
50%
60%
70%
80%
90%
100%
1997 1998 1999 2001 2003
Gross Monthly Income Net Monthly Income
No net monthly income
measure for 1997
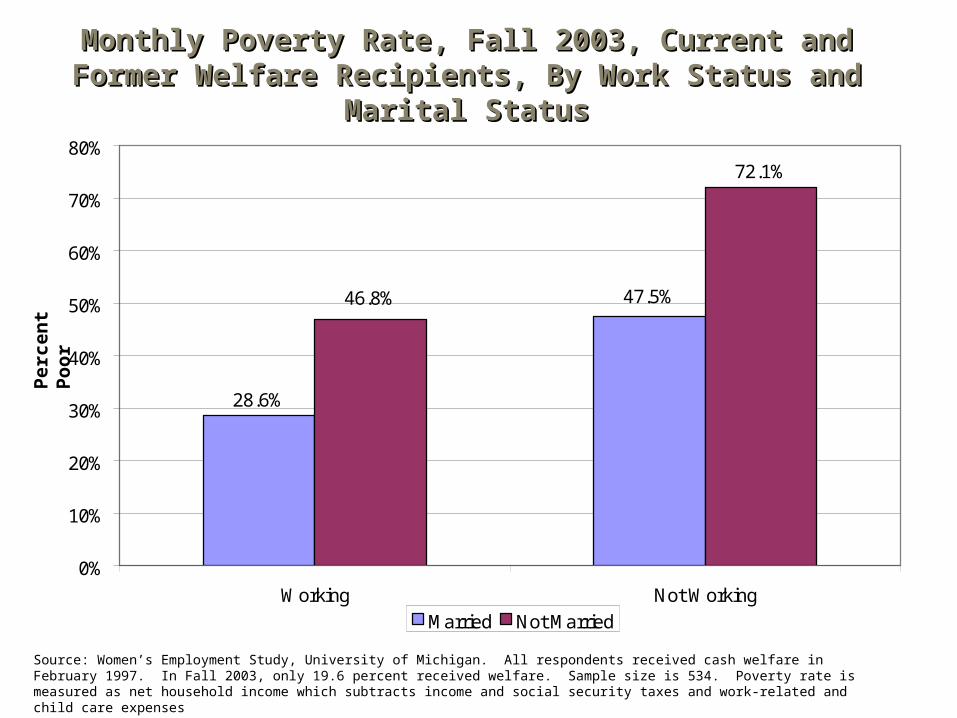
28.6%
72.1%
47.5%46.8%
0%
10%
20%
30%
40%
50%
60%
70%
80%
Working Not Working
% P
oo
r
Married Not Married
Source: Women's Employment Study, University of Michigan. All respondents received cash welfare in February 1997. In Fall 2003, only 19.6% percent received welfare. Sample size is 534. Poverty rate is measured as net household income which subtracts income and social security taxes and work-related and child care expenses.
Per
cen
t P
oo
rMonthly Poverty Rate, Fall 2003, Current and Monthly Poverty Rate, Fall 2003, Current and
Former Welfare Recipients, By Work Status and Former Welfare Recipients, By Work Status and Marital StatusMarital Status
Source: Women’s Employment Study, University of Michigan. All respondents received cash welfare in February 1997. In Fall 2003, only 19.6 percent received welfare. Sample size is 534. Poverty rate is measured as net household income which subtracts income and social security taxes and work-related and child care expenses

Research QuestionsResearch Questions
1. To what extent did welfare mothers have work limitations and other barriers when panel study began shortly after welfare reform?
2. How are barriers in 1997 correlated with the welfare to work transition, measured by accumulated months of employment and welfare receipt over 6½ year period?
3. How does persistence of barriers affect earnings and welfare receipt in 2003, controlling for many other factors?

Measures of BarriersMeasures of Barriers
Low work experience, job skills, work norms or criminal record
No high school degree or learning/reading problemsMet screening criteria for a mental health disorder (depression, post-
traumatic stress disorder, general anxiety disorder, social phobia)
Met criteria for alcohol dependence or used illegal drugs High health limitations and self-reported fair/poor health
Child with physical, emotional or learning problems
Experience with severe domestic violence in last year
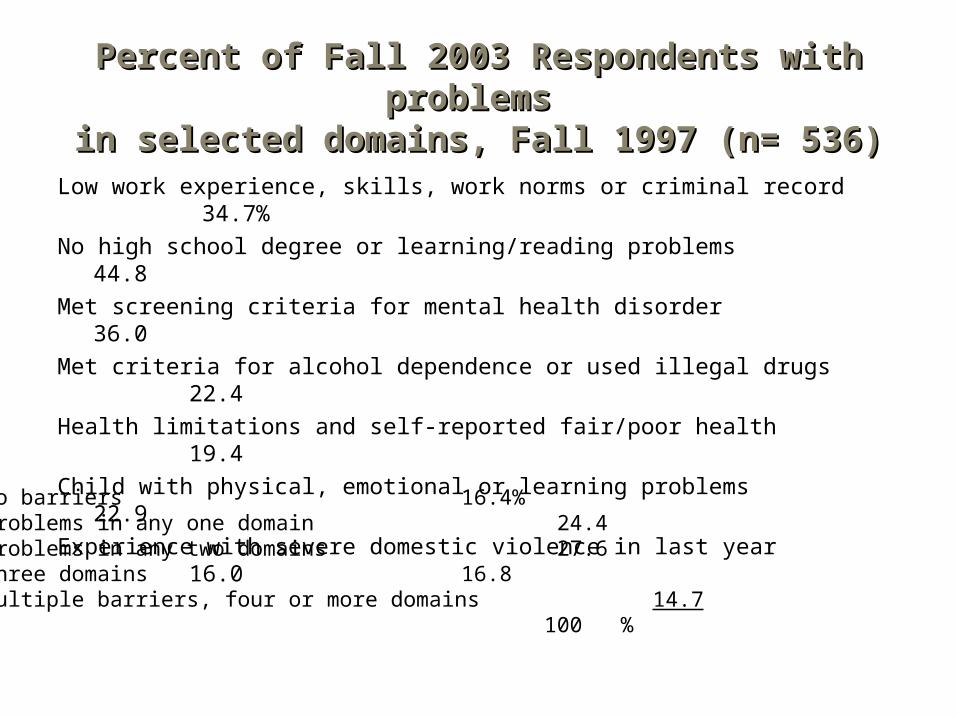
Percent of Fall 2003 Respondents with Percent of Fall 2003 Respondents with problems problems
in selected domains, Fall 1997 (n= 536)in selected domains, Fall 1997 (n= 536)Low work experience, skills, work norms or criminal record 34.7%
No high school degree or learning/reading problems 44.8
Met screening criteria for mental health disorder 36.0
Met criteria for alcohol dependence or used illegal drugs 22.4
Health limitations and self-reported fair/poor health 19.4
Child with physical, emotional or learning problems 22.9
Experience with severe domestic violence in last year 16.0
No barriers 16.4%Problems in any one domain 24.4Problems in any two domains 27.6 Three domains 16.8Multiple barriers, four or more domains 14.7
100 %
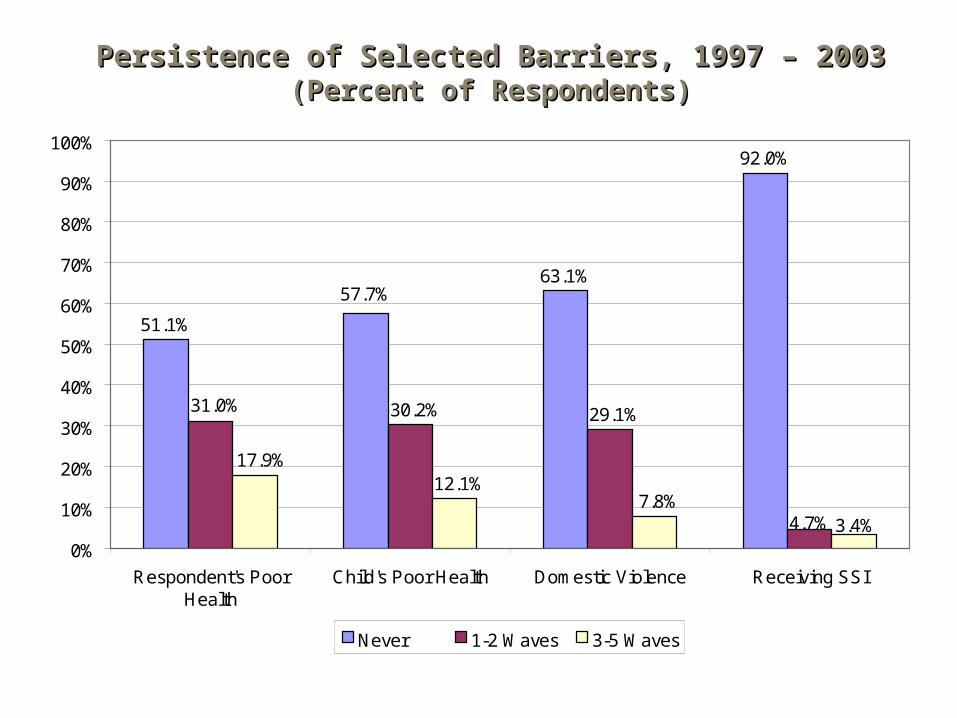
63.1%
92.0%
57.7%
51.1%
4.7%
29.1%30.2%31.0%
3.4%7.8%
12.1%17.9%
0%
10%
20%
30%
40%
50%
60%
70%
80%
90%
100%
Respondent's PoorHealth
Child's Poor Health Domestic Violence Receiving SSI
Never 1-2 Waves 3-5 Waves
Persistence of Selected Barriers, 1997 – 2003Persistence of Selected Barriers, 1997 – 2003(Percent of Respondents)(Percent of Respondents)

Percent of Respondents who met Diagnostic Criteria for a Disorder at Least Once, 1997-2003 (Wave 5 R's only)
51.5%
39.7%
29.7%
20.5%
8.4% 9.5%
67.9%
0%
10%
20%
30%
40%
50%
60%
70%
80%
Depression PTSD GeneralizedAnxiety
Social Phobia AlcoholDependence
DrugDependence
Any Disorder
Percent of Respondents who met Diagnostic Percent of Respondents who met Diagnostic Criteria for a Disorder at Least Once, 1997 – 2003 Criteria for a Disorder at Least Once, 1997 – 2003
(Wave 5 R’s only)(Wave 5 R’s only)
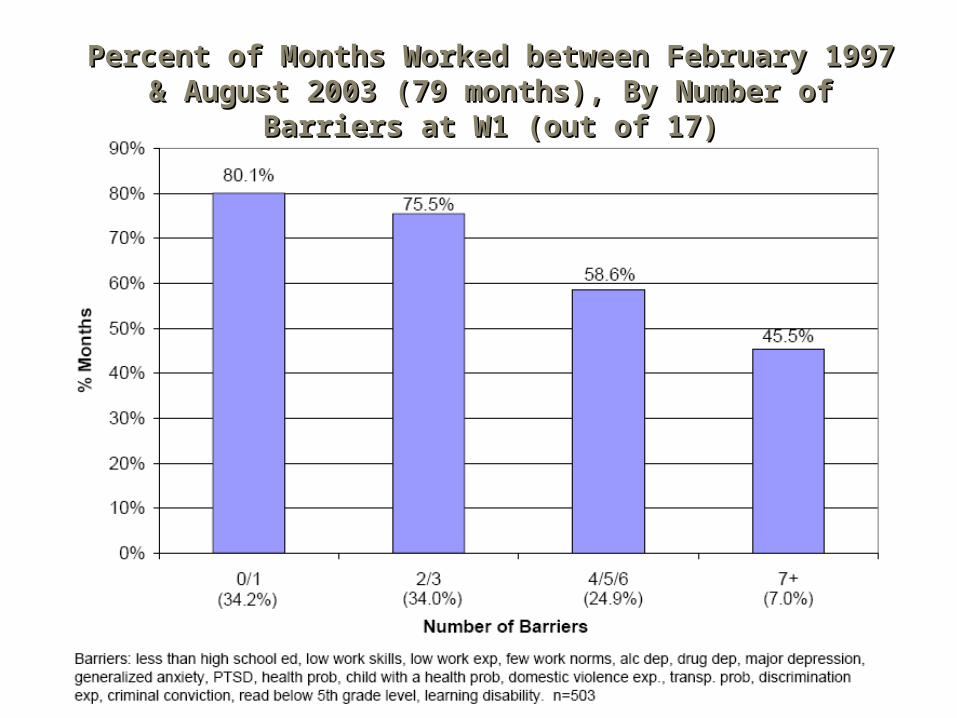
Percent of Months Worked between February Percent of Months Worked between February 1997 & August 2003 (79 months), By Number of 1997 & August 2003 (79 months), By Number of
Barriers at W1 (out of 17)Barriers at W1 (out of 17)
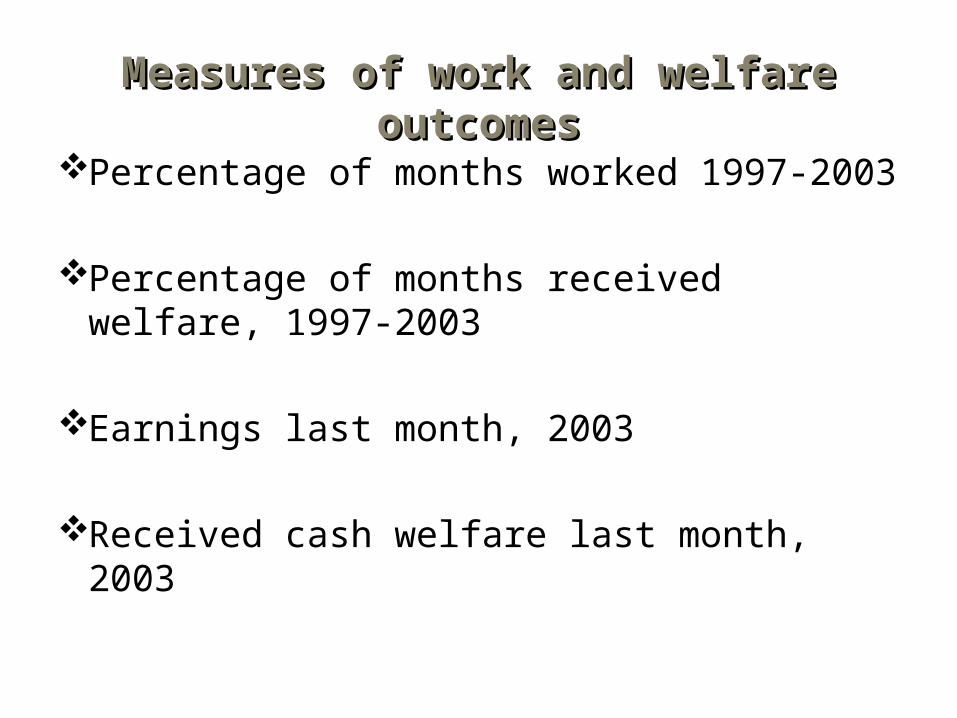
Measures of work and welfare Measures of work and welfare outcomesoutcomes
Percentage of months worked 1997-2003
Percentage of months received welfare, 1997-2003
Earnings last month, 2003
Received cash welfare last month, 2003
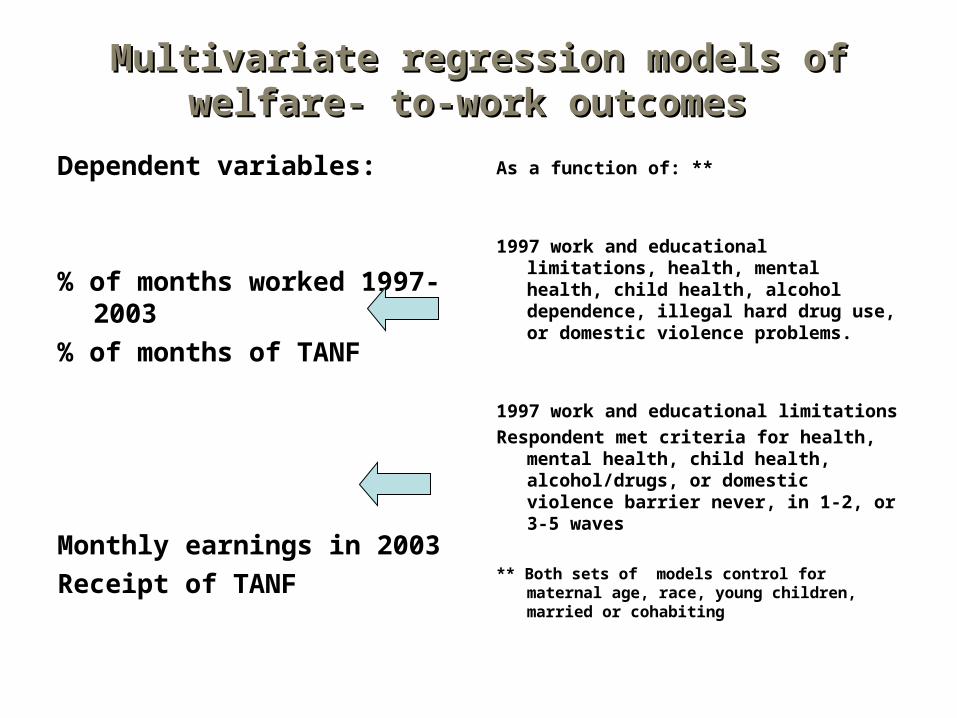
Multivariate regression models of Multivariate regression models of welfare- to-work outcomes welfare- to-work outcomes
Dependent variables:
% of months worked 1997-2003
% of months of TANF
Monthly earnings in 2003
Receipt of TANF
As a function of: **
1997 work and educational limitations, health, mental health, child health, alcohol dependence, illegal hard drug use, or domestic violence problems.
1997 work and educational limitations
Respondent met criteria for health, mental health, child health, alcohol/drugs, or domestic violence barrier never, in 1-2, or 3-5 waves
** Both sets of models control for maternal age, race, young children, married or cohabiting
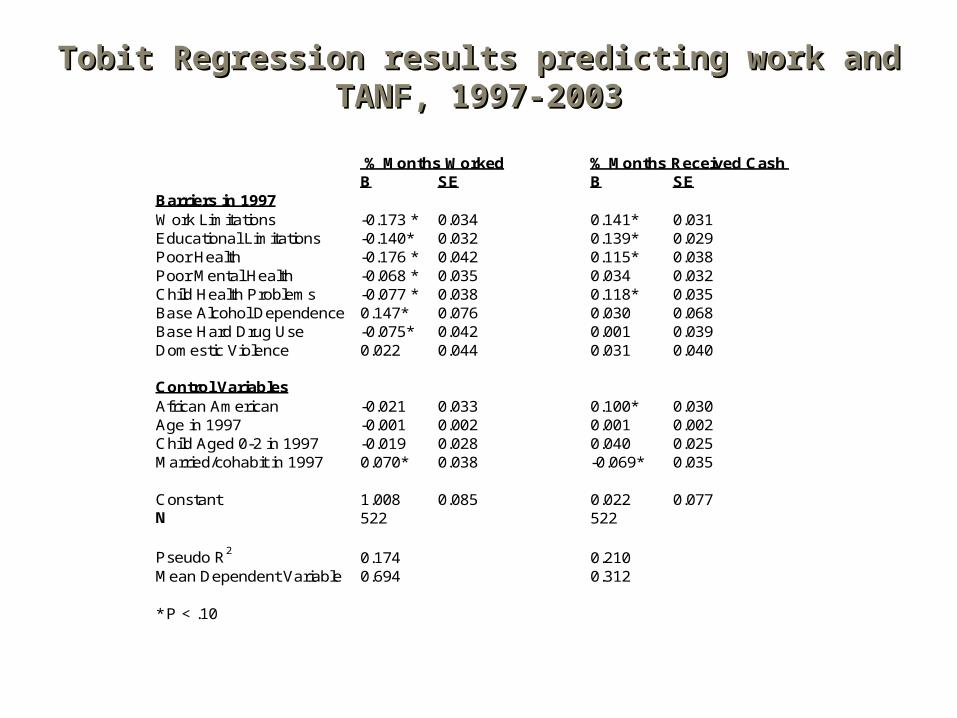
% Months Worked % Months Received Cash WelfareB SE B SE
Barriers in 1997Work Limitations -0.173 * 0.034 0.141* 0.031Educational Limitations -0.140* 0.032 0.139* 0.029Poor Health -0.176 * 0.042 0.115* 0.038Poor Mental Health -0.068 * 0.035 0.034 0.032Child Health Problems -0.077 * 0.038 0.118* 0.035Base Alcohol Dependence 0.147* 0.076 0.030 0.068Base Hard Drug Use -0.075* 0.042 0.001 0.039Domestic Violence 0.022 0.044 0.031 0.040
Control VariablesAfrican American -0.021 0.033 0.100* 0.030Age in 1997 -0.001 0.002 0.001 0.002Child Aged 0-2 in 1997 -0.019 0.028 0.040 0.025Married/cohabit in 1997 0.070* 0.038 -0.069* 0.035
Constant 1.008 0.085 0.022 0.077N 522 522
Pseudo R2 0.174 0.210Mean Dependent Variable 0.694 0.312
* P < .10
Tobit Regression results predicting work and Tobit Regression results predicting work and TANF, 1997-2003TANF, 1997-2003
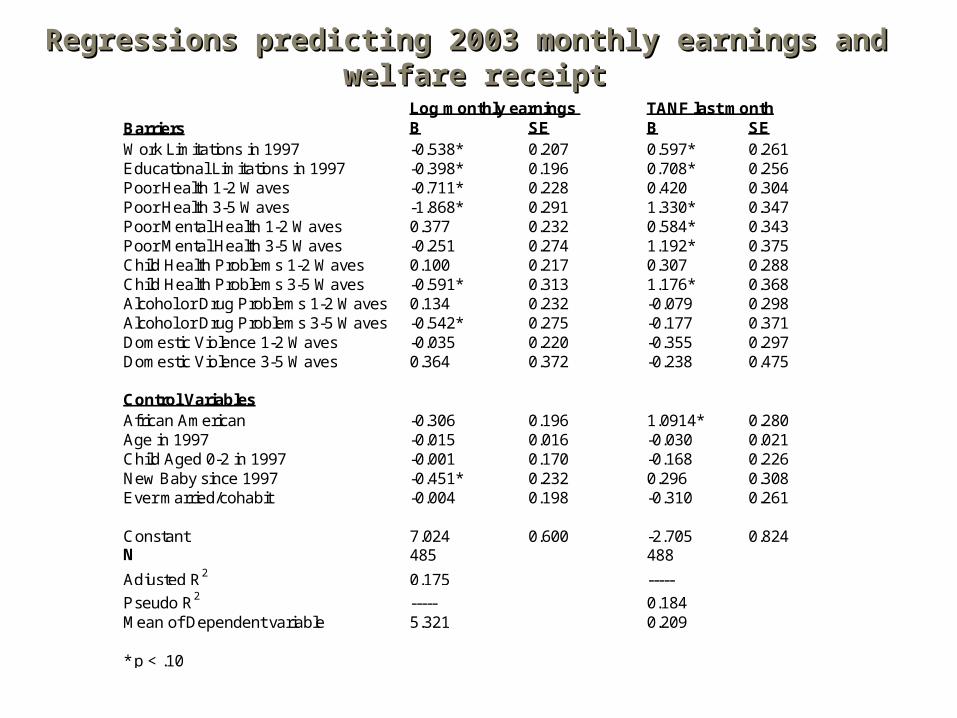
Regressions predicting 2003 monthly earnings and Regressions predicting 2003 monthly earnings and welfare receiptwelfare receipt
Log monthly earnings TANF last monthBarriers B SE B SEWork Limitations in 1997 -0.538* 0.207 0.597* 0.261Educational Limitations in 1997 -0.398* 0.196 0.708* 0.256Poor Health 1-2 Waves -0.711* 0.228 0.420 0.304Poor Health 3-5 Waves -1.868* 0.291 1.330* 0.347Poor Mental Health 1-2 Waves 0.377 0.232 0.584* 0.343Poor Mental Health 3-5 Waves -0.251 0.274 1.192* 0.375Child Health Problems 1-2 Waves 0.100 0.217 0.307 0.288Child Health Problems 3-5 Waves -0.591* 0.313 1.176* 0.368Alcohol or Drug Problems 1-2 Waves 0.134 0.232 -0.079 0.298Alcohol or Drug Problems 3-5 Waves -0.542* 0.275 -0.177 0.371Domestic Violence 1-2 Waves -0.035 0.220 -0.355 0.297Domestic Violence 3-5 Waves 0.364 0.372 -0.238 0.475
Control VariablesAfrican American -0.306 0.196 1.0914* 0.280Age in 1997 -0.015 0.016 -0.030 0.021Child Aged 0-2 in 1997 -0.001 0.170 -0.168 0.226New Baby since 1997 -0.451* 0.232 0.296 0.308Ever married/cohabit -0.004 0.198 -0.310 0.261
Constant 7.024 0.600 -2.705 0.824N 485 488
Adjusted R2 0.175 -----
Pseudo R2 ----- 0.184Mean of Dependent variable 5.321 0.209
* p < .10

Median earnings, Full-Time, Year Round Median earnings, Full-Time, Year Round Workers, 1960-2004Workers, 1960-2004
Source: U.S. Bureau of the Census
29,013
40,798
41,195
31,223
17,603
23,330
$0
$5,000
$10,000
$15,000
$20,000
$25,000
$30,000
$35,000
$40,000
$45,000
1960 1964 1968 1972 1976 1980 1984 1988 1992 1996 2000 2004
Year
2004
Con
stan
t Dol
lars
Male Female
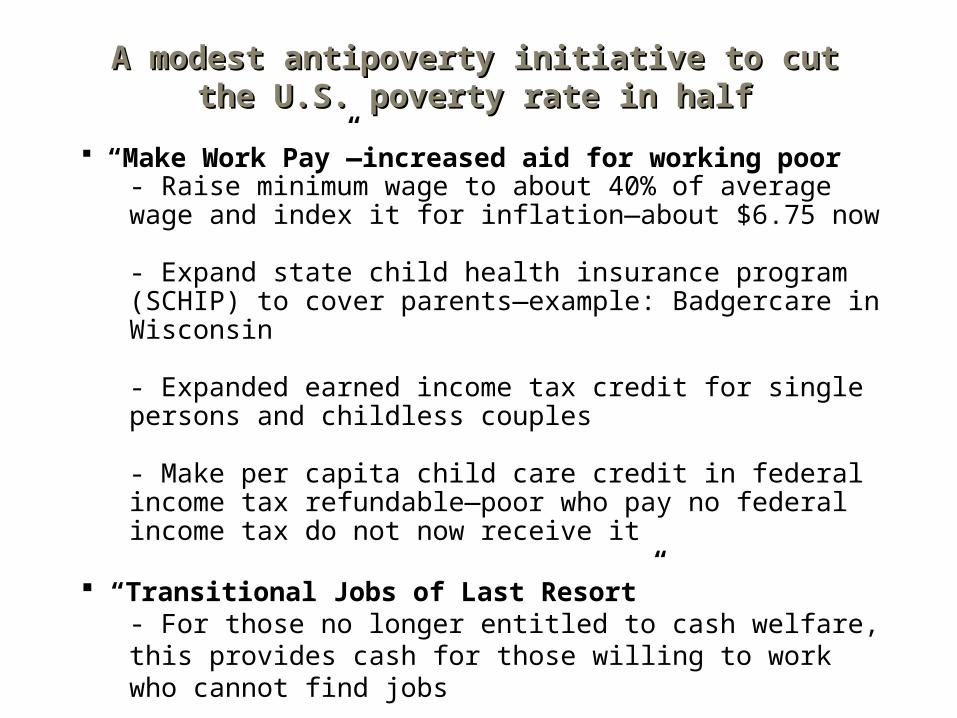
“Make Work Pay”—increased aid for working poor- Raise minimum wage to about 40% of average wage and index it for inflation—about $6.75 now
- Expand state child health insurance program (SCHIP) to cover parents—example: Badgercare in Wisconsin
- Expanded earned income tax credit for single persons and childless couples
- Make per capita child care credit in federal income tax refundable—poor who pay no federal income tax do not now receive it
“Transitional Jobs of Last Resort” - For those no longer entitled to cash welfare, this provides cash for those willing to work who cannot find jobs
A modest antipoverty initiative to cut the A modest antipoverty initiative to cut the U.S. poverty rate in halfU.S. poverty rate in half