assessing vircators’ reliability through uncertainty and
TRANSCRIPT

HAL Id: hal-03025391https://hal.archives-ouvertes.fr/hal-03025391
Submitted on 26 Nov 2020
HAL is a multi-disciplinary open accessarchive for the deposit and dissemination of sci-entific research documents, whether they are pub-lished or not. The documents may come fromteaching and research institutions in France orabroad, or from public or private research centers.
L’archive ouverte pluridisciplinaire HAL, estdestinée au dépôt et à la diffusion de documentsscientifiques de niveau recherche, publiés ou non,émanant des établissements d’enseignement et derecherche français ou étrangers, des laboratoirespublics ou privés.
Assessing Vircators’ Reliability Through Uncertaintyand Sensitivity Analyses Using a Surrogate Model
Mae Almansoori, Ernesto Neira, Sébastien Lalléchère, Chaouki Kasmi, FelixVega, Fahad Alyafei
To cite this version:Mae Almansoori, Ernesto Neira, Sébastien Lalléchère, Chaouki Kasmi, Felix Vega, et al.. AssessingVircators’ Reliability Through Uncertainty and Sensitivity Analyses Using a Surrogate Model. IEEEAccess, IEEE, 2020, 8, pp.205022-205033. �10.1109/ACCESS.2020.3037347�. �hal-03025391�

Received October 19, 2020, accepted November 8, 2020, date of publication November 11, 2020,date of current version November 20, 2020.
Digital Object Identifier 10.1109/ACCESS.2020.3037347
Assessing Vircators’ Reliability ThroughUncertainty and Sensitivity Analyses Using aSurrogate ModelMAE ALMANSOORI 1, (Graduate Student Member, IEEE), ERNESTO NEIRA1, (Member, IEEE),SEBASTIEN LALLECHERE 2, (Member, IEEE), CHAOUKI KASMI 1,3,FELIX VEGA1,4, (Senior Member, IEEE), AND FAHAD ALYAFEI11Directed Energy Research Centre, Technology Innovation Institute, Abu Dhabi, United Arab Emirates2CNRS, SIGMA Clermont, Institut Pascal, Université Clermont Auvergne, 63000 Clermont-Ferrand, France3Faculty of Electrical Engineering, Helmut Schmidt University, 22043 Hamburg, Germany4Electrical Engineering Department, Universidad Nacional de Colombia—Sede Bogotá, Bogotá 111321, Colombia
Corresponding author: Mae AlMansoori ([email protected])
ABSTRACT The performances of Vircators have been reported in different studies showing that a highdiscrepancy between the simulated and measured output peak power and radiating frequency can beencountered. Limited investigations have been reported where the one-variable-at-a-time methodology wasapplied. Performing a full analysis requires to apply statistical methods over a large number of experiments(simulation or measurement) which has been a challenge due to the computation time required to simulateVircators. Recently, an surrogate model has been proposed to drastically reduce the computation time.In this paper, we propose to evaluate the performance variability of a Vircator considering mechanicalmanufacturing tolerances as well as the Pulsed Power source variability. The analysis is performed by meansof well-spread stochastic methods (classical Monte Carlo, spectral techniques), and alternative sensitivityanalysis approaches.
INDEX TERMS High power microwave generation, pulse power systems, statistics, uncertaintyquantification.
I. INTRODUCTIONDue to their independence of external magnetic field sourcesand their relatively simple construction, Virtual cathode oscil-lators (Vircators) [1]–[4] are highly attractive. Vircators areHigh-Power Microwave (HPM) sources that can producepeak powers on the gigawatt range at typical frequencies from1 GHz to 12 GHz.
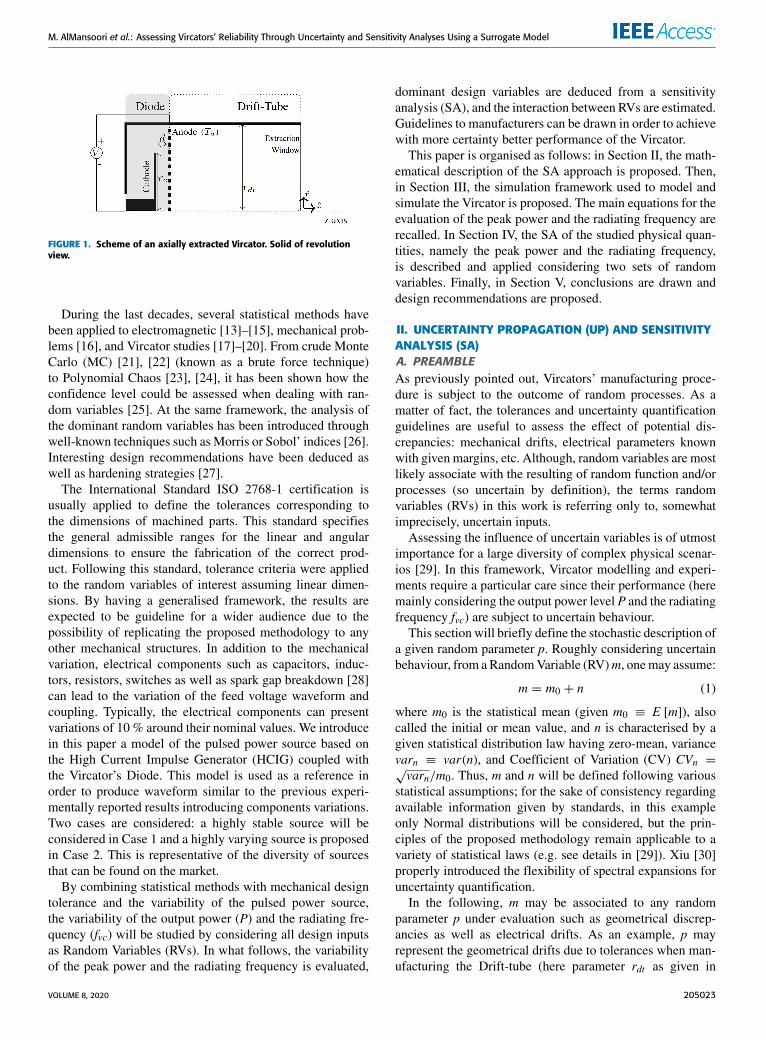
The diode and the drift-tube are two adjacent regions inthe Vircator that are separated by a transparent anode. TheHPM generation process is initiated in the diode region whena high voltage is applied between electrodes forming plasmadue to cathode material sublimating. This sublimation is aconsequence of the electric field enhancement on the tip ofthe micro-protrusions at the cathode surface. Electrons in theplasma are accelerated by a diode electric field toward theanode, resulting in the current injection into the drift-tube
The associate editor coordinating the review of this manuscript and
approving it for publication was Mauro Gaggero .
(ib(t)). In order to form the Virtual Cathode (VC), ib(t) mustbe greater than the space-charge-limiting current (Iscl) [5]which triggers the accumulation of the charge. The oscilla-tion of the VC and the reflection of the electrons betweenthe VC and the real cathode results in the HPM radiation.The complete structure of the axially extracted Vircator isshown Figure 1. The high sensitivity of the performancesof the Vircator to small changes in the design variables hasbeen reported by various authors [6]–[8]. These works haveshown that the anode-cathode gap (d), the anode transparencygrade (Ta) and the feed voltage (V ) have a significant influ-ence on the radiated frequency and peak power variabilities(see Figure 1). However, the majority of these works werefocused on identifying the effects of the variation of a sin-gle design parameter at time [8]–[12]. This means that anypotential interaction between two or more variables was notstudied. Moreover, as single parameter was considered as arandom variable, no clear classification of variables has beenperformed in terms of relevance.
205022This work is licensed under a Creative Commons Attribution-NonCommercial-NoDerivatives 4.0 License.
For more information, see https://creativecommons.org/licenses/by-nc-nd/4.0/ VOLUME 8, 2020
M. AlMansoori et al.: Assessing Vircators’ Reliability Through Uncertainty and Sensitivity Analyses Using a Surrogate Model
FIGURE 1. Scheme of an axially extracted Vircator. Solid of revolutionview.
During the last decades, several statistical methods havebeen applied to electromagnetic [13]–[15], mechanical prob-lems [16], and Vircator studies [17]–[20]. From crude MonteCarlo (MC) [21], [22] (known as a brute force technique)to Polynomial Chaos [23], [24], it has been shown how theconfidence level could be assessed when dealing with ran-dom variables [25]. At the same framework, the analysis ofthe dominant random variables has been introduced throughwell-known techniques such asMorris or Sobol’ indices [26].Interesting design recommendations have been deduced aswell as hardening strategies [27].
The International Standard ISO 2768-1 certification isusually applied to define the tolerances corresponding tothe dimensions of machined parts. This standard specifiesthe general admissible ranges for the linear and angulardimensions to ensure the fabrication of the correct prod-uct. Following this standard, tolerance criteria were appliedto the random variables of interest assuming linear dimen-sions. By having a generalised framework, the results areexpected to be guideline for a wider audience due to thepossibility of replicating the proposed methodology to anyother mechanical structures. In addition to the mechanicalvariation, electrical components such as capacitors, induc-tors, resistors, switches as well as spark gap breakdown [28]can lead to the variation of the feed voltage waveform andcoupling. Typically, the electrical components can presentvariations of 10 % around their nominal values. We introducein this paper a model of the pulsed power source based onthe High Current Impulse Generator (HCIG) coupled withthe Vircator’s Diode. This model is used as a reference inorder to produce waveform similar to the previous experi-mentally reported results introducing components variations.Two cases are considered: a highly stable source will beconsidered in Case 1 and a highly varying source is proposedin Case 2. This is representative of the diversity of sourcesthat can be found on the market.
By combining statistical methods with mechanical designtolerance and the variability of the pulsed power source,the variability of the output power (P) and the radiating fre-quency (fvc) will be studied by considering all design inputsas Random Variables (RVs). In what follows, the variabilityof the peak power and the radiating frequency is evaluated,
dominant design variables are deduced from a sensitivityanalysis (SA), and the interaction between RVs are estimated.Guidelines to manufacturers can be drawn in order to achievewith more certainty better performance of the Vircator.
This paper is organised as follows: in Section II, the math-ematical description of the SA approach is proposed. Then,in Section III, the simulation framework used to model andsimulate the Vircator is proposed. The main equations for theevaluation of the peak power and the radiating frequency arerecalled. In Section IV, the SA of the studied physical quan-tities, namely the peak power and the radiating frequency,is described and applied considering two sets of randomvariables. Finally, in Section V, conclusions are drawn anddesign recommendations are proposed.
II. UNCERTAINTY PROPAGATION (UP) AND SENSITIVITYANALYSIS (SA)A. PREAMBLEAs previously pointed out, Vircators’ manufacturing proce-dure is subject to the outcome of random processes. As amatter of fact, the tolerances and uncertainty quantificationguidelines are useful to assess the effect of potential dis-crepancies: mechanical drifts, electrical parameters knownwith given margins, etc. Although, random variables are mostlikely associate with the resulting of random function and/orprocesses (so uncertain by definition), the terms randomvariables (RVs) in this work is referring only to, somewhatimprecisely, uncertain inputs.
Assessing the influence of uncertain variables is of utmostimportance for a large diversity of complex physical scenar-ios [29]. In this framework, Vircator modelling and experi-ments require a particular care since their performance (heremainly considering the output power level P and the radiatingfrequency fvc) are subject to uncertain behaviour.
This section will briefly define the stochastic description ofa given random parameter p. Roughly considering uncertainbehaviour, from aRandomVariable (RV)m, onemay assume:
m = m0 + n (1)
where m0 is the statistical mean (given m0 ≡ E [m]), alsocalled the initial or mean value, and n is characterised by agiven statistical distribution law having zero-mean, variancevarn ≡ var(n), and Coefficient of Variation (CV) CVn =√varn/m0. Thus, m and n will be defined following various
statistical assumptions; for the sake of consistency regardingavailable information given by standards, in this exampleonly Normal distributions will be considered, but the prin-ciples of the proposed methodology remain applicable to avariety of statistical laws (e.g. see details in [29]). Xiu [30]properly introduced the flexibility of spectral expansions foruncertainty quantification.
In the following, m may be associated to any randomparameter p under evaluation such as geometrical discrep-ancies as well as electrical drifts. As an example, p mayrepresent the geometrical drifts due to tolerances when man-ufacturing the Drift-tube (here parameter rdt as given in
VOLUME 8, 2020 205023

M. AlMansoori et al.: Assessing Vircators’ Reliability Through Uncertainty and Sensitivity Analyses Using a Surrogate Model
Figure 1). This random variations will be defined through therandom variable m as depicted in equation (1). At that stage,it is important to highlight that the stochastic methodologythat will be detailed hereafter will be achieved regardinga given output (see in the following Z , e.g. peak powervalue produced by the Vircator). Section II will give exam-ple of random parameters when dealing with Vircators’manufacturing, e.g. geometrical details: anode-cathode gap,cathode/drift-tube radii, anode transparency, electromagnetic(EM) parameters: material properties, equivalent impedance,source characteristics: feeding voltage.
Uncertainty Quantification (UQ) comprises the assessmentof probabilistic and statistical outputs for two distinct classesof purposes: Uncertainty Propagation (UP) including (butnot restricted to): evaluation of mean trends, probability offailures, stochastic distributions, and SA which main goaltargets ranking of most influential inputs. Sensitivity analysisrefers to the quantification of the robustness and accuracy of amodel under certain conditions. By evaluating the influenceof random variables on the fluctuation of a physical quan-tity (also called observable) and by evaluating the potentialrelationship between the random variables and the physicalobservable, the uncertainty of the output quantity under studycan be reduced; e.g. assuming the least influential inputs totheir initial values. By definition, SA aims at assessing howvariations over inputs of a given model (surrogate, numerical,experimental. . . ) affect the variability of its output(s). TheLocal Sensitivity Analysis (LSA) focuses on how a smallperturbation in the vicinity of an input space value m =(m1, . . . ,mN ) (e.g. near m where N stands for the numberof inputs; four and/or eight in this work, see Tabs 6 and9) impacts the output quantity Z (P or fvc in this work).Parallel to the LSA, the input variations may be understoodat a global stage (Global SA, GSA). Whether GSA maybe expected from the very beginning of the system designprocess, it would provide useful information at amacroscopicstage, highlighting the most influential variables (definedwith a given range of inputs). To put it in a nutshell, LSAand GSA offer complementary information: GSA gives anoverview about the global response of the Vircator for a widerange of varying inputs, whereas LSA assesses the impactof small perturbation around a nominal design of inputs.In this work, and in the following, it is to be noticed onlyGSA has been considered through the analysis of variancetechniques. The next subsection will detail the foundationsof such methods.
B. ANOVA PRINCIPLESThe ANalysis Of VAriance (ANOVA) techniques are part ofthe GSA methods [31]. The variance-based methods rely onthe evaluation of the contribution of each input parametermj(j = 1, . . . ,N ) to the total variance of the observable Z .Numerous works have been led in the domain of SA for ahuge diversity of topics including electromagnetic and elec-tronics [32] (design of experiment, DoE), plasma science [33](meta-modelling for design purpose), geoscience [34] (MC).
In this context, the Russian mathematician I.M. Sobol’ pro-vided a straightforward MC-based strategy for SA of a givenmapping response:
Z = z(m1,m2, . . . ,mN ), (2)
where m = (m1, . . . ,mN ) is the input vector. Given asquare integrable function z over an assumed integrable inputspace �N , Sobol’ considered an expansion of z into terms ofincreasing dimensions:
z = z0 +∑i
zi +∑i
∑j>i
zij + . . .+ z12...N , (3)
in which each term is square integrable over the domain ofexistence and is a function of the factors in its index, i.e.zi = z(mi), zij = zij(mi,mj). Under certain conditions, Sobol’has demonstrated from conditional expectations E [.] that:z0 = E [Z ], zi = E
[Z |mi
]− E [Z ], zij = E
[Z |mi,mj
]−
zi − zj − E [Z ]. Finally, Sobol’ proposed first-order sen-sitivity indices Si since the variances of the previous termin the decomposition are the measures of importance beingexpected for SA:
Si =var
[E[Z |mi
]]var [Z ]
, (4)
whereE[Z |mi
], as aforementioned, stands for the conditional
expectation given that the parameter mi is known as theoutcome of random variations. Roughly speaking, the meanof Z is evaluated assuming mi as a random parameter.The first-order index stands for themain effect contribution
of each input factor (i in relation (4) to the variance ofthe observable Z . The precise assessment of such quantities(i.e. mean trends: average and variance) may be obtainedat different computing costs including a large diversity oftechniques [29], [35]). In the following, we will providealternative measures (importance factors) for Si.
C. STOCHASTIC COLLOCATION ANOVA (SCA)Polynomial Chaos Expansion (PCE) is part of spectral meth-ods; for the interested reader, some details are given in [36]dealingwith PCE and stochastic collocation technique (SCT).The main idea of PCE and SCT relies on the expansion of agiven random process as a linear combination of orthogonalpolynomials (depending on the random inputs). Dependingon the statistical assumptions (marginal probability densityfunctions, PDFs, from the input space), a particular familyof polynomials is chosen, in order to compute the most effi-cient representation of the random process. The governingprinciple consists in minimising the number of terms in theprevious series for a given approximation error threshold.The fundamental principles of the SCT, when considering agiven output Z and its statistical moments under N uncertaininputs mj(j = 1, . . . ,N ), relies on its n−expansion over aLagrangian serie. For the sake of simplicity, an illustration
205024 VOLUME 8, 2020

M. AlMansoori et al.: Assessing Vircators’ Reliability Through Uncertainty and Sensitivity Analyses Using a Surrogate Model
for one RV may be expressed for output Z = z(s) as follows:
z(s) =n∑i=1
ZiLi(s), (5)
where Li(s) stands for the Lagrangian basis function.As pointed out in [37], a large diversity of polynomialexpansions exists when dealing with stochastic surrogatemodelling. In this framework, polynomial chaos expansion(PCE) and stochastic collocation techniques mainly differ bythe choice of their polynomial expansion [29] (for instanceHermite polynomials). Here, Lagrange polynomials Li werechosen (non-orthogonal polynomials but useful to simplifyweight computations wi as expressed in the following equa-tion). Eldred et al. illustrated in their paper the difficulty toclassify PCE and stochastic collocation, even considering theaccuracy offered by Hermite polynomials when dealing withRVs normally distributed (problem dependence). It is to benoticed that this work aims at demonstrating the interest of theproposed methodology, out of any consideration regardingthe rank of any given polynomial expansion to another (forinstance PCE with respect to stochastic collocation tech-nique). It is to be noticed work from [30] offers a pedagogicaldescription of spectral techniques in the framework of uncer-tainty quantification, and the use of polynomial expansions.
Relying on the properties of Lagrange polynomials andassuming a PDF p(s) for a given input parameter, the averageof the observable Z is obtained from:
E [Z ] =n∑i=1
wiZi, (6)
where wi stands for the weight devoted to Zi = Z (si),expression of the mapping function s
z−→ Z = z(s) for SCT-
points si (i = 1, . . . , n); and the variance of Z is given as:
var [Z ] =n∑i=1
wi (Zi − E [Z ])2 . (7)
As pointed out in [29], the PCE and SCT have demon-strated their high precision and efficiency, comparatively toMC methods. However, due to the tensor product in therelations ((5)-(7)), the techniques are facing the curse ofdimensionality that avoids an optimum use of them whenincreasing N for a given truncation order n. Indeed, for thesake of simplicity, the equation (5) is obtained for 1-RVcase; obviously, increasing the number of RVs introducestensor product (with respect to summation product) as evokedin [30]. In the following, we will demonstrate that the SCToffers a very high level of accuracy for variance computingwith a relatively low computation costs, even when dealingwith random input vector m = (m1, . . . ,m8),N = 8 and n =2 or 3. As previously mentioned in the relation (4), the sen-sitivity of the RV i relatively to the other RVs is assessedthrough the coefficient Si (first-order Sobol’ indice). Relyingon the same principle, the tensor product needed with theSCT allows straightforward assessing the same quantity from
the SCT simulations (without any extra computing costs) asfollows:
SCAi =˜var[Z ;mi
]var
[Z ;m1, . . . ,mN
] , (8)
where ˜var[Z ;mi
]represents the variance extracted consid-
ering 1-RV case mi (i.e. considering the effect of varyingRV ‘‘i’’ and induced Z-variance). In this work, the authorspropose to take benefit from the ‘‘full-tensor’’ design ofexperiment by averaging the variance var[Z ;mi] obtainedusing all the data points available, i.e. computing all thequantities var[Z ;mi] available assuming the other RVs (outof RV ‘‘i’’) are set to the remaining quadrature points neededfor stochastic collocation calculations. The different vari-ances computed with the relation (7) are averaged, leadingto the quantity ˜var
[Z ;mi
](including .̃ sign). It is to be
noticed var[Z ;m1, . . . ,mN
]is obtained assuming the whole
RV input space (i.e. with N RVs). The latter quantities aredirectly adapted from the relations (6) and (7). The wholemethodology is called the Stochastic Collocation ANOVA(SCA).
According to the relations (4) and (8), the most influentialinputs will be determined from the ranking of Si [34] andSCAi, being understood that the highest sensitivity indicesimply the most influential parameters.
III. VIRCATOR SURROGATE MODELVircator’s design variables considered in this study are (seeFigure 1): theAnode-cathode gap (d), the Cathode radius (rc),the Drift-tube Radius (rdt ), the Anode Transparency (Ta) andthe Voltage (V ). In this section, the adopted frequency andpower models will be described.
A. FREQUENCY MODELThe frequency model used in this study was proposed byAlyokhin et al. [7] suggesting that the Vircator dominantangular frequency (ωvc) can be approximated as
ωvc = a1ωp, (9)
where a1 ≈ 2.14, and ωp is the relativistic plasma frequencythat can be expressed as [38].
ωp =
√√√√ eJb
ε0mc√γ 20 − 1
, (10)
where e and m are the electron charge and rest mass respec-tively, c is the speed of the light, Jb is the current densityof the beam injected into the drift area, ε0 is the free spacepermittivity and γ0 is the relativistic factor of the electrons atthe anode.
If the electron beam flow is considered laminar, Eq. (10)can be solved as a function of the design variables. To do this,Jb could be redefined as JdTa, where Jd is the diode currentwhich can be approximated using the Child-Langmuir’s [39],
VOLUME 8, 2020 205025

M. AlMansoori et al.: Assessing Vircators’ Reliability Through Uncertainty and Sensitivity Analyses Using a Surrogate Model
[40] as
Jd =49ε0
√2emV 3/2
d2, (11)
where ε0 is the free space permittivity.Solving Eq. (11) and taking into account the energy con-
servation law, (γ0 = kV + 1, where k = e/mc2), we cantransform Eq. (10) into
ωp =25/4c3d
√kVTa√kV + 2
. (12)
Notice that Eq. (12) is a function of the design variablesand can be used directly to approximate the dominant fre-quency (named fvc in the following, and linked to the angularfrequency ωp).
B. POWER MODELRegarding the Vircator’s power models, there are someoptions available in the literature [7], [38], [41], [42]. How-ever, the accuracy of these models is assumed under givenconditions. For this study, we chose the model proposedin [38], which have been fitted from the Larmor formula [43],and simulations from XOOPIC and XPDP1 [44]. The modeldefines the average power radiated at the VC frequency as:
P̄ωp =π3a21m
12c2er4cω
4p((kV + 1)2 − 1)3/2
×e−4
(1− 8c2((kV+1)2/3−1)3/2
r2c ω2p (1+ln
( rdtrc
)√(kV+1)2−1
)2
, (13)
where a1 = 2.14 (taken from Alyokhin’s frequency model,see section III-A).
The surrogate model presented in Eq. (13) is suitable forbeam currents (Ib) in the range Ic/2 < Ib < Ic and 2 Iscl < Ib.Ic is the critical current defining the laminar flow and can beexpressed as [45]
Ic = k1rcd
√γ 20 − 1, (14)
and Iscl is the space-charge limiting current. For a solidcircular beam, Iscl is defined as [5]:
Iscl = k1(γ 2/3
0 − 1)3/2
1+ ln(rdt/rb). (15)
where k1 = 2πε0 mc3/e.
C. DETERMINISTIC SIMULATION - MODEL VALIDATIONIn this section, a deterministic simulation of a Vircatordesigned to operate at 7 GHz will be carried out. The geo-metrical variables ensuring the desired dominant frequency(according to Section III-A complying with the restrictionsof the power model given in Section III-B) are providedin Table 1. The effectiveness of the surrogate model at thepoint of design will be validated through the comparisonof numerical simulation results obtained from two different
TABLE 1. Simulation variables - deterministic simulation.
FIGURE 2. Power Spectral Density obtained by the simulation fromCST-PS, XOOPIC and the Surrogate model for Case #1.
Particle in Cell (PIC) Simulators: XOOPIC [44] and the CST-Particles Studio.
Equations (14) and (15) can be used to calculate the valuesof Ic and Iscl as 86.2 kA and 2.2 kA respectively. For thisvalidation, the Vircator will be fed with an ideal DC source.According to the analytical models presented in the previoussection (Eqs. (12) and (13)), the dominant radiated frequencywill be 7.05 GHz with a mean power of 152 MW. Themodel assumes no spectral dispersion (ideal simple harmonicoscillation of the VC) and non additional radiation sources,and so, the peak power results in twice the average power(ideal case). In the case of the Xoopic simulation, a 2.5Dsimulation was performed with 40 cells in x̂ and 40 cells inr̂ . The time of simulation was 100 ns. The power leavingthe extraction window was calculated by the integration ofPoynting vector (measured in each cell) over the extractionsurface. The Spectral Power Density (SPD) is presented inthe black line in Figure 2. The dominant frequency and peakpower were 6.9 GHz and 330 MW,respectively.
For the CST simulation (3D model presented in Figure 5),the simulation was performed with 9,812,250 total numberof cells and 932 emission points over the cathode surface.The total simulation time was 100 ns. The obtained SPD ispresented in the blue line in Figure 2. The dominant frequencyand peak power were 6.83 GHz and 279 MW, respectively.The results of the simulation and the surrogate model aresummarised in Table 2. Maximum frequency error betweenthe simulations and the model was 3.2 %. In the case ofthe power error, the maximum difference was between thesimulation and it was of 0.73 dB.
205026 VOLUME 8, 2020

M. AlMansoori et al.: Assessing Vircators’ Reliability Through Uncertainty and Sensitivity Analyses Using a Surrogate Model
FIGURE 3. 3D model of the suggested Vircator modelled with CST.
TABLE 2. Estimated Peak Power and Radiating frequency - deterministicsimulation.
TABLE 3. Computation power and simulation time.
Additionally, Table 3 presents the hardware configurationand the computation time for each simulation tools.
D. DOMAIN OF VALIDITY OF THE SURROGATE MODELWhen building a surrogate, the domain of validity remains akey evaluation step in order to perform accurate predictions.In this study, using Xoopic, a parametric analysis has beenperformed with regards to the following parameters. Themean error is estimated between the surrogate model and the2.5D simulation software. Notice that the model presentedin Section III-B defines the power radiated as a function offour variables V , rc, rdt , and ωp. Where the three first areindependent variables and ωp is depending on Ta, d and V(see Eq. (12)). Tables 4 and 5 present two sets of simulations(Vircator #1 and Vircator #2) in order to evaluate the accuracyof the surrogate model. For this purpose, rc and V vary whileωp and rdt remain constant. In order to maintain constant ωp,the value of d was solved from Eq. (12) for a given Ta.
The first case Vircator #1, was designed with ωp =
17.78 Grad/s, rdt = 5 cm and Ta = 50 %. The consideredparametric variations are: linear for rc and exponential for V .Figure 4 shows the difference between the power predictedby the surrogate model and the simulated one. The maximumerror was located in point number 15 indicated with doublecontour line. This point is near to the minimal current ensur-ing the Vircator’s operation (Iscl , see Eq. (15)). Points 2, 3, 5,6, and 7 show errors exceeding 15dB and together, with point
TABLE 4. Simulation points, results and model predictions for theVircator #1.
FIGURE 4. Error map between the simulated mean power and calculatedusing the surrogate model.
number 15, define a region where the surrogate model fails.These points are located near to the line Ib = Iscl . Points 8,9, 11, 13, 14, and 19 exhibit errors between 5 dB and 15 dBand define a region of moderate error. Finally, the model wasaccurate for points 4, 12, 18,17 and 16 which are close to theline Id = Ic. Model’s precision increases as the diode currenttends to the critical value (Ic, see Eq. (14)). Notice that theerror magnitude is represented here by colour scale and radiiof the circles.
The second Vircator #2 was designed at ωp =
19.50 Grad/s, rdt = 5 cm and Ta = 50 %. This exampleexplores the whole space of variables in the same way asthe previous one, but the sampling point were take on thecurves determined by nIscl where n =[1 2 3 4]. Additionally,some samples were taken over the curve Ic = Id . Thissampling was defined in order to verify how the error scalesover curves nIscl . The maximum error was calculated forpoint number 9 which is on the curve Iscl . Notice that thepoints closest to this curve present significant errors. The
VOLUME 8, 2020 205027

M. AlMansoori et al.: Assessing Vircators’ Reliability Through Uncertainty and Sensitivity Analyses Using a Surrogate Model
TABLE 5. Simulation points, results and model predictions for theVircator #2.
FIGURE 5. Mean power simulated for each sampled points of the Vircator#2.
model error decreases as the distance to the curve increases.In Figure 5, colours and radii, for the points simulated, do notpresent the error, instead it is presenting the power obtainedby simulation. That figure shows that also the accuracy of thesurrogate model is related to the power radiated, being betterfor Vircator with optimal power radiation.
The following known limitations of PIC simulations wouldapply:• the plasma expansion is not considered neither in thesurrogate model nor in PIC simulations;
• the plasma interaction and influence from shot-to-shotare not considered neither in the surrogate model or inPIC simulations;
Based on the evaluation of the given domain of validityof the surrogate model, we propose to perform a statisticalevaluation of the peak power by introducing a set or randomvariables with a special care of keeping the model in thelow error region (error less than 3 dB). The surrogate model,which is in good agreement with CST and XOOPIC, providesthe perfect framework for an efficient statistical analysis ofphysical quantities for a set of given RVs.
IV. ANALYSIS OF THE VIRCATOR RESPONSEThe random geometrical variables considered in this studyare proposed in Table 6. Unfortunately, no probability densityfunctions for the Cathode radius, Drift-tube radius, Anode-
TABLE 6. Definition of Random Variables (Test case #1, see Table 1).
Cathode gap and Anode transparency are available. The tol-erances have been defined based on the ISO standard formechanical parts where the Normal distribution is recom-mended for the different mechanical parts with their tolerancevalues. Vircators are typically fed by Pulsed Power sourcessuch as High Voltage (HVIG) or Current (HCIG) ImpulseGenerators which will affect the Vircator optimal operation.Two cases will be considered: first, the pulsed power sourceas ideal then a new set of RVs will be introduced to considerthe interaction between the source and the load referred to theVircator impedance.
A. INFLUENCE OF THE ELECTRON BEAM GENERATIONThe perveance in most high power pulsed diode system isknown as a time-varying increasing parameter since the elec-trode sheath plasma is generated which expands the anode-cathode gap distance reducing the effective gap. Duringthe process of generating electron beam from the cathode,the electrode sheath plasma is generated. This process ishighly influencing the perveance of the diode which leads tochanges of the diode output characteristics. Capturing thesechanges in simulations tools could allow to increase the accu-racy of the statistical evaluations. The first analysis proposedin the study concerns the validation of the reproduction of theperveance variability.
In recent papers published by Roy et al. [17], [19],an extensive analysis of the perveance has been proposedshowing its variability due to the plasma expansion and dur-ing the shot-to-shot operation. In a Vircator vacuum diode,the 1-D solution of the current is given by the Child-Langmuirlaw as I (t) = K (t)v(t)3/2, where K (t) is the diode perveanceand v(t) is the feed voltage. For a circular cathode, the per-veance can be defined as K (t) = kr2k (t)/d
2ak (t), where k =
7.33× 10⁻⁶V−3/2A, rk (t) is the cathode radius, and dak (t) isthe anode-cathode gap. Roy et al. [17], [19] have proposedan extensive experimental study of the plasma expansion andthe perveance. Considering that the plasma expands radiallyat vpr and axially at vpx , it has been proposed to describe thetwo variables as rk = ro + vpr · t and dak = do − vpx · t ,with ro being the initial emission radius and do the initialanode cathode gap. Defining the input parameters as randomvariables allows for generating different geometries using aMC simulation approach. When comparing the perveancefrom reported measurements/simulations [17], [19] with thestochastic surrogate model, it can be observed Fig. 6 thatthe variability of the perveance due to plasma expansion and
205028 VOLUME 8, 2020

M. AlMansoori et al.: Assessing Vircators’ Reliability Through Uncertainty and Sensitivity Analyses Using a Surrogate Model
FIGURE 6. Perveance reported in [19] for a diode of rc = 3.5 cm and0 = 0.6 cm constructed with velvet.
FIGURE 7. The histogram of the power computed for 10,000 randomconfigurations taking into account mechanical variations through the4 RVs (rc , rdt ,d and Ta) of Case #1.
shot-to-shot operation are well captured by the stochasticanalysis.
In what follows, the perveance will be re-computed foreach random configuration in order to take into account theinfluence of the changes in the diode output characteristics onthe peak power output.
B. TEST CASE #1: IDEAL PULSED POWER SOURCEIn this section, we are going to analyse the effects of mechan-ical variations only (see Table 6) which means that the feedvoltage source will be considered as constant. To do that,we generated 10,000 different configurations of the Vircatorvarying the parameters rc, rdt , d , Ta. Note that the conver-gence of the 4 first statistical moments has been reached for10,000 random configurations (less than 1 % variation on themean, variance, skewness and kurtosis). Each Vircator wasgenerated with a random selection of the design variablesfollowing a normal distribution, according to the PDF CVdefined in Table 6. The histogram of the estimated poweris presented in Figure 7. The statistical moments and thequantiles have been estimated and summarised in Table 8.It can be observed that based on descriptive statistics theoutput power is highly sensitive to parameters variability.
Table 7 summarises the results obtained for test Case #1(N = 4 RVs) from: Sobol’ indices [34] with 10,000 initial
TABLE 7. Sobol’ indices (MC) and importance variables (SCA) for Testcase #1 (in %), considering fvc and P .
FIGURE 8. HCIG schematic.
population, SCA considering SCT n − expansion (n = 2),leading to 2N = 24 = 16 simulations and 3N = 34 = 81(data not shown here). Results shows the excellent agreementbetween Sobol’ indexes and SCA importance variables, high-lighting the prominent impact of d-parameter (in compari-son to other random inputs) when dealing with fvc-output.By repeating Sobol’ analysis from 10,000 realisations ofrandom procedure, same conclusions are obtained focusingon P-observable (see Table 7. It is to be noticed that SCAoffers excellent agreement with respect to Sobol’ indices (atthe same time consideringP and fvc outputs, without any extracomputing costs, meaning respectively 16 and 81 SCT sim-ulations). Although the SCT expansion number is boundedhere (n = 2 and 3), the convergence level is extremely high(data not shown here), jointly with very accurate data.
C. Test CASE #2: NON-IDEAL PULSED POWER SOURCEFigure 8 presents the typical HCIG schematic, which is aserial circuit formed by a capacitance Cs charged at V0 att ≤ 0, an inductance Ls, and internal resistance Rs, a switch Sand a impedance Rl representing the load (i.e Vircator). Notethat the switch S is considered ideal in the present analysis.The differential equation defining the circuit could be writtenas [46]
i(t)′′ + ai(t)′ + bi(t) = 0, (16)
with initial conditions
i(0)′ = V0/Ls, i(0) = 0. (17)
In the Vircator diode region, the plasma covering cathodesurface expands in the time leading to the variation of thecathode radius and the anode-cathode gap. If these effects arenot considered, we can define
a =1Ls(Rs + Rl) , (18)
VOLUME 8, 2020 205029

M. AlMansoori et al.: Assessing Vircators’ Reliability Through Uncertainty and Sensitivity Analyses Using a Surrogate Model
FIGURE 9. Block diagram of the uncertainty propagation for Case #2.
FIGURE 10. The voltage waveform; solid line is the mean value of thesource, the dotted lines are random configurations.
and
b =1Ls
(1Cs+
ddtRl
), (19)
Additionally, the current in a vacuum diode can be definedas [47] (see Eq. (11))
i(t) = Kv(t)3/2, (20)
where K is the perveance.Rl can be defined, from Eq. (20), as
Rl =v(t)i(t)=
1K 2/3i(t)1/3
, (21)
For circular cathodes, K could be stated as
K =4π9ε0
√2emr2cd2. (22)
The solution for the set of equation stated from Eqs. (16)to (22) can be obtained by numerical means.
This HCIG model introduces four new variables (Ls, Cs,V0 and Rs). The number of realizations needed was 28 =
FIGURE 11. The histogram of the power generated for 10,000 randomconfigurations taking into account mechanical and electrical variationsthrough 8 RVs (rc , rdt , d , Ta, Rs, Cs, Ls, and V0) for case #2.
FIGURE 12. The histogram of the frequency generated for 10,000 randomconfigurations taking into account mechanical and electrical variationsthrough 8 RVs (rc , rdt , d , Ta, Rs, Cs, Ls, and V0) for case #2.
TABLE 8. Statistical analysis of the peak power and radiating frequencyfor case #1 and #2.
256 and 10, 000, respectively for SCA and MC-like Sobol’indices. Figure 9 present the general schematic of the prob-lem. Notice that now the problem presents eight design vari-ables. The values of V0 = 1480 kV, Rs = 3 �, Ls =200 nH, and Cs = 5 nF were chosen to produce a peakpower of 500 kV for the central mechanical design of theVircator (see Figure 10, solid back line). Table 9 showsthe typical variation of the elements. Figure 10 presents thewaveform of 50 random configurations of the source. Peak
205030 VOLUME 8, 2020

M. AlMansoori et al.: Assessing Vircators’ Reliability Through Uncertainty and Sensitivity Analyses Using a Surrogate Model
TABLE 9. Definition of Random Variables, including PP Source (Test case#2 relying on variables from Test case #1).
TABLE 10. Sobol’ indices (MC) and importance parameters (SCA) for Testcase #2 (in %), considering fvc and P .
voltage variation is in good agreement with experimentalresults [19]. As in the case of the ideal source, we performed10,000 evaluations of different random variation of the designvariables. The histograms of the estimated peak powers andoperating frequencies are provided in Figure 11 and Figure 12respectively. Descriptive statistics are summarised in Table 8.Table 10 synthesises the sensitivity analysis achieved forTest case #2 (8 RVs) considering the radiating frequency fvcand the power P. Complementary to Test case #1, the d-parameter remains the most influential one with fvc-output;in this framework, it is to be noticed that the voltage V0 playsan important role. The results obtained from Sobol’ indicesand SCT importance variables agree very well. As expected,introducing non-ideal voltage source involves extra influenceof the voltage parameter (hereV0) with differences dependingon the considered output: for fvc (Table 10, SA leads toranking the most influential parameter as follows: respec-tively d- and V0-input, regarding P (Table 10, the uncertainvariations around V0-parameter are the most influential ones,far from d−input (less influential than in previous case). Outof d and V0, through a first-order analysis, the other inputsmay be assumed as constant parameters. These results are inconcordance with previous experimental studies available inthe literature [8]–[12].
V. CONCLUSIONA stochastic analysis based on the surrogate model of theVircator has been proposedwith a focus on general tendencies(i.e mean and variance analysis) of physical quantities basedon Sobol’ indices and SCA. The influence of mechanicaltolerances and electrical source variability on the perfor-mance of Virtual cathode oscillators has been evaluated. Twocases were analysed. Case #1 took into account the mechan-ical parameters only; whereas for Case #2, the effects ofthe non-ideal pulsed power source was considered as well.
The anode-cathode gap (d) was found to be the parameterwith the highest impact on the power and the frequency inthe case of the ideal source. This high significance couldbe a consequence of the high percentage of variability dueto its cumbersome fixing. In the non-ideal pulsed powersource case, Voltage (V ) is the most significant parame-ter for the power, while d has the highest impact on thefrequency. The results obtained in this study validated theexperimental reports that have suggested the high depen-dency of the Vircator’s outputs on the feed Voltage (V ) andanode-cathode gap d . It is to be noted that the proposedstrategy, including surrogate Vircator’s modelling, providesan efficient methodology to assess realistic statistical infor-mation regarding the Vircator’s behaviour. Furthermore, as analternative to brute force Sobol’ design methodology, SCAoffers trustworthy guidelines to minimise the random varia-tions due tomechanical manufacturing, at reduced computingcosts (hundreds of simulations at maximum). The proposedframework can easily be adapted in terms of number ofrandom variables and distributions. This would allow otherresearch groups to evaluate the influence of different randomassumptions, e.g. uncertainties introduced by manufacturerstolerances, electronic components variability through the def-inition of coefficients of variation and probability densityfunctions.
ACKNOWLEDGMENTThe authors would like to thank Dr. Juan Coronel fromthe Directed Energy Research Centre, Technology Inno-vation Institute, for his recommendations on the proposedstudy.
REFERENCES[1] A. N. Didenko, A. G. Zherlitsyn, and G. V. Melnikov, ‘‘Research
of microwave generation efficiency for triode with virtual cath-ode (vircator triode),’’ in Proc. 12th Int. Conf. High-Power Part.Beams. (BEAMS), vol. 1, Jun. 1998, pp. 65–68. [Online]. Available:http://ieeexplore.ieee.org/lpdocs/epic03/wrapper.htm?arnumber=822391
[2] A. E. Dubinov, I. A. Efimova, I. Y. Kornilova, S. K. Saikov, V. D. Selemir,and V. P. Tarakanov, ‘‘Nonlinear dynamics of electron beams with avirtual cathode,’’ Phys. Particles Nuclei, vol. 35, no. 2, p. 251–284,2004.
[3] D. J. Sullivan, ‘‘High power microwave generation from a virtual cathodeoscillator (vircator),’’ IEEETrans. Nucl. Sci., vol. 30, no. 4, pp. 3426–3428,Aug. 1983.
[4] R. Mahaffey, ‘‘High-power microwaves from a non-isochronic reflexingsystem,’’ Phys. Rev. Lett, vol. 39, p. 843, Sep. 1977.
[5] J. Benford, J. Swegle, and E. Schamiloglu,High PowerMicrowaves (Seriesin Plasma Physics). Boca Raton, FL, USA: CRC Press, 2007. [Online].Available: https://books.google.ae/books?id=qHCPPQvr12sC
[6] G. Singh and S. Chaturvedi, ‘‘PIC simulation of effect of energy-dependentfoil transparency in an axially-extracted vircator,’’ IEEE Trans. PlasmaSci., vol. 32, no. 6, pp. 2210–2216, Dec. 2004.
[7] B. V. Alyokhin, A. E. Dubinov, V. D. Selemir, O. A. Shamro,K. V. Shibalko, N. V. Stepanov, and V. E. Vatrunin, ‘‘Theoretical andexperimental studies of virtual cathode microwave devices,’’ IEEE Trans.Plasma Sci., vol. 22, no. 5, pp. 945–959, Oct. 1994.
[8] M. C. Choi, S. H. Choi, M. W. Jung, K. K. Seo, Y. H. Seo, K. S. Cho,E. H. Choi, and H. S. Uhm, ‘‘Characteristic of vircator output at variousAK gap distances with diode perveance,’’ in Proc. IEEE Conf. Rec. PulsedPower Plasma Sci., 28th IEEE Int. Conf. Plasma Sci., 13th IEEE Int. PulsedPower Conf. (PPPS), Jun. 2001, p. 503.
VOLUME 8, 2020 205031

M. AlMansoori et al.: Assessing Vircators’ Reliability Through Uncertainty and Sensitivity Analyses Using a Surrogate Model
[9] C.-S. Hwang and M.-W. Wu, ‘‘A high power microwave vircator withan enhanced efficiency,’’ IEEE Trans. Plasma Sci., vol. 21, no. 2,pp. 239–242, Apr. 1993.
[10] R. Verma, R. Shukla, S. K. Sharma, P. Banerjee, R. Das, P. Deb,T. Prabaharan, B. Das, E. Mishra, B. Adhikary, K. Sagar, M. Meena, andA. Shyam, ‘‘Characterization of high power microwave radiation by anaxially extracted vircator,’’ IEEE Trans. Electron Devices, vol. 61, no. 1,pp. 141–146, Jan. 2014.
[11] V. Baryshevsky, A. Gurinovich, E. Gurnevich, and P. Molchanov, ‘‘Exper-imental study of a triode reflex geometry vircator,’’ IEEE Trans. PlasmaSci., vol. 45, no. 4, pp. 631–635, Apr. 2017.
[12] L. Li, L. Liu, G. Cheng, Q. Xu, H.Wan, L. Chang, and J.Wen, ‘‘The depen-dence of vircator oscillation mode on cathode material,’’ J. Appl. Phys.,vol. 105, no. 12, Jun. 2009, Art. no. 123301, doi: 10.1063/1.3151863.
[13] Y. Wang and W. Xu, ‘‘Probability statistical method of assisting electro-magnetic compatibility index decision-making,’’ in Proc. IEEE Int. Symp.Electromagn. Compat. IEEE Asia–Pacific Symp. Electromagn. Compat.(EMC/APEMC), May 2018, pp. 509–512.
[14] Z. Yuan, Z. Xiang, Y. Liping, Z. Haijing, and H. Kama, ‘‘High frequencyresponse sensitivity of electrically large enclosure with aperture and itsstatistical analysis method,’’ in Proc. Asia–Pacific Symp. Electromagn.Compat. (APEMC), May 2015, pp. 185–188.
[15] T. Liang, G. Spadacini, F. Grassi, and S. A. Pignari, ‘‘Coupling ofwidebandradiated IEMI to wiring harness: A statistical analysis of the main influ-encing parameters,’’ in Proc. IEEE Symp. Electromagn. Compat., SignalIntegrity Power Integrity (EMC, SI PI), Jul. 2018, pp. 357–362.
[16] I. Saleem, M. Aslam, and M. Azam, ‘‘The use of statistical methods inmechanical engineering,’’ Res. J. Appl. Sci., Eng. Technol., vol. 5, no. 7,pp. 2327–2331, Mar. 2013.
[17] A. Roy, R. Menon, S. K. Singh, M. R. Kulkarni, P. C. Saroj, K. V. Nagesh,K. C. Mittal, and D. P. Chakravarthy, ‘‘Shot to shot variation in perveanceof the explosive emission electron beam diode,’’ Phys. Plasmas, vol. 16,no. 3, Mar. 2009, Art. no. 033113, doi: 10.1063/1.3097903.
[18] A. Roy, A. Sharma, V. Sharma, A. Patel, and D. P. Chakravarthy, ‘‘Fre-quency variation of a reflex-triode virtual cathode oscillator,’’ IEEE Trans.Plasma Sci., vol. 41, no. 1, pp. 238–242, Jan. 2013.
[19] A. Roy, R. Menon, K. V. Nagesh, and D. P. Chakravarthy, ‘‘High-currentdensity electron beam generation from a polymer velvet cathode,’’ J.Phys. D, Appl. Phys., vol. 43, no. 36, Aug. 2010, Art. no. 365202.
[20] A. Roy, S. K. Singh, R. Menon, D. Senthil Kumar, S. Khandekar,V. B. Somu, S. Chottray, P. C. Saroj, K. V. Nagesh, K. C. Mittal, andD. P. Chakravarthy, ‘‘Pulsewidth variation of an axial vircator,’’ IEEETrans. Plasma Sci., vol. 38, no. 7, pp. 1538–1545, Jul. 2010.
[21] P. Naenna and J. T. Johnson, ‘‘Monte Carlo simulation of altimeter pulsereturns and electromagnetic bias,’’ in Proc. IEEE Int. Geosci. Remote Sens.Symp. (IGARSS), vol. 5, Jul. 2008, pp. 120–123.
[22] A. De Leo, V. M. Primiani, P. Russo, and G. Cerri, ‘‘Numerical analysisof a reverberation chamber: Comparison between mechanical and sourcestirring techniques,’’ in Proc. Int. Symp. Electromagn. Compat. (EMCEur.), Sep. 2017, pp. 1–6.
[23] H. Acikgoz and R. Mittra, ‘‘Statistical analysis of electromagnetic struc-tures and antennas using the polynomial chaos expansion method,’’in Proc. 11th Eur. Conf. Antennas Propag. (EUCAP), Mar. 2017,pp. 798–800.
[24] R. Mittra, Ed., Developments in Antenna Analysis and Design (Electro-magnetic Waves), vol. 2. Edison, NJ, USA: IET, 2018. [Online]. Available:https://digital-library.theiet.org/content/books/ew/sbew543g
[25] T. Houret, P. Besnier, S. Vauchamp, and P. Pouliguen, ‘‘Estimating theprobability density function of the electromagnetic susceptibility froma small sample of equipment,’’ Prog. Electromagn. Res. B, vol. 83,pp. 93–109, Mar. 2019.
[26] O. Yuzugullu, S. Marelli, E. Erten, B. Sudret, and I. Hajnsek, ‘‘Global sen-sitivity analysis of a morphology based electromagnetic scattering model,’’in Proc. IEEE Int. Geosci. Remote Sens. Symp. (IGARSS), Jul. 2015,pp. 2743–2746.
[27] E. Burnaev, I. Panin, and B. Sudret, ‘‘Efficient design of experiments forsensitivity analysis based on polynomial chaos expansions,’’ Ann. Math.Artif. Intell., vol. 81, pp. 187–207, Mar. 2017.
[28] A. A. Razi Kazemi and K. Niayesh, ‘‘Impact of spark gap break-down phenomena on the output voltage of compact Marx generators,’’IEEE Trans. Dielectr. Electr. Insul., vol. 18, no. 4, pp. 1022–1028,Aug. 2011.
[29] S. Lallechere, C. F. M. Carobbi, and L. R. Arnaut, ‘‘Review of uncer-tainty quantification of measurement and computational modeling in EMCpart II: Computational uncertainty,’’ IEEE Trans. Electromagn. Compat.,vol. 61, no. 6, pp. 1699–1706, Dec. 2019.
[30] D. Xiu, ‘‘Fast numerical methods for stochastic computations:A review,’’ Commun. Comput. Phys., vol. 5, nos. 2–4, pp. 242–272,2009.
[31] B. Iooss and P. Lemaitre, ‘‘Uncertainty management in simulation-optimization of complex systems—Algorithms and applications,’’ in AReview on Global Sensitivity Analysis Methods. Boston, MA, USA:Springer, 2015, pp. 101–122.
[32] M. Breant, O. Maurice, G. Duchamp, and T. Dubois, ‘‘To improvethe variability of one complex system with the MKME,’’ in Proc.Int. Symp. Electromagn. Compat. (EMC Eur.), Roma, Italy, Sep. 2012,pp. 1–6.
[33] C. H. Noh, W. Chung, J. Lim, and B. C. Lee, ‘‘Design optimization ofthe interim support of the ITER lower cryostat thermal shield using ametamodel,’’ IEEE Trans. Plasma Sci., vol. 44, no. 9, pp. 1684–1688,Sep. 2016.
[34] F. Cannavó, ‘‘Sensitivity analysis for volcanic source modeling qualityassessment and model selection,’’ Comput. Geosci., vol. 44, pp. 52–59,Jul. 2012.
[35] Z. Fei, Y. Huang, J. Zhou, and C. Song, ‘‘Numerical analysis ofa transmission line illuminated by a random plane-wave field usingstochastic reduced order models,’’ IEEE Access, vol. 5, pp. 8741–8751,2017.
[36] T. E. Lovett, F. Ponci, and A. Monti, ‘‘A polynomial chaos approach tomeasurement uncertainty,’’ IEEE Trans. Instrum. Meas., vol. 55, no. 3,pp. 729–736, Jun. 2006.
[37] M. Eldred and J. Burkardt, ‘‘Comparison of non-intrusive polynomialchaos and stochastic collocation methods for uncertainty quantification,’’in Proc. AIAA, vols. 0976–2009, 2009, pp. 1–20.
[38] E. Neira, Y.-Z. Xie, and F. Vega, ‘‘On the virtual cathode oscillator’s energyoptimization,’’ AIP Adv., vol. 8, no. 12, Dec. 2018, Art. no. 125210, doi:10.1063/1.5045587.
[39] I. Langmuir, ‘‘The effect of space charge and residual gases on thermioniccurrents in high vacuum,’’ Phys. Rev., vol. 2, no. 6, pp. 450–486,Dec. 1913. [Online]. Available: http://link.aps.org/doi/10.1103/PhysRev.2.450
[40] C. D. Child, ‘‘Discharge from hot cao,’’ Phys. Rev. I, vol. 32,no. 5, pp. 492–511, May 1911. [Online]. Available: http://link.aps.org/doi/10.1103/PhysRevSeriesI.32.492
[41] J. I. Katz, ‘‘Dimensional bounds on vircator emission,’’ IEEE Trans.Plasma Sci., vol. 44, no. 12, pp. 3268–3270, Dec. 2016.
[42] D. Biswas, ‘‘A one-dimensional basic oscillator model of the vircator,’’Phys. Plasmas, vol. 16, no. 6, Jun. 2009, Art. no. 063104.
[43] M. A. Heald and J. B.Marion,Clasical Electromagnetic RAdiation, 3rd ed.Thousand Oaks, CA, USA: Thomson Learning, 1995.
[44] J. P. Verboncoeur, M. V. Alves, V. Vahedi, and C. K. Birdsall, ‘‘Simul-taneous potential and circuit solution for 1D bounded plasma particlesimulation codes,’’ Comput. Phys., vol. 104, no. 2, pp. 321–328, 1993.
[45] S. Putnam, Theoretical Studies of Intense Relativistic ElectronBeam-Plasma Interactions, 1st ed. San Leandro, CA, US:Physics International Company, 1972.
[46] E. Kuffel, W. Zaengl, and J. Kuffel, High Voltage EngineeringFundamentals, 2nd ed. E. Kuffel, W. Zaengl, and J. Kuffel, Eds.Oxford, U.K.: Newnes, 2000, pp. 1–7. [Online]. Available: http://www.sciencedirect.com/science/article/pii/B9780750636346500022
[47] M. C. Choi, S. H. Choi, K. B. Song, Y. Jung, T. S. Cho, Y. Seo,G. S. Cho, and E. H. Choi, ‘‘Characteristics of diode perveance andvircator output under various anode-cathode (A-K) gap distances,’’ inPulsed Power Plasma Sci., 28th IEEE Int. Conf. Plasma Sci., 13thIEEE Int. Pulsed Power Conf. Dig. Papers (PPPS), vol. 2, Jun. 2001,pp. 1649–1652.
205032 VOLUME 8, 2020

M. AlMansoori et al.: Assessing Vircators’ Reliability Through Uncertainty and Sensitivity Analyses Using a Surrogate Model
MAE ALMANSOORI (Graduate Student Mem-ber, IEEE) received the M.Sc. degree in mechan-ical engineering from Khalifa University, AbuDhabi, United Arab Emirates, in 2019.
She served as a Researcher for the AerospaceResearch and Innovation Center, focusing onstructural designing. She is currently working asa Senior Mechanical Researcher with the DirectedEnergy Research Centre, Technology InnovationInstitute, Abu Dhabi, applying state-of-the-art
mechanical engineering processes to high power electromagnetic sources.Her research interests include structural designing, materials and mechanicalanalysis, additive manufacturing, and heat exchangers. She is currentlyworking on switched oscillators and high power microwave systems suchas the Vircator focusing on optimization problems using statistical methods.Furthermore, she is developing her knowledge in the current electromag-netic accelerator (Railgun) project at the Directed Energy Research Centre.In 2020, she received the ‘‘Young Scientist Award’’ from the InternationalUnion of Radio Science (URSI)—German Section during KleinheubacherTagung.
ERNESTO NEIRA (Member, IEEE) was born inCachipay, Cundinamarca, Colombia, in 1981. Hereceived the B.S. degree in electronic engineer-ing from the Universidad Distrital Francisco Joséde Caldas, Bogotá, Colombia, in 2005, and thePh.D. degree in engineering from the UniversidadNacional de Colombia, Bogotá, in 2019.
From 2008 to 2013, he was a Researcher withthe Universidad Nacional de Colombia, in thetopic of landmines and explosives with a grant
from Colombian Army. He is currently working with the Directed EnergyResearch Centre, Technology Innovation Institute, Abu Dhabi, United ArabEmirates. His research interests include high powermicrowaves, electromag-netic compatibility, and telecommunications.
Mr. Neira is the winner of the Engineering Award Enrique Morales2011 by the Sociedad Colombiana de Ingenieros and the Scientist Awardfrom the Francisco José de Caldas 2012 granted by the Group of IngenierosMilitares of Colombia for important contributions in the solution of theproblematic of the Colombian landmines.
SEBASTIEN LALLECHERE (Member, IEEE)received the Ph.D. degree in electronics/electromagnetics from Universite Blaise Pascal,Clermont-Ferrand, France, in 2006, and the French‘‘Habilitation à Diriger des Recherches’’ (HDR)in electronics/electromagnetics from UniversitéClermont Auvergne (UCA), Clermont-Ferrand,in 2018.
He served as a Research Engineer with theLASMEA, Clermont-Ferrand, in 2007, focusing
on intensive computational methods for electromagnetics. He is currentlyan Associate Professor with the Institut Pascal, UCA. His research interestsinclude the fields of electromagnetic compatibility, including antennas andpropagation, complex electromagnetic environments, computational electro-magnetics, and stochastic modeling in electrical engineering.
CHAOUKI KASMI received the double master’sdegrees in embedded electronics from ESEO,Angers, France, and in microelectronics fromInstitut National des Sciences Appliquées deRennes, Rennes, France, in 2009, and the Ph.D.degree in electronics from Sorbonne University—Paris VI, France.
In 2009, he joined the Wireless Security Labo-ratory, French Network and Information SecurityAgency, Paris, as a Researcher in Electromagnetic
Security. He is currently the Chief Research Officer of the Directed EnergyResearch Centre, Technology Innovation Institute, Abu Dhabi, United ArabEmirates, and an Associate Scientist with the Faculty of Electrical Engi-neering, Helmut Schmidt University, Hamburg, Germany. He also serves asthe Vice-President of Commission E for the International Union of RadioScience (URSI), France, and Early Career Representative at Internationallevel. His research interests include electromagnetic interferences, includingpropagation, complex EM environments, statistical electromagnetics, andcyber electromagnetics. He received the Young Scientist Award from URSI,in 2014 and 2015, and has been given aHPEMLife Fellow from the SUMMAFoundation.
FELIX VEGA (Senior Member, IEEE) received thePh.D. degree in electrical engineering from theSwiss Federal Institute of Technology Lausanne(EPFL), Switzerland, and the second Ph.D. degreein electrical engineering from the National Univer-sity of Colombia.
He is the Director of Electromagnetic Researchand Development at the Directed Energy ResearchCentre, a Centre affiliated with the TechnologyInnovation Institute (TII), AbuDhabi, United Arab
Emirates. He is also a Professor of Antennas and Electromagnetism with theUniversidad Nacional de Colombia, Bogotá. His research interests includehigh power electromagnetic sources, antennas, and effects on systems. Heis a HPEM Fellow of the SUMMA Foundation. He received the ‘‘YoungScientist Award’’ from URSI, in August 2008, the ‘‘Frank Gunther Award’’from the Radio Club of America, in 2011, the Best Applied Paper Awardfrom the SUMMA Foundation series of Notes 2010–2012, in 2012, and the‘‘John Howard Memorial Award’’ from the IEEE—EMC Society, in 2015.He is the Secretary of the IEEE Antennas and Propagation Society.
FAHAD ALYAFEI received the B.Sc. degree inelectrical engineering from Virginia Common-wealth University, USA, the M.B.A. degree fromthe American University in Dubai, the master’s(Diploma) degree in electricity supply manage-ment from Cambridge University, U.K., and thePh.D. degree in transfer of technology fromBrunelUniversity London, in 2013. He was an Advisorin Business Development with Tawazun EconomicCouncil. He worked for almost 20 years in the
leading positions at prominent organizations both inside and outside theUAE, including the Emirates Identity Authority, Abu Dhabi DistributionCompany, Abu Dhabi Water & Electricity Authority, Thuraya SatelliteTelecommunications Company, and Virginia Microelectronic Center, Rich-mond, VA, USA.
VOLUME 8, 2020 205033