assessing the water quality of south florida water management reservoirs november 18, 2004 robert l....
TRANSCRIPT
Assessing the Water Quality of Assessing the Water Quality of South Florida Water Management South Florida Water Management
ReservoirsReservoirs
November 18, 2004November 18, 2004
Robert L. Knight, Ph.D.Wetland Solutions, Inc.
www.wetlandsolutionsinc.com
Presentation to the South Florida Water Management District
Water Quality in South Florida Reservoirs Water Quality in South Florida Reservoirs
Project GoalProject Goal
•Develop empirical tools to Develop empirical tools to assess water quality in assess water quality in south Florida water south Florida water management reservoirsmanagement reservoirs
Water Quality in South Florida Reservoirs Water Quality in South Florida Reservoirs
Project MethodProject Method•Utilize existing Utilize existing data from data from similar Florida similar Florida lacustrine lacustrine systems systems including lakes, including lakes, reservoirs, and reservoirs, and water water management management areasareas
Water Quality in South Florida Reservoirs Water Quality in South Florida Reservoirs
Project LimitationsProject Limitations
•Statistical evaluation onlyStatistical evaluation only•Not dynamic and not Not dynamic and not spatialspatial•Limited to existing data Limited to existing data from a variety of aquatic from a variety of aquatic systems, none of which are systems, none of which are exactly like the proposed exactly like the proposed water management water management reservoirsreservoirs

Water Quality in South Florida Reservoirs Water Quality in South Florida Reservoirs
Water Quality Assessment Water Quality Assessment Efforts To-DateEfforts To-Date
•Ten Mile Creek WPA Ten Mile Creek WPA ReviewReview•SAV-Dominated Lakes SAV-Dominated Lakes ReviewReview•DMSTA Calibration for LOWDMSTA Calibration for LOW•Florida Lake and Reservoir Florida Lake and Reservoir Database AnalysisDatabase Analysis
Assessment of Assessment of the Water Quality the Water Quality and and Environmental Environmental
Benefits of theBenefits of the
Ten Mile Ten Mile Creek Creek Water Water Preserve Preserve Area (WPA)Area (WPA)
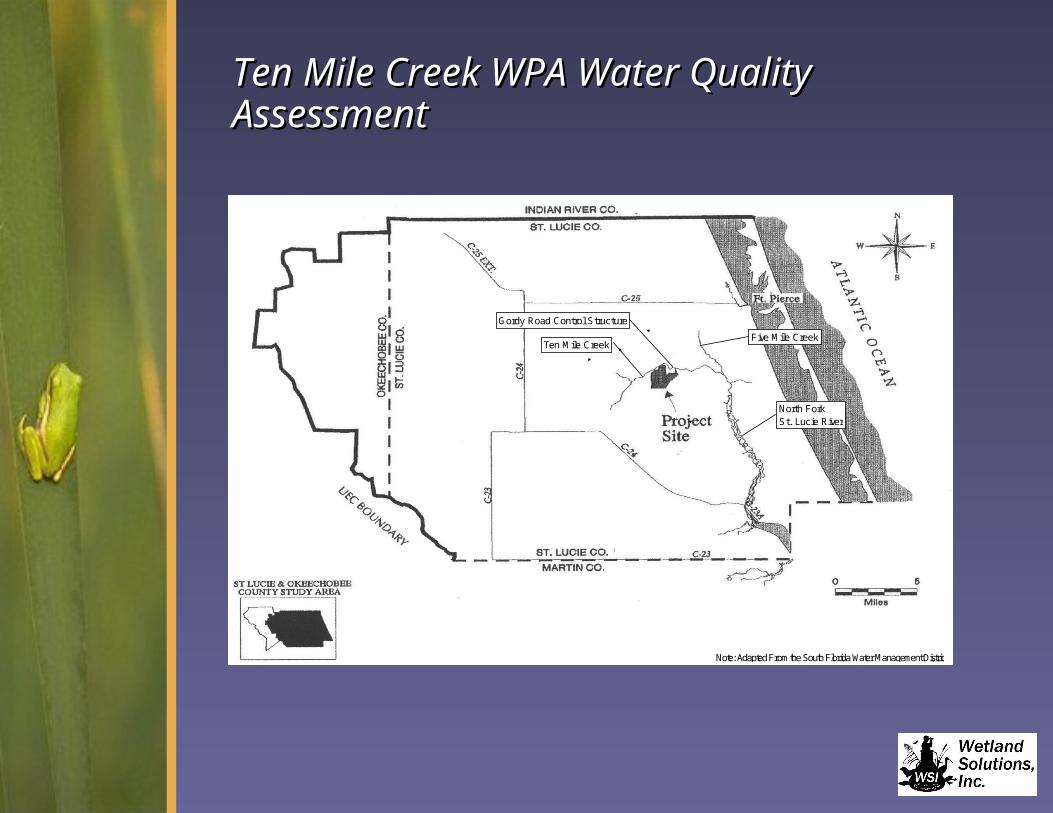
Ten Mile Creek WPA Water Quality Ten Mile Creek WPA Water Quality AssessmentAssessment
North Fork St. Lucie River
Ten Mile CreekFive Mile Creek
Note: Adapted From the South Florida Water Management District
Gordy Road Control Structure

Ten Mile Creek WPA Water Quality Ten Mile Creek WPA Water Quality AssessmentAssessment
Project BackgroundProject Background• Primary goal is to control the Primary goal is to control the
quantity and timing of freshwater quantity and timing of freshwater flows to the St. Lucie Estuary by flows to the St. Lucie Estuary by creating a water storage reservoircreating a water storage reservoir
• Secondary goal is to realize water Secondary goal is to realize water quality benefits associated with quality benefits associated with water storage and wetland water storage and wetland polishingpolishing
• Additional goal is to create suitable Additional goal is to create suitable habitat for wildlife and humans habitat for wildlife and humans

Ten Mile Creek WPA Water Quality Ten Mile Creek WPA Water Quality AssessmentAssessment
Goals of the Water Quality Goals of the Water Quality Assessment ProjectAssessment Project
• Assessment of water quality Assessment of water quality changes resulting from water changes resulting from water detention and polishingdetention and polishing
• Focus on nutrients, suspended Focus on nutrients, suspended solids, metals, and solids, metals, and agrichemicalsagrichemicals
• Recommended design criteria Recommended design criteria to optimize water quality and to optimize water quality and habitat project benefitshabitat project benefits

Ten Mile Creek WPA Water Quality Ten Mile Creek WPA Water Quality AssessmentAssessment
FloridaTurnpike
Gordy Road Station
70
I-95
Source: USGS 1999
N
0 4000
approx. scale (ft)
Ten Mile Creek
TreatmentCell
(132 ac)
Reservoir(526 ac)
Canal96
Emergency overf low
S-382
S-383
S-384
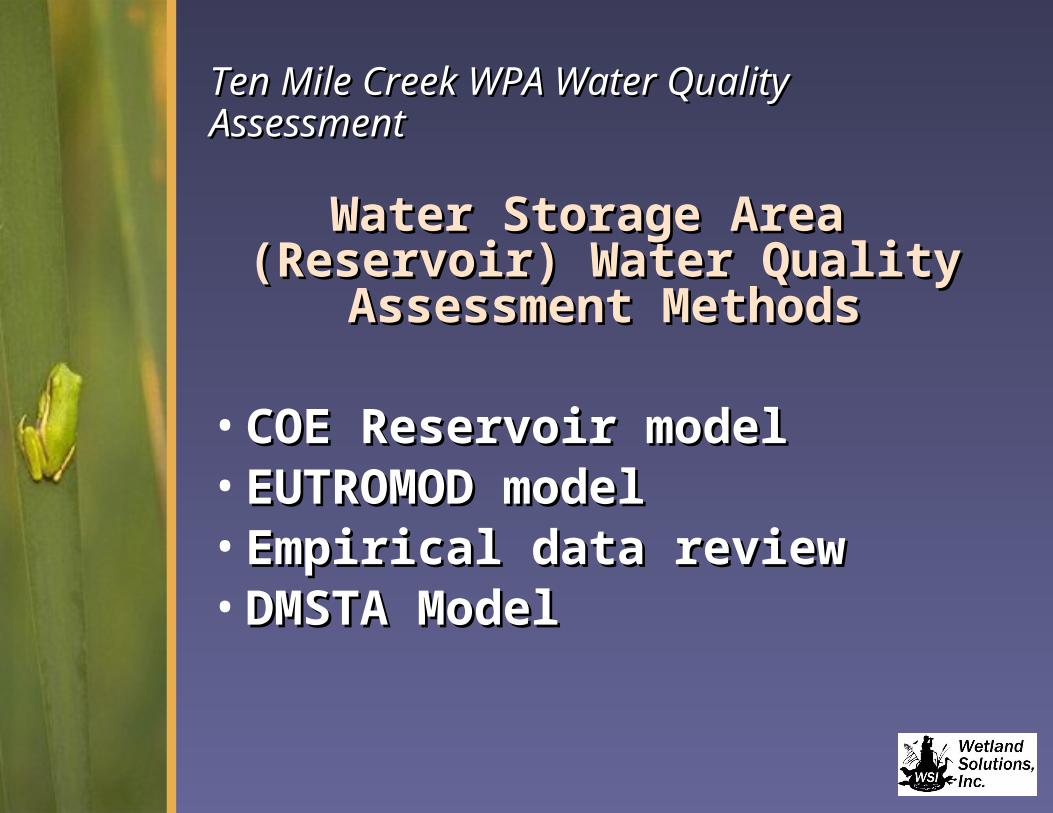
Ten Mile Creek WPA Water Quality Ten Mile Creek WPA Water Quality AssessmentAssessment
Water Storage Area Water Storage Area (Reservoir) Water Quality (Reservoir) Water Quality
Assessment MethodsAssessment Methods
• COE Reservoir modelCOE Reservoir model• EUTROMOD modelEUTROMOD model• Empirical data reviewEmpirical data review• DMSTA ModelDMSTA Model

Parameters and Equations for the Reservoir Water Quality Assessment Models
COE Reservoir Model (Walker 1998) EUTROMOD Model (Rechow et al. 1992)Terms Description Units Terms Description Units
P = Average rainfall m/yr Ci = Concentration in mg/LCi = TP concentration in ug/L Qi = Inflow rate hm3/yrCp = Rainfall TP concentration ug/L Qo = Outflow rate hm3/yrQi = Inflow rate hm3/yr A = WPA reservoir surface area km2Qo = Outflow rate hm3/yr qi = Hydraulic loading rate from pumped inflow m/yrA = WPA reservoir surface area km2
qa = Hydraulic loading rate based on average flow (Qi+Qo)/2m/yrqi = Hydraulic loading rate from pumped inflowm/yr t = Hydraulic residence time - mean yrUs = Exfiltrating groundwater m/yr Z = Mean water depth mUo = Infiltrating groundwater m/yr V = Reservoir volume hm3
Z = Mean water depth m Fw = Fraction of days with surface water N.A. Co= Concentration out, calculated: mg/LCs = TP concentration in exfiltrating groundwaterug/L Co(-1 s.e.) = Concentration out minus 1 std. error: mg/L
Co(+1s.e.) = Concentration out plus 1 std. error: mg/LCo= TP concentration out, calculated: ug/L
Model Equations:Model Equations: log10(TP) = log10[TPi/(1+KTPt)]Co = [Pi*(-1+4*N) 0̂.5]/(2*N) ug/L KTP = 1.71t-0.21Z1.01TPi
0.40
qo = Qo/A +Uo m/yr log10(TN) = log10[TNi/(1+KTNt)]K2 = 0.17*Fw*qo/(qo+13.3) N.A. KTN = 0.20t-0.89Z1.56TNi
0.33
Pi = [(Qi*Ci)/A + P*Cp + Us*Cs]/qo ug/L log10(CHLA) = 1.46+0.30log10(TP)+0.96log10(TN)N = K2*Pi*Z/qo mg/m3/yr

Ten Mile Creek WPA Water Quality Ten Mile Creek WPA Water Quality AssessmentAssessment
Water Detention Area Water Detention Area Empirical Data SetsEmpirical Data Sets
• St. Johns Water Control St. Johns Water Control District Floodway and District Floodway and Reservoir (1,760 ac)Reservoir (1,760 ac)
• Willowbrook Farms Reservoir Willowbrook Farms Reservoir (290 ac)(290 ac)
• St. Johns Water Management St. Johns Water Management Area (6,280 ac)Area (6,280 ac)
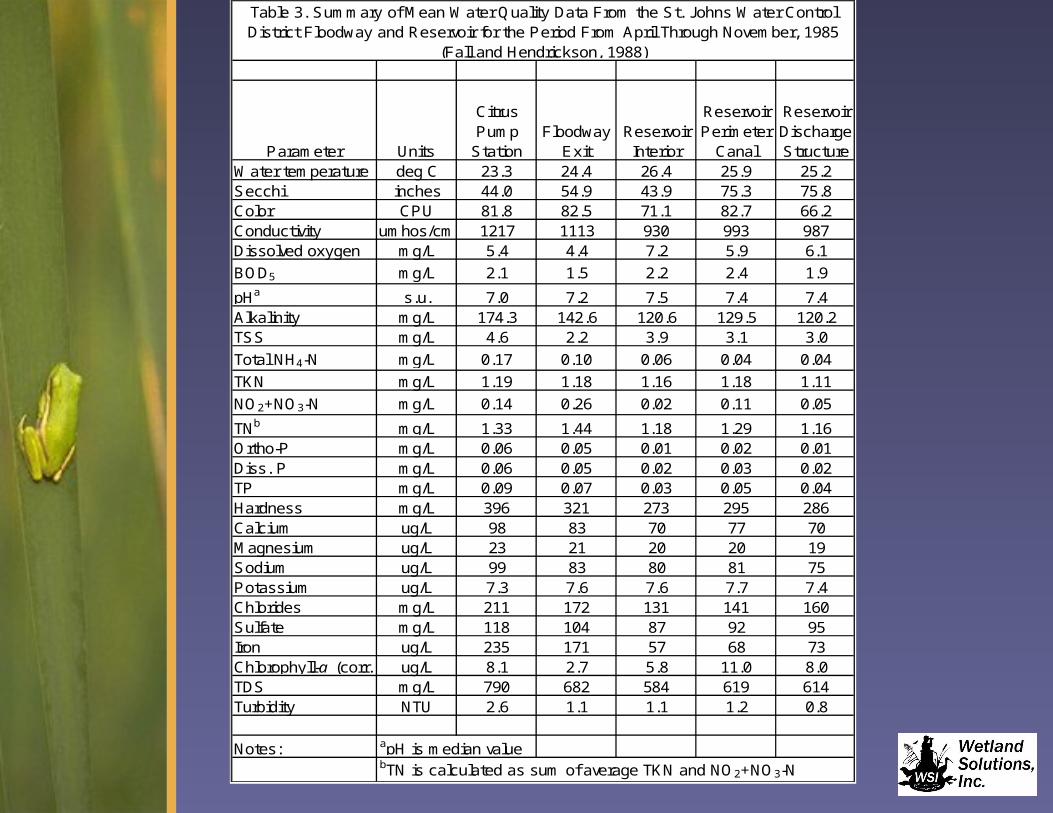
Table 3. Summary of Mean Water Quality Data From the St. Johns Water Control District Floodway and Reservoir for the Period From April Through November, 1985
(Fall and Hendrickson, 1988)
Parameter Units
Citrus Pump
StationFloodway
ExitReservoir Interior
Reservoir Perimeter
Canal
Reservoir Discharge Structure
Water temperature deg C 23.3 24.4 26.4 25.9 25.2Secchi inches 44.0 54.9 43.9 75.3 75.8Color CPU 81.8 82.5 71.1 82.7 66.2Conductivity umhos/cm 1217 1113 930 993 987Dissolved oxygen mg/L 5.4 4.4 7.2 5.9 6.1
BOD5 mg/L 2.1 1.5 2.2 2.4 1.9
pHa s.u. 7.0 7.2 7.5 7.4 7.4Alkalinity mg/L 174.3 142.6 120.6 129.5 120.2TSS mg/L 4.6 2.2 3.9 3.1 3.0
Total NH4-N mg/L 0.17 0.10 0.06 0.04 0.04
TKN mg/L 1.19 1.18 1.16 1.18 1.11
NO2+NO3-N mg/L 0.14 0.26 0.02 0.11 0.05
TNb mg/L 1.33 1.44 1.18 1.29 1.16Ortho-P mg/L 0.06 0.05 0.01 0.02 0.01Diss. P mg/L 0.06 0.05 0.02 0.03 0.02TP mg/L 0.09 0.07 0.03 0.05 0.04Hardness mg/L 396 321 273 295 286Calcium ug/L 98 83 70 77 70Magnesium ug/L 23 21 20 20 19Sodium ug/L 99 83 80 81 75Potassium ug/L 7.3 7.6 7.6 7.7 7.4Chlorides mg/L 211 172 131 141 160Sulfate mg/L 118 104 87 92 95Iron ug/L 235 171 57 68 73Chlorophyll-a (corr.) ug/L 8.1 2.7 5.8 11.0 8.0TDS mg/L 790 682 584 619 614Turbidity NTU 2.6 1.1 1.1 1.2 0.8
Notes: apH is median valuebTN is calculated as sum of average TKN and NO2+NO3-N

Summary of Estimated Water Quality for the Proposed Ten Mile Creek WPA Reservoir
Pumped Inflow From Ten Mile Creek Outflow to Polishing Cell
Parameter Units Average Maximum Minimum Average Maximum MinimumWater temperature deg C 24.5 31.0 15.2 24.5 33.5 13.0Secchi meters 1.2 2.4 0.6 1.2 2.4 0.3Color CPU 85.0 250.0 30.0 68.0 250.0 40.0Conductivity umhos/cm 1675 2570 670 1350 2050 500Dissolved oxygen mg/L 5.1 10.8 0.6 6.0 12.0 2.2
BOD5 mg/L 1.5 2.2 0.8 1.8 7.0 0.6
pH s.u. 7.2 7.8 6.9 7.3 9.4 6.7Alkalinity mg/L 190.0 200.0 180.0 120.0 190.0 60.0TSS mg/L 5.0 20.0 2.0 6.0 20.0 0.5
Total NH4-N mg/L 0.117 0.260 0.002 0.050 0.300 0.002
TKN mg/L 1.199 2.800 0.360 1.200 1.800 0.400
NO2+NO3-N mg/L 0.150 0.390 0.002 0.075 0.380 0.002
TN mg/L 1.559 2.600 0.770 1.340 1.832 0.979Ortho-P mg/L 0.192 0.300 0.040 0.060 0.180 0.010Diss. P mg/L 0.200 0.500 0.050 0.100 0.300 0.050TP mg/L 0.251 0.590 0.055 0.158 0.448 0.147Chlorides mg/L 401 690 190 320 550 150Sulfate mg/L 147 185 110 100 150 80Chlorophyll-a (corr.) ug/L 50.9 55.8 46.0 23.2 100.0 10.0Turbidity NTU 10.2 25.0 1.1 7.0 25.0 1.5Fecal coliforms col/100mL 118 780 5 100 750 5Copper ug/L 20 50 5 5 25 1Zinc ug/L 30 100 15 15 60 5
Source of estimate: STORET data from Gordy Road Bridge (1972- 1998)COE reservoir modelEUTROMOD modelBPJ (best professional judgment) from other central Florida reservoir data
Preliminary Estimates (Knight 1999)
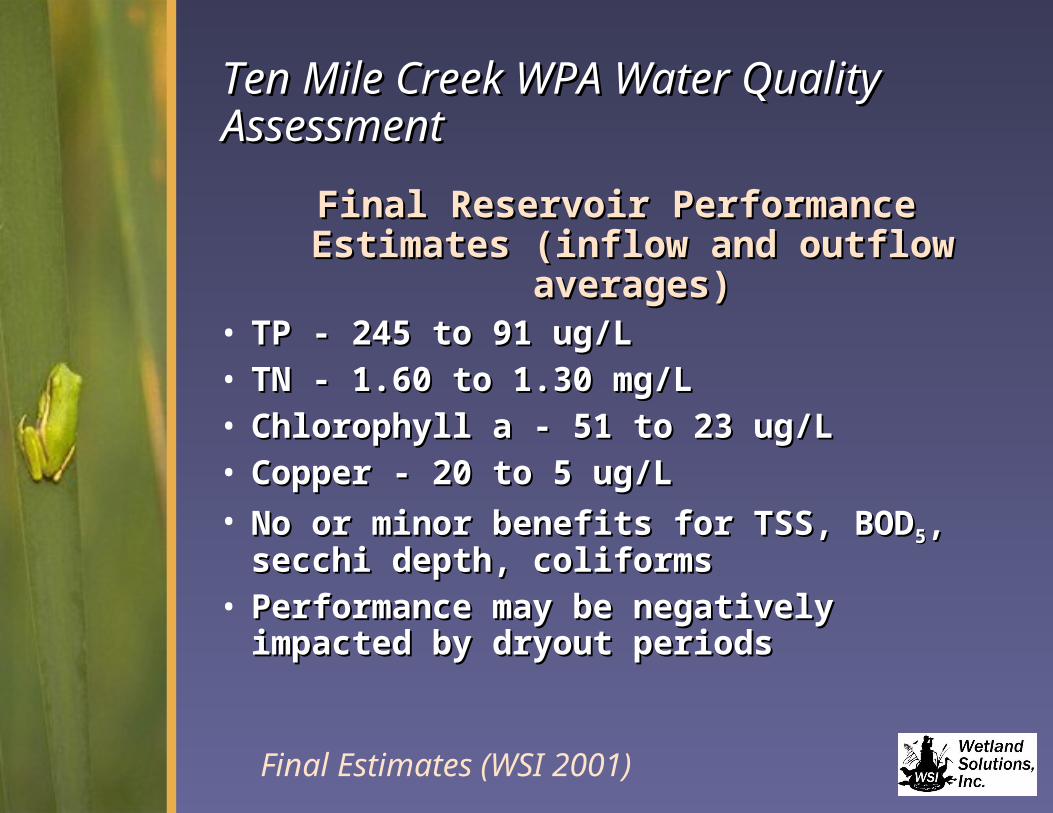
Final Reservoir Performance Final Reservoir Performance Estimates (inflow and outflow Estimates (inflow and outflow
averages)averages)• TP - 245 to 91 ug/L TP - 245 to 91 ug/L • TN - 1.60 to 1.30 mg/LTN - 1.60 to 1.30 mg/L• Chlorophyll a - 51 to 23 ug/LChlorophyll a - 51 to 23 ug/L• Copper - 20 to 5 ug/LCopper - 20 to 5 ug/L• No or minor benefits for TSS, BODNo or minor benefits for TSS, BOD55, ,
secchi depth, coliformssecchi depth, coliforms• Performance may be negatively Performance may be negatively
impacted by dryout periodsimpacted by dryout periods
Ten Mile Creek WPA Water Ten Mile Creek WPA Water Quality AssessmentQuality Assessment
Final Estimates (WSI 2001)

Assessment of Assessment of the Water Quality the Water Quality
ofof
Submerged Submerged Aquatic Aquatic Vegetation Vegetation (SAV)-(SAV)-Dominated Dominated Lakes and Lakes and RiversRivers
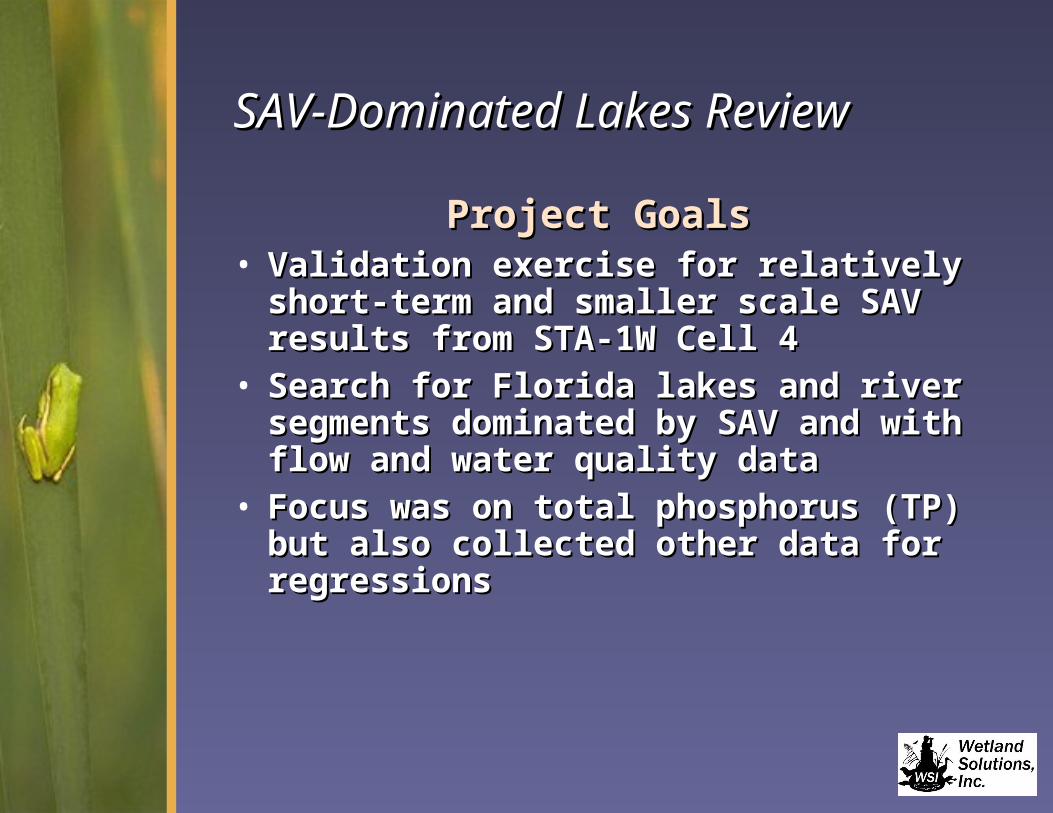
SAV-Dominated Lakes ReviewSAV-Dominated Lakes Review
Project GoalsProject Goals• Validation exercise for relatively Validation exercise for relatively
short-term and smaller scale SAV short-term and smaller scale SAV results from STA-1W Cell 4results from STA-1W Cell 4
• Search for Florida lakes and river Search for Florida lakes and river segments dominated by SAV and segments dominated by SAV and with flow and water quality datawith flow and water quality data
• Focus was on total phosphorus Focus was on total phosphorus (TP) but also collected other data (TP) but also collected other data for regressionsfor regressions
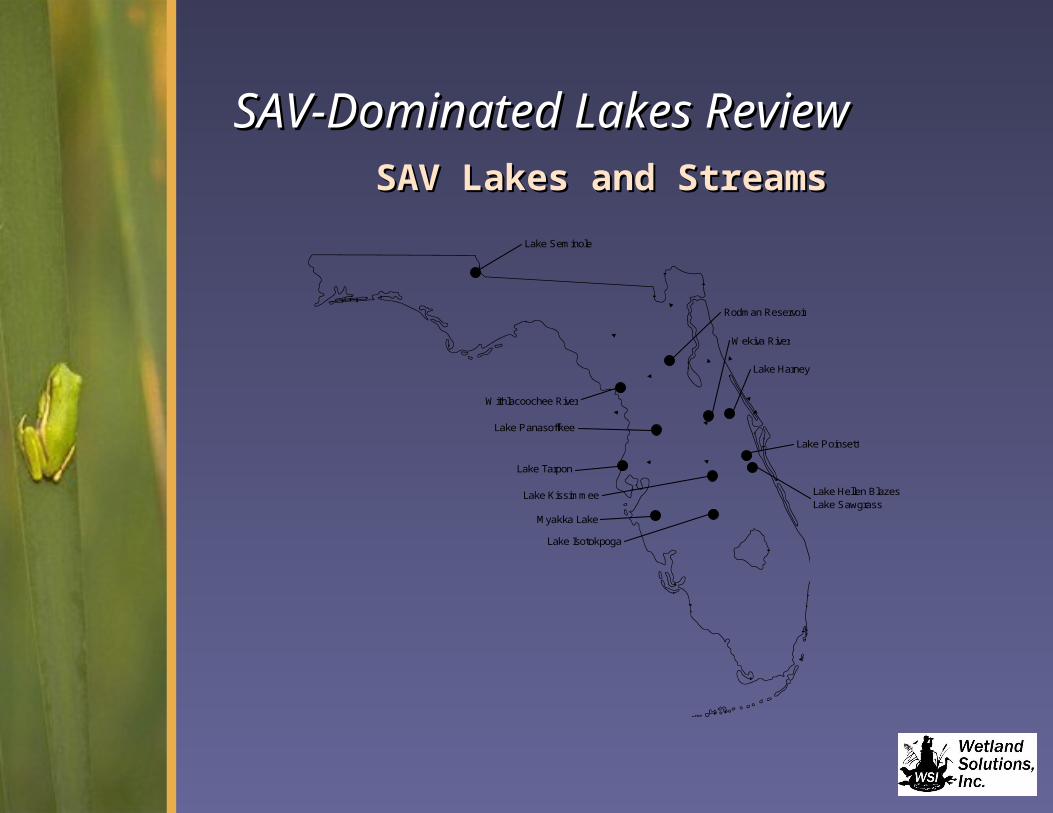
SAV-Dominated Lakes ReviewSAV-Dominated Lakes ReviewSAV Lakes and StreamsSAV Lakes and Streams
Lake Harney
Lake Hellen BlazesLake Sawgrass
Lake Poinsett
Lake Isotokpoga
Lake Kissimmee
Myakka Lake
Lake Panasoffkee
Rodman Reservoir
Withlacoochee River
Lake Seminole
Lake Tarpon
Wekiva River
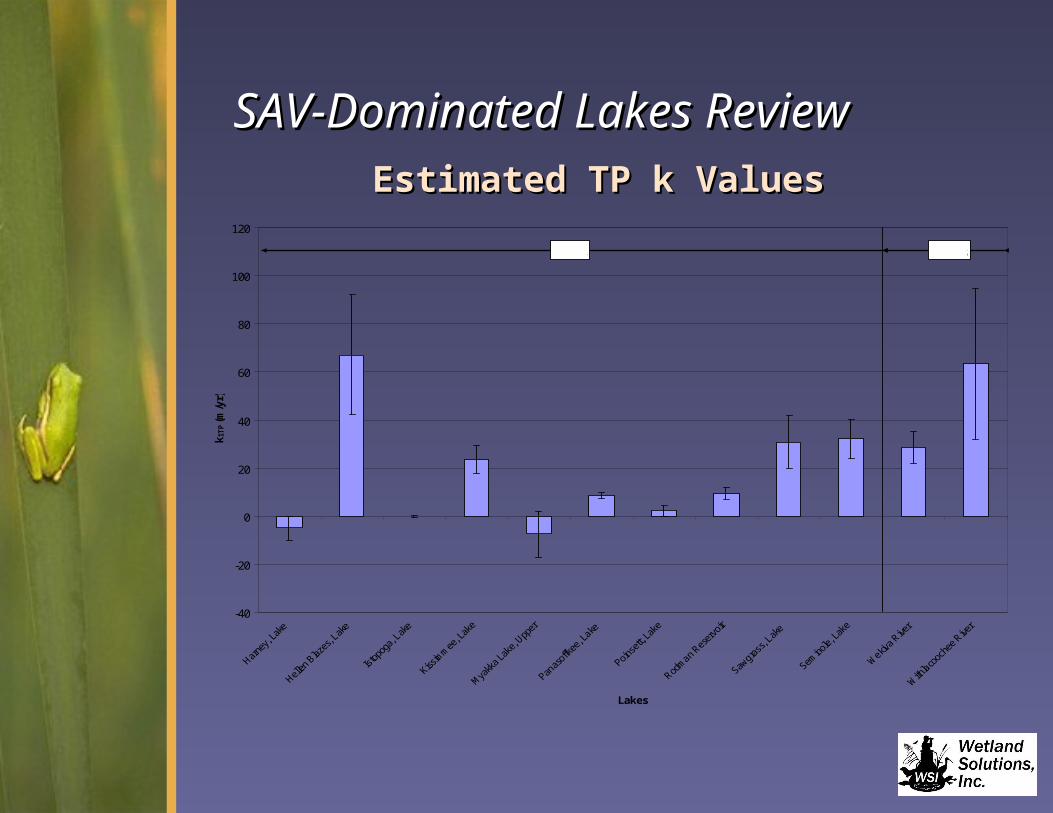
SAV-Dominated Lakes ReviewSAV-Dominated Lakes ReviewEstimated TP k ValuesEstimated TP k Values
-40
-20
0
20
40
60
80
100
120
Lakes
k1T
P (m
/yr)
Lakes Rivers
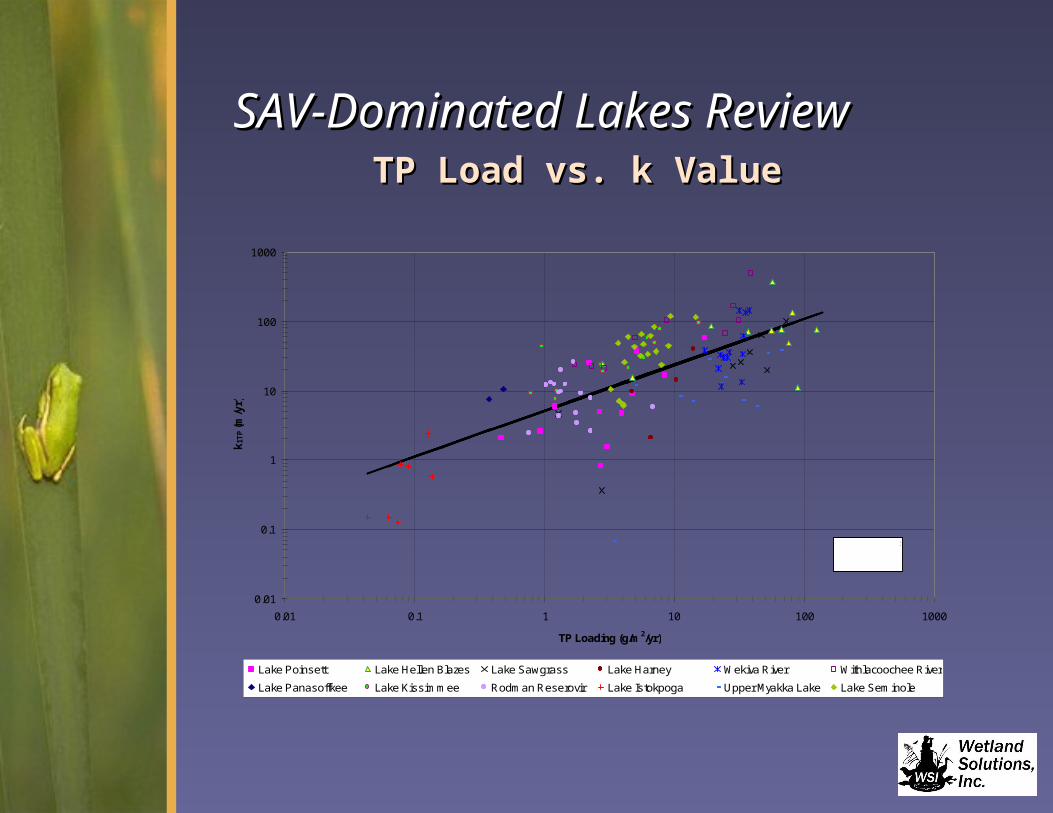
SAV-Dominated Lakes ReviewSAV-Dominated Lakes ReviewTP Load vs. k ValueTP Load vs. k Value
0.01
0.1
1
10
100
1000
0.01 0.1 1 10 100 1000
TP Loading (g/m2/yr)
k1T
P (m
/yr)
Lake Poinsett Lake Hellen Blazes Lake Sawgrass Lake Harney Wekiva River Withlacoochee River
Lake Panasoffkee Lake Kissimmee Rodman Reserovir Lake Istokpoga Upper Myakka Lake Lake Seminole
y=5.14 * x0.662
R2=0.490
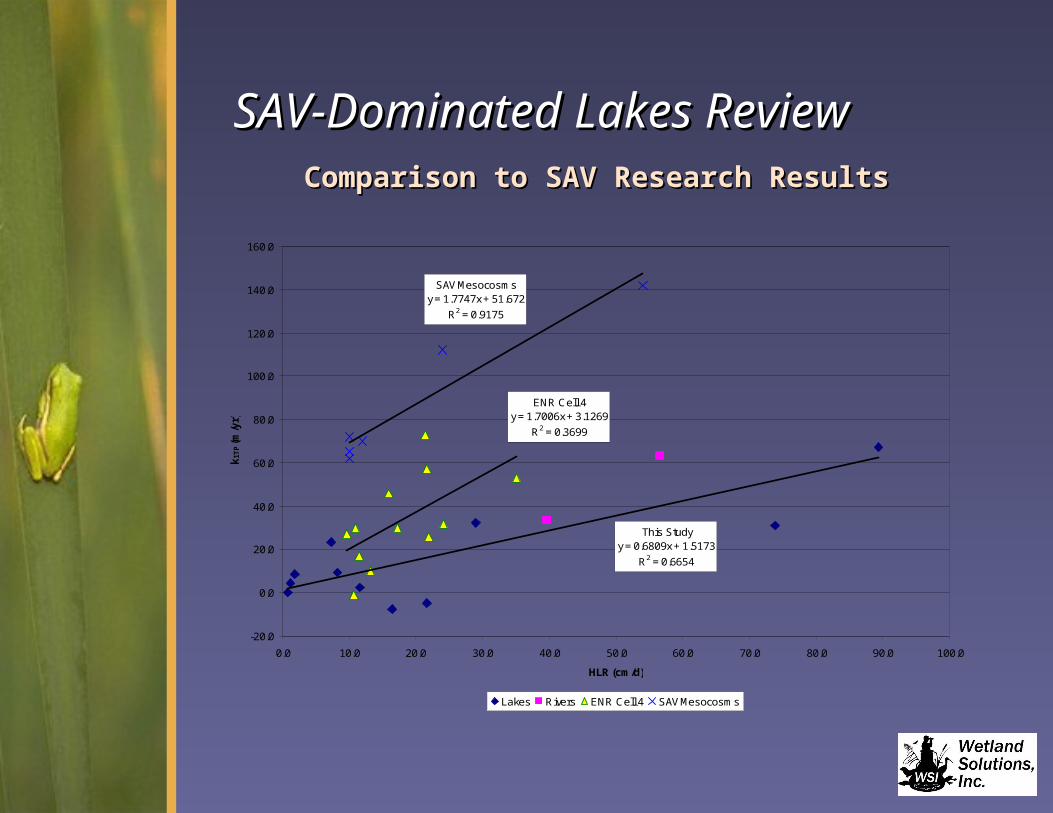
SAV-Dominated Lakes ReviewSAV-Dominated Lakes ReviewComparison to SAV Research ResultsComparison to SAV Research Results
ENR Cell 4y = 1.7006x + 3.1269
R2 = 0.3699
This Studyy = 0.6809x + 1.5173
R2 = 0.6654
SAV Mesocosmsy = 1.7747x + 51.672
R2 = 0.9175
-20.0
0.0
20.0
40.0
60.0
80.0
100.0
120.0
140.0
160.0
0.0 10.0 20.0 30.0 40.0 50.0 60.0 70.0 80.0 90.0 100.0
HLR (cm/d)
k1T
P (m
/yr)
Lakes Rivers ENR Cell 4 SAV Mesocosms

SAV-Dominated Lakes ReviewSAV-Dominated Lakes Review
Project ConclusionsProject Conclusions• SAV-dominated lakes and rivers do SAV-dominated lakes and rivers do
generally remove TP over the long termgenerally remove TP over the long term• This TP can be found in accreted This TP can be found in accreted
sedimentssediments• These TP removal rates are typically These TP removal rates are typically
higher than those found in emergent higher than those found in emergent macrophyte dominated wetlandsmacrophyte dominated wetlands
• TP removal rate constants in SAV-TP removal rate constants in SAV-dominated lakes, rivers, and wetlands dominated lakes, rivers, and wetlands are directly correlated to TP mass are directly correlated to TP mass loading rates (inlet flow and loading rates (inlet flow and concentration)concentration)

SAV-Dominated Lakes ReviewSAV-Dominated Lakes Review
Project Conclusions (cont.)Project Conclusions (cont.)• TP removal rates estimated from TP removal rates estimated from
Florida SAV-dominated lakes and Florida SAV-dominated lakes and rivers overlapped those rivers overlapped those measured at SAV experimental measured at SAV experimental systems but were generally lowersystems but were generally lower
• For this reason it was For this reason it was recommended that TP removal recommended that TP removal rates from relatively short term rates from relatively short term or small scale SAV studies be or small scale SAV studies be used with cautionused with caution
Assessment of Assessment of Reservoir Water Reservoir Water Quality Quality
DMSTA DMSTA Calibration Calibration for the for the Lake Lake OkeechobeOkeechobee e Watershed Watershed (LOW)(LOW)

DMSTA Calibration for LOWDMSTA Calibration for LOW
GoalsGoals• DMSTA was developed and DMSTA was developed and
calibrated for STAs south of Lake calibrated for STAs south of Lake Okeechobee (LO)Okeechobee (LO)
• Need to confirm usefulness north Need to confirm usefulness north of the lakeof the lake
• Collected empirical data sets for Collected empirical data sets for lakes and for treatment wetlands lakes and for treatment wetlands north of LOnorth of LO
• Focus was on phosphorus but Focus was on phosphorus but other data collectedother data collected

DMSTA Calibration for LOWDMSTA Calibration for LOWFlorida Lakes and Treatment Florida Lakes and Treatment
WetlandsWetlands
Lake Harney
Titusville
Lakeland
Boney Marsh
Lake Okeechobee
Lake Poinsett
Orlando Easterly Wetlands
LakeSawgrass
Lake Hell'n Blazes
Lake Istokpoga
LEGEND
Treatment Wetland
Lake/Reservoir
Lake Okeechobee Watershed Boundary
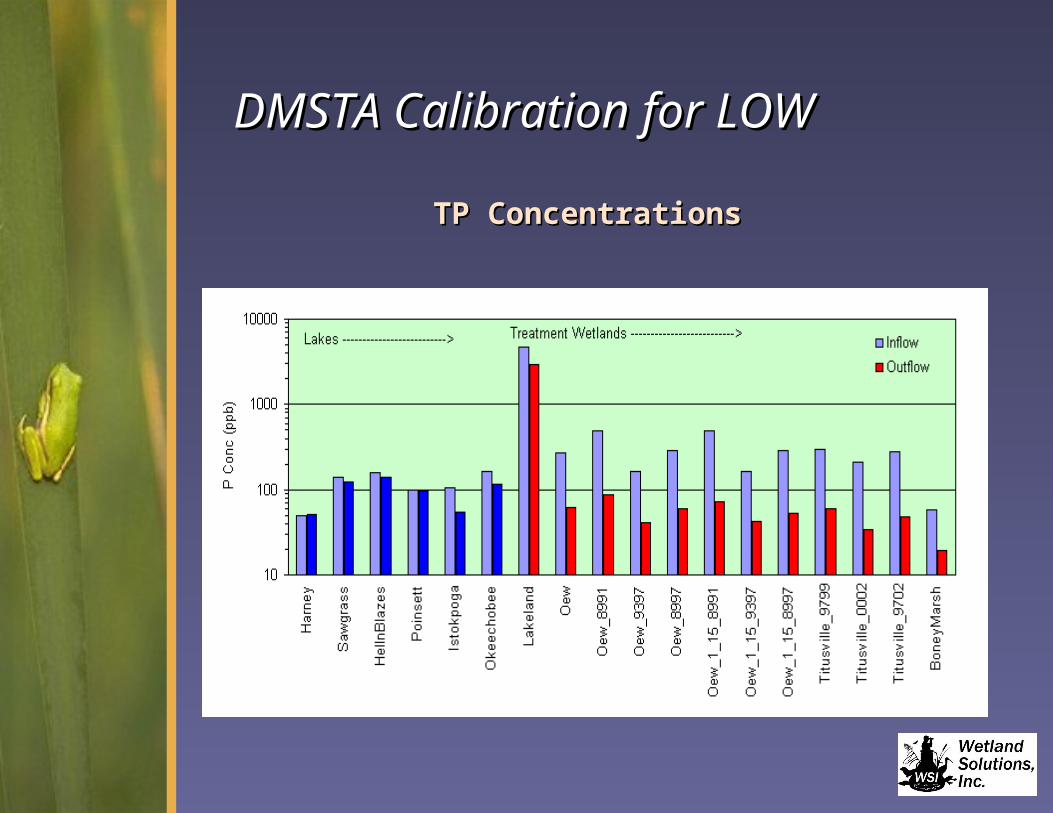
DMSTA Calibration for LOWDMSTA Calibration for LOW
TP ConcentrationsTP Concentrations
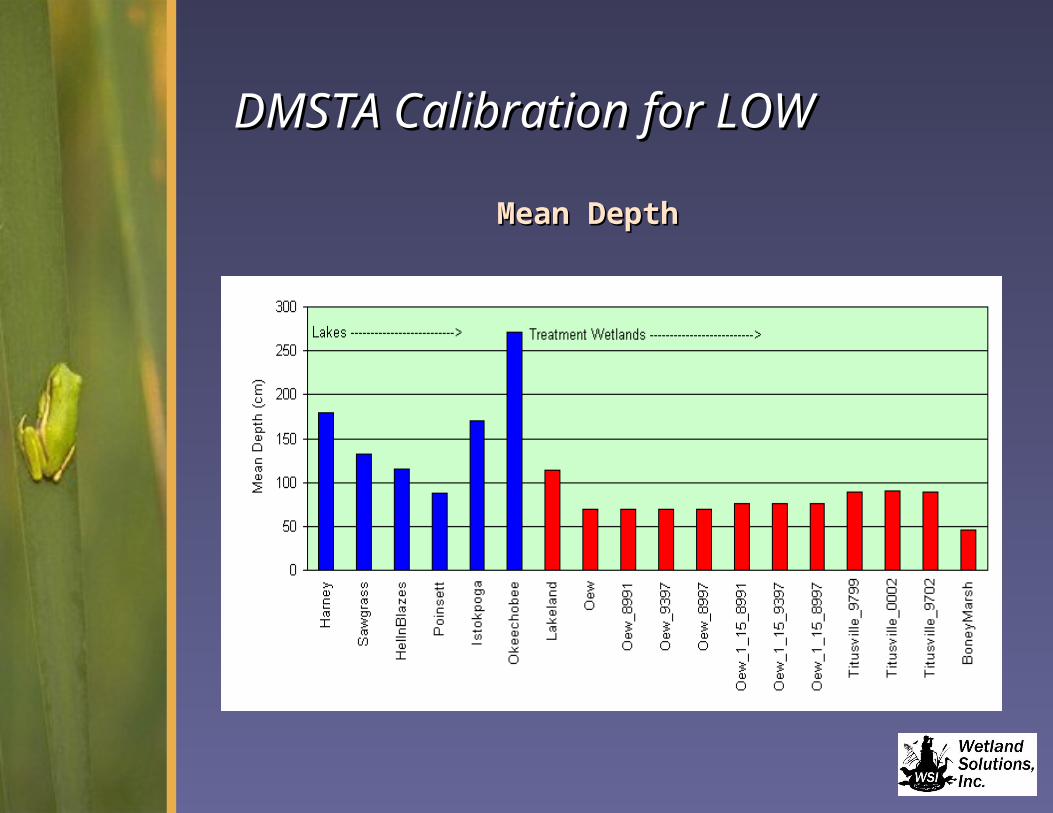
DMSTA Calibration for LOWDMSTA Calibration for LOW
Mean DepthMean Depth
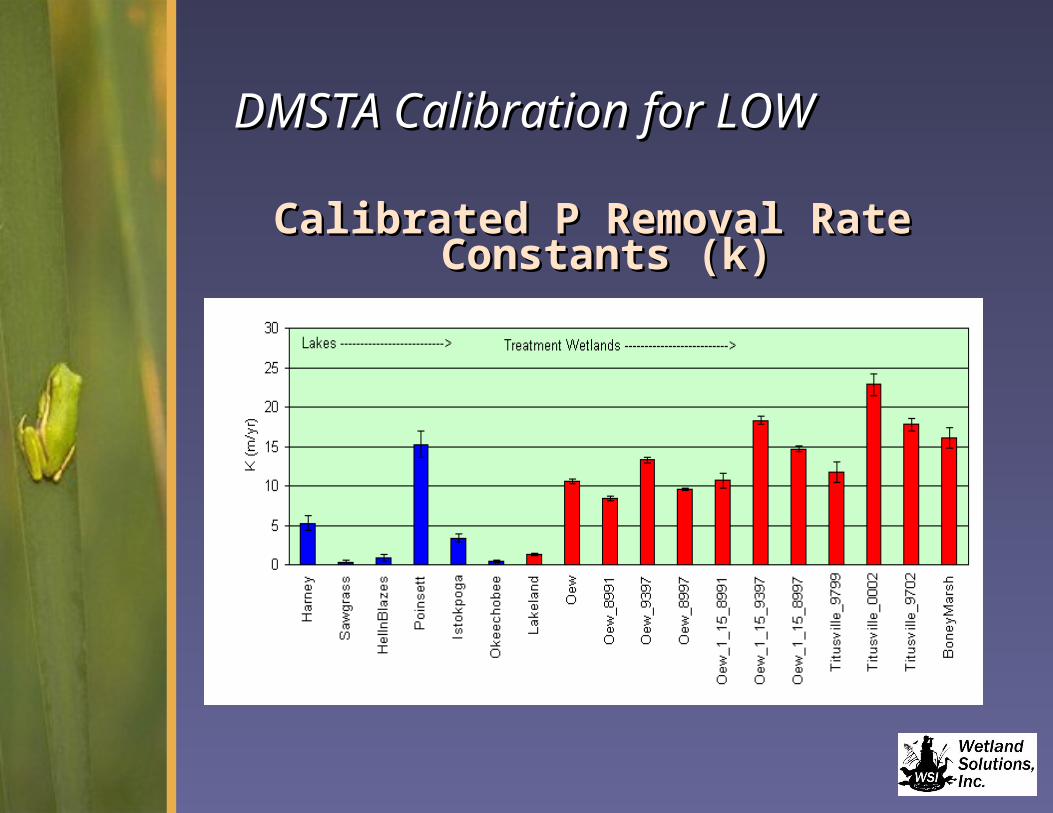
DMSTA Calibration for LOWDMSTA Calibration for LOW
Calibrated P Removal Rate Calibrated P Removal Rate Constants (k)Constants (k)
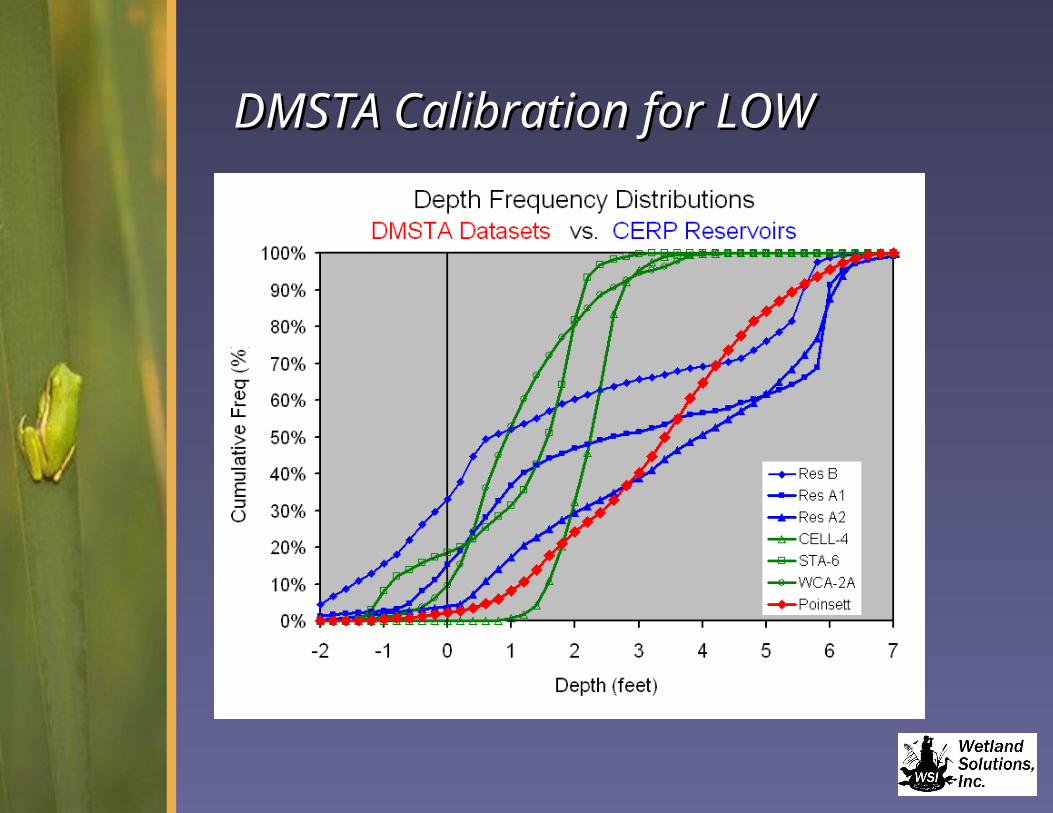
DMSTA Calibration for LOWDMSTA Calibration for LOW

DMSTA Calibration for LOWDMSTA Calibration for LOW
ConclusionsConclusions
• Calibrated k values were within Calibrated k values were within the same range as other STAs the same range as other STAs calibrated with DMSTA. This calibrated with DMSTA. This suggests that existing DMSTA suggests that existing DMSTA STA calibration parameters can STA calibration parameters can be used for performance be used for performance estimates north of Lake estimates north of Lake Okeechobee for inflow TP Okeechobee for inflow TP concentrations as high as 300 ppbconcentrations as high as 300 ppb
DMSTA Calibration for LOWDMSTA Calibration for LOW
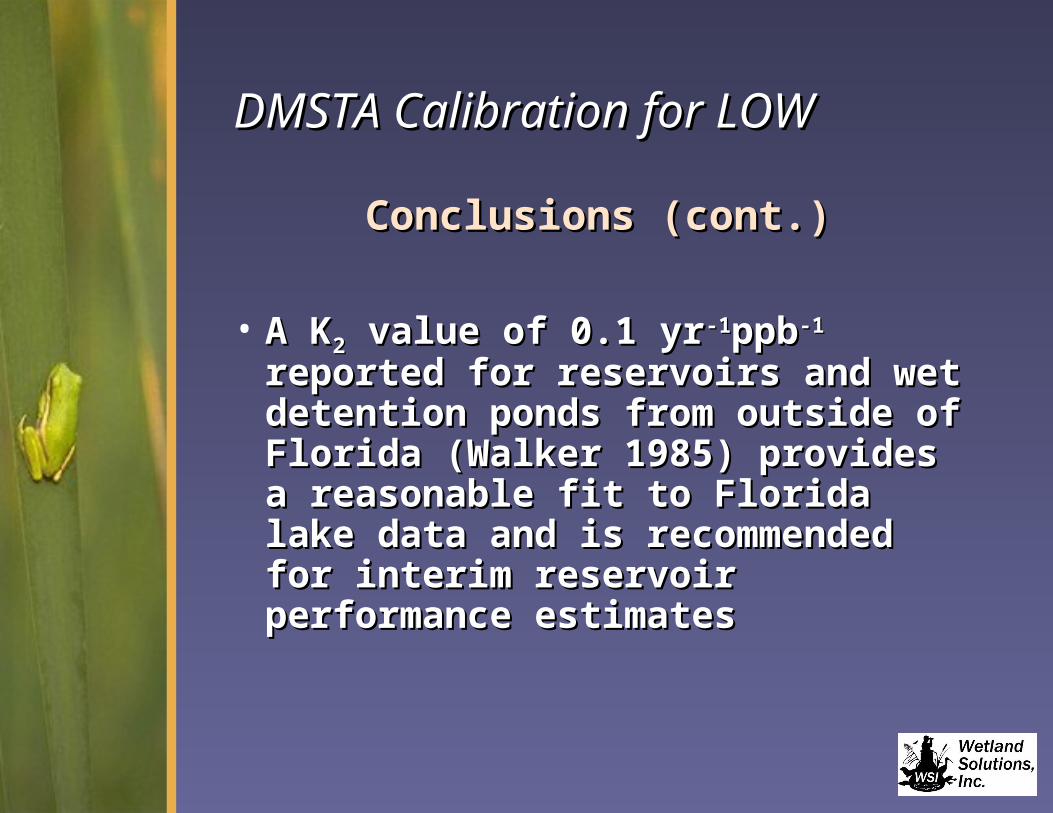
Conclusions (cont.)Conclusions (cont.)
• With the exception of Lake With the exception of Lake Poinsett (k = 15 m/yr) the Poinsett (k = 15 m/yr) the lakes have calibrated P lakes have calibrated P removal rate constants removal rate constants below the emergent marsh below the emergent marsh treatment wetlandstreatment wetlands

DMSTA Calibration for LOWDMSTA Calibration for LOW
Conclusions (cont.)Conclusions (cont.)
• The reservoir component of the The reservoir component of the DMSTA model provides a better DMSTA model provides a better fit to the Florida lake data than to fit to the Florida lake data than to the wetland datathe wetland data
• With one possible exception, the With one possible exception, the lake data were of limited use for lake data were of limited use for calibration since they have high calibration since they have high hydraulic loading rates, reducing hydraulic loading rates, reducing sensitivity to the second-order sensitivity to the second-order rate constant (Krate constant (K22) in the reservoir ) in the reservoir modelmodel
DMSTA Calibration for LOWDMSTA Calibration for LOW
Conclusions (cont.)Conclusions (cont.)
• A KA K22 value of 0.1 yr value of 0.1 yr-1-1ppbppb-1-1 reported for reservoirs and wet reported for reservoirs and wet detention ponds from outside detention ponds from outside of Florida (Walker 1985) of Florida (Walker 1985) provides a reasonable fit to provides a reasonable fit to Florida lake data and is Florida lake data and is recommended for interim recommended for interim reservoir performance reservoir performance estimatesestimates
Assessment of Assessment of Reservoir Water Reservoir Water QualityQuality
Florida Lake Florida Lake and and Reservoir Reservoir Database Database Analysis for Analysis for US Army US Army Corps of Corps of EngineersEngineers

Florida Lake and Reservoir Florida Lake and Reservoir Water Quality Database Water Quality Database AnalysisAnalysis
TasksTasks• Water Quality Impacts of Reservoirs Water Quality Impacts of Reservoirs
Database augmented with previously-Database augmented with previously-collected data setscollected data sets
• Analyzed for EAA Reservoir project to Analyzed for EAA Reservoir project to estimate reservoir water qualityestimate reservoir water quality
• Developed probability frequency curves Developed probability frequency curves for 14 important water quality for 14 important water quality parametersparameters
• Developed regressions between inflow Developed regressions between inflow and outflow concentrationsand outflow concentrations
• Developed regressions between inflow Developed regressions between inflow loads and outflow concentrationsloads and outflow concentrations

Florida Lake and Reservoir Florida Lake and Reservoir Water Quality Database Water Quality Database AnalysisAnalysis
PRELIMINARY DRAFT September 2004
COMPREHENSIVE EVERGLADES RESTORATION PLAN CENTRAL AND SOUTHERN FLORIDA PROJECT
A. ALTERNATIVE PLAN FORMULATION AND EVALUATION A.1 WATER QUALITY ASSESSMENT
REPORT EVERGLADES AGRICULTURAL AREA STORAGE RESERVOIRS – PHASE 1
US Army Corps of Engineers South Florida Water Jacksonville District Management District
Assisted By:
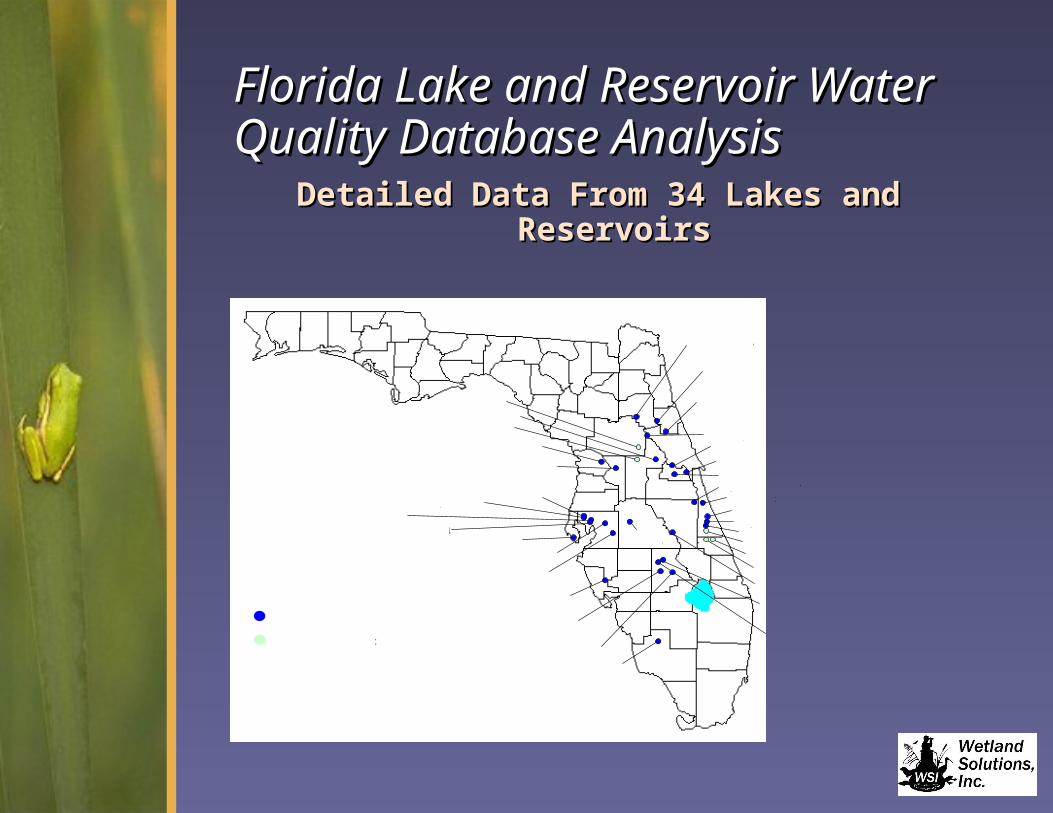
Florida Lake and Reservoir Florida Lake and Reservoir Water Quality Database Water Quality Database AnalysisAnalysisDetailed Data From 34 Lakes and ReservoirsDetailed Data From 34 Lakes and Reservoirs
LEGEND
Lake/Resrvoir
Shallow Impoundment
Lake Trafford
Lake Istokpoga
Lake Josephine
Lake Sebring
LakeParker
Lake Thonotosassa
Upper Myakka Lake
Lake Seminole
Bonnet Lake
Medard ParkReservoir
Lake Disston
Crescent Lake
Rodman Reservoir
Lake Harney
Lake Jessup
Lake Monroe
Lake George
Lake Norris
Lake Tsala Apopka
Lake Panasoffkee
Lake CalmKeystone Lake
Lake Carroll
Lake Magdalene
Taylor Creek Reservoir
Lake Kissimmee
Lake Hellen Blazes
Sawgrass Lake
Lake Poinsett
Lake Washington
Emeralda Marsh Conservation Area
Sunnyhill Farm
Kenansville Lake
St. John's Water Management Area
St. John's Marsh Conservation Area
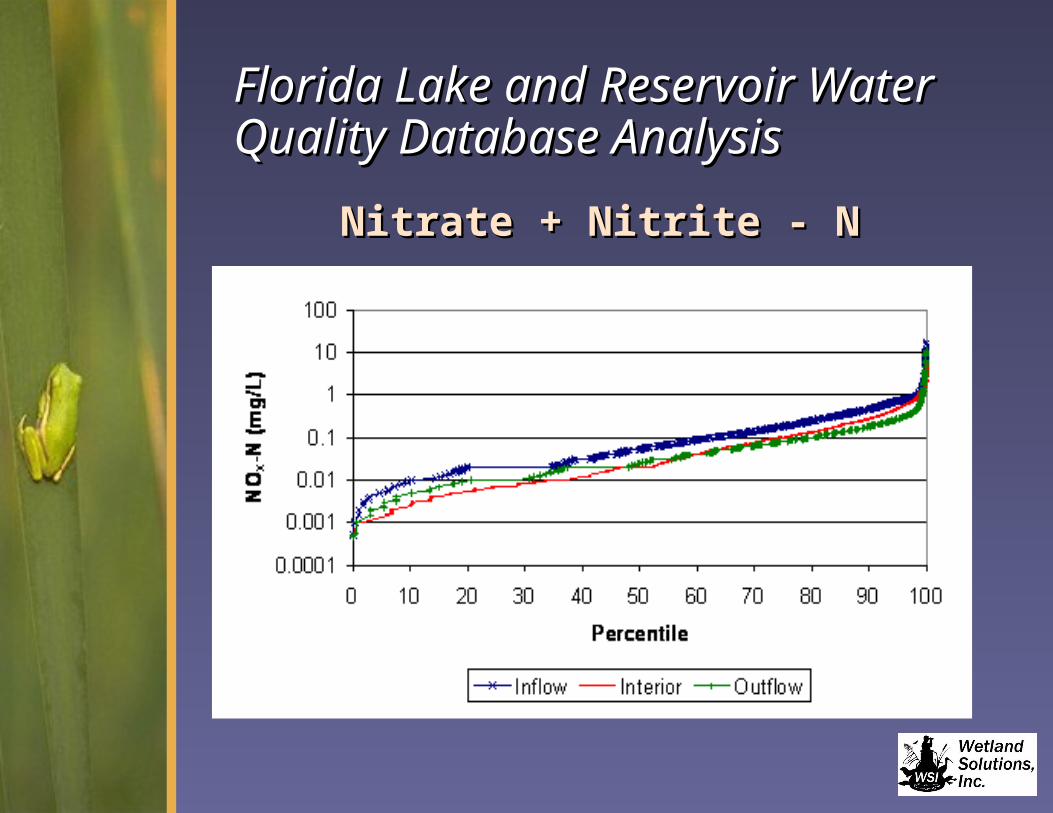
Florida Lake and Reservoir Florida Lake and Reservoir Water Quality Database Water Quality Database AnalysisAnalysis
Nitrate + Nitrite - NNitrate + Nitrite - N

Florida Lake and Reservoir Florida Lake and Reservoir Water Quality Database Water Quality Database AnalysisAnalysis
Dissolved OxygenDissolved Oxygen

Florida Lake and Reservoir Florida Lake and Reservoir Water Quality Database Water Quality Database AnalysisAnalysis
Total Dissolved PTotal Dissolved P
Florida Lake and Reservoir Florida Lake and Reservoir Water Quality Database Water Quality Database AnalysisAnalysis
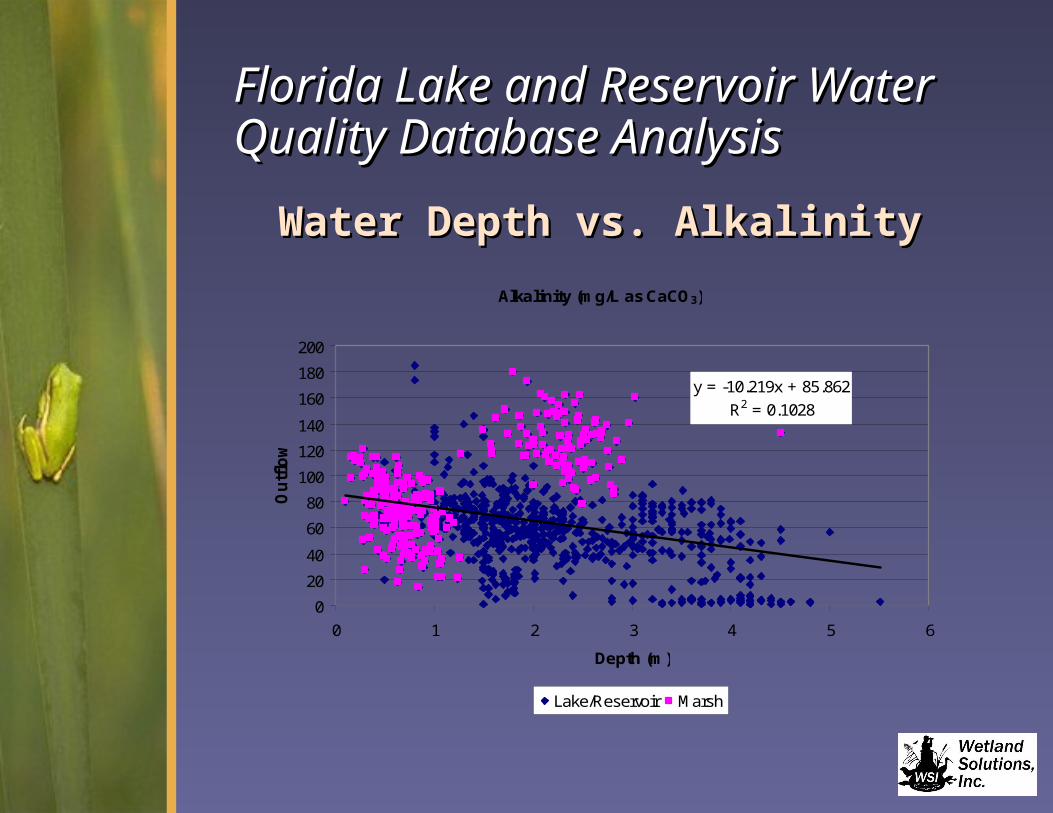
Water Depth vs. AlkalinityWater Depth vs. Alkalinity
Alkalinity (mg/L as CaCO3)
y = -10.219x + 85.862
R2 = 0.1028
0
20
40
60
80
100
120
140
160
180
200
0 1 2 3 4 5 6
Depth (m)
Ou
tflo
w
Lake/Reservoir Marsh
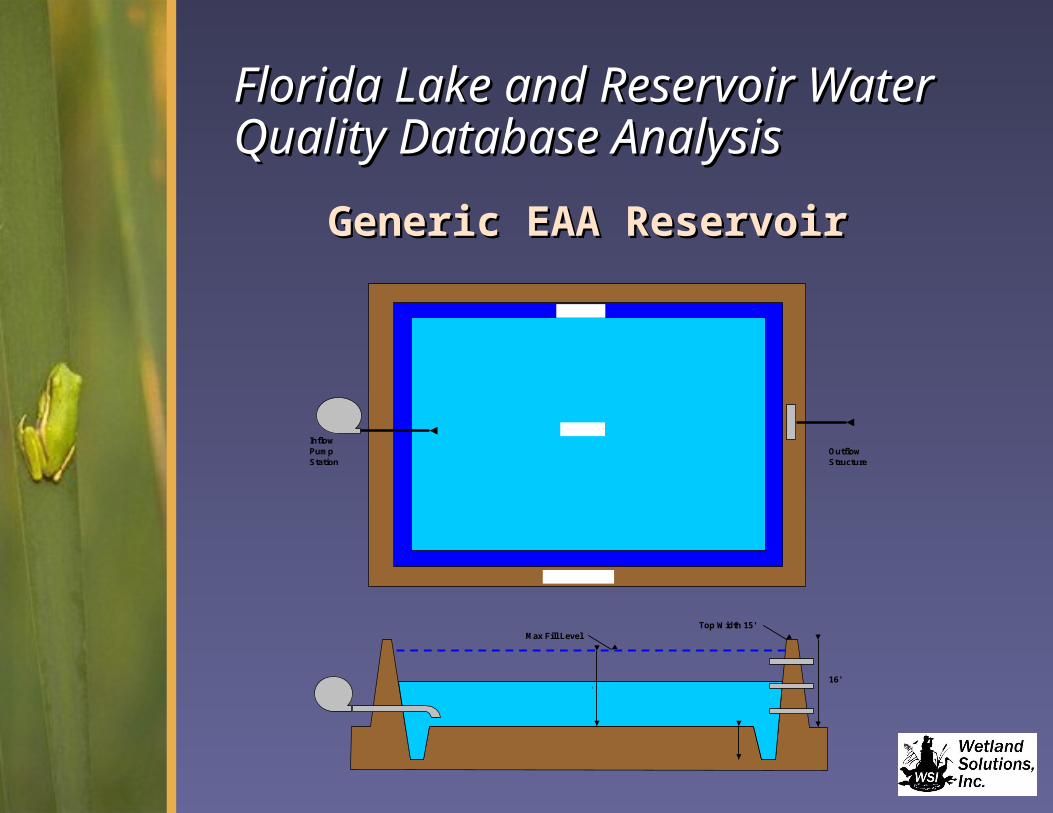
Florida Lake and Reservoir Florida Lake and Reservoir Water Quality Database Water Quality Database AnalysisAnalysis
Inflow PumpStation
OutflowStructure
Top Width 15'Max Fill Level
16'
Perimeter Levee
Deep Zone
Reservoir
3-4'
12'
Generic EAA Reservoir Generic EAA Reservoir

Florida Lake and Reservoir Florida Lake and Reservoir Water Quality Database Water Quality Database AnalysisAnalysis
EAA Reservoir Performance EstimatesEAA Reservoir Performance Estimates(estimated for USACOE PIR)(estimated for USACOE PIR)

Research NeedsResearch Needs• Additional Reservoir Additional Reservoir
Water Quality DatasetsWater Quality Datasets• Ten Mile Creek WPA Ten Mile Creek WPA
Startup and Operational Startup and Operational MonitoringMonitoring
• Dynamic Modeling for All Dynamic Modeling for All Key Water Quality Key Water Quality ParametersParameters
Water Quality in South Florida Reservoirs Water Quality in South Florida Reservoirs
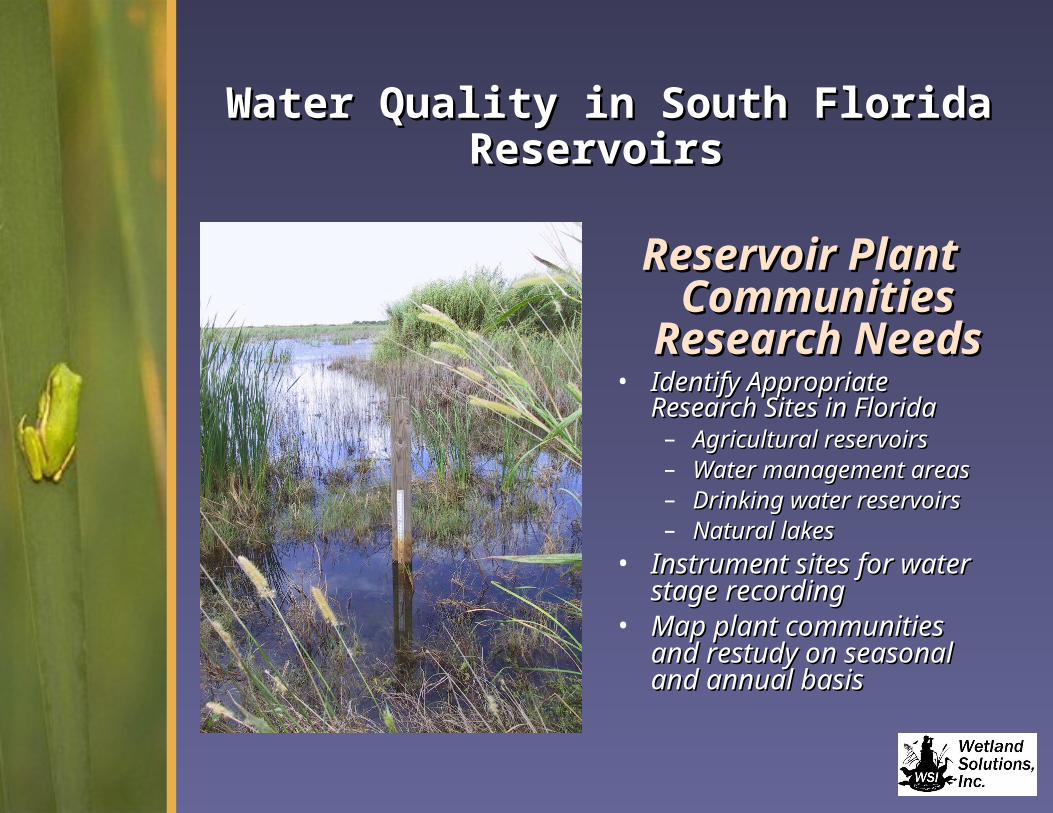
Reservoir Plant Reservoir Plant Communities Communities
Research NeedsResearch Needs• Identify Appropriate Research Identify Appropriate Research
Sites in FloridaSites in Florida– Agricultural reservoirsAgricultural reservoirs– Water management areasWater management areas– Drinking water reservoirsDrinking water reservoirs– Natural lakesNatural lakes
• Instrument sites for water stage Instrument sites for water stage recordingrecording
• Map plant communities and Map plant communities and restudy on seasonal and annual restudy on seasonal and annual basisbasis
Water Quality in South Florida Reservoirs Water Quality in South Florida Reservoirs

Reservoir Wildlife Reservoir Wildlife Usage Research Usage Research
NeedsNeeds• Organize citizen bird census Organize citizen bird census
teams for various reservoirsteams for various reservoirs• Conduct fisheries studiesConduct fisheries studies• Inventory other food chain Inventory other food chain
trophic levels trophic levels (macroinvertebrates, (macroinvertebrates, amphibians,reptiles, and amphibians,reptiles, and small mammals)small mammals)
Water Quality in South Florida Reservoirs Water Quality in South Florida Reservoirs
DiscussionDiscussion
Water Quality in South Florida Reservoirs Water Quality in South Florida Reservoirs