assessing the sodium content of foods in the emergency
TRANSCRIPT

1
Assessing the Sodium Content of Foods in the Emergency Food System
Sarah Craven
A thesis submitted in partial fulfillment of the requirements for the degree of
Master in Public Health
University of Washington
2017
Committee:
Jessica Jones-Smith
Emilee Quinn
Program Authorized to Offer Degree:
Nutritional Sciences

2
© Copyright 2017
Sarah Craven

3
University of Washington
Abstract
Assessing the Sodium Content of Foods in the Emergency Food System
Sarah Craven
Chair of the Supervisory Committee:
Professor Jessica Jones-Smith
Nutritional Sciences
Background:
The emergency food system is an increasingly important source of food for food insecure
households. Meanwhile, there is growing concern among food banks, food bank clients, and public
health officials in regard to the quality of foods offered in food banks and whether they support
the dietary needs of low-income populations. As agencies begin to implement interventions to
improve the healthfulness of food bank offerings by targeting specific nutrients of concern, such
as added sugar or sodium, a method of evaluation is required to properly assess the impact of these
strategies. However, previous efforts to characterize the overall nutrition profile of foods
distributed by the emergency food system have not focused specifically on nutrients of concern,
thereby limiting the ability of food bank directors and policymakers to evaluate implemented
actions.

4
Objective:
The purpose of this project was to develop and pilot test a methodology to assess the sodium
content of food bank offerings. This project was driven by the need to facilitate baseline and
ongoing data collection to assess the impacts of a CDC sodium reduction intervention in the
emergency food system.
Methods:
The data collection team visited several food banks in King County, Washington in order to
explore the barriers and opportunities for a methodology that could be used to capture the amount
of sodium in food bank offerings. This methodology was pilot tested at the Des Moines Area Food
Bank in King County, WA on January, 13, 2017. The food bank organizes similar food items into
“bins” and specifies the number of items clients can take from each bin based on their household
size. We assessed the mean sodium content in several bin categories per serving and 100kcals. In
addition, we calculated the mean amount of sodium distributed per client visit from each bin.
Finally, we assessed the smallest change in sodium (mg) needed to detect a difference from mean
sodium per serving at follow-up visits by calculating the minimum detectable effect size.
Results:
The information for 306 unique items (n=1,395 total) were recorded and analyzed. Fresh prepared
meals (e.g. individually packaged sandwiches, salads, etc.) had the highest mean sodium per
serving, followed by boxed meals, canned soup/beans, tomato products, and pastry. There was
little overlap in the bin categories with highest mean sodium per 100kcals with tomato products
being the highest, followed by mixed canned vegetables, canned soup/beans, canned meats, and

5
boxed meals. The standard deviation of both mean sodium per serving and mean sodium per
100kcals indicates a considerable variation in the sodium content of inventoried items in the
majority of bin categories. The mean daily sodium contribution from analyzed bin categories was
estimated to be 2630mg for a small household, 1937mg for a medium household, and 1937mg for
a large household. The percent change in mean sodium per serving needed to obtain a meaningful
difference at follow-up ranged from 5-70.7% for bin categories. However, for the top five bin
categories with highest mean sodium per serving (fresh prepared meals, boxed meals, canned
soup/beans, tomato products, and pastry), 22.3% was the largest percent change needed.
Conclusion:
Prior efforts to reduce sodium in a variety of settings achieved reductions of 20-30%.7 This
evidence, combined with our results for the required percent change in mean sodium per serving,
suggests that it is feasible to implement strategies with a measurable impact in the food bank
setting, particularly by focusing on the bin categories with highest mean sodium per serving.
Overall, this study contributes novel data on the sodium content of food bank offerings as well as
perspectives on the feasibility of data collection in this venue. However, the methodology and pilot
test that were developed and conducted in this study have some potential limitations in regard to
generalizability. Data collection took place during a single shift, which prevented us from
determining how food bank offerings may change across weeks or seasons. In addition, we
excluded some bin categories due to feasibility reasons. Future evaluation efforts should work to
strengthen this methodology by conducting repeat assessments to determine variation in food item
distribution over days, weeks, months, and seasons. Furthermore, it would be useful to assess the
differences in feasibility that may arise when applying this methodology in other food banks.

6
Introduction
Current levels of dietary sodium intake in the United States are alarming. The average
American consumes over 3,400mg of sodium per day, which far exceeds the 2,300mg limit
recommended in the 2015-2020 Dietary Guidelines for Americans.1 In large part, this is due to the
overabundance of sodium in the food supply in the form of restaurant meals and processed foods.2
The relationship between high sodium intake and increased risk of hypertension, coronary heart
disease, and related cardiovascular disorders has been subject to debate, though several meta-
analyses and cohort studies have provided strong evidence in support of this association in recent
years.3-5
Furthermore, there is evidence to suggest that public health efforts to reduce sodium
consumption are effective and have been associated with a decreased risk of cardiovascular-related
conditions at a population level. One notable example was the United Kingdom’s sodium reduction
intervention which began in 2003 and involved establishing lower sodium targets in several food
categories for the food industry, working with companies to reformulate their products to meet the
targets, and launching an educational campaign regarding nutrition labels for consumers.6 From
2003-2011, urinary sodium levels in the nationally-representative study cohort decreased by 15%,
which was a statistically significant decrease.6 In addition, results from the Health Survey for
England in the same time period showed a significant decrease in both systolic and diastolic blood
pressure, as well as stroke mortality (42% reduction) and ischemic heart disease mortality (40%
reduction) after adjusting for age, sex, ethnicity, income, education, alcohol consumption, and
BMI.5 While a significant decrease in smoking prevalence and increase in fruit and vegetable
consumption was also observed, it is unlikely that these factors alone accounted for the
improvements in blood pressure, stroke mortality, and ischemic heart disease mortality among the

7
study population given the evidence from prior interventions. For example, in the 1960s, a
population-wide campaign in Japan decreased sodium intake by 4 g/day. A significant decrease in
blood pressure and an 80% reduction in stroke mortality also occurred in the years following the
campaign despite increases in fat intake, smoking, obesity, and alcohol consumption among the
population.6 As such, the extent to which sodium reduction contributed to England’s health
improvements in comparison to other factors is unclear, but it can be reasonably concluded that
sodium reduction is an effective strategy for reducing the risk of cardiovascular-related conditions
at the population level.
In the United States, the Centers for Disease Control and Prevention’s (CDC) Sodium
Reduction in Communities Program offers grant funding for community and population-based
efforts aimed at reducing the sodium content of foods offered in several venues, such as schools,
hospitals, government worksites, prisons, senior meal services, restaurants, and the emergency
food system.7 Many of these implemented strategies focus on food insecure populations, as food
insecurity is associated with lower diet quality and cardiovascular health when compared to food
secure populations.8,9 Fourteen percent of the United States population was food insecure in 2014
and this number continues to rise, increasing demand on federal food assistance programs and the
emergency food system, including food banks and food pantries.10
The number of individuals seeking aid from food pantries is now 1 in 7 people in the U.S.
and while it was once typical for food insecure individuals to visit food pantries only on occasion,
it has been demonstrated that many are increasingly visiting food pantries in a “chronic” pattern.11
Prior research has also suggested that many offerings distributed by the emergency food system
are energy-dense, processed foods high in sodium, added sugar, and trans-fat.11 As such, public
health professionals and food bank staff are turning an increasing focus on improving the

8
availability of healthy foods in this setting. This introduces a need for evaluation of the nutritional
quality of foods in the emergency food system in a way that will properly quantify the impact of
these initiatives on nutrients of concern such as sodium.
Prior Research
One of the earliest efforts to assess the broader food environment in food banks involved
sorting and weighing foods in MyPyramid food groups in order to determine if food bank offerings
are sufficient to meet a client’s recommended intake from each group.12 A more recent attempt at
answering this question featured a similar methodology, but reflected MyPlate food groups rather
than MyPyramid.13 The methodologies employed in these studies were the first to provide a
general picture of food bank offerings in rough categories and could be useful for food banks in
determining where their inventories may be lacking. However, they had little relevance in terms
of determining specific nutritional content of a food bank’s offerings given their focus on broad
food groups rather than specific food items.12,13
Further studies attempted to focus more specifically on the nutritional content of food bank
offerings by utilizing scoring systems. The first was the Choose Healthy Options Program (CHOP)
ranking system, which utilizes formulas embedded in an Excel spreadsheet to assign a food item
a score of 1, 2, or 3 (choose frequently, choose moderately, or choose sparingly, respectively).
This method relies on manual entry into the spreadsheet for seven positive nutrients (iron, fiber,
calcium, folate, vitamins A, C, and D) and four negative nutrients (saturated fat, cholesterol,
sodium, added sugars) found on food item nutrition labels. While this method allows for tracking
of the sodium content in specific items, it is for the purpose of creating an aggregate score for a
food item based upon all of the nutrients collected. Considering that the CHOP spreadsheet is not
9
connected to a nutrient database, this route offers no advantage over manual collection of sodium
content.14
Another scoring system that was implemented in the food bank setting is the Healthy
Eating Index 2010, which aims to describe the healthfulness of a food bank’s total offerings on a
scale from 0-100 and includes a sodium component score ranging from 0-10. However, this
method relies on analysis of food pantry purchasing records and provides no insight into how one
might also capture donated food items which may make up the majority of food bank offerings. A
similar scoring system termed the Hunger Relief Nutrition Index was later developed, which
utilizes product weight for the basis of normalization rather than calories (as the Healthy Eating
Index does). This allows for data collection that consists simply of sorting foods into designated
categories and weighing them.16 However, both of these scoring systems focus only on providing
an aggregate sodium score for total food bank offerings and do not differentiate sodium content
between particular food groups or items.15,16
Literature Gap and Project Aim
While there are some attempts to quantify the nutritional quality food distributed by the
emergency food system in the available literature, none provide a methodology that might be
adapted to collect data on the sodium content of food groups or specific food items. Nor do they
identify methods that could capture both purchase and donated foods. This limits the ability of
food bank directors and policymakers to evaluate implemented actions aimed at reducing
particular nutrients of concern, such as sodium. As such, the goal of this thesis project was to
develop and pilot test a methodology to assess the sodium content of food bank offerings. The
necessity of this project arose from a need to facilitate baseline and ongoing data collection to

10
assess the impacts of a CDC sodium reduction intervention in multiple food banks in King County,
Washington.
After completing a literature review, the research team visited several food banks and
pantries in King County in order to gain insight into the potential challenges and opportunities for
evaluation in this setting. It quickly became apparent that the most notable challenge to developing
a methodology for evaluation is the variation that exists in this setting on multiple levels. Examples
of this include:
1. Variation in foods received
Food banks and food pantries receive foods from a variety of sources such as government
commodity programs, food drives, grocery stores, restaurants, and other community partners in
addition to making purchases (typically through wholesale outlets and programs). As such, there
is significant variation in the types of food items received as well as their quantities and packages
sizes. The volume of foods distributed can also vary between the beginning and end of the month,
in summer versus winter months because of changing availability of fresh produce, and around the
holiday season. There are also logistical barriers to data collection such as inconsistent availability
of bar codes and nutrition information on food packaging.
2. Variation between food banks
Food banks vary from one another in terms of the sources of donated foods, the number of
days and times that they are open or allow clients to visit, and the format through which they
distribute foods. For example, some food pantries pre-bag foods for distribution, while others use
self-select models that allow clients to choose a certain number of items (typically determined by
household size) per food category. There are also models that are designed to resemble grocery
stores.
11
3. Lack of tracking
There is little tracking in terms of the quantity and type of food items that are procured
from each source, or when particular food items will be distributed. Most tracking is completed by
weighing donations as they arrive and assigning them to vague categories (e.g. canned and dry
foods, breads and pastry, produce, etc.) and the recording of donation source can range from
specific grocery stores to ‘church/community’ food drives. Overall, food banks can vary
considerably in the extent to which they track donations, though none featured records that went
beyond the detail of broad categories.
In order to develop a methodology that could be applied from food bank to food bank, each
of these factors were accounted for to the best of our ability. This novel methodology and pilot test
provides insight into one of the first attempts to quantify the specific nutritional content of foods
in the emergency food setting.
Methods
Study Setting
Data collection for this cross-sectional study was completed at the Des Moines Area Food
Bank in King County, WA in January, 2017. Des Moines Area Food Bank is an urban food bank
that distributes approximately 110,000 pounds of food to over 1,000 households in the city of Des
Moines, the majority of the city of SeaTac, and the South Hill neighborhood of Kent each month.17
The majority of this food is procured through donations from grocery stores, local businesses,
community and organization food drives, the USDA government commodity program (TEFAP),
and larger food bank distributers (Northwest Harvest). Des Moines Area Food Bank is open three
days per week for a three-hour service in the mornings and once a month in the evening. Clients

12
in the food bank service area are allowed to visit the main food line once a month. In addition,
there is a separate ‘bread room’ of bakery-style breads and produce items such as potatoes and
onions that clients can visit an unlimited amount of times. The food bank follows a self-select
model that allows clients to choose items they prefer as they walk through the main food line. Food
items from similar food categories are grouped into bins. Each bin is labeled with household
allotment numbers which determine the number of items clients can take from each bin as they
travel through the service line depending on their household size. Households are defined as small
(1-2 people), medium (3-5 people), and large (6-10 people).
Data Collection
Data collection took place on January 13, 2017 and was completed by a team of two
research coordinators, two employees of Des Moines Area Food Bank, one graduate student, and
one public health official. Two tracking sheets were developed to collect information about the
food bank and contents of bins. The first was completed prior to and at end of the shift and involved
a map of each bin and its respective category label, as well as the number of clients served during
that morning’s shift by household size. The second tracking sheet corresponded to specific bins
and included fields to describe the bin’s contents, household allotment numbers, and information
about specific food items in the bin: item name, brand name, type (low-sodium, light, etc.),
packaging type, amount, weight/unit, servings, calories per serving, sodium per serving, quantity
in the bin, and the presence of a barcode and nutrient label on packaging.
Data collectors arrived in the morning and took the inventory of the bins prior to the start
of the food bank shift. While we sought to represent the full scope of the food bank’s offerings,
there were feasibility issues that prevented all bins from being evaluated. Due to the limited amount
of time we had before the food bank opened, we prioritized data collection for bins we expected
13
to have high sodium based on existing data of high-sodium food categories.18,19 We excluded
produce, fresh meats from data collection because they often lack nutrition labels and are low in
sodium compared to other bin categories. Dry noodles, rice, and oats were also excluded because
they are low in sodium and the lacked variation (in most cases, these bins contained only one type
of item). In addition, we excluded juice, milk, hummus/cottage cheese/dips, canned juice, and
popcorn because we were not able to complete data collection before the start of the food bank
shift and the locations of these bins made data collection too disruptive during service. There were
other miscellaneous categories that were also excluded because of the wide variability of these
items. Finally, we excluded data collection of the ‘bread room’ due to its high variability and the
fact that clients can take unlimited quantities of items from this space throughout the month as
needed.
After these exclusions, data collection was completed for the following bin categories:
mixed snacks, mixed canned vegetables, tomato products, canned meat, canned soups and beans,
boxed meals, cheese, frozen meals, fresh prepared meals (e.g. individually-packaged sandwiches
and salads), sliced bread, pastry, dry goods, yogurt, mayo/dressings, canned fruit, and government
commodities (peanut butter, kidney beans, cereals, and nuts). The data collection team completed
an initial inventory of the items offered in each bin prior to the start of the food bank shift. When
the shift began, some bins were continually replenished and these items were added to the
inventory list for approximately the first hour of the shift. However, this was infeasible for all bins
and was not completed for the mixed snacks, yogurt, fresh prepared meals, and pastry bins. At the
end of the shift, the number of clients served by household size was recorded.

14
Analysis
The tracking sheets for each bin were compiled and entered into Excel. Missing values for
items lacking a nutrition label (n=32) were estimated using the USDA Food Composition
database20. For each bin category, mean sodium per serving, mean sodium per 100kcals, mean
sodium distributed per client visit, and the minimum detectable effect size were calculated.
Mean Sodium (mg) per Serving
For each bin, the mean and standard deviation of sodium per serving were calculated in
Excel by weighting sodium per serving for each food item by number of servings in the item and
by total quantity of the item in the bin. Serving size for each food item was defined by serving size
on the food package label, which are designed in accordance with the FDA reference amounts.21
Mean Sodium (mg) per 100kcals
For each bin, the mean and standard deviation of sodium per 100kals were calculated in
Excel by converting the ratio of sodium per serving and calories per serving into sodium per
100kcals for each item. A weighted mean of sodium per 100kcals for each bin was calculated by
accounting for the quantity of each item in the bin.
Mean sodium (mg) distributed per client visit
Mean sodium distributed per client visit was calculated in Excel. For each bin, a weighted
mean of sodium per item was calculated by taking an item’s quantity into account as in the analysis
methods described above. Assumptions used to approximate the amount of sodium that a client
would take home from each bin were based upon estimates from the Des Moines Area Food Bank
staff. For example, staff informed us that clients typically take the maximum household allotments
for all bin categories. We also assumed clients would visit once per month in adherence with the
food bank’s rules and that a client’s food would last 11 days based on estimates of 10-12 days by

15
the Des Moines Area Food Bank staff.17 For sliced bread, which can be taken in unlimited amounts,
staff estimated that clients typically take home 1, 2, or 3 loaves based on their household size.
Finally, we assumed the number of clients in each household size category were at the midpoint
of the ranges (1.5 for small households, 4 for medium, and 8 for large).
Minimum Detectable Effect Size
The minimum detectable effect size was calculated for each bin in Stata 14.2 and indicates
the smallest change in sodium (mg) needed to detect a difference from the mean sodium per serving
at follow-up visits with 80% power and alpha set to 0.05. We used a paired means t-test under the
assumption that some of the items would be similar on a return visit given that the food bank
regularly receives donations from similar sources. To gain a sense of how the minimum detectable
effect size would change based on how correlated the paired observations are, we tested a range
of correlation values (.1, .2, .3, and .4). It was also assumed that the standard deviation (variation
of items) and sample size would be approximately the same at follow-up visits. Dry goods (lentils)
and government commodity peanut butter and kidney beans were excluded from this analysis
because these bins had a standard deviation of 0.
Results
The information for 306 unique items (n=1,395 total) was recorded and analyzed. The
mean sodium (mg) per serving and per 100 kcals, each by food category, are presented in Table 1
below. In regard to mean sodium per serving, fresh prepared meals had the highest mean sodium
per serving, followed by boxed meals, canned soup/beans, tomato products, and pastry. There was
considerable overlap in the bin categories with greatest mean sodium per 100kcals with tomato
products being the highest, followed by mixed canned vegetables, canned soup/beans, canned

16
meats, and boxed meals. This is primarily due to the fact that sodium per 100kcals is a measure of
sodium density and does not reflect the typical amount (serving) consumed by an individual.
However, sodium per 100kcals could be a useful measure in identifying additional bin categories
that contribute high amounts of sodium to one’s diet.
Table 1: Mean Sodium (mg) per serving and 100kcals, by bin food category
Bin Category Mean Sodium [mg]
per Serving (s.d.) Mean Sodium [mg] per
100kcals (s.d.)
Number of Items
(n= 1395)
Fresh, Prepared Meals 1 1138 (593) 6 312 (117) 48
Boxed Meals 2 719 (192) 5 372 (111) 184
Canned Soup, Beans 3 506 (269) 3 838 (1593) 164
Tomato Products 4 294 (134) 1 990 (685) 75
Pastry 5 265 (181) 13 96 (68.3) 67
Canned Meats 6 254 (174) 4 487 (517) 115
Mixed Canned Vegetables 7 216 (119) 2 946 (819) 113
Frozen Meals 8 204 (149) 7 214 (296) 9
Sliced Bread 9 182 (53.7) 9 175 (44.3) 78
Cheese (B2) 10 172 (22.0) 8 180 (57.9) 30
Gov. Comm.- kidney beans 11 140 (0.0) 11 140 (0.0) 69
Mixed Snacks 12 122 (56.1) 12 119 (52.2) 38
Cheese (B1) 13 119 (62.1) 10 161 (66.7) 125
Gov. Comm. - cereal 14 97 (105.6) 16 77 (96.6) 37
Yogurt 15 96 (46.7) 15 83 (37.1) 31
Mayo, Dressings 16 87 (16.5) 14 87 (16.7) 50
Gov. Comm. - peanut butter 17 65 (0.0) 19 36 (0.0) 56
Gov. Comm. - nuts 18 55 (87.8) 17 55 (83.7) 33
Canned Fruit 19 28 (17.8) 18 51 (25.1) 55
Dry Goods (lentils) 20 5 (0.0) 20 7 (0.0) 18
The standard deviation of both mean sodium per serving and mean sodium per 100kcals
indicates a considerable variation in the sodium content of inventoried items in the majority of bin
categories. For example, the mean sodium per 100kcals for canned soup and beans was 838mg
with a standard deviation of 1593mg due the variety of brands and types (i.e. ‘low-sodium’, ‘light’,
etc.) of items in this bin. For the bin categories in which the standard deviation was zero (dry goods

17
[lentils], as well as government commodity kidney beans and peanut butter), it was because only
one unique item was available in the bin.
The distribution of client household size on the day of data collection is described in Figure
1. Small households of 1-2 people were most common (47.5%), followed by medium (3-5 people)
and large household sizes (6-10 people).
Figure 1: Household size distribution (n=61)
As described above, the mean daily sodium contribution from these bins at Des Moines
Area Food Bank was based on one client visit per month, the midpoint number of clients per
household for each household size tier, clients taking the maximum allotment values for these bins,
and that the food would last them approximately 11 days. The mean daily sodium contribution by
household size was calculated for each bin (Table 2). The bins contributing the most sodium per
day were pastry, tomato products, fresh prepared meals, sliced bread, and mixed snacks. These bin
categories are slightly different from those with the highest mean sodium per serving because it is
based upon the amount of sodium in the total item. Additionally, it incorporated household
allotment values, which varied by bin category. The total daily sodium contribution from these bin
47.5%
34.4%
18.0%
Small (1-2) Medium (3-5) Large (6-10)
18
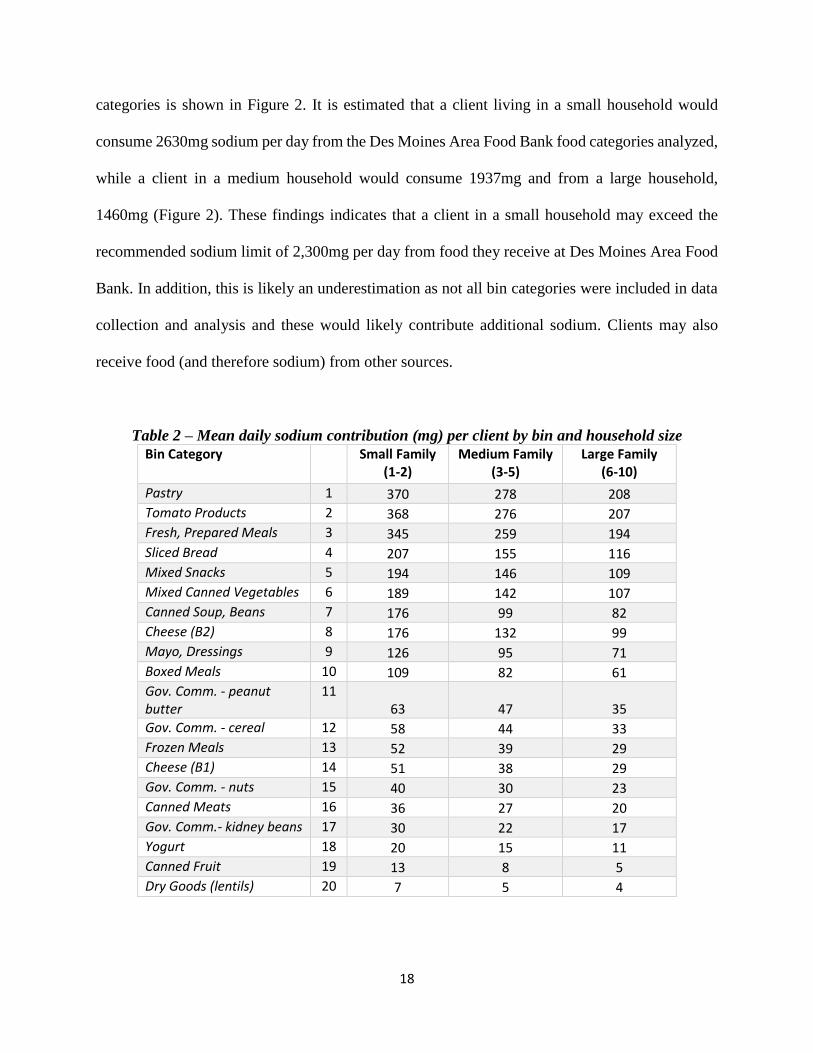
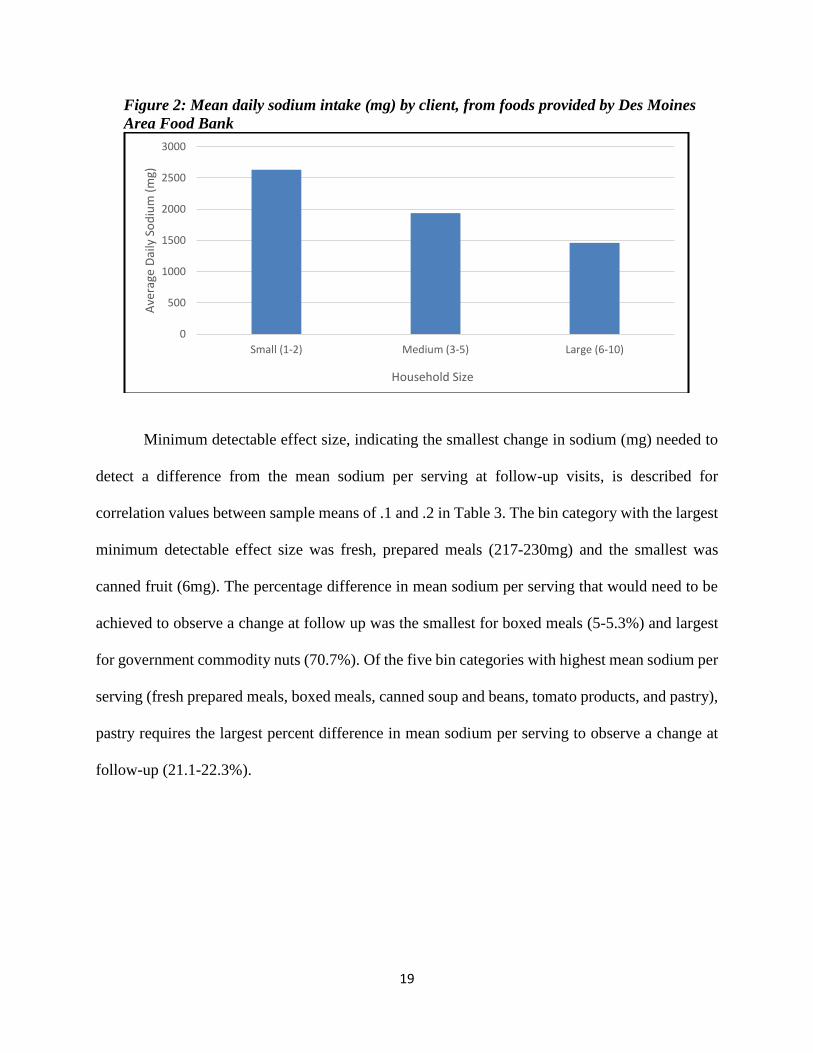
categories is shown in Figure 2. It is estimated that a client living in a small household would
consume 2630mg sodium per day from the Des Moines Area Food Bank food categories analyzed,
while a client in a medium household would consume 1937mg and from a large household,
1460mg (Figure 2). These findings indicates that a client in a small household may exceed the
recommended sodium limit of 2,300mg per day from food they receive at Des Moines Area Food
Bank. In addition, this is likely an underestimation as not all bin categories were included in data
collection and analysis and these would likely contribute additional sodium. Clients may also
receive food (and therefore sodium) from other sources.
Table 2 – Mean daily sodium contribution (mg) per client by bin and household size
Bin Category Small Family (1-2)
Medium Family (3-5)
Large Family (6-10)
Pastry 1 370 278 208
Tomato Products 2 368 276 207
Fresh, Prepared Meals 3 345 259 194
Sliced Bread 4 207 155 116
Mixed Snacks 5 194 146 109
Mixed Canned Vegetables 6 189 142 107
Canned Soup, Beans 7 176 99 82
Cheese (B2) 8 176 132 99
Mayo, Dressings 9 126 95 71
Boxed Meals 10 109 82 61
Gov. Comm. - peanut butter
11 63 47 35
Gov. Comm. - cereal 12 58 44 33
Frozen Meals 13 52 39 29
Cheese (B1) 14 51 38 29
Gov. Comm. - nuts 15 40 30 23
Canned Meats 16 36 27 20
Gov. Comm.- kidney beans 17 30 22 17
Yogurt 18 20 15 11
Canned Fruit 19 13 8 5
Dry Goods (lentils) 20 7 5 4
19
Figure 2: Mean daily sodium intake (mg) by client, from foods provided by Des Moines
Area Food Bank
Minimum detectable effect size, indicating the smallest change in sodium (mg) needed to
detect a difference from the mean sodium per serving at follow-up visits, is described for
correlation values between sample means of .1 and .2 in Table 3. The bin category with the largest
minimum detectable effect size was fresh, prepared meals (217-230mg) and the smallest was
canned fruit (6mg). The percentage difference in mean sodium per serving that would need to be
achieved to observe a change at follow up was the smallest for boxed meals (5-5.3%) and largest
for government commodity nuts (70.7%). Of the five bin categories with highest mean sodium per
serving (fresh prepared meals, boxed meals, canned soup and beans, tomato products, and pastry),
pastry requires the largest percent difference in mean sodium per serving to observe a change at
follow-up (21.1-22.3%).
0
500
1000
1500
2000
2500
3000
Small (1-2) Medium (3-5) Large (6-10)
Ave
rage
Dai
ly S
od
ium
(m
g)
Household Size

20
Table 3 – Minimum detectable effect size in sodium (mg) by bin category
Correlation = .1 Correlation = .2
Bin Category Difference in Sodium (mg)
% Difference
Difference in Sodium (mg)
% Difference
Boxed Meals 38 5.3 36 5.0
Cheese (B2) 11 6.3 10 5.9
Mayo, Dressings 6 7.2 6 6.8
Sliced Bread 16 9.0 15 8.4
Canned Soup, Beans 56 11.1 53 10.4
Cheese (B1) 15 12.4 14 11.8
Mixed Canned Vegetables 30 13.8 28 13.1
Tomato Products 41 14.1 39 13.3
Canned Meats 43 17.0 41 16.1
Mixed Snacks 25 20.1 23 18.9
Fresh, Prepared Meals 230 20.2 217 19.0
Pastry 59 22.3 56 21.1
Canned Fruit 6 22.9 6 21.8
Yogurt 23 23.6 21 22.3
Gov. Comm. - cereal 47 48.2 44 45.5
Frozen Meals 140 68.7 132 64.8
Gov. Comm. - nuts 41 74.9 39 70.7
Discussion
Our pilot methodology allowed us to explore mean sodium per serving and per 100kcals,
as well as the mean amount of sodium distributed to clients for the majority of bin categories at
Des Moines Area Food Bank. Fresh prepared meals were found to have the highest mean sodium
per serving, followed by boxed meals, canned soup/beans, tomato products, and pastry. The bin
categories with greatest mean sodium per 100kcals differed slightly with tomato products being
the highest, followed by mixed canned vegetables, canned soup/beans, canned meats, and boxed
meals. It was also estimated that the amount of sodium consumed by a client from the bin
categories analyzed would be 2630mg sodium per day for a small households, 1937mg for medium
households, and 1460mg for large households. Finally, we calculated the minimum detectable
effect size using a paired means t-test with 80% power, which provides guidance for future

21
evaluation efforts in terms of how much the mean sodium per serving in each bin will need to
change in order to show an impact of implemented strategies. The bin category with the smallest
minimum detectable effect size was canned fruit (6mg) and the largest was fresh prepared meals
(217-230mg). The percentage difference in mean sodium per serving that would need to be
achieved to observe a change at follow up was the smallest for boxed meals (5-5.3%) and largest
for government commodity nuts (70.7%). Of the five bin categories with highest mean sodium per
serving (fresh prepared meals, boxed meals, canned soup and beans, tomato products, and pastry),
pastry requires the largest percent difference in mean sodium per serving to observe a change at
follow-up (21.1-22.3%).
The bin categories identified with the highest mean sodium per serving and per 100kcals
are consistent with those that we expected to be higher based on Vital Signs national sodium
consumption data and Feeding America’s Foods to Encourage guidelines.18,19 This suggests that
our methodology could be a viable tool in determining the highest sodium contributors at specific
food banks and could provide guidance for food bank managers in terms which categories to focus
on in developing strategies for procuring and promoting lower sodium alternatives.
Our findings for mean sodium distribution by Des Moines Area Food Bank are also novel
in that, to our knowledge, there are no prior attempts to describe the amount of sodium distributed
in food bank offerings to clients. Our results indicate that a client in a small household may exceed
the recommended sodium limit of 2,300mg per day from food they receive during a visit to Des
Moines Area Food Bank (with the estimated amount being 2,630mg). In addition, this is likely an
underestimation as some bin categories were excluded from data collection and analysis: produce,
fresh meats, dry noodles, rice, oats, juice, milk, hummus/cottage cheese/dips, canned juice, and
popcorn. These bin categories, particularly hummus/cottage cheese/dips and popcorn, would likely

22
contribute additional sodium if included. Clients may also receive food (and therefore sodium)
from other sources such as food assistance programs. These findings are limited by the
assumptions made in regard to the number of items from each category a client would take, number
of people per household, and how many days food would last. Even so, they suggest that clients
receive a considerable amount of sodium during a food bank visit from these bin categories alone.
Another strength of our study was the calculation of minimum detectable effect size, which
provides insight into the feasibility of sodium reduction in each bin category. The percent change
in sodium needed to obtain a meaningful difference from the mean at follow-up visits ranged from
5-70.7% for bin categories. However, was 22.3% at highest for the top five bin categories with
highest mean sodium per serving. Previous grantees in the CDC Sodium Reduction in
Communities Program were successful in reducing sodium in a variety of venues. For example,
the Los Angeles County Department of Public Health reduced the mean sodium per snack package
by 30% in vending machines located on government sites and the San Antonio Metropolitan
Health District decreased average sodium content of meals at a private worksite by 22%.7 These
reductions combined with the minimum detectable effect size results suggest that it is feasible to
implement strategies with a measurable impact in the food bank setting, particularly by focusing
on the bin categories with highest mean sodium per serving.
Despite the strengths of our developed methodology and pilot test results, there are some
potential limitations to our study’s generalizability. Data collection was performed on only one
day, which likely contributed to the high variability of the data. In addition, this data is limited to
the food bank inventory at the time of data collection (January 2017), and may not be applicable
in other weeks, months, or seasons. Data collection excluded some bin categories (produce, meat,
juice, milk, hummus/cottage cheese/dips, dry noodles, oats, rice, canned juice, meats, popcorn,

23
and other miscellaneous categories). Nor did it include all foods offered within each bin category
based on feasibility issues. There were also several assumptions made during data analysis. For
example, nutrition labels were missing on 32 products (the majority being pastry items) and this
information was estimated using the USDA Food Composition Database. Some assumptions were
also made to calculate a client’s typical sodium intake from the food categories analyzed, as
described in the Methods section above. In addition, the only way to detect a change in daily
sodium intake per client while using this methodology would be if a bin’s mean sodium per serving
was to change by an amount larger than the values identified by the minimum detectable effect
size calculation.
Future evaluation efforts should work to strengthen this methodology by conducting repeat
assessments to determine variation in food item distribution over days, weeks, months, and
seasons. In addition, researches should work with food bank staff in order to find ways to
accomplish a complete assessment of items distributed during the full sample service. This could
be made easier by incorporating the use of a bar code scanner that links food items to an appropriate
nutrient database, given that over 90% of items had bar codes. Finally, it would be useful for
future efforts to pilot test this methodology with food banks utilizing other client selection models
in order to greater understand its generalizability.
Overall, the methodology and pilot test that were developed and conducted in this study
have some potential limitations in regard to generalizability. Despite this, our findings contribute
novel data on the sodium content of food bank offerings as well as perspectives on the feasibility
of data collection in this venue.

24
References
1. U.S. Department of Health and Human Services and U.S. Department of Agriculture. 2015–2020
Dietary Guidelines for Americans. 8th Edition. December 2015.
2. U.S. Department of Health and Human Services and U.S. Department of Agriculture. What We
Eat in America. NHANES 2011–2012.
3. Strazzullo, P., et al. Salt intake, stroke, and cardiovascular disease: meta-analysis of prospective
studies. BMJ. 2009;339:b45-67.
4. He FJ., et al. Effect of longer term modest salt reduction on blood pressure: Cochrane systematic
review and meta-analysis of randomised trials. BMJ. 2013 Apr 3;346:f1325.
5. He FJ., et al. Salt reduction in England from 2003 to 2011: its relationship to blood pressure,
stroke and ischaemic heart disease mortality BMJ Open. 2014;4:e004549.
6. Sasaki N. The salt factor in apoplexy and hypertension: epidemiological studies in Japan.
Prophylactic approach to hypertensive diseases. New York: Raven Press, 1979:467–74.
7. CDC – Sodium Reduction in Communities Program. <https://www.cdc.gov/dhdsp/programs/
sodium_reduction.htm>
8. Leung et al. Food Insecurity Is Inversely Associated with Diet Quality of Lower-Income Adults.
J Acad Nutr Diet. 2014 Dec;114(12):1943-53.e2
9. Saiz A.M., et al. Food insecurity and cardiovascular health: Findings from a statewide population
health survey in Wisconsin. Prev Med. 2016 Dec;93:1-6.
10. USDA ERS. Food Security in the U.S. 2015 Sep. 8. <http://www.ers.usda.gov/topics/food-
nutrition-assistance/food-security-in-the-us/key-statistics-graphics.aspx#foodsecure>
11. Bazerghi C, McKay FH, Dunn M. The Role of Food Banks in Addressing Food Insecurity: A
Systematic Review. Journal of Community Health. 2016 Jan. 4: 1-9.
12. Hoisington, A., Manore, M. M., & Raab, C. (2011). Nutritional Quality of Emergency Foods.
Journal of The American Dietetic Association, 111(4), 573-576.
13. Lick L (2014) Applying MyPlate to procurement in food banks: implications for policy. MS Thesis,
Arizona State University; available at http://gradworks.umi.com/15/94/1594257.html
14. Seidel M, Laquatra I, Woods M et al. (2015) Applying a nutrient-rich foods index algorithm to
address nutrient content of food bank food. J Acad Nutr Diet 115, 695–700.
15. Nanney M., et al. Application of the Healthy Eating Index-2010 to the Hunger Relief System. ‘
Public Health Nutrition, 2016. May 25:1-9.
16. King RP, Warren C, Cureton C et al. (2016) How healthy is hunger relief food? Am J Agric Econ
25
98, 533–548.
17. Des Moines Area Food Bank – About. <http://www.myfoodbank.org/about.html>
18. Vital Signs: Food Categories Contributing the Most to Sodium Consumption – United States,
2007-2008.
19. Foods to Encourage, Feeding America (F2E). <http://healthyfoodbankhub.feedingamerica.org/
resource/foods-to-encourage/>
20. USDA Food Composition Database: <https://ndb.nal.usda.gov/ndb/>.
21. FDA Code of Federal Regulations Title 21: <https://www.accessdata.fda.gov/scripts/cdrh/cfdocs/
cfcfr/cfrsearch.cfm?fr=101.12>

26
Appendix
Emergency Food Bin Data Collection Form
Name of Food Bank:
Date/day of data collection:
Food Bank Opening Hours: Start time: End time: Total hrs:
Data Collection Shift: Start time: End time: Total hrs:
Data Collection Team Members:
Notes about Food Bank shift:
Total number of food bank clients during daily shift:
Number of food bank clients by household size: Size #
Draw a map of food bank line (# bins for reference to other forms):

27
Emergency Food Bin/Item Data Collection Form
Bin #:
Bin content category:
General description of bin contents:
Household size allotments (# each person can take from this bin), if noted:
Small (1-2 people): Medium (3-5 people): Large (6+ people):
ITEMS IN BIN:
Quantity (use tick marks each)
Item name Brand / Manufacturer
Details/ type (e.g., flavor, light/diet/low sodium)
Unit type (can, box, package, box)
Weight/ unit (ounces, pounds, grams)
# servings /unit
Cals/ serving
Sodium (mg)/ serving
Bar code (Y/N)
Nutr label (Y/N)