assessing the potential of geographic markets fka the effectiveness of distant recruiting efforts
DESCRIPTION
Assessing the Potential of Geographic Markets fka The Effectiveness of Distant Recruiting Efforts. By Gillian Butler Student Affairs Research & Information University of California, Davis CAIR 2001 Sacramento, CA. SARI Report 222.A. - PowerPoint PPT PresentationTRANSCRIPT

Assessing the Potential of Geographic Markets
fka The Effectiveness of Distant Recruiting Efforts
By Gillian ButlerStudent Affairs Research & Information
University of California, Davis
CAIR 2001Sacramento, CA
SARI Report 222.A

Number of HS Graduates in June 2000: Top Ten CA Counties
Source: CA Dept of Education
8764
9306
11206
11231
13795
15628
18966
25681
26897
77301
Contra Costa
Fresno
Sacramento
Alameda
Santa Clara
Riverside
San Bernardino
San Diego
Orange
Los Angeles

Number of Hispanic HS Graduates in June 2000: Top Ten CA Counties
Source: CA Dept of Education
3116
3140
3840
5835
7096
7400
7522
35977
2472
2275Tulare
Ventura
Kern
Santa Clara
Fresno
Riverside
San Bernardino
San Diego
Orange
Los Angeles

Number of African American HS Graduates in June 2000:
Top Ten CA CountiesSource: CA Dept of Education
509
521
682
866
1213
1295
1742
1792
1988
8354
Orange
Santa Clara
Solano
Contra Costa
Riverside
Sacramento
Alameda
San Diego
San Bernardino
Los Angeles

Percentage of Enrolling Students Who Chose UCD Because They "Wanted To Live
Near Home"Source: CIRP Survey of Incoming Freshmen, 1976 - 1997
14% 14%15%
16% 16%
1%
1976 1986 1988 1991 1994 1997

Percentage For Whom Being Close to Home is “Very Important", by Ethnicity
Source: CIRP Survey of Incoming Freshmen, 1997
28% 28%26% 26% 25% 25%
23% 22%
18%14%
9%

Academic Image of UC Davis by Admits' Home Locations
0%
10%
20%
30%
40%
50%
60%
70%
Inte
llect
ual
Back-
up s
chool
Challe
nging
Prest
igio
us
Not w
ell-k
nown
Caree
r-orie
nted
Selec
tive
Academ
ic
Local Bay Area Central Northern CA Southern CA

Social Image of UC Davis by Admits' Home Locations
0%
10%
20%
30%
40%
50%
60%
70%
80%
90%Local Bay Area Central Northern CA Southern CA

http://www.sariweb.ucdavis.edu/factbook/countymap.htm

Number of Applications, Admits, and Enrolled Students by Marketing Region, 1998 -'99 through
2000-'01(Fall Freshmen from HS)
0
5000
10000
15000
20000
25000
30000
UCD Local UCD Bay UCI UCLA UCR UCSD
Applied
Admitted
Enrolled
68%
39%
63%
31% 59%
14%66%
22%61%
15% 61% 21%

Number of Applied, Admitted, and Enrolled Hispanic Students by Marketing Region
1998 - '99 through 2000 - '01(Fall Freshmen from HS)
0
500
1000
1500
2000
2500
UCD Local UCD Bay UCI UCLA UCR UCSD
Hispanic
Applied
Admitted
Enrolled
65%
46%
61%
32%
64%
18%
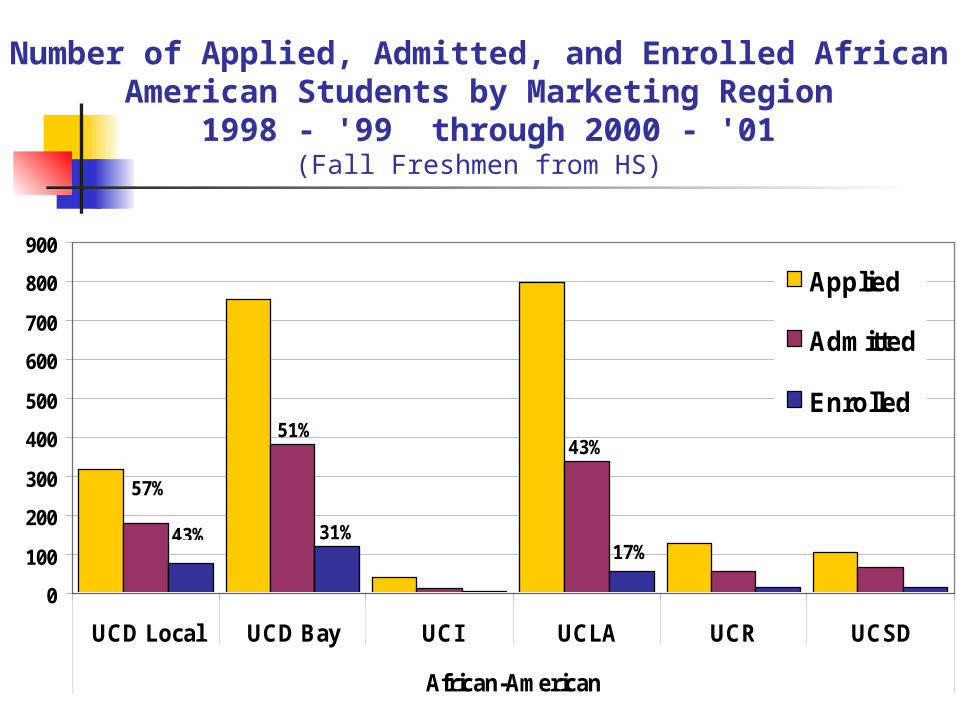
Number of Applied, Admitted, and Enrolled African American Students by Marketing Region
1998 - '99 through 2000 - '01(Fall Freshmen from HS)
0
100
200
300
400
500
600
700
800
900
UCD Local UCD Bay UCI UCLA UCR UCSD
African-American
Applied
Admitted
Enrolled
57%
43%
51%
31%
43%
17%

Potential Eligibles:
Completed the course sequence required for admission to a UC or CSU school
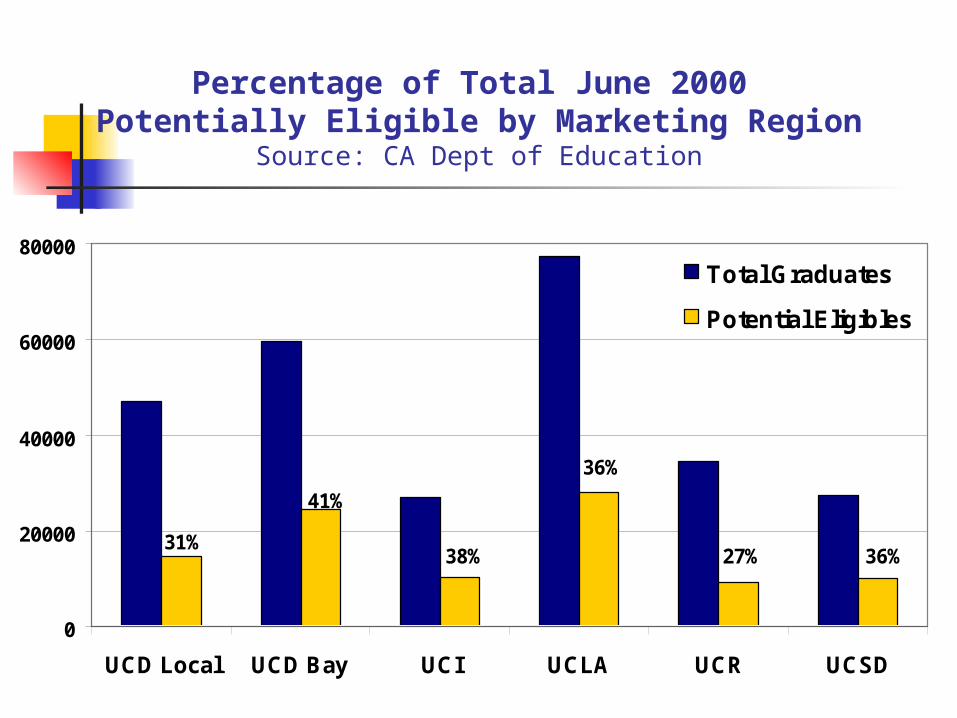
Percentage of Total June 2000 Potentially Eligible by Marketing Region
Source: CA Dept of Education
0
20000
40000
60000
80000
UCD Local UCD Bay UCI UCLA UCR UCSD
Total Graduates
Potential Eligibles
31%
41%
38%
36%
27% 36%

Percentage of Total June 2000 HS Graduates Potentially Eligible by Ethnicity
Source: CA Dept of Education
0
20000
40000
60000
80000
100000
120000
140000
AmericanIndian
Asian Filipino Hispanic AfricanAmerican
White
Total Graduates
Potentially Eligible
9%
58%
45%
22%
25%
40%

Percentage of Hispanic June 2000 HS Graduates Potentially Eligible by Marketing Region
Source: CA Dept of Education
0
5000
10000
15000
20000
25000
30000
35000
40000
UCD Local UCD Bay UCI UCLA UCR UCSD
Hispanic
Total Graduates
Potential Eligibles
18%21%
16%
26%
18% 21%

Percentage of African-American June 2000 HS Graduates Potentially Eligible by Marketing Region
Source: CA Dept of Education
0
1000
2000
3000
4000
5000
6000
7000
8000
9000
UCD Local UCD Bay UCI UCLA UCR UCSD
African American
Total Graduates
Potential Eligibles
19% 27%
25%
29%
21%22%

Cesa & Carnegie “Using Logistic Regression to Predict Which Admits Will Register”
“Detailed tables of odds that focus on specific groups . . . are helpful in planning recruitment strategies for those specific groups.”

Logistic Regression Models
Bivariate Logistic Regression Two separate models: one to predict
admission, & one to predict enrollment
Multiplied probability of admission by probability of enrolling to get probability of applicant enrolling.
Deviation coding: Results are comparative, not absolute

Maximum Possible Enrollments
Multiplied probability of enrolling by relative number of “Potential Eligibles” to derive Maximum Possible Enrollments

MODEL: All ApplicantsProbability of Enrolling by Number of Potential
Eligibles
UCD Local
UCD Bay
UCI UCLA UCR UCSD
Probability of an applicant enrolling from this region vs. from UCD Local
.25 .19 .09 .08 .13 .12
Number of Potential Eligibles in this region
14430 24465 10232 27924 9227 9891
Maximum possible enrollments
3608 4625 875 2153 1190 1221

MODEL: Hispanic ApplicantsProbability of Enrolling by Potential
Eligibles
UCD Local
UCD Bay
UUCI UCLA UCR UCSD
Probability of an applicant enrolling from this region vs. from UCD Local
.25 .19 .09 .09 .13 .11
Number of Potential Eligibles in this region
1493 3067 1193 9318 2375 1828
Maximum possible enrollments
373 580 102 827 306 199

MODEL: African-American ApplicantsProbability of Enrolling by Potential
Eligibles
UCD Local
UCD Bay
UCI UCLA UCR UCSD
Probability of an applicant enrolling from this region vs. from UCD Local
.25 .17 .07 .07 .14 .15
Number of Potential Eligibles in this region
558 1195 126 2391 665 403
Maximum possible enrollments
137 207 8 175 90 61

Conclusions The Bay Area is the strongest market
for total applicants Local and Bay Area regions combined
have same potential as LA County for Hispanic enrollments
Of all southern CA markets, only LA County has strong potential for Hispanic enrollments
Bay Area has the strongest potential for African-American enrollments