assessing the performance of military treatment facilities - rand
TRANSCRIPT

A JOINT ENDEAVOR OF RAND HEALTH AND THERAND NATIONAL SECURITY RESEARCH DIVISION
Center for Military Health Policy Research
For More InformationVisit RAND at www.rand.org
Explore the RAND Center for Military Health Policy Research
View document details
Support RANDPurchase this document
Browse Reports & Bookstore
Make a charitable contribution
Limited Electronic Distribution RightsThis document and trademark(s) contained herein are protected by law as indicated in a notice appearing later in this work. This electronic representation of RAND intellectual property is provided for non-commercial use only. Unauthorized posting of RAND electronic documents to a non-RAND website is prohibited. RAND electronic documents are protected under copyright law. Permission is required from RAND to reproduce, or reuse in another form, any of our research documents for commercial use. For information on reprint and linking permissions, please see RAND Permissions.
Skip all front matter: Jump to Page 16
The RAND Corporation is a nonprofit institution that helps improve policy and decisionmaking through research and analysis.
This electronic document was made available from www.rand.org as a public service of the RAND Corporation.
CHILDREN AND FAMILIES
EDUCATION AND THE ARTS
ENERGY AND ENVIRONMENT
HEALTH AND HEALTH CARE
INFRASTRUCTURE AND TRANSPORTATION
INTERNATIONAL AFFAIRS
LAW AND BUSINESS
NATIONAL SECURITY
POPULATION AND AGING
PUBLIC SAFETY
SCIENCE AND TECHNOLOGY
TERRORISM AND HOMELAND SECURITY

This product is part of the RAND Corporation monograph series.
RAND monographs present major research findings that address the
challenges facing the public and private sectors. All RAND mono-
graphs undergo rigorous peer review to ensure high standards for
research quality and objectivity.

Nancy Nicosia, Barbara O. Wynn, John A. Romley
Prepared for the Office of the Secretary of DefenseApproved for public release; distribution unlimited
A JOINT ENDEAVOR OF RAND HEALTH AND THERAND NATIONAL SECURITY RESEARCH DIVISION
Center for Military Health Policy Research
Assessing the Performance of Military Treatment Facilities

The RAND Corporation is a nonprofit institution that helps improve policy and decisionmaking through research and analysis. RAND’s publications do not necessarily reflect the opinions of its research clients and sponsors.
R® is a registered trademark.
© Copyright 2011 RAND Corporation
Permission is given to duplicate this document for personal use only, as long as it is unaltered and complete. Copies may not be duplicated for commercial purposes. Unauthorized posting of RAND documents to a non-RAND website is prohibited. RAND documents are protected under copyright law. For information on reprint and linking permissions, please visit the RAND permissions page (http://www.rand.org/publications/permissions.html).
Published 2011 by the RAND Corporation1776 Main Street, P.O. Box 2138, Santa Monica, CA 90407-2138
1200 South Hayes Street, Arlington, VA 22202-50504570 Fifth Avenue, Suite 600, Pittsburgh, PA 15213-2665
RAND URL: http://www.rand.orgTo order RAND documents or to obtain additional information, contact
Distribution Services: Telephone: (310) 451-7002; Fax: (310) 451-6915; Email: [email protected]
The research described in this report was sponsored by the Assistant Secretary of Defense for Health Affairs and conducted by the RAND Center for Military Health Policy Research, a joint project of RAND Health, and the Forces and Resources Policy Center of the RAND National Defense Research Institute. The latter is a federally funded research and development center sponsored by the Office of the Secretary of Defense, the Joint Staff, the Unified Combatant Commands, the Department of the Navy, the Marine Corps, the defense agencies, and the defense Intelligence Community.
Library of Congress Cataloging-in-Publication Data
Assessing the performance of military treatment facilities / Nancy Nicosia ... [et. al]. p. cm. Includes bibliographical references. ISBN 978-0-8330-4777-9 (pbk. : alk. paper) 1. Medicine, Military—United States—Evaluation. 2. United States—Armed Forces—Medical care—Evaluation. 3. United States--Armed Forces—Medical care—Cost effectiveness. 4. Health planning—United States. I. Nicosia, Nancy.
UH223.A92 2011 355.7'20684—dc23 2011020359

iii
Preface
This monograph considers potential efforts by the U.S. Department of Defense (DoD) to assess the performance of military treatment facilities (MTFs) in cost-effectively managing health care under DoD’s TRICARE benefit. It offers an overview of performance assessment in the nonmilitary health care sector. It then analyzes the use of changes over time in average MTF utilization and costs as performance mea-sures, focusing on how MTF size and catastrophic cases affect these metrics.
This research was sponsored by the Assistant Secretary of Defense for Health Affairs and conducted jointly by RAND Health’s Center for Military Health Policy Research and the Forces and Resources Policy Center of the RAND National Defense Research Institute. The latter is a federally funded research and development center sponsored by the Office of the Secretary of Defense, the Joint Staff, the Unified Combat-ant Commands, the Department of the Navy, the Marine Corps, the defense agencies, and the defense Intelligence Community.
Comments are welcome and may be addressed to John Romley ([email protected]). For more information on the RAND Health Center for Military Policy Research, contact Susan Hosek at [email protected] or Terri Tanielian at [email protected]. A profile of RAND Health, abstracts of its publications, and ordering informa-tion can be found at www.rand.org/health. For more information on RAND’s Forces and Resources Policy Center, contact the Director, James Hosek. He can be reached by email at [email protected]; by phone at 310-393-0411, extension 7183; or by mail at the RAND Corporation, 1776 Main Street, Santa Monica, California 90407-2138. More information about RAND is available at www.rand.org.


v
Contents
Preface . . . . . . . . . . . . . . . . . . . . . . . . . . . . . . . . . . . . . . . . . . . . . . . . . . . . . . . . . . . . . . . . . . . . . . . . . . . . . iiiFigures . . . . . . . . . . . . . . . . . . . . . . . . . . . . . . . . . . . . . . . . . . . . . . . . . . . . . . . . . . . . . . . . . . . . . . . . . . . . . ixTables . . . . . . . . . . . . . . . . . . . . . . . . . . . . . . . . . . . . . . . . . . . . . . . . . . . . . . . . . . . . . . . . . . . . . . . . . . . . . . xiSummary . . . . . . . . . . . . . . . . . . . . . . . . . . . . . . . . . . . . . . . . . . . . . . . . . . . . . . . . . . . . . . . . . . . . . . . . . xiiiAcknowledgments . . . . . . . . . . . . . . . . . . . . . . . . . . . . . . . . . . . . . . . . . . . . . . . . . . . . . . . . . . . . . . xxiAbbreviations . . . . . . . . . . . . . . . . . . . . . . . . . . . . . . . . . . . . . . . . . . . . . . . . . . . . . . . . . . . . . . . . . . xxiii
ChAPTeR One
Introduction . . . . . . . . . . . . . . . . . . . . . . . . . . . . . . . . . . . . . . . . . . . . . . . . . . . . . . . . . . . . . . . . . . . . . . . 1
ChAPTeR TwO
The Context for Assessing the Performance of Military Treatment Facilities . . . . . . . . . . . . . . . . . . . . . . . . . . . . . . . . . . . . . . . . . . . . . . . . . . . . . . . . . . . . . . . . . . . . . . . 5
The Mission of the Military Health System . . . . . . . . . . . . . . . . . . . . . . . . . . . . . . . . . . . . 5The TRICARE Benefit . . . . . . . . . . . . . . . . . . . . . . . . . . . . . . . . . . . . . . . . . . . . . . . . . . . . . . . . . . . . 6Challenges to the System . . . . . . . . . . . . . . . . . . . . . . . . . . . . . . . . . . . . . . . . . . . . . . . . . . . . . . . . . . 8DoD’s Strategy . . . . . . . . . . . . . . . . . . . . . . . . . . . . . . . . . . . . . . . . . . . . . . . . . . . . . . . . . . . . . . . . . . . . . 8DoD’s Per Member Per Month Metric for MTFs . . . . . . . . . . . . . . . . . . . . . . . . . . . . . . 9
ChAPTeR ThRee
Performance Assessment in health Care . . . . . . . . . . . . . . . . . . . . . . . . . . . . . . . . . . . . 11Outcomes and Performance . . . . . . . . . . . . . . . . . . . . . . . . . . . . . . . . . . . . . . . . . . . . . . . . . . . . . 11Accounting for Other Determinants of Outcomes . . . . . . . . . . . . . . . . . . . . . . . . . . . 13
Systematic Factors. . . . . . . . . . . . . . . . . . . . . . . . . . . . . . . . . . . . . . . . . . . . . . . . . . . . . . . . . . . . . . . 13Random Factors . . . . . . . . . . . . . . . . . . . . . . . . . . . . . . . . . . . . . . . . . . . . . . . . . . . . . . . . . . . . . . . . . 14
vi Assessing the Performance of Military Treatment Facilities
Assessing MTF Performance Based on Outcomes . . . . . . . . . . . . . . . . . . . . . . . . . . . . 16Systematic Factors Other Than Performance . . . . . . . . . . . . . . . . . . . . . . . . . . . . . . . . 17Random Variability in PMPM Outcomes . . . . . . . . . . . . . . . . . . . . . . . . . . . . . . . . . . . 18PMPM Outcomes Versus Episode-Based Performance . . . . . . . . . . . . . . . . . . . 20
ChAPTeR FOuR
Performance Assessment and MTF Size . . . . . . . . . . . . . . . . . . . . . . . . . . . . . . . . . . . . 23Data Set on MTF Outcomes . . . . . . . . . . . . . . . . . . . . . . . . . . . . . . . . . . . . . . . . . . . . . . . . . . . 23Analysis Sample and Outcomes . . . . . . . . . . . . . . . . . . . . . . . . . . . . . . . . . . . . . . . . . . . . . . . . 24MTF Size. . . . . . . . . . . . . . . . . . . . . . . . . . . . . . . . . . . . . . . . . . . . . . . . . . . . . . . . . . . . . . . . . . . . . . . . . . . 25The Relationship Between the Variability of MTF Outcomes and
Their Size . . . . . . . . . . . . . . . . . . . . . . . . . . . . . . . . . . . . . . . . . . . . . . . . . . . . . . . . . . . . . . . . . . . . . 26Assessing Changes in MTF Outcomes . . . . . . . . . . . . . . . . . . . . . . . . . . . . . . . . . . . . . . . . . 33Additional Issues . . . . . . . . . . . . . . . . . . . . . . . . . . . . . . . . . . . . . . . . . . . . . . . . . . . . . . . . . . . . . . . . . 38
Lowering the Confidence Level . . . . . . . . . . . . . . . . . . . . . . . . . . . . . . . . . . . . . . . . . . . . . . 38Assessing the Performance of Military Services . . . . . . . . . . . . . . . . . . . . . . . . . . . . 38Assessing MTF Performance on an Annual Basis . . . . . . . . . . . . . . . . . . . . . . . . . 42Assessing MTF Performance Net of MHS Trends . . . . . . . . . . . . . . . . . . . . . . . . 48
ChAPTeR FIve
Performance Assessment and Catastrophic Cases . . . . . . . . . . . . . . . . . . . . . . . . . 51Relevant Data Sets . . . . . . . . . . . . . . . . . . . . . . . . . . . . . . . . . . . . . . . . . . . . . . . . . . . . . . . . . . . . . . . . 52Characterizing Catastrophic Inpatient Care . . . . . . . . . . . . . . . . . . . . . . . . . . . . . . . . . . . 52Assessing Changes in Inpatient Utilization with Catastrophic
Admissions Excluded . . . . . . . . . . . . . . . . . . . . . . . . . . . . . . . . . . . . . . . . . . . . . . . . . . . . . . . 54
ChAPTeR SIx
Conclusions . . . . . . . . . . . . . . . . . . . . . . . . . . . . . . . . . . . . . . . . . . . . . . . . . . . . . . . . . . . . . . . . . . . . . . . 59Utilization and Costs Reflect MTF Performance and Other Factors . . . . . . 60MTF Utilization and Costs Are Variable, But Systematic Changes
Can Be Identified . . . . . . . . . . . . . . . . . . . . . . . . . . . . . . . . . . . . . . . . . . . . . . . . . . . . . . . . . . . . 61Outcomes Are More Variable at Smaller MTFs, Yet MTF Size Was Not
Consistently Related to the Frequency of Systematic Changes . . . . . . . . . 62Excluding Catastrophic Inpatient Care Is Practical and Potentially
Useful . . . . . . . . . . . . . . . . . . . . . . . . . . . . . . . . . . . . . . . . . . . . . . . . . . . . . . . . . . . . . . . . . . . . . . . . . 63Potential Refinements . . . . . . . . . . . . . . . . . . . . . . . . . . . . . . . . . . . . . . . . . . . . . . . . . . . . . . . . . . . . 63

Contents vii
APPenDIxeS
A. Some Statistical Issues in Performance Assessment . . . . . . . . . . . . . . . . . . . 65B. Detailed Results of Benchmark Analysis of MTF Outcomes . . . . . . . . 73C. Outpatient utilization and MTF Size . . . . . . . . . . . . . . . . . . . . . . . . . . . . . . . . . . 101D. Catastrophic hospital Admissions . . . . . . . . . . . . . . . . . . . . . . . . . . . . . . . . . . . . . 103e. Detailed Results of Analysis of Catastrophic hospital
Admissions . . . . . . . . . . . . . . . . . . . . . . . . . . . . . . . . . . . . . . . . . . . . . . . . . . . . . . . . . . . . . . . . . 107
Bibliography . . . . . . . . . . . . . . . . . . . . . . . . . . . . . . . . . . . . . . . . . . . . . . . . . . . . . . . . . . . . . . . . . . . . 111


ix
Figures
S.1. Actual and Mean Inpatient Utilization at DeWitt Army Community Hospital, FYs 2004–2005 . . . . . . . . . . . . . . . . . . . . . . . . . . xiv
4.1. Actual and Mean Inpatient Utilization at DeWitt Army Community Hospital, FYs 2004–2005 . . . . . . . . . . . . . . . . . . . . . . . . . . 28
4.2. Standard Deviations of Inpatient Utilization and MTF Size, FYs 2004–2005 . . . . . . . . . . . . . . . . . . . . . . . . . . . . . . . . . . . . . . . . . . . . . . . . 29
4.3. Standard Deviations of Outpatient Utilization and MTF Size, FYs 2004–2005 . . . . . . . . . . . . . . . . . . . . . . . . . . . . . . . . . . . . . . . . . . . . . . . . 29
4.4. Standard Deviations of Drug Utilization and MTF Size, FYs 2004–2005 . . . . . . . . . . . . . . . . . . . . . . . . . . . . . . . . . . . . . . . . . . . . . . . . . . . . . 30
4.5. Standard Deviations of Total Cost and MTF Size, FYs 2004–2005 . . . . . . . . . . . . . . . . . . . . . . . . . . . . . . . . . . . . . . . . . . . . . . . . . . . . . 30
4.6. Mean MTF Inpatient Utilization and Size, FYs 2004–2005 . . . . . . . . . . . . . . . . . . . . . . . . . . . . . . . . . . . . . . . . . . . . . . . . . . . . . . 31
4.7. Mean MTF Outpatient Utilization and Size, FYs 2004–2005 . . . . . . . . . . . . . . . . . . . . . . . . . . . . . . . . . . . . . . . . . . . . . . . . . . . . . . 31
4.8. Mean MTF Drug Utilization and Size, FYs 2004–2005 . . . . . . . 32 4.9. Mean MTF Total Cost and Size, FYs 2004–2005 . . . . . . . . . . . . . . 32 4.10. Percentage Change in Outcome Required for Statistical
Significance, Mean by Confidence Level . . . . . . . . . . . . . . . . . . . . . . . . . 39 4.11. Frequency of Statistically Significant Changes in MTF
Outcomes, by Confidence Level . . . . . . . . . . . . . . . . . . . . . . . . . . . . . . . . . . . 39 4.12. Percentage Change in Inpatient Utilization Required for
Statistical Significance, Mean by Level of Analysis . . . . . . . . . . . . . 40 4.13. Percentage Change in Outpatient Utilization Required for
Statistical Significance, Mean by Level of Analysis . . . . . . . . . . . . . 40 4.14. Percentage Change in Drug Utilization Required for
Statistical Significance, Mean by Level of Analysis . . . . . . . . . . . . . . 41

x Assessing the Performance of Military Treatment Facilities
4.15. Percentage Change in Total Cost Required for Statistical Significance, Mean by Level of Analysis . . . . . . . . . . . . . . . . . . . . . . . . . . 41
4.16. Percentage Change in Outcome Required for Statistical Significance, Mean by Frequency of Analysis . . . . . . . . . . . . . . . . . . . 48
4.17. Frequency of Statistically Significant Changes in MTF Outcomes, by Frequency of Analysis . . . . . . . . . . . . . . . . . . . . . . . . . . . . . . 49
4.18. Frequency of Statistically Significant Changes in MTF Outcomes, Observed Changes Net of Military Health System Trend Versus Benchmark Analysis . . . . . . . . . . . . . . . . . . . . . . 50
5.1. Percentage Change in Noncatastrophic Inpatient Utilization Required for Statistical Significance with 95 Percent Confidence, Mean by DRGs Excluded Based on RWPs . . . . . . . . . . . . . . . . . . . . . . . . . . . . . . . . . . . . . . . . . . . . . . . . . . . . . . 55
5.2. Percentage Change in Noncatastrophic Inpatient Utilization Required for Statistical Significance, Mean by DRGs Excluded and MTF Size Quintile . . . . . . . . . . . . . . . . . . . . 56
5.3. Frequency of Statistically Significant Changes in Noncatastrophic Inpatient Utilization, by DRGs Excluded and MTF Size Quintile . . . . . . . . . . . . . . . . . . . . . . . . . . . . . . . . . . . . . . . . . . . . . 57

xi
Tables
S.1. Frequency of Statistically Significant Changes in FY 2006 from FY 2004–2005 Mean Levels, Smallest MTFs Versus Largest MTFs . . . . . . . . . . . . . . . . . . . . . . . . . . . . . . . . . . . . . xviii
4.1. MTF Outcomes Among Non-Active Duty TRICARE Prime Enrollees, FYs 2004–2005 . . . . . . . . . . . . . . . . . . . . . . . . . . . . . . . . . . 25
4.2. MTF Prime Enrollment and Equivalent Lives, FYs 2004–2005 . . . . . . . . . . . . . . . . . . . . . . . . . . . . . . . . . . . . . . . . . . . . . . . . . . . . . 26
4.3. Range of MTF Sizes in Each Size Quintile . . . . . . . . . . . . . . . . . . . . . 27 4.4. Percentage Change in Outcome Required for Statistical
Significance, Mean by MTF Size Quintile . . . . . . . . . . . . . . . . . . . . . . . 33 4.5. Frequency of Statistically Significant Changes in MTF
Outcomes During the Quarters of FY 2006 from Their Mean Levels in FYs 2004–2005, by MTF Size Quintile . . . . . . . 35
4.6. Number of MTFs with Statistically Significant Changes in Outcomes, by Number of Quarters in FY 2006 with Significant Changes . . . . . . . . . . . . . . . . . . . . . . . . . . . . . . . . . . . . . . . . . . . . . . . . . 37
4.7. Regressions of Estimated Standard Deviation of Annual Inpatient Utilization . . . . . . . . . . . . . . . . . . . . . . . . . . . . . . . . . . . . . . . . . . . . . . . . 44
4.8. Regressions of Estimated Standard Deviation of Annual Outpatient Utilization . . . . . . . . . . . . . . . . . . . . . . . . . . . . . . . . . . . . . . . . . . . . . . 45
4.9. Regressions of Estimated Standard Deviation of Annual Drug Utilization . . . . . . . . . . . . . . . . . . . . . . . . . . . . . . . . . . . . . . . . . . . . . . . . . . . . 46
4.10. Regressions of Estimated Standard Deviation of Annual Costs . . . . . . . . . . . . . . . . . . . . . . . . . . . . . . . . . . . . . . . . . . . . . . . . . . . . . . . . . . . . . . . . . . . 47
5.1. Catastrophic Hospital Admissions as Share of Total Inpatient Utilization and Admissions Among Non-Active Duty Prime Enrollees, by Threshold for Catastrophic DRGs and MTF Size Quintile . . . . . . . . . . . . . . . . . . . . . . . . . . . . . . . . . . . . . 53

xii Assessing the Performance of Military Treatment Facilities
A.1. Random Variability of Inpatient Utilization and Confidence Intervals for Statistically Significant Changes, by MTF Size and Confidence Level . . . . . . . . . . . . . . . . . . . . . . . . . . . . . . . 70
B.1. TRICARE Prime Enrollment and Equivalent Lives, FYs 2004–2005 . . . . . . . . . . . . . . . . . . . . . . . . . . . . . . . . . . . . . . . . . . . . . . . . . . . . . . 74
B.2. Monthly Inpatient Utilization per 1,000 Equivalent Lives, FYs 2004–2005 . . . . . . . . . . . . . . . . . . . . . . . . . . . . . . . . . . . . . . . . . . . . . . . . . . . . . . 79
B.3. Monthly Outpatient Utilization per 100 Equivalent Lives, FYs 2004–2005 . . . . . . . . . . . . . . . . . . . . . . . . . . . . . . . . . . . . . . . . . . . . . . . . . . . . . 84
B.4. Monthly Drug Utilization per 100 Equivalent Lives, FYs 2004–2005 . . . . . . . . . . . . . . . . . . . . . . . . . . . . . . . . . . . . . . . . . . . . . . . . . . . . . . 89
B.5. Annual Total Cost Per Equivalent Life, FYs 2004–2005 . . . . . . 94 B.6. Standard Deviations of MTF Outcomes in FYs 2004–2005
and FY 2006, Mean by MTF Size Quintile . . . . . . . . . . . . . . . . . . . . . 99 C.1. Regression of Outpatient Utilization . . . . . . . . . . . . . . . . . . . . . . . . . . . . 102 D.1. Top 10 Percent of DRGs, by RWPs . . . . . . . . . . . . . . . . . . . . . . . . . . . . . 104 E.1. Results of Regression of Total Inpatient Utilization,
with Catastrophic Admissions Defined by the Highest 1 Percent of DRGs by Resource Use . . . . . . . . . . . . . . . . . . . . . . . . . . . . 108
E.2. Results of Regression of Total Inpatient Utilization, with Catastrophic Admissions Defined by the Highest 5 Percent of DRGs by Resource Use . . . . . . . . . . . . . . . . . . . . . . . . . . . . 108
E.3. Results of Regression of Total Inpatient Utilization, with Catastrophic Admissions Defined by the Highest 10 Percent of DRGs by Resource Use . . . . . . . . . . . . . . . . . . . . . . . . . . . 109

xiii
Summary
The U.S. Department of Defense (DoD) has increasingly confronted financial, managerial, and operational challenges in sustaining the TRICARE health benefit, which it provided to 9.2 million beneficia-ries in fiscal year (FY) 2006. Medical costs, for example, are projected to increase to 12 percent of DoD’s total budget as of FY 2015, from a level of 8 percent in FY 2007.
In response to such challenges, the 2006 Quadrennial Defense Review motivated a transformation in business practices within the Military Health System (MHS). Performance-based planning and financing would allocate resources based on the value of activities to DoD’s mission, while aligning accountability and authority within the system.
DoD has considered setting targets for health care utilization in its military treatment facilities (MTFs) and rewarding or penalizing MTFs according to their performance. Such an initiative supposes that MTF leaders are able to cost-effectively manage care, much as general-ist physicians or managed-care plans are frequently expected to do in the private sector. For example, in areas in which TRICARE costs are high at private hospitals, MTF leaders may be able to encourage benefi-ciaries to be treated at military hospitals with spare capacity.
The Office of the Assistant Secretary of Defense for Health Affairs (OASD[HA]) has been monitoring utilization and costs “per member per month” (PMPM) among beneficiaries enrolled at each MTF in TRICARE Prime, a managed-care plan similar to a civil-ian health-maintenance organization. These PMPM metrics include all care received by beneficiaries, whether from the enrollment MTF, from

xiv Assessing the Performance of Military Treatment Facilities
other MTFs, or from civilian health care providers. OASD(HA) has considered assessing each MTF’s performance by comparing current PMPM utilization with past levels.
Assessing changes in performance based on outcomes such as PMPM metrics raises a variety of important questions. What is the relationship between OASD(HA)’s metrics and MTF performance in cost-effectively managing care? What else may influence PMPM outcomes?
Figure S.1 suggests some answers. The figure shows OASD(HA)’s metric for inpatient utilization at DeWitt Army Community Hospital during FYs 2004–2005. Actual utilization in any quarter varies around the mean level. Performance may systematically influence mean utili-zation, yet there also appears to be some randomness.
Figure S.1 suggests some additional questions. If utilization were higher in FY 2006 than the FY 2004–2005 mean, how could OASD(HA) decide whether performance (or some other systematic
Figure S.1Actual and Mean Inpatient Utilization at DeWitt Army Community Hospital, FYs 2004–2005
ActualMean
2.5
3
3.5
Inp
atie
nt
uti
lizat
ion
2004 2005 2006Year–quarter
RAND MG803-S.1

Summary xv
factor) had changed, or whether utilization just happened to be higher by chance? Is the nature of this decision concerning DeWitt, a rela-tively large MTF, similar to the decision that must be made at MTFs with small numbers of enrollees, where the randomness of utilization could be different? Do catastrophic cases, such as organ transplants, contribute to the random variability of inpatient utilization, making it harder to discern systematic changes?
Purpose and Approach
The purpose of this study is to help inform the sponsor’s thinking about the assessment of MTF performance in general and the variabil-ity of MTF PMPM utilization and costs in particular. In broad terms, the study included a qualitative review of performance assessment in the nonmilitary health care sector, as well as a quantitative analysis of the variability of the sponsor’s PMPM metrics and the roles played by MTF size and catastrophic cases.
For our qualitative review, we surveyed academic and policy research relating to performance assessment in health care. We visited a large Army hospital that served nearly 53,000 non-active duty Prime enrollees in FYs 2004–2005, where we interviewed MTF line adminis-trators. We also conducted informal telephone interviews of experts in performance assessment at several private health care organizations.
This qualitative information helped guide the quantitative analy-ses, in which we were able to use two types of information:
MTF-level data from FYs 2004 through 2006 on MHS-wide •PMPM utilization and costs among TRICARE Prime beneficia-ries enrolled at 114 “parent” facilities in the United States1
disaggregate data for FY 2004 on admissions of Prime enrollees to •military and civilian hospitals, as well as the personal characteris-tics of these beneficiaries.
1 As discussed below, some MTFs (such as small clinics) are “children” of “parent” facilities.

xvi Assessing the Performance of Military Treatment Facilities
The analyses distinguished between inpatient, outpatient, and drug utilization. Active-duty personnel were excluded due to deployment-related data concerns.
We first analyzed MTF PMPM utilization and costs at both quarterly and annual frequencies. For each PMPM outcome at each MTF, we determined whether the change between FY 2006 and its mean level in FYs 2004–2005 was significant (as explained below). We then investigated the impact of an MTF’s size on the variability of its PMPM outcomes and the frequency of significant changes. We defined size as the mean number of non-active duty enrollees during FYs 2004–2005; in some analyses, we considered five groups of simi-larly sized MTFs. We also considered the role of trends across MTFs in PMPM outcomes.
Separately, we analyzed the role of catastrophic cases in MTF performance assessment based on hospital admissions. We defined admissions as catastrophic if their diagnosis groups were typically asso-ciated with high levels of resource use. We then explored the role that catastrophic admissions played in PMPM inpatient utilization during FY 2004. We also simulated the impact of excluding these admissions on the identification of significant changes in noncatastrophic inpa-tient utilization during FY 2006.
Findings
Our qualitative review of performance assessment in the nonmilitary health care sector indicates that a variety of factors systematically affect health care outcomes, including PMPM utilization and costs, costs per provider or clinical episode, and so on. The performance of health care managers is such a factor. In our context, MTF leaders cause more or less care to be provided and care to be delivered more or less effi-ciently. Thus, MTF outcomes may be useful measures of performance assessment.
Health status is another systematic determinant of health care out-comes, since those who are less healthy typically need and use more care than others. Practitioners and researchers frequently attempt to account

Summary xvii
for health status by “risk adjusting” outcomes. Indeed, OASD(HA)’s PMPM metrics incorporate enrollee age, gender, and beneficiary status (e.g., retiree or dependent of a retiree). Such risk adjustments, while useful, are necessarily imperfect. When performance measures do not fully account for systematic factors, such as health risk or deployment of medical personnel, there can be substantial bias in assessments of MTF performance. The practical importance of this issue was beyond the scope of this study.
Utilization and costs also vary randomly. Whatever their health status, people use less care than usual in some periods and more in others. As a result, an observer cannot be certain about the true cause of a change in outcomes. On some occasions, an observer will mistakenly conclude that a change is systematic when in fact it is random (“false positives”). In other cases, the observer will conclude that a systematic change is random (“false negatives”). In reality, big changes are some-times random noise, while small changes are sometimes meaningful.
An observer’s confidence that a change is truly systematic can be enhanced by requiring that an outcome increase (or decrease) by a large magnitude. When this threshold is exceeded, an observed change is “statistically significant.” A higher threshold for statistical significance results in fewer false positives, but more false negatives.
Given a confidence level, a lower rate of false negatives is desirable, because an observer has greater power to discern systematic changes. The false-negative rate is higher, however, when the randomness of an outcome is greater. PMPM utilization and costs may be more random at smaller MTFs, as there is less opportunity for enrollees’ random health care needs to balance out when there are fewer enrollees. Cata-strophic cases may also contribute substantially to the randomness of PMPM outcomes.
Table S.1 highlights some important findings concerning the fre-quency of statistical changes during FY 2006 when MTF outcomes are analyzed at a quarterly frequency. We found similar patterns (though generally higher frequencies) in the annual analysis. For outpatient uti-lization, drug utilization, and total cost, the frequency of significant changes was lower for the smallest MTFs than for the largest ones. For total cost, for example, the frequencies were 20.7 percent and 42.0 per-

xviii Assessing the Performance of Military Treatment Facilities
cent. Changes in costs would be statistically significant in 5 percent of cases (given the 95 percent confidence level) even if there were no changes in the systematic determinants of outcomes. As a result, the share of significant changes in cost that are false positives could be as high as one in four (5%/20.7% = 24.2%) for the smallest MTFs, versus less than one in eight (5%/42.0% = 11.9%) for the largest ones. Unfortunately, the associated false-negative rates are unknown because the actual changes in performance and other systematic factors are unknown (though it would be possible to simulate these rates under various assumptions).
For inpatient utilization, the frequency of significant changes is actually lower at the largest MTFs. One possible explanation for this is that inpatient utilization became less variable at these MTFs. Among all MTF outcomes, the frequency of significant changes is lowest for inpatient utilization. While these outcomes were especially variable, the other outcomes tended to grow faster throughout the MHS in FY 2006, potentially making changes easier to discern. It is possible that such trends are partly attributable to changing performance across MTFs.
We also found that catastrophic cases, such as organ transplants and low-birthweight deliveries, play an outsized role in inpatient utiliza-tion. Diagnoses that ranked high in resource use accounted for a much larger share of utilization than of admissions. There is some reason to believe that excluding such cases would substantially increase the fre-
Table S.1Frequency of Statistically Significant Changes in FY 2006 from FY 2004–2005 Mean Levels, Smallest MTFs Versus Largest MTFs
MTF Outcome Smallest MTFs Largest MTFs
Inpatient utilization 10.9% 3.4%
Outpatient utilization 19.6% 30.7%
Drug utilization 12.0% 15.9%
Total cost 20.7% 42.0%
NOTeS: The smallest MTFs averaged no more than 7,187 non-active duty enrollees during FYs 2004–2005; the largest MTFs averaged at least 27,911. The confidence level is 95 percent.

Summary xix
quency of statistically significant changes in noncatastrophic inpatient utilization. It is possible, however, that MTF performance in manag-ing catastrophic care is critical but hard to assess.
Altogether, our findings suggest that performance assessment of MTFs could be useful, though its effectiveness would generally be greater for larger facilities. Excluding catastrophic cases is practical and could be useful. In theory, systematic factors unrelated to performance could undermine the value of MTF outcomes as performance mea-sures, and the practical importance of this issue may merit investiga-tion. Finally, it is possible that alternatives, such as more targeted but complex assessments—for example, of cost per clinical episode—could help to diagnose MTF performance problems more reliably and to treat them more effectively.


xxi
Acknowledgments
We wish to acknowledge the assistance of MAJ Andrew Baxter, MAJ Mishaw Cuyler, and LTC Jean Jones, the programming of Stephanie Williamson, and the research assistance of Farrukh Suvankulov. We appreciate the support of project officers Robert Opsut and Pradeep Gidwani, as well as the assistance of Gregory Atkinson. John Adams and Kathleen Mullen provided valuable comments on this report; Dan Blum, Christine Eibner, Katherine Harris, Arvind Jain, and Jeanne Ringel provided helpful comments as this study progressed. Gordon Lee and Sydne Newberry assisted with communications; Nancy Good and Donna White helped with the document’s formatting. We also wish to acknowledge the personnel at military, public, and private enterprises who participated in our interviews. Privacy concerns pro-hibit disclosure of their identities, but their generous assistance contrib-uted greatly to this research.


xxiii
Abbreviations
DMIS ID Defense Medical Information System Identifier
DoD U.S. Department of Defense
DRG Diagnosis-Related Group
FY fiscal year
GAO U.S. Government Accountability Office
HCSR-I Health Care Service Record–Institutional
MHS Military Health System
MTF military treatment facility
OASD(HA) Office of the Assistant Secretary of Defense for Health Affairs
PMPM per member per month
RVU Relative Value Unit
RWP Relative Weighted Product
SIDR Standard Inpatient Data Record


1
ChAPTer ONe
Introduction
The mission of the Military Health System (MHS) is “to enhance the Department of Defense (DoD) and our Nation’s security by providing health support for the full range of military operations and sustaining the health of all those entrusted to our care” (MHS, 2007). DoD has increasingly confronted financial, managerial, and operational chal-lenges in achieving this mission, as health care costs have grown, the TRICARE health care benefit has expanded, and the MHS has sup-ported military operations in Afghanistan and Iraq. The success of the MHS in meeting these challenges is important to defense policymakers, TRICARE beneficiaries, and the broader public.
In the face of these challenges, the 2006 Quadrennial Defense Review charted a “Roadmap for Medical Transformation” (TRICARE Management Activity, 2006) that includes transforming MHS busi-ness practices through performance-based planning and financing. The two components of business transformation are
a strategic, comprehensive, performance-based planning process 1. for assessing goals and outcomes throughout the MHSfinancial processes that allocate health resources based on the 2. value of health care activities to the MHS mission and that align authority, accountability, and financial performance.
DoD-operated military treatment facilities (MTFs) may play a sig-nificant role in sustaining the TRICARE benefit through the efficient delivery of health care. DoD has considered allocating MHS funds to each service on the basis of the cost of efficiently delivered care (Opsut,

2 Assessing the Performance of Military Treatment Facilities
2006; TRICARE Management Activity, 2007b). Such an approach has been widely used in other settings to provide incentives to manage health costs. DoD has also considered setting utilization targets for MTFs and rewarding or penalizing MTFs for their performance with respect to the targets.
The Office of the Assistant Secretary of Defense for Health Affairs (OASD[HA]) has been monitoring utilization of TRICARE services and the associated costs “per member per month” (PMPM) among each MTF’s beneficiaries who are enrolled in Prime, TRICARE’s managed-care plan. We will refer to PMPM utilization and costs as MTF outcomes throughout this report. Changes over time in an MTF’s outcomes can be used as measures of the performance of its leaders in cost-effectively managing care. For example, in areas in which inpa-tient care is relatively costly at private hospitals, MTF leaders may be able to encourage enrollees to be treated at military hospitals with spare capacity.
Utilization and PMPM costs also depend on factors largely beyond the control of their leaders. The health status of an MTF’s enrollees sys-tematically affects PMPM utilization and costs. In addition, there is random variation in health-related outcomes. Enrollees whose health is fundamentally stable use less care than usual in some periods but more in others. For example, a healthy person will have occasional checkups and accidental injuries.
For PMPM outcomes to be useful measures of MTF perfor-mance, random changes in these outcomes must be distinguished from changes that are systematic in nature, such as changed performance. An observer can have some degree of confidence that an observed change is not due to random variation but is, rather, “statistically sig-nificant.” For a given change, the degree of confidence is greater when the random variability of the outcome is smaller.
Two factors are likely to affect the randomness of average MTF outcomes. First, PMPM utilization and costs may be highly variable at MTFs with small numbers of enrollees, because there is less opportu-nity for enrollees’ health needs to “balance out” at small MTFs than at large ones. Second, catastrophic cases (such as organ transplants or low-birthweight deliveries) may contribute substantially to the variabil-

Introduction 3
ity of average MTF outcomes, because these cases are too resource-intensive to be balanced out by noncatastrophic care.
The goal of this study is to help inform the sponsor’s thinking about MTF performance assessment in general and the variability of PMPM outcomes in particular. The study includes the following components:
a qualitative review of existing approaches by researchers and •practitioners to measuring performance within the nonmilitary health care sectoran analysis of the variability over time of PMPM utilization and •costs among MTFs’ Prime enrollees, with emphases on the poten-tial roles of
MTF size –catastrophic cases. –
This monograph describes the results of the study and is orga-nized as follows. Chapter Two summarizes the context for MTF per-formance assessment. Chapter Three offers an overview of performance assessment in nonmilitary health care and considers MTFs’ PMPM outcomes from this perspective. Chapter Four uses OASD(HA)’s data to assess the variability of MTF outcomes and to identify significant changes in recent years, while focusing on the role of MTF size. Chap-ter Five explores the role of catastrophic cases with additional data on enrollees’ hospital admissions. Chapter Six presents our conclusions.

5
ChAPTer TwO
The Context for Assessing the Performance of Military Treatment Facilities
In this chapter, we summarize the context for assessing the perfor-mance of MTFs. We characterize the mission of the MHS, explain the TRICARE benefit and its delivery, review the challenges confronting the MHS, and describe DoD’s potential strategy of assessing MTF performance.
The Mission of the Military Health System
The mission of the MHS is “to enhance the Department of Defense (DoD) and our Nation’s security by providing health support for the full range of military operations and sustaining the health of all those entrusted to our care” (MHS, 2007). This mission has three “pillars” (MHS, 2007):
Provide a medically ready and protected force and medical pro-•tection for communities. Create a deployable medical capability that can go anywhere, •anytime with flexibility, interoperability, and agility.Manage and deliver a superb health benefit.•
The focus of this study is on the third pillar, although benefit manage-ment and delivery are related to the other pillars directly supporting military capability.

6 Assessing the Performance of Military Treatment Facilities
The TRICARE Benefit
TRICARE beneficiaries include active-duty personnel and their depen-dents, military retirees and their dependents, some reservists and their dependents, and some survivors. At the end of fiscal year (FY) 2006, approximately 9.2 million individuals were eligible for TRICARE (TRICARE Management Activity, 2007a).
The benefit is delivered at DoD-operated MTFs and by civilian health care providers. These two sources of care are known as direct and purchased care, respectively. In FYs 2004 and 2005, the direct-care system included 117 “parent” MTFs in the United States (Atkin-son, 2007b).1 These MTFs serve populations diverse in size and benefi-ciary mix within the context of local health systems that are themselves diverse, for example, in the availability of purchased care.
The TRICARE benefit covers inpatient and outpatient care, as well as drugs. A number of plans are offered for beneficiaries who are not Medicare-eligible, with terms (including fees and deductibles) that differ across plans. TRICARE Prime is a managed-care plan, similar to a civilian health-maintenance organization. TRICARE Standard is a fee-for-service plan that offers greater flexibility in choosing providers but also imposes higher out-of-pocket costs. Standard beneficiaries can pay lower cost shares by receiving care from a provider who belongs to the TRICARE Extra network. Our focus here is on TRICARE Prime beneficiaries, because OASD(HA) has been monitoring utilization and costs among each MTF’s Prime enrollees.
TRICARE Prime beneficiaries are enrolled with a primary care manager, a health care provider who coordinates care, including refer-ral to specialists within the direct- or purchased-care systems. More beneficiaries enroll in MTFs than in the civilian network (Mathemat-ica Policy Research, 2007).
There is significant turnover in the total population of Prime enrollees at MTFs (Hanchate, McCall, and Ash, 2006). For exam-
1 MTFs may be “children” of a “parent” facility. For example, the Naval Branch Health Clinic at Naval Air Station North Island in Coronado, California, is child of Naval Medical Center San Diego. In a variety of settings including ours, data for child MTFs are “rolled up” to their parent facilities for reporting purposes.

The Context for Assessing the Performance of Military Treatment Facilities 7
ple, among 4.3 million Prime enrollees in FY 2002 for whom com-plete data were available, only 2.3 million were enrolled with the same primary care manager throughout FYs 2001 and 2002. We restrict our quantitative analysis to enrollees who are not active-duty person-nel, because deployments to Afghanistan and Iraq may complicate the accurate measurement of utilization and costs for active-duty enrollees. The extent of turnover in active-duty dependents and retirees and their dependents is unclear. The extent of any turnover in the health status of MTF enrollees is also unclear but important, because health status affects an enrollee’s typical health care needs and thus utilization and costs (see Chapter Three).
Active-duty personnel are required to enroll in Prime, and their dependents may do so with no fee or deductible. Retirees who are not Medicare-eligible may also choose to enroll for a fee of $230 for an individual or $460 for a family (TRICARE Management Activity, no date). There is no fee for those preferring to rely on TRICARE Stan-dard/Extra. Prime enrollees receive priority over other beneficiaries for care at MTFs.
The benefit is jointly managed and implemented by several DoD organizations. OASD(HA) oversees military medical care. The TRI-CARE Management Activity, a DoD field activity charged with the benefit’s administration, reports to OASD(HA). In addition, the Army, Navy, and Air Force have medical departments. These departments, each led by a Surgeon General, support the military pillars of the MHS mission while delivering the TRICARE benefit at their MTFs.
The delivery of care by MTFs is currently resourced through an activity group within the Defense Health Program’s appropriation for operation and maintenance, as well as a separate appropriation for the labor costs of military personnel (U.S. Department of Defense, Task Force on the Future of Military Health Care, 2007).2 The two lines of resources are allocated to the services for distribution to the MTFs and are not fungible for MTF leaders.
2 Another budget activity group funds base operations and communications relating to Defense Health Program facilities.

8 Assessing the Performance of Military Treatment Facilities
Challenges to the System
The MHS has confronted a variety of challenges in achieving its mis-sion. In recent years, the system has increasingly come under finan-cial stress. Between FYs 2000 and 2006, the unified medical budget increased from $17.4 billion to $38.5 billion (U.S. Department of Defense, Task Force on the Future of Military Health Care, 2007). The cost of medical care has escalated within the military, outpacing the increase in DoD’s overall budget (U.S. Government Accountabil-ity Office [GAO], 2007b). In addition to inflation and cost-increasing improvements in medical technology, expansions in the benefit have contributed substantially to growth in total expenditures. TRICARE for Life, which provides medical care to Medicare-eligible retirees and their dependents, is an example. Medical costs were 8 percent of DoD’s total budget in FY 2007 and are projected to be 12 percent of the total budget by 2015 if current trends continue (TRICARE Management Activity, 2007d).
The MHS has also been stressed operationally through its sus-tained support of military operations in Afghanistan and Iraq.3 Combat units have needed medical attention in preparing to deploy, the return-ing wounded require care, and medical personnel have themselves been deployed.
DoD’s Strategy
In the face of these challenges, the Quadrennial Defense Review has charted a “Roadmap for Medical Transformation” (MHS, 2007). This roadmap charts four activities: transforming the force, transforming the infrastructure, transforming the business, and sustaining the ben-efit. The relevant activity for this study—transforming the business—includes performance-based planning as well as performance-based financing.
3 The medical expenditures cited in the preceding paragraph do not include supplemental funding for the Global War on Terrorism in recent years. Global War on Terrorism funding for the MHS totaled $1.2 billion in FY 2006 (TRICARE Management Activity, 2007d).
The Context for Assessing the Performance of Military Treatment Facilities 9
Performance-based financing allocates health resources based on the value of activities to DoD’s mission while aligning authority and accountability for financial performance. As an example, DoD has con-sidered implementing a “prospective payment system” that would allo-cate resources to each service based on the cost of efficient care within the service’s MTFs, instead of the cost of resources used to deliver care in the past (TRICARE Management Activity, 2007b). DoD has also considered setting utilization targets for MTFs and rewarding or penalizing MTFs for their performance with respect to these targets (TRICARE Management Activity, 2007b).4 Both of these approaches suppose that MTF leaders are able to cost-effectively manage care, whether received from the enrollment MTF or elsewhere in the MHS, and therefore provide incentives to do so.5
Turning to performance-based planning, this element of business transformation calls for a strategic, comprehensive process for assessing goals and outcomes throughout the MHS.
DoD’s Per Member Per Month Metric for MTFs
The performance of MTF leaders in cost-effectively managing care is relevant to business transformation, and so performance measures are needed. OASD(HA) has been monitoring each MTF’s PMPM utilization and costs for its Prime enrollees (Atkinson, 2007a, 2007b; TRICARE Management Activity, 2007c). These metrics include all of the care received by an MTF’s enrollees, whether from the enroll-ment MTF, from other MTFs, or from civilian health care providers.
4 These initiatives also support the MHS’s strategic plan (MHS, 2007). For example, they are relevant to the objective in the MHS “balanced scorecard” of managing DoD health care costs and shaping and sustaining the benefit. This objective contributes to the high-priority goals of sustaining the military health benefit through cost-effective, patient-centered care and effective long-term patient partnerships, as well as transformation to performance-based management for both force health protection and delivery of the health care benefit.5 Investments in strategic assets, such as information systems, are also relevant. Informa-tion technology can support process improvements, such as more efficient scheduling or staffing, that help MTFs to perform better in managing care in a cost-effective manner (MHS, 2007).

10 Assessing the Performance of Military Treatment Facilities
OASD(HA) has considered the performance of each MTF’s leaders in cost-effectively managing care based on changes in PMPM utili-zation (TRICARE Management Activity, 2007b). The next chapter places these metrics in the context of outcome-based measures of per-formance in nonmilitary health care.

11
ChAPTer Three
Performance Assessment in Health Care
In this chapter, we provide an overview of performance assessment in health care. This overview is based on our qualitative review of exist-ing approaches, in which we surveyed academic and policy studies and interviewed leaders and analysts at several private health care organi-zations. We focus here on the example of Medicare costs by physician in order to help clarify the potential usefulness and limitations of per-formance assessment and, in doing so, to contextualize OASD(HA)’s metrics and what motivates our quantitative analyses of them.1
Outcomes and Performance
OASD(HA) has been monitoring outcomes, in particular, PMPM uti-lization and costs among Prime enrollees, at each MTF. In health care, education, and other settings, outcomes have regularly been used to assess various aspects of performance (Donabedian, 1988; Goldstein and Spiegelhalter, 1996). For example, hospital quality has been mea-sured on the basis of mortality rates, while the efficiency of general-ist physicians has been measured by total Medicare expenditures per patient (Office of Statewide Health Planning and Development, 2006; GAO, 2007a). Such measures, in order to be useful, must be influenced by performance.
1 Linden et al., 2003, also provide a useful review of these issues.

12 Assessing the Performance of Military Treatment Facilities
The example of average Medicare costs by physician can help clar-ify. GAO analyzed the percentage of generalist physicians who cared for Medicare patients with high total medical costs (GAO, 2007a). This study was motivated by existing evidence that patients’ overall care, and thus their total health care costs, are influenced by physicians, par-ticularly generalists (see, e.g., Consumer-Purchaser Disclosure Project, 2003). GAO found that certain physicians cared for a higher-than-expected share of high-cost patients. For example, 20.9 percent of gen-eralist physicians in Miami cared for such patients.
This finding suggests that a substantial number of physicians are “poor performers” in the costliness of their practice patterns. GAO con-cluded that the efficiency of the Medicare program could be improved by adopting a variety of practices that have been implemented by pri-vate health care payers, ranging from informing physicians about their performance relative to their peers to offering financial rewards to patients who choose efficient physicians. In reaching this conclusion, this outcome-based assessment of physician performance had to deal with several challenges to its reliability, which we consider in subse-quent sections of this chapter.
In the DoD context, PMPM utilization and costs are likely to be influenced by the performance of MTF leaders in cost-effectively man-aging care under the TRICARE benefit. These leaders may cause more or less care to be provided, and cause care to be delivered more or less efficiently. For example, in areas in which inpatient care is relatively costly at private hospitals, MTF leaders may be more or less effective in having enrollees treated at military hospitals with spare capacity. Insofar as such drivers of performance are important but hard for OASD(HA) to monitor directly, PMPM outcomes may be useful measures of MTF cost-effectiveness. These outcomes may also be influenced by quality of care; DoD uses a different set of performance measures to monitor this aspect of performance (TRICARE Management Activity, 2007a).
Just as Medicare might vest responsibility with generalist phy-sicians, so DoD might align accountability and authority in MTF leaders. Consistent with this notion (see Chapter Two), PMPM out-comes include all care that enrollees receive, whether from the enroll-ment MTF, from other MTFs, or from civilian health care providers.
Performance Assessment in health Care 13
DoD’s situation is like that of a managed-care organization (indeed, TRICARE Prime is conceived as DoD’s managed-care plan). These organizations sometimes contract with physician groups to care for beneficiaries, and PMPM utilization and costs are important metrics of performance in “covering lives” (McGlynn, Shekelle, et al., 2008). DoD also delivers care through its MTFs, and integrated delivery sys-tems (such as Kaiser Permanente) must assess performance and provide incentives within their organizations.
Accounting for Other Determinants of Outcomes
In order to be useful, outcome-based measures must also be reliable indicators of performance. In reality, other factors also affect outcomes. Outcome-based measures of performance can be unreliable if these other factors are important influences. We will distinguish between systematic and random determinants of outcomes.
Systematic Factors
In health care, systematic factors include performance but also, at a minimum, the health status of the relevant population. In an analysis of average patient costs by physician, a doctor could be high-cost only because his or her patients are in relatively poor health, thus needing more care. Inefficient physicians can then be reliably identified only if costs are adjusted for the health risk of each physician’s patients. The GAO study (2007a) did in fact adjust patient expenditures for health status based on a commercial technology also used to set payments for Medicare managed-care plans.
Such risk adjustment is widespread, although varied in implemen-tation (see, e.g., Huang et al., 2005). In another example, the state of California reports risk-adjusted mortality rates among hospitals’ patients, so that comparisons of hospital quality are not confounded by differences across hospitals in illness severity (Office of Statewide Health Planning and Development, 2006). In practice, risk adjust-ment is useful but nevertheless quite imprecise. For example, a person’s medical spending in one year explains only 20–25 percent of the varia-

14 Assessing the Performance of Military Treatment Facilities
tion in spending in a subsequent year (Newhouse, Buntin, and Chap-man, 1997).
Random Factors
There is also random variation in health care outcomes. A patient whose health is fundamentally stable nevertheless has some periods during which he or she receives some care and others in which he or she receives none; for example, a healthy patient will have occasional checkups and accidental injuries. In an analysis of average patient costs by physician, costs may differ among physicians, or for the same phy-sician over time, because the health care needs of patients differ over time. Conclusions about physician efficiency (or MTF performance) must deal with this issue.
Given such randomness, an observer can never be totally certain that variation in outcomes is due to systematic factors, including per-formance. In practice, an observer must decide on the level of confi-dence that he requires in order to conclude that observed variation in outcomes is systematic in nature. In plain language, the question he must ask himself is, “How likely is it that this different outcome is not due to chance?” In reality, both randomness and systematic fac-tors likely contribute to the observed changes. As a result, the mini-mum difference in outcomes that is required for the variation to be categorized as systematic follows from the “confidence level” and the outcome’s random variability. If the observed difference (whether posi-tive or negative) is larger than the required difference, the observer concludes that the variation is likely attributable to systematic factors. That is, in statistical terminology that we will use henceforward, the difference in outcomes is “statistically significant.”
In such an exercise, an observer would occasionally make mistakes. In some instances, he would mistakenly conclude that the observed variation is statistically significant and thus systematic in nature, when in fact it is due to random chance. Such errors are known as “false positives.” In other instances, he would mistakenly conclude that the variation is insignificant and thus random, when in fact it is due to sys-tematic factors. These errors are known as “false negatives.”

Performance Assessment in health Care 15
An observer can reduce the rate of false negatives by increasing the rate of false positives. For example, if 95 percent confidence were required, then the observer would encounter statistically significant variation in 5 percent of cases as a matter of chance, when there is in fact no systematic variation in outcomes. That is, the false-positive rate would be 5 percent. If the confidence level decreased to 90 percent, the required variation would shrink in magnitude, and the false-positive rate would increase to 10 percent. Truly systematic variation would then be more likely to exceed the larger threshold, and the rate of false negatives would decrease. An observer must make a tradeoff between the two types of errors based on his judgment about the harms from each.
For any confidence level (and thus for any false-positive rate), a lower rate of false negatives is desirable. An observer then has greater power to discern systematic variation in outcomes. As the randomness of an outcome grows, the rate of false negatives (given the confidence level) also grows. For this reason, random variability undermines the effectiveness of performance assessment.
Variability due to random factors tends to decrease with the number of patients (or enrollees) when costs or other outcomes are averaged. The reason is that the random components of patient out-comes tend to “balance out” during any period, with those experienc-ing relatively low outcomes offsetting those experiencing high ones. This phenomenon means that the minimum difference in outcomes required for statistical significance (given a confidence level) becomes smaller as the number of patients or enrollees grows. From a somewhat different yet consistent perspective, an observer’s confidence that an observed difference is significant becomes larger with size. Appendix A provides a more formal discussion of statistical issues related to perfor-mance assessment.
In the GAO (2007a) study, the medical costs of a physician’s patients (accounting for their health status) could be high either because the physician was inefficient or because his or her patients’ health care

16 Assessing the Performance of Military Treatment Facilities
needs turned out to be larger than average during the period studied.2 GAO set thresholds for the proportion of physicians’ patients who would be high-cost due to chance, based on the distribution of all patients’ costs within each metro area studied. The GAO then concluded that some physicians in the area were inefficient because the percentage of physicians with high-cost patients exceeded this threshold.3 Physicians with small Medicare practices were excluded from the analysis, because limited numbers of patients could lead to unreliable assessments. Based on a similar concern, mortality rates for California hospitals have not been reported for hospitals with relatively few patients (Office of State-wide Health Planning and Development, 2006).
Assessing MTF Performance Based on Outcomes
OASD(HA) has been monitoring each MTF’s PMPM utilization and costs among Prime enrollees. Based on these metrics, it has contem-plated whether to formally assess the performance of each MTF by comparing current performance with past levels, that is, by identify-ing changes in an MTF’s performance over time. In the remainder of this chapter, we place this potential framework in the context of per-formance assessment in nonmilitary health care, while motivating the quantitative analyses of PMPM outcomes that follow.
Among health researchers and practitioners, identifying changes in the performance of providers or plans is less common than identify-ing differences in performance among them (GAO, 2007a; McGlynn, Shekelle, et al., 2008). Our interviews of representatives of several pri-vate health care organizations reinforced this judgment. Yet researchers have analyzed performance over time (see, e.g., Marshall, 1988; Bron-skill et al., 2002).
2 Health status can also be an explanation insofar as risk adjustment of patient expendi-tures is imperfect.3 Thresholds were set so that 1 percent of physicians would be expected to have an excessive proportion of high-cost patients, assuming that patients were equally likely to receive care from all physicians. In every area, some physicians were inefficient.

Performance Assessment in health Care 17
Identifying performance differences among MTFs could lead to different results than identifying performance changes at MTFs. Under the latter approach, MTFs might cycle over time between better and worse performance, if leaders believe that the likely benefits of improvements are more important than the costs of decreased perfor-mance.4 These alternative benchmarks may raise additional issues of effectiveness and equity. Identifying performance changes at MTFs could result in large increases in performance among weak performers with substantial opportunities for improvement, and favorable assess-ments of these facilities; identifying performance differences among MTFs could result in relatively favorable assessments of historically strong performers. Each of these possibilities is desirable, though there is likely to be a tradeoff between them. Performance can be assessed according to both benchmarks simultaneously, as, for example, with the “value-based” purchasing program that Medicare has proposed for reimbursing hospitals (U.S. Department of Health and Human Ser-vices, Centers for Medicare and Medicaid Services, 2007).
Systematic Factors Other Than Performance
Whatever the benchmark, there can be incentives under outcome-based assessment to “game” the system based on factors other than performance. For example, hospitals may respond to “report cards” on health outcomes by restricting treatment of sicker patients (Dra-nove et al., 2003). Similarly, MTFs may be able to appear to improve their performance, without actually doing so, by limiting enrollment of sicker beneficiaries.5
4 We do not maintain that MTF leaders will behave in this fashion, only that such behav-ior is possible and potentially important. Understanding the response of MTF leaders to per-formance assessment is beyond the scope of this study but important. It may also be difficult. In any event, these responses are likely to be influenced by how DoD uses its performance assessments; this issue has not been decided.5 If DoD were to compare performance among MTFs, each facility might be compared against its “peers,” that is, facilities with similar characteristics (for example, service or size). It is possible that MTFs could alter some characteristics (for example, size) so as to be com-pared with a lower-performing peer group.
18 Assessing the Performance of Military Treatment Facilities
OASD(HA)’s potential framework deals with systematic factors other than performance in two ways. First, the utilization and costs of each member (that is, enrollee) are risk adjusted (TRICARE Manage-ment Activity, 2007c). OASD(HA) standardizes each enrollee into an “equivalent life” based on age, gender, and beneficiary category (e.g., active-duty family member). This approach, while practical and useful, is less sophisticated than other forms of risk adjustment, which are themselves imperfect (Hanchate, McCall, and Ash, 2006; Newhouse, Buntin, and Chapman, 1997).
Second, identifying changes over time may help purge PMPM outcomes of the influence of other systematic factors. Suppose, for example, that systematic factors include deployments of medical per-sonnel as well as performance. Deployed personnel may have relatively efficient or inefficient practice patterns, or their absence may require that enrollees receive care from relatively low- or high-cost civilian providers, particularly in some important clinical specialties. If the number and characteristics of personnel who treat an MTF’s enrollees are stable over time, then statistically significant changes in PMPM outcomes at an MTF must be due to changed performance.6 This fea-ture of OASD(HA)’s potential framework can be helpful when factors such as deployments are difficult to accurately monitor. A quantita-tive analysis of the effectiveness of these two methods for dealing with other systematic factors was beyond the scope of this study.
Random Variability in PMPM Outcomes
Random factors also lead to changes over time in MTFs’ PMPM uti-lization and costs. As we discussed, enrollees’ health care needs during any period are inherently random. In addition, instability in system-atic factors that OASD(HA) is unable to monitor contributes to varia-tion in outcomes; from OASD(HA)’s perspective, this variation is also random. Deployment of medical personnel is a potential example. If deployment is not stable over time, and if deployment is independent of MTF managers’ performance given the resources available, statistically significant changes in PMPM outcomes must still be due to changed
6 We consider the possibility that other systematic factors are unstable momentarily.

Performance Assessment in health Care 19
performance. OASD(HA) would, however, require a larger change in outcomes for significance, given its desired confidence level. If deploy-ment were not independent of performance, then significant changes could be due to deployment rather than performance; furthermore, deployment could obscure changes in performance.
This random variability is central to the quantitative analyses that follow. PMPM utilization and costs are averaged over the number of equivalent lives enrolled at each MTF. As we explain in the next chap-ter, the average number of Prime enrollees (excluding active-duty per-sonnel) ranged from 824 at the smallest parent MTF to 85,109 at the largest parent MTF during FYs 2004 and 2005. As noted earlier in this chapter, the random variability of PMPM outcomes is likely to be greater at smaller MTFs. We therefore analyze in Chapter Four the impact of MTF size on the variability of PMPM outcomes, the magni-tude of changes required for statistical significance, and the frequency with which observed changes are significant.
To be clear, we do not focus on the impact of MTF size on the levels of PMPM outcomes. This “volume-outcome” relationship may be important in our context, as it is in others (see, for example, Luft, Hunt, and Maerki, 1987). The scope of the present study, however, is to compare each MTF’s current performance with its past performance; MTF size is only relevant due to its potential impact on the variability of outcomes.
Catastrophic cases, such as organ transplants and low-birthweight deliveries, also contribute to the random variability of PMPM out-comes. As a result, these resource-intensive cases may make the identi-fication of systematic changes in outcomes more difficult. Appendix A provides numerical examples of the potential impacts of catastrophic cases and MTF size on performance assessment. In Chapter Five, we explore the actual role of catastrophic cases in PMPM inpatient utiliza-tion. Excluding catastrophic cases may be useful, yet the practicality of doing so using MHS data systems is uncertain. We also explore this issue.

20 Assessing the Performance of Military Treatment Facilities
PMPM Outcomes Versus Episode-Based Performance
Assessing MTF PMPM utilization and costs contrasts with another broad framework for performance assessment in health care. Under this alternative, the cost or quality of “episodes” of care is assessed (GAO, 2007a). These episodes bundle together a “block of one or more medical services received by an individual during a period of relatively continuous contact with one or more providers of service, in relation to a particular medical problem or situation” (Solon et al., 1967). A cata-strophic case at a hospital is not conceptually equivalent to an episode of care, because an episode may include multiple encounters with mul-tiple health care providers.
While our quantitative analyses were limited in scope to PMPM outcomes, the advantages and disadvantages of episode-based perfor-mance assessment nevertheless merit discussion. Administrative com-plexity is a disadvantage of the episode-based approach. Data on care delivered by different providers on different occasions, if available, must be accurately linked into episodes.
Episode-based performance assessment has other disadvantages. First, the utilization of alternative treatments may not be measured accurately, depending on how episodes are defined. For example, the beginning of a new episode of a recurring problem may be identified by a doctor’s visit with the relevant diagnosis, even though the patient had recently been taking medication for the problem. Second, effective prevention strategies reduce the need for treatment, potentially lower-ing costs and improving health. This aspect of performance may not be captured by an analysis of treatment episodes; PMPM costs do reflect all aspects of performance.
An advantage of episode-based performance assessment is that the results may be relatively “actionable.” For example, evidence that costly and invasive procedures are used for coronary care where drug therapy is appropriate could help in diagnosing and treating an MTF’s “cost problem.” Yet OASD(HA) would not need such information if MTF leaders had access to equivalent information and appropriate incentives to use it.
Another potential advantage is that episodes are defined for spe-cific medical conditions. Thus, differences in the mix of beneficiaries’

Performance Assessment in health Care 21
medical conditions would not systematically affect MTF performance assessments, making this approach relatively reliable. Furthermore, the occurrence of episodes is somewhat random. This randomness does not affect performance assessments based on actual episodes. Under this approach, then, it may be possible to identify more statistically signifi-cant differences in performance. It is also possible, however, that MTF leaders are able to manage the incidence of some medical conditions or the occurrence of certain episodes of care. If so, DoD might wish to assess performance in these dimensions but could not use the episode-based approach to do so.

23
ChAPTer FOur
Performance Assessment and MTF Size
This chapter explores changes in MTF outcomes over time based on OASD(HA)’s metrics for FYs 2004–2006, focusing in particular on the role of MTF size. We first describe the data set and then the analy-sis sample and outcomes. After characterizing MTF size, we describe the relationship between outcomes and size. We then assess changes in MTF outcomes over time. We also consider some additional issues, including the confidence level for statistically significant changes, per-formance assessment of Services as a whole, the length of the assess-ment period, and assessment relative to MHS trends. Chapter Five will explore the role that catastrophic cases play in assessing MTFs based on additional data.
Data Set on MTF Outcomes
OASD(HA) shared its data set on PMPM outcomes from the first quarter of FY 2004 through the second quarter of FY 2007 (Atkinson, 2007a, 2007b).
This data set includes the numbers of Prime enrollees and equiva-lent lives, as well as total utilization and costs among Prime enrollees, for parent MTFs on a monthly basis. Each of these fields is reported by beneficiary class, including active-duty personnel, the dependents of active-duty personnel, and retirees and their dependents.
Utilization is disaggregated into inpatient care, outpatient care, and drugs. Inpatient utilization is based on Relative Weighted Prod-ucts (RWPs), a DoD measure of workload that represents the rela-

24 Assessing the Performance of Military Treatment Facilities
tive resource consumption of patients’ hospitalizations (DoD, 2002). Outpatient utilization is based on Relative Value Units (RVUs), a val-uation or rating of physician services on the basis of relative physi-cian resource inputs to provide medical services (TRICARE Manage-ment Activity, 2002). Drug utilization is measured by the number of 30-day-equivalent prescriptions filled.
These measures are used in both military and nonmilitary health care settings to measure resource use across varied clinical circum-stances. For example, if two MTFs provide a hospital stay where one is for pneumonia while the other is for an organ transplant, the RWP measure of inpatient utilization will be higher (all else equal) at the latter MTF, as is appropriate.
Utilization and costs “roll up” (that is, include) all care received by each MTF’s enrollees, whether from the enrollment MTF, from other MTFs, or from civilian health care providers.
Analysis Sample and Outcomes
We analyze 114 parent MTFs located in the United States that appeared in the data set in every month.1 A complete list of these MTFs can be found in Appendix B.
Table 4.1 summarizes the outcomes we analyze, which include inpatient, outpatient, and drug utilization. OASD(HA)’s think-ing about MTF performance assessment has focused on utilization (Opsut, 2006). We also consider total costs, as these data were readily available.
OASD(HA) currently monitors monthly inpatient utilization (RWPs) per 1,000 equivalent lives, monthly outpatient utilization (RVUs) per 100 equivalent lives, monthly scripts (30-day-equivalents) per 100 equivalent lives, and annual total cost per equivalent life. As explained in Chapter Three, equivalent lives standardize enrollees according to their health risk.
1 Three MTFs did not appear in the data during at least one month.

Performance Assessment and MTF Size 25
In our benchmark analysis, we use quarterly averages of these monthly outcomes. We also analyze annual averages later in this chapter. There is a potential tradeoff between a higher frequency of assess-ment and greater confidence in the results due to less variability in the assessed outcomes.
MTF Size
As we explained in the last chapter, MTF size may affect the variability of PMPM outcomes and thus the frequency with which statistically significant changes can be identified.
Table 4.2 summarizes mean enrollment and equivalent lives at these MTFs during FYs 2004–2005. We restrict our analysis to the dependents of active-duty personnel and retirees and their dependents, because OASD(HA) raised concerns about measurement error for active-duty personnel arising from deployments in support of military operations in Afghanistan and Iraq. The table therefore distinguishes between total and non-active duty enrollment and equivalent lives.
MTFs differ greatly in their size during FYs 2004–2005. In our analyses, we will follow Hanchate, McCall, and Ash (2006) in defining MTF size by the number of Prime enrollees. Because we exclude active-duty personnel from our quantitative analyses, we use the number of
Table 4.1MTF Outcomes Among Non-Active Duty TRICARE Prime Enrollees, FYs 2004–2005
Monthly Inpatient Utilization per
1,000 Equivalent Lives
Monthly Outpatient
Utilization per 100 Equivalent
Lives
Monthly Scripts per 100
Equivalent Lives
Annual Total Cost per Equivalent
Life
Mean 6.15 64.1 99.3 $2,351
Minimum 2.07 46.5 65.8 $1,709
Maximum 26.37 114.9 143.4 $6,904
NOTe: Outcomes are measured at quarterly frequency and averaged over FYs 2004–2005.

26 Assessing the Performance of Military Treatment Facilities
non-active-duty enrollees.2 MTF size ranged from a minimum of 824 enrollees to a maximum of 85,109 enrollees, that is, by a factor of more than 100.
In much of our analysis, we will characterize size according to five groups of similarly sized MTFs. The first group includes the small-est 20 percent of MTFs, which we refer to as the first (or smallest) size “quintile.” The second quintile includes the next smallest 20 percent of MTFs. The third and fourth quintiles are defined similarly. The fifth and largest quintile includes the largest 20 percent of MTFs. Table 4.3 reports the size range associated with each quintile; Appendix Table B.1 lists MTFs in order of non-active duty enrollment.
The Relationship Between the Variability of MTF Outcomes and Their Size
With data on outcomes throughout FYs 2004–2006, we can identify statistically significant changes in each MTF’s outcomes in 2006 from their 2004–2005 means. Such changes are deemed to be systematic (i.e., nonrandom) in nature and potentially due to changed perfor-mance. We estimate the random variability of outcomes based on the data for FYs 2004–2005.
2 The relative sizes of MTFs are very similar under the alternative possible measures in Table 4.2, with correlation coefficients with the number of total enrollees in excess of 0.97.
Table 4.2MTF Prime Enrollment and Equivalent Lives, FYs 2004–2005
Statistic
Enrollment Equivalent Lives
Total Non-Active Duty Total Non-Active Duty
Mean 26,728 18,367 27,219 19,792
Minimum 3,837 824 3,989 821
Maximum 121,079 85,109 116,328 89,339
NOTe: Outcomes are measured at quarterly frequency and averaged over FYs 2004–2005.

Performance Assessment and MTF Size 27
Figure 4.1 illustrates inpatient utilization at DeWitt Army Com-munity Hospital during the eight quarters in FYs 2004–2005. The mean level during this period (which corresponds to the horizontal line in the figure) was 3.16 RWPs per 1,000 equivalent lives. Utiliza-tion in each quarter (which corresponds to the dots in the figure) varied randomly—and substantially—around this mean. Thus, as Chapter Three explained, an observer could not have had complete confidence that a change in utilization in 2006 from its 2004–2005 mean was sta-tistically significant, that is, deemed to be systematic in nature.
We will characterize the variability of each outcome by its standard deviation, a statistical measure defined and explained in Appendix A. To begin with, we cannot, as a practical matter, illustrate the variability of each outcome at each of the more than 100 MTFs analyzed with its own figure. More importantly, the standard deviation appears in the formula that determines statistical significance.
Figures 4.2–4.5 illustrate the relationship between size and the standard deviations of inpatient utilization, outpatient utilization, drug utilization, and total cost among the MTFs analyzed.3 In these figures, dots correspond to MTFs, while a line shows the overall trend. For
3 We estimate MTF-specific means and standard deviations using the eight quarters of available data in order to obtain a reliable estimate for each. It is possible that there are trends in both the mean and standard deviations for each MTF that would be observable if these calculations were updated, for example, over the most recent eight quarters.
Table 4.3Range of MTF Sizes in Each Size Quintile
Size Quintile Size Range
1 (smallest) 824–7,187
2 7,403–10,990
3 11,030–16,890
4 17,569–27,828
5 (largest) 27,911–85,109
NOTe: Size quintiles are defined by mean non-active duty Prime enrollment in FYs 2004–2005.

28 Assessing the Performance of Military Treatment Facilities
each outcome, standard deviations tend to decrease with MTF size. This pattern is consistent with the hypothesis from Chapter Three that there is greater opportunity for enrollees’ health care needs to balance out at MTFs with relatively large numbers of enrollees.
The variability of an outcome might tend to shrink or grow with its mean level. The seemingly small standard deviations at large MTFs in Figures 4.2–4.5 could then be large in comparison with mean outcomes, if their mean levels strongly decreased with MTF size. Figures 4.6–4.9 illustrate the relationship between MTF size and mean outcomes. Mean outpatient utilization tended to decrease slightly with MTF size. For the other outcomes, mean levels increased with size. These trends could be attributable to size-associated differ-ences in the efficiency of care, to unmeasured heterogeneity in enrollee health status, or to measurement error. At the sponsor’s request, we explore the size relationship for outpatient utilization in Appendix C.
Figure 4.1Actual and Mean Inpatient Utilization at DeWitt Army Community Hospital, FYs 2004–2005
ActualMean
2.5
3
3.5
Inp
atie
nt
uti
lizat
ion
2004 2005 2006Year–quarter
RAND MG803-4.1

Performance Assessment and MTF Size 29
Figure 4.2Standard Deviations of Inpatient Utilization and MTF Size, FYs 2004–2005
Actual Fitted
0
1
2
3
Stan
dar
d d
evia
tio
n o
f in
pat
ien
t u
tiliz
atio
n
0 20,000 40,000 60,000 80,000
Non-active duty enrollmentRAND MG803-4.2
Figure 4.3Standard Deviations of Outpatient Utilization and MTF Size, FYs 2004–2005
Actual Fitted
0
5
10
20
15
Stan
dar
d d
evia
tio
n o
f o
utp
atie
nt
uti
lizat
ion
0 20,000 40,000 60,000 80,000
Non-active duty enrollmentRAND MG803-4.3

30 Assessing the Performance of Military Treatment Facilities
Figure 4.5Standard Deviations of Total Cost and MTF Size, FYs 2004–2005
Actual Fitted
0
200
400
800
600
Stan
dar
d d
evia
tio
n o
f to
tal c
ost
0 20,000 40,000 60,000 80,000
Non-active duty enrollmentRAND MG803-4.5
Figure 4.4Standard Deviations of Drug Utilization and MTF Size, FYs 2004–2005
2
4
6
8
10
12Actual Fitted
Stan
dar
d d
evia
tio
n o
f d
rug
uti
lizat
ion
0 20,000 40,000 60,000 80,000
Non-active duty enrollmentRAND MG803-4.4

Performance Assessment and MTF Size 31
Figure 4.6Mean MTF Inpatient Utilization and Size, FYs 2004–2005
0
5
10
15
20
25 Actual Fitted
Mea
n in
pat
ien
t u
tiliz
atio
n
0 20,000 40,000 60,000 80,000
Non-active duty enrollmentRAND MG803-4.6
Figure 4.7Mean MTF Outpatient Utilization and Size, FYs 2004–2005
Actual Fitted
40
60
80
120
100
Mea
n o
utp
atie
nt
uti
lizat
ion
0 20,000 40,000 60,000 80,000
Non-active duty enrollmentRAND MG803-4.7
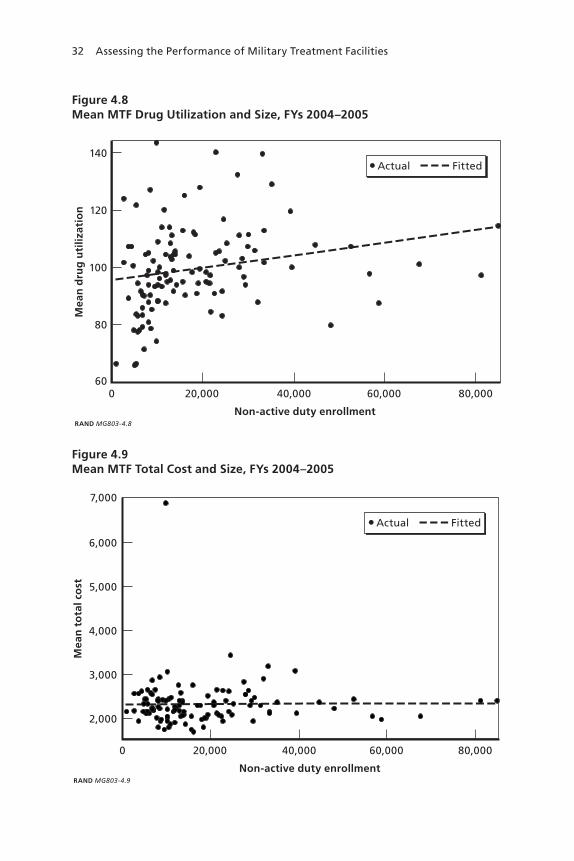
32 Assessing the Performance of Military Treatment Facilities
Figure 4.8Mean MTF Drug Utilization and Size, FYs 2004–2005
Actual Fitted
60
80
100
140
120
Mea
n d
rug
uti
lizat
ion
0 20,000 40,000 60,000 80,000
Non-active duty enrollmentRAND MG803-4.8
Figure 4.9Mean MTF Total Cost and Size, FYs 2004–2005
Actual Fitted
2,000
3,000
4,000
7,000
6,000
5,000
Mea
n t
ota
l co
st
0 20,000 40,000 60,000 80,000
Non-active duty enrollmentRAND MG803-4.9

Performance Assessment and MTF Size 33
The explanation for the trends in the other outcomes, while potentially important, was beyond the scope of this study.
Assessing Changes in MTF Outcomes
We are able to formally assess the changes in outcomes observed over the four quarters of 2006.
For each outcome at each MTF, we determine the magnitude of the change required during FY 2006 for statistical significance with 95 percent confidence based on its estimated mean and standard devia-tion during FYs 2004–2005. These changes are defined in percentage terms, because mean outcomes tended to vary with MTF size (see Fig-ures 4.6–4.9).
The required changes are described in Table 4.4, with detailed results reported in Appendix B. Among all MTFs, inpatient utilization would have to increase (or decrease) by at least 28.2 percent on average for a change to be deemed systematic in nature rather than random. The average changes required for statistical significance were 15.3 per-cent, 10.4 percent, and 16.9 percent for outpatient utilization, drug
Table 4.4Percentage Change in Outcome Required for Statistical Significance, Mean by MTF Size Quintile
Size Quintile
InpatientUtilization
OutpatientUtilization Drug Utilization Total Cost
All 28.2 15.3 10.4 16.9
1 (smallest) 41.8 18.6 12.1 20.1
2 31.3 18.0 9.9 19.6
3 24.3 13.0 9.9 14.2
4 22.7 14.8 10.9 15.1
5 (largest) 20.7 11.8 9.2 15.4
NOTeS: The confidence level is 95 percent. Size quintiles are defined by mean non-active duty Prime enrollment in FYs 2004–2005; see Table 4.3.

34 Assessing the Performance of Military Treatment Facilities
utilization, and total cost, respectively. Larger changes are required for inpatient utilization because its random variability is relatively great.4
For each outcome, the required changes tend to decrease in mag-nitude with MTF size. For example, outpatient utilization would have to increase (or decrease) by more than 18.6 percent on average for the smallest quintile of MTFs, but by only 11.8 percent for the largest quin-tile. This pattern is consistent with the earlier finding that the standard deviations of outcomes tended to decrease with MTF size, while their mean levels did not.
The reduction in required changes with size is especially pro-nounced for inpatient utilization, decreasing from 41.8 percent for the smallest MTFs to 20.7 percent for the largest. This pattern is consistent with the substantially larger changes required for inpatient utilization among all MTFs. These findings suggest that the enhanced opportu-nity for enrollees’ inpatient care to balance out at larger MTFs may be especially important for inpatient utilization.
We are able to identify statistically significant differences in MTF outcomes from their 2004–2005 means during the quarters of FY 2006. Table 4.5 reports the frequency of MTF-quarters with sta-tistically significant changes.5 For example, among all MTFs, inpa-tient utilization was significantly different from the 2004–2005 mean in 10.1 percent of MTF-quarters; the frequencies were 26.1 percent, 19.3 percent, and 32.9 percent for outpatient utilization, drug utiliza-tion, and total cost, respectively. Given a 95 percent confidence level, we would expect 5 percent of observed changes to be deemed signifi-cant by chance when there is no change in the systematic determinants
4 Indeed, the magnitude of these changes may raise a concern that some of this variability is systematic rather than random. As we noted in Chapter Three, significant changes would correspond to changes in performance if performance were independent of the systematic factor that is contributing to the outcome’s variability.5 Statistical significance was determined based on two-sided hypothesis tests (Amemiya, 1994). Such tests are appropriate for identifying changes in outcomes in either direction, consistent with the project sponsor’s interest in monitoring any changes in performance. Changes in only one direction can also be relevant, for example, if health care providers are rewarded for improvements in performance. In such a context, a one-sided test would be appropriate.
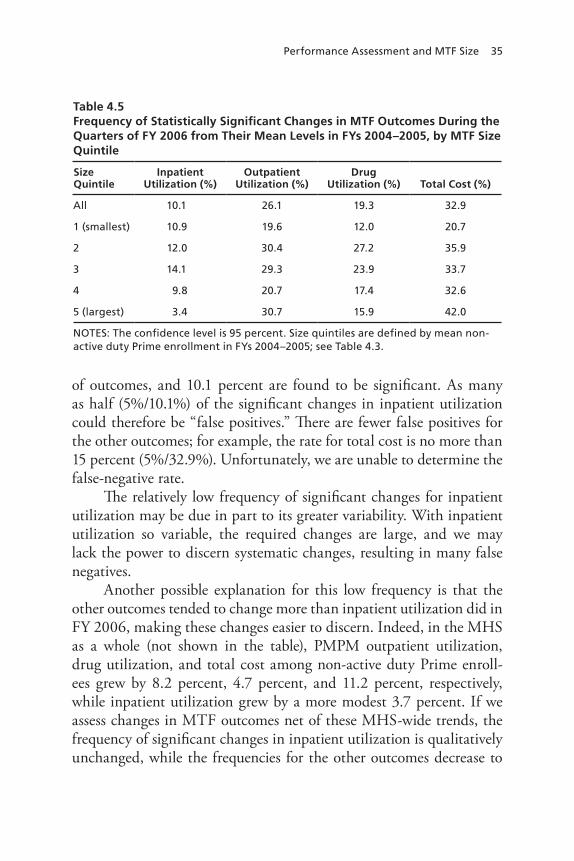
Performance Assessment and MTF Size 35
of outcomes, and 10.1 percent are found to be significant. As many as half (5%/10.1%) of the significant changes in inpatient utilization could therefore be “false positives.” There are fewer false positives for the other outcomes; for example, the rate for total cost is no more than 15 percent (5%/32.9%). Unfortunately, we are unable to determine the false-negative rate.
The relatively low frequency of significant changes for inpatient utilization may be due in part to its greater variability. With inpatient utilization so variable, the required changes are large, and we may lack the power to discern systematic changes, resulting in many false negatives.
Another possible explanation for this low frequency is that the other outcomes tended to change more than inpatient utilization did in FY 2006, making these changes easier to discern. Indeed, in the MHS as a whole (not shown in the table), PMPM outpatient utilization, drug utilization, and total cost among non-active duty Prime enroll-ees grew by 8.2 percent, 4.7 percent, and 11.2 percent, respectively, while inpatient utilization grew by a more modest 3.7 percent. If we assess changes in MTF outcomes net of these MHS-wide trends, the frequency of significant changes in inpatient utilization is qualitatively unchanged, while the frequencies for the other outcomes decrease to
Table 4.5Frequency of Statistically Significant Changes in MTF Outcomes During the Quarters of FY 2006 from Their Mean Levels in FYs 2004–2005, by MTF Size Quintile
Size Quintile
InpatientUtilization (%)
OutpatientUtilization (%)
Drug Utilization (%) Total Cost (%)
All 10.1 26.1 19.3 32.9
1 (smallest) 10.9 19.6 12.0 20.7
2 12.0 30.4 27.2 35.9
3 14.1 29.3 23.9 33.7
4 9.8 20.7 17.4 32.6
5 (largest) 3.4 30.7 15.9 42.0
NOTeS: The confidence level is 95 percent. Size quintiles are defined by mean non-active duty Prime enrollment in FYs 2004–2005; see Table 4.3.

36 Assessing the Performance of Military Treatment Facilities
levels comparable to inpatient utilization. This analysis is described in greater detail later in this chapter. The results suggest that performance assessment might have been as effective for inpatient utilization as for other outcomes, if MHS-wide trends had been comparable across out-comes. Yet these trends, and the differences among them, could have been the result of deteriorating performance across MTFs, as well as factors beyond the control of MTF leaders.
Table 4.5 also shows the frequency of significant changes by MTF size. Insofar as variability, and thus required changes, tends to decrease with size (Table 4.4), the frequency of significant changes may be lower at smaller MTFs. We find such a pattern for outpatient utilization, drug utilization, and total cost. For example, changes in total cost were significant in 20.7 percent of cases for the smallest MTFs but in 42.0 percent of cases for the largest. As a result, the share of significant changes that are false positives cannot be higher for the smallest MTFs than for the largest ones. For total cost, this share is as much as one-quarter (5%/20.7% = 24.2%) for the smallest MTFs, versus less than one-eighth (5%/42.0% = 11.9%) for the largest ones.
For inpatient utilization, by contrast, the frequency of signifi-cant changes increases from 10.9 percent among the smallest MTFs to 14.1 percent among moderately sized MTFs (quintile 3) but then decreases to only 3.4 percent at the largest MTFs. Differential trends in utilization growth by MTF size cannot account for this unexpected pattern. Utilization grew less at the smallest MTFs than at the largest ones (2.5 percent on average, versus 3.6 percent). One possible expla-nation is that the random variability of inpatient utilization changed between FYs 2004–2005 and FY 2006. Among the smallest MTFs, the estimated standard deviation was 61 percent larger on average in FY 2006 than in FYs 2004–2005; among the largest MTFs, the stan-dard deviation increased by only 27 percent.6 As a result, we are able to
6 These estimates are biased in finite samples. However, even with only the four quarters of FY 2006, the bias is modest. The statistics just presented should tend to understate the growth rate of the standard deviations, because the downward bias is greater in the period with fewer observations. In any event, this bias does not affect the identification of systematic changes. See Greene, 2003, p. 165.

Performance Assessment and MTF Size 37
discern fewer significant changes at the largest MTFs than we would have otherwise expected.7
Finally, we can describe the frequency with which there were significant differences from 2004–2005 levels during more than one quarter in 2006. Table 4.6 describes these frequencies. For inpatient utilization, there were significant changes at 33 MTFs. Among these MTFs, there were significant changes in all four quarters in 1 out of 33, or 3.0 percent, of cases. There were significant changes in costs at more MTFs, and they were more likely to be changes in multiple quar-ters. Of 62 MTFs with at least one significant change in costs, 10 of them, or 16.1 percent, had changes in all quarters.
7 Appendix Table B.6 compares the variability of all outcomes in FYs 2004–2005 and FY 2006. Standard deviations increased over time for all outcomes. Only in the case of inpa-tient utilization did standard deviations grow by less at the largest MTFs than at the small-est ones. For outpatient utilization and total cost, they grew more at the largest MTFs than at the smallest ones, reinforcing the tendency (given their relatively low variability at large MTFs in FYs 2005–2006) to find more significant changes in these outcomes at large MTFs than at small ones.
Table 4.6Number of MTFs with Statistically Significant Changes in Outcomes, by Number of Quarters in FY 2006 with Significant Changes
Number of Quarters with Significant Changes
InpatientUtilization
OutpatientUtilization
Drug Utilization Total Cost
0 81 54 62 52
1 23 22 25 14
2 8 18 19 18
3 1 19 7 20
4 1 1 1 10
NOTe: The confidence level is 95 percent.

38 Assessing the Performance of Military Treatment Facilities
Additional Issues
We now describe the results of some additional analyses of MTF PMPM utilization and costs among non-active duty TRICARE Prime enroll-ees. In particular, we analyze (1) statistically significant changes in these MTF outcomes based on a 90 percent confidence level; (2) changes in outcomes at the service level; (3) changes in MTF outcomes at an annual frequency; and (4) changes in MTF outcomes net of trends within the MHS, again averaged at a quarterly frequency.8
Lowering the Confidence Level
Our benchmark analysis of changes in MTF utilization and PMPM costs required 95 percent confidence in identifying statistically signifi-cant changes. We also consider a 90 percent confidence level. Figure 4.10 compares the average changes required for statistical significance under the lower and higher confidence levels. Figure 4.11 compares the fre-quency of significant changes in MTF outcomes during the quarters of FY 2006 from their mean levels in FYs 2004– 2005.
Requiring less confidence decreases the changes required for sta-tistical significance and increases the frequency of significant changes. That is, the false-negative rate declines (see Chapter Three). The cost, however, is that the false-positive rate rises. For example, whereas half (5%/10.1%) of the significant changes in inpatient utilization could have been false positives given 95 percent confidence, roughly two-thirds (10%/14.7%) of the changes could have been false positives given 90 percent confidence.
Assessing the Performance of the Military Services
We also assess the performance of services by aggregating the outcomes of MTFs operated by each of the services. Figures 4.12–4.15 compare the changes required for each of the services as a whole with those required on average of their individual MTFs, both based on a 95 per-
8 We note here that OASD(HA) updated its PMPM data set during the course of this study. In earlier research conducted for OASD(HA), we found that the results of our preced-ing analysis of changes in MTF outcomes were qualitatively very similar across the two data sets.

Performance Assessment and MTF Size 39
Figure 4.10Percentage Change in Outcome Required for Statistical Significance, Mean by Confidence Level
0Inpatientutilization
Outpatientutilization
Drugutilization
Total cost
10
20
30
40
Perc
enta
ge
chan
ge
req
uir
ed f
or
stat
isti
cal s
ign
ifica
nce
RAND MG803-4.10
95% 90%
Confidence level
Figure 4.11Frequency of Statistically Significant Changes in MTF Outcomes, by Confidence Level
0Inpatientutilization
Outpatientutilization
Drugutilization
Total cost
20
40
60
80
100
Freq
uen
cy (%
)
RAND MG803-4.11
95% 90%
Confidence level

40 Assessing the Performance of Military Treatment Facilities
Figure 4.12Percentage Change in Inpatient Utilization Required for Statistical Significance, Mean by Level of Analysis
0Army Navy Air Force
10
20
30
40
Perc
enta
ge
chan
ge
req
uir
ed f
or
stat
isti
cal s
ign
ifica
nce
NOTE: The confidence level is 95%.RAND MG803-4.12
MTF level Service level
Figure 4.13Percentage Change in Outpatient Utilization Required for Statistical Significance, Mean by Level of Analysis
0Army Navy Air Force
10
20
30
40
Perc
enta
ge
chan
ge
req
uir
ed f
or
stat
isti
cal s
ign
ifica
nce
NOTE: The confidence level is 95%.RAND MG803-4.13
MTF level Service level
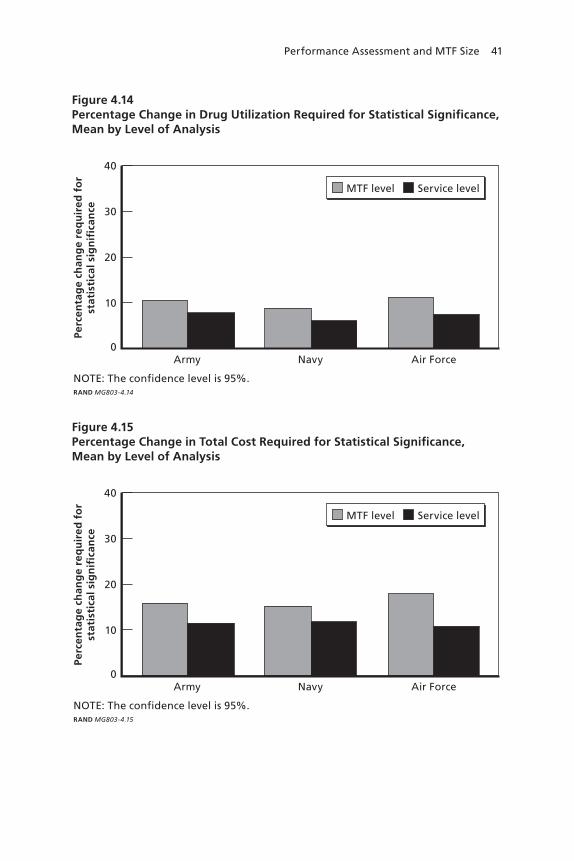
Performance Assessment and MTF Size 41
Figure 4.14Percentage Change in Drug Utilization Required for Statistical Significance, Mean by Level of Analysis
0Army Navy Air Force
10
20
30
40
Perc
enta
ge
chan
ge
req
uir
ed f
or
stat
isti
cal s
ign
ifica
nce
NOTE: The confidence level is 95%.RAND MG803-4.14
MTF level Service level
Figure 4.15Percentage Change in Total Cost Required for Statistical Significance, Mean by Level of Analysis
0Army Navy Air Force
10
20
30
40
Perc
enta
ge
chan
ge
req
uir
ed f
or
stat
isti
cal s
ign
ifica
nce
NOTE: The confidence level is 95%.RAND MG803-4.15
MTF level Service level

42 Assessing the Performance of Military Treatment Facilities
cent confidence level. Smaller changes are required of the services as a whole, especially for inpatient care, because MTFs tend to balance out in their outcomes, just as enrollees at the same MTF do. These pat-terns suggest that performance assessment may be more effective at a service level. However, an exclusive focus on this level might deprive OASD(HA) of useful information concerning the performance of spe-cific MTFs.
We cannot meaningfully analyze the frequency of significant changes during FY 2006, given the small number of services and quarters.
Assessing MTF Performance on an Annual Basis
We also assess MTF outcomes on an annual basis. An annual frequency of analysis may be more effective in identifying systematic changes in outcomes, because annual outcomes average over quarters within the year, potentially resulting in a decrease in their random variability.9 Unfortunately, we cannot rely directly on estimates of the standard deviations of annual outcomes, because we have only two observations for each MTF’s outcomes during FYs 2004–2005.
Appealing to the theoretical and empirical evidence in Chapters Three and Four as well as Appendix A concerning the impact of MTF size on the variability of outcomes, we specify and estimate several models of the relationships between the standard deviations of MTF outcomes, now measured at an annual frequency, and MTF size. In these regressions, the dependent variables are the estimated standard deviations of annual outcomes at MTFs.10 For each outcome, the first specification includes only a constant, whose estimate corresponds to the mean value of the standard deviation. A second specification also includes the inverse square root of the number (in thousands) of non-active duty equivalent lives enrolled at MTFs, averaged over FYs 2004 and 2005. If the random components of enrollee-level outcomes
9 On the other hand, the small number of observations contributes to uncertainty about mean outcomes during 2004–2005, thereby requiring larger changes, all else equal. 10 Appendix A reports the formula used to estimate standard deviations based on observed outcomes.

Performance Assessment and MTF Size 43
have the same variability regardless of MTF size, then the variabil-ity of MTF-level outcomes decrease in proportion to this variable (see Appendix A). A third specification adds the number of enrollees, while a fourth further adds the squared number. These specifications flexibly relax the assumption of equal variability of enrollee outcomes across MTFs.11 The results appear in Tables 4.7–4.10.12 We prefer the specifi-cation whose adjusted R-squared is highest. In the annual analysis, we use the standard deviations predicted by the preferred specifications.
Figure 4.16 compares the required changes in annual outcomes with those in the benchmark analysis of outcomes measured at a quar-terly frequency. Annual outcomes dampen the variability of quarterly outcomes, resulting in smaller required changes for statistical signifi-cance. This contrast is largest for inpatient utilization, whose average required change decreases from 28.2 percent to 14.8 percent.
The frequency of significant changes is compared in Figure 4.17. The frequency is substantially higher on an annual basis for all out-comes.13 In relative terms, the increase is greatest for inpatient utiliza-tion, consistent with the relatively large reduction in required changes in Figure 4.12. As a result, the false-positive rate for inpatient utilization decreases from as much as half (5%/10.1%) to one-quarter (5%/20.2%); the false-negative rate is again unknown. The frequency of significant changes in costs may increase the least in relative terms because many changes were already identified on a quarterly basis. Altogether, these findings suggest that assessing MTF performance based on annual outcomes may be more effective. However, there is a potential tradeoff
11 In Chapters Four and Five, we followed others in characterizing MTF size by the number of enrollees. In the annual analysis, the standard-deviation models account for the number of non-active duty equivalent lives, which is directly related to the outcome measures.12 We are unable to reject the hypothesis that the standard deviation is unrelated to MTF size in the case of prescription utilization. Because annual outcomes dampen the variabil-ity of quarterly outcomes, we would expect the size-variability relationship to be muted in comparison with the relationships illustrated in Figures 4.2–4.5 for outcomes measured at a quarterly frequency. 13 This evidence cannot be attributed to the use of a model of the standard deviation in the annual analysis. The results of the benchmark analysis were qualitatively similar when a simi-lar model was applied to outcomes measured at a quarterly frequency.

44 Assessing the Performance of Military Treatment Facilities
Table 4.7Regressions of Estimated Standard Deviation of Annual Inpatient Utilization
Specification
1 2 3 4
Parameter estimate (Standard error)
Constant 0.400***(0.034)
–0.003(0.021)
–0.258***(0.089)
–0.381*(0.222)
Inverse square root of number of non-active duty equivalent lives enrolled (thousands)
— 0.413***(0.093)
0.026***(0.009)
0.046(0.034)
Number of non-active duty equivalent lives enrolled
— — 0.954***(0.204)
1.142***(0.372)
Number squared — — — 0.076(0.051)
Other Statistics
r-squared 0.000 0.000 0.073 0.076
Adjusted r-squared 0.000 –0.009 0.056 0.051
N 114
Preferred Specification
No No Yes No
NOTeS: Independent variables are FY 2004–2005 means.
* denotes statistical significance at the 10 percent level.
** denotes statistical significance at the 5 percent level.
*** denotes statistical significance at the 1 percent level.

Performance Assessment and MTF Size 45
Table 4.8Regressions of Estimated Standard Deviation of Annual Outpatient Utilization
Specification
1 2 3 4
Parameter estimate (Standard error)
Constant 2.883***(0.234)
–0.413***(0.140)
–1.002(0.616)
–2.610*(1.532)
Inverse square root of number of non-active duty equivalent lives enrolled (thousands)
— 4.596***(0.622)
0.060(0.061)
0.322(0.236)
Number of non-active duty equivalent lives enrolled
— — 5.843***(1.416)
8.306***(2.572)
Number squared — — — 0.091(0.066)
Other Statistics
r-squared 0.000 0.072 0.080 0.091
Adjusted r-squared 0.000 0.064 0.064 0.066
N 114
Preferred Specification
No Yes No No
NOTeS: Independent variables are FY 2004–2005 means.
* denotes statistical significance at the 10 percent level.
** denotes statistical significance at the 5 percent level.
*** denotes statistical significance at the 1 percent level.

46 Assessing the Performance of Military Treatment Facilities
Table 4.9Regressions of Estimated Standard Deviation of Annual Drug Utilization
Specification
1 2 3 4
Parameter estimate (Standard error)
Constant 3.006***(0.217)
0.128(0.134)
0.178(0.592)
0.502(1.481)
Inverse square root of number of non-active duty equivalent lives enrolled (thousands)
— 2.475***(0.596)
–0.005(0.059)
–0.058(0.228)
Number of non-active duty equivalent lives enrolled
— — 2.369*(1.362)
1.872(2.487)
Number squared — — — 0.009(–0.018)
Other Statistics
r-squared 0.000 0.008 0.008 0.009
Adjusted r-squared 0.000 –0.001 –0.010 –0.018
N 114
Preferred Specification
Yes No No No
NOTeS: Independent variables are FY 2004–2005 means.
* denotes statistical significance at the 10 percent level.
** denotes statistical significance at the 5 percent level.
*** denotes statistical significance at the 1 percent level.

Performance Assessment and MTF Size 47
Table 4.10Regressions of Estimated Standard Deviation of Annual Costs
Specification
1 2 3 4
Parameter estimate (Standard error)
Constant 131.198***(8.623)
2.429(5.343)
–40.310*(23.273)
–72.680(58.113)
Inverse square root of number of non-active duty equivalent lives enrolled (thousands)
— 121.134***(23.769)
4.369*(2.317)
9.630(8.956)
Number of non-active duty equivalent lives enrolled
— — 211.749***(53.495)
261.311***(97.559)
Number squared — — — 0.036(0.010)
Other Statistics
r-squared 0.000 0.002 0.033 0.036
Adjusted r-squared 0.000 –0.007 0.015 0.010
N 114
Preferred Specification
No No Yes No
NOTeS: Independent variables are FY 2004–2005 means.
* denotes statistical significance at the 10 percent level.
** denotes statistical significance at the 5 percent level.
*** denotes statistical significance at the 1 percent level.

48 Assessing the Performance of Military Treatment Facilities
between greater confidence in the results and more frequent assessment of outcomes.
Assessing MTF Performance Net of MHS Trends
We found in Chapter Four that the frequency of statistically significant changes was lower for inpatient utilization than for the other outcomes. One explanation is that we have relatively little power to discern sys-tematic changes in patient utilization, because its random variability is large and thus so are the required changes.
Another explanation is that the other outcomes tended to change more between 2006 and 2004–2005 than inpatient utilization did, making differences easier to identify. Indeed, in the MHS as a whole, PMPM outpatient utilization, drug utilization, and total cost among non-active duty Prime enrollees grew by 8.2 percent, 4.7 percent, and 11.2 percent, respectively, while inpatient utilization grew by a compar-atively modest 3.7 percent. This system-wide growth could be driven by a variety of factors common to MTFs. Benefit expansion and dete-riorating performance are just two possibilities.
Figure 4.16Percentage Change in Outcome Required for Statistical Significance, Mean by Frequency of Analysis
0Inpatientutilization
Outpatientutilization
Drugutilization
Total cost
10
20
30
40
Perc
enta
ge
chan
ge
req
uir
ed f
or
stat
isti
cal s
ign
ifica
nce
NOTE: The confidence level is 95%.RAND MG803-4.16
Quarterly Annual
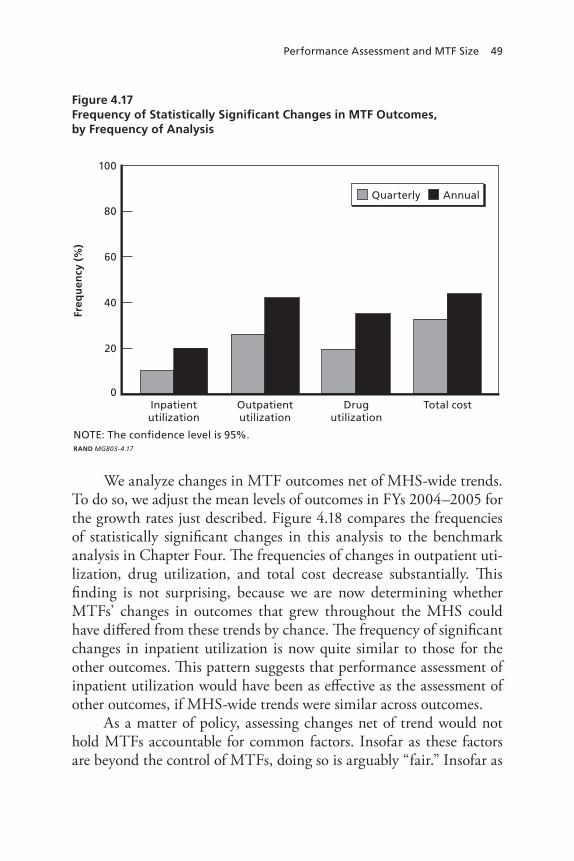
Performance Assessment and MTF Size 49
We analyze changes in MTF outcomes net of MHS-wide trends. To do so, we adjust the mean levels of outcomes in FYs 2004–2005 for the growth rates just described. Figure 4.18 compares the frequencies of statistically significant changes in this analysis to the benchmark analysis in Chapter Four. The frequencies of changes in outpatient uti-lization, drug utilization, and total cost decrease substantially. This finding is not surprising, because we are now determining whether MTFs’ changes in outcomes that grew throughout the MHS could have differed from these trends by chance. The frequency of significant changes in inpatient utilization is now quite similar to those for the other outcomes. This pattern suggests that performance assessment of inpatient utilization would have been as effective as the assessment of other outcomes, if MHS-wide trends were similar across outcomes.
As a matter of policy, assessing changes net of trend would not hold MTFs accountable for common factors. Insofar as these factors are beyond the control of MTFs, doing so is arguably “fair.” Insofar as
Figure 4.17Frequency of Statistically Significant Changes in MTF Outcomes, by Frequency of Analysis
0Inpatientutilization
Outpatientutilization
Drugutilization
Total cost
20
40
60
80
100
Freq
uen
cy (%
)
NOTE: The confidence level is 95%.RAND MG803-4.17
Quarterly Annual

50 Assessing the Performance of Military Treatment Facilities
these factors can be influenced, MTFs would not be held accountable for potentially important aspects of their performance. A similar obser-vation would apply to assessments of each MTF in comparison with its “peer group,” however defined.
In the next chapter, we use additional data to consider the role of catastrophic cases, such as organ transplants and low-birthweight deliveries. Excluding such cases might reduce the variability of out-comes, resulting in greater power to discern systematic changes.
Figure 4.18Frequency of Statistically Significant Changes in MTF Outcomes, Observed Changes Net of Military Health System Trend Versus Benchmark Analysis
0Inpatientutilization
Outpatientutilization
Drugutilization
Total cost
20
40
60
80
100
Freq
uen
cy (%
)
NOTE: The confidence level is 95%.RAND MG803-4.18
Benchmarkanalysis
Net ofMHS trend

51
ChAPTer FIve
Performance Assessment and Catastrophic Cases
Catastrophic cases may contribute substantially to the random compo-nent of average PMPM utilization and costs among MTFs’ enrollees. For example, organ transplants and low-birthweight deliveries may be resource-intensive enough that other cases cannot balance them out. If so, an observer could identify fewer statistically significant (that is, sys-tematic) changes in MTFs’ PMPM outcomes over time. This problem may be more acute at smaller MTFs, because there are relatively few enrollees and hence cases.
Excluding catastrophic cases from PMPM outcomes may there-fore improve their effectiveness as performance measures. Under such an approach, performance assessment would be focused on non-catastrophic care. The practicality of excluding catastrophic cases using MHS data systems has been unclear.
In this chapter, we explore the practicality and usefulness of excluding catastrophic cases from PMPM outcomes. We focus on hos-pital care, because in Chapter Four we found inpatient utilization to be especially variable, and hospital care often plays an important role in catastrophic cases. We describe data sets relevant to catastrophic cases, explain our approach to identifying catastrophic inpatient care, and explore the impact of catastrophic care on the assessment of MTF performance with respect to inpatient utilization.

52 Assessing the Performance of Military Treatment Facilities
Relevant Data Sets
Data on inpatient cases are needed. The PMPM data set used in Chapter Four reports average inpatient utilization at MTFs. These measures aggregate across enrollees receiving different kinds of care, making it impossible to distinguish catastrophic from noncatastrophic utilization.
Appropriate disaggregate data are systematically captured by MHS data systems. In particular, the Standard Inpatient Data Record (SIDR) and Health Care Service Record–Institutional (HCSR-I) data sets include a wealth of information on each hospital admission in the direct and purchased-care systems, respectively; we describe the infor-mation used below. We have been able to obtain SIDR and HCSR-I data for FY 2004.
We also use Defense Enrollment Eligiblity Reporting System data sets to identify non-active duty Prime enrollees during this period. We supplement these data with data sets on MTF catchment areas in order to identify enrollment MTFs. In particular, we map each enrollee to a parent MTF based on the enrollee’s zip code and sponsor service.1
Characterizing Catastrophic Inpatient Care
The SIDR and HCSR-I data sets report the diagnosis for each hospital patient’s admission, as well as the associated Diagnosis-Related Group (DRG). International Classification of Disease codes characterize diag-noses, while DRGs reflect a broad diagnosis and, in some instances, a treatment regimen and/or outcome.
We use this information to identify catastrophic admissions. Catastrophic cases have been defined by International Classification of Disease codes.2 Yet there does not appear to be any consensus defini-tion; indeed, this practice is not even common. For each DRG, there
1 In the infrequent event that an enrollee’s sponsor service was not reported and that the parent MTF within a zip code differed by service, we randomly assign the enrollee to one of the service’s parent MTFs.2 For example, see Tapei Branch of Bureau of National Health Insurance, 2008.

Performance Assessment and Catastrophic Cases 53
is a baseline Relative Weighted Product (RWP) that measures the typi-cal resource use of such an admission; these values are reported in the SIDR and HCSR-I data sets. Our measure of inpatient utilization is also based on RWPs. Defining catastrophic admissions based on DRGs was therefore practical and well suited to the context.
We define admissions as catastrophic if their DRGs are among the highest with respect to RWPs. We consider as thresholds the top 1, 5, and 10 percent of DRGs in terms of resource use. Appendix D identifies the DRGs associated with catastrophic admissions. Examples include DRG 481 (bone marrow transplant) and DRG 602 (neonate, birthweight < 750 grams, discharged alive).
Under this definition, catastrophic admissions were rare as well as resource-intensive. Table 5.1 shows that, based on a threshold of the top 5 percent of DRGs by resource use, catastrophic admissions accounted for 0.7 percent of hospital admissions but 9.2 percent of total inpatient utilization. These admissions do not constitute a substantially larger share of utilization or admissions for enrollees at smaller MTFs, sug-gesting that MTFs of different sizes enroll beneficiaries who are similar in their catastrophic utilization. Even so, catastrophic admissions may still lead the random component of inpatient utilization to be large at MTFs with relatively few enrollees and admissions.
Table 5.1Catastrophic Hospital Admissions as Share of Total Inpatient Utilization and Admissions Among Non-Active Duty Prime Enrollees, by Threshold for Catastrophic DRGs and MTF Size Quintile
Threshold/ Size Quintile
Percentage of Total Inpatient Utilization
Percentage of Total Hospital Admissions
Top 1% Top 5% Top 10% Top 1% Top 5% Top 10%
All 3.4 9.2 16.9 0.1 0.7 2.3
1 (smallest) 3.1 9.6 17.1 0.1 0.7 2.2
2 3.1 9.9 17.6 0.1 0.8 2.3
3 3.1 8.4 16.2 0.1 0.7 2.3
4 3.8 9.2 16.8 0.2 0.8 2.4
5 (largest) 3.6 8.9 16.5 0.2 0.7 2.2

54 Assessing the Performance of Military Treatment Facilities
Assessing Changes in Inpatient Utilization with Catastrophic Admissions Excluded
Ideally, we could directly exclude catastrophic admissions from inpatient utilization, both in computing required changes based on FY 2004–2005 means and in identifying significant changes in FY 2006. The disaggregate data necessary were available only for FY 2004, however. We therefore explore the impact of excluding cat-astrophic admissions on the assessment of MTF performance with respect to inpatient utilization.
First, we regress total inpatient utilization during the four quarters on catastrophic utilization, as well as indicator variables for each MTF and the summer, fall, and winter quarters. Total and catastrophic inpa-tient utilization are found by summing the baseline RWPs associated with hospital admissions in SIDR and HCSR-I; we use the equiva-lent lives reported in the PMPM data set to compute average utiliza-tion, because equivalent lives are not directly reported in SIDR and HCSR-I.3 The results of these regressions appear in Appendix E. We use these results to compute the magnitude of changes required for sta-tistical significance at each MTF, based on the unexplained variability of total RWPs per equivalent life.4
As Figure 5.1 shows, the magnitudes of the required changes would decrease if catastrophic admissions were excluded. For a 95 percent
3 The measure of inpatient utilization in the current analysis differs from the measure used in the last chapter. In the current analysis, catastrophic admissions are defined according to the baseline RWPs associated with DRGs, and utilization therefore includes baseline RWPs. Utilization in Chapter Four was derived from the sponsor’s PMPM data, which also includes outlier RWPs in inpatient utilization (Atkinson, 2007a). The correlation coefficient between the measures is 0.321. Our mapping of enrollee RWPs from the SIDR data to parent MTFs based on the Defense Enrollment Eligibility Reporting System (DEERS) introduced dis-crepancies between the numerators of the measures. We are able to compare the numbers of non-active duty enrollees under the linkage developed for the current analysis with the num-bers reported in the PMPM data. The correlation coefficient is 0.908. We use equivalent lives from the PMPM data in the denominator of the current measure. Differences in the enrollee health status/risk between the numerator of the current measure and the PMPM data would exacerbate the discrepancies between the inpatient-utilization measures.4 Because we are interested in the variability of the regression forecast, we account for the sampling variability of the regression parameters. See Greene, 2003.

Performance Assessment and Catastrophic Cases 55
confidence level, total inpatient utilization would have had to increase (or decrease) by nearly 26.5 percent on average (Table 4.4). By contrast, when we exclude admissions whose DRGs are in the top 5 percent by resource use, the required change in noncatastrophic care would be 17.9 percent at the average MTF. The required changes would be smaller still under the more inclusive 10 percent threshold.
Figure 5.2 shows the role played by MTF size, again based on quintiles of mean non-active duty enrollment during FYs 2004–2005. The decrease in required changes tends to be larger for smaller MTFs, especially the smallest. This pattern is not surprising. In Chapter Three, we explained that the impact of catastrophic cases on the variability of average MTF outcomes is likely to be larger at smaller MTFs, because there are relatively few enrollees whose health care needs can “balance out” at a point in time.
Next, we simulate the identification of significant changes in non-catastrophic inpatient utilization based on a thought experiment. In this experiment, we estimate the changes between 2004–2005 and
Figure 5.1Percentage Change in Noncatastrophic Inpatient Utilization Required for Statistical Significance with 95 Percent Confidence, Mean by DRGs Excluded Based on RWPs
0None Top 1% Top 5% Top 10%
10
20
30
40
Perc
enta
ge
chan
ge
req
uir
ed f
or
stat
isti
cal s
ign
ifica
nce
DRGs excluded, based on resource utilization as measured by RWPs
NOTE: The confidence level is 95%.RAND MG803-5.1

56 Assessing the Performance of Military Treatment Facilities
2006 that would have been required for statistical significance. To do so, we scale the change in total inpatient utilization required for each MTF in Chapter Four by the average ratio of noncatastrophic changes required to total changes required among MTFs in the same size quin-tile. We then assume that percentage changes in noncatastrophic uti-lization in 2006 equaled actual growth in total utilization. Finally, we determine whether these estimated changes exceeded the estimated requirements for statistical significance.
The results are illustrated in Figure 5.3. The frequency of signifi-cant changes increases substantially in general and for the smallest as well as the largest MTFs in particular. Among all MTFs, the frequency increased from 10.1 percent to 17.8 percent (not shown in Figure 5.3). These findings, while tentative, suggest that assessing MTF perfor-mance with respect to noncatastrophic inpatient utilization could be considerably more effective than assessing total utilization. It is pos-
Figure 5.2Percentage Change in Noncatastrophic Inpatient Utilization Required for Statistical Significance, Mean by DRGs Excluded and MTF Size Quintile
None Top 1%
Top 5% Top 10%
DRGs excluded
01 (smallest) 2 3 4 5 (largest)
10
20
30
40
50
Perc
enta
ge
chan
ge
req
uir
ed f
or
stat
isti
cal
sig
nifi
can
ce
MTF size quintile
NOTE: The confidence level is 95%.RAND MG803-5.2

Performance Assessment and Catastrophic Cases 57
sible, however, that the performance of MTF leaders in cost-effectively managing catastrophic care is critical but hard to assess.
Figure 5.3Frequency of Statistically Significant Changes in Noncatastrophic Inpatient Utilization, by DRGs Excluded and MTF Size Quintile
None Top 5%
DRGs excluded
01 (smallest) 2 3 4 5 (largest)
20
40
60
80
100
Freq
uen
cy (%
)
MTF size quintile
NOTE: The confidence level is 95%.RAND MG803-5.3


59
ChAPTer SIx
Conclusions
The 1996 Quadrennial Defense Review charted a “Roadmap for Medical Transformation” that called for transforming business prac-tices in the MHS through performance-based planning and financing. OASD(HA) has considered assessing the performance of the leaders of MTFs in managing care in a cost-effective manner. In particular, there has been potential interest in identifying changes in MTF utilization over time. Indeed, much like other health care payers, OASD(HA) has been monitoring PMPM utilization as well as costs among each MTF’s Prime enrollees. Assessing performance based on average MTF outcomes might effectively align accountability and authority within MTFs and thereby help to sustain the benefit.
This monograph has described the results of this study of perfor-mance assessment of MTFs. In particular, we summarized the context for performance assessment in the MHS. We then offered an over-view of performance assessment in nonmilitary health care, one that considered the potential usefulness and limitations of outcome-based measures of performance. This perspective on MTFs’ PMPM out-comes motivated our quantitative analyses. We first determined the magnitude of statistically significant changes in PMPM utilization and costs. We then identified significant changes in these MTF out-comes. In doing so, we explored the roles of MTF size and catastrophic cases, which plausibly influence the random variability of outcomes and thus the effectiveness of performance assessment. We now present our conclusions.
60 Assessing the Performance of Military Treatment Facilities
Utilization and Costs Reflect MTF Performance and Other Factors
Our qualitative review of performance assessment in health care indi-cated that important outcomes are linked to performance in managing care. In our context, MTF leaders may systematically influence utiliza-tion and costs by providing more or less care, as well as by delivering care more or less efficiently. Changes in outcomes over time are, how-ever, imperfect measures of performance.
Average MTF utilization and costs have a potentially important random component, because the need for and use of health care by an MTF’s enrollees is somewhat random during any period. An observer must therefore decide whether changes are due to chance or to system-atic factors, such as performance. Total certainty is impossible, and an observer will sometimes mistakenly conclude that a change is systematic in nature when in fact it is random (“false positives”). On other occa-sions, he will mistakenly conclude that a systematic change is random in nature (“false negatives”). An observer’s confidence that a change is systematic diminishes with the outcome’s random variability. The variability of average utilization and costs may be high at small MTFs, undermining the effectiveness of performance assessment. At an MTF with relatively few enrollees, the opportunity for their random health needs to balance out is limited. Outcomes may also be quite variable because of catastrophic cases, such as organ transplants. These cases may be too resource-intensive to be balanced by other cases.
Systematic factors other than performance further affect out-comes and thus their usefulness as performance measures. Potentially important examples include the structure of the TRICARE benefit, deployments of medical and other personnel, and the health status and typical health care needs of MTF enrollees. When such factors are stable over time at MTFs, systematic changes in outcomes must be due to changed performance. Yet these other factors may change over time. For example, there has been substantial turnover in the population of Prime enrollees at MTFs, potentially resulting in changes in the overall health status/risk of MTF enrollees. While PMPM outcomes account for health risk based on age, gender, and beneficiary category, such

Conclusions 61
risk adjustment is imperfect. Changes in outcomes would be unreliable measures of performance if outcomes did not account for other system-atic factors that are not independent of performance. Even if other fac-tors were independent, they contribute to the variability of outcomes, potentially undermining confidence in assessments of performance. In any event, the study scope did not include a quantitative analysis of systematic bias in MTF performance assessment.
MTF Utilization and Costs Are Variable, But Systematic Changes Can Be Identified
We used OASD(HA)’s PMPM data set to assess MTF utilization and costs from FY 2004 through FY 2006. We analyzed average inpa-tient utilization, outpatient utilization, drug utilization, and total cost among each MTF’s Prime enrollees, with active-duty personnel excluded because of deployment-related data concerns.
We found that these MTF outcomes varied substantially during 2004 and 2005, as measured by their standard deviations. We there-fore investigated whether systematic changes from 2004–2005 could be identified in 2006. For each outcome at each MTF, we determined the magnitude of the change required for 95 percent confidence that the change is statistically significant, that is, systematic in nature. The required changes ranged from 10.4 percent on average for drug uti-lization to 28.2 percent for inpatient utilization. Large changes were required for inpatient utilization because this outcome was especially variable.
The frequency of significant changes in 2006 ranged from 10.1 percent for inpatient utilization to 32.9 percent for costs. The low frequency for inpatient utilization is not attributable to large required changes but rather to low growth, relative to the other outcomes, throughout the MHS. Given a 95 percent confidence level, 5 percent of changes would happen to be significant if systematic factors were unchanged. As many as half of the significant changes in inpatient utilization could therefore be false positives. For total cost, the false-positive rate would be no greater than 15 percent. Unfortunately, we

62 Assessing the Performance of Military Treatment Facilities
cannot quantify false-negative rates. If the confidence level were lower, more changes would have been significant, resulting in more false posi-tives but fewer (though still some) false negatives. Whether these false-positive rates are unacceptably high is a policy judgment.
Outcomes Are More Variable at Smaller MTFs, Yet MTF Size Was Not Consistently Related to the Frequency of Systematic Changes
We investigated the impact of MTF size on the effectiveness of per-formance assessment. We defined MTF size by the average number of non-active duty enrollees during FYs 2004–2005 and created five groupings of similarly sized MTFs.
As expected, outcomes were substantially more variable at smaller MTFs. Required changes were larger as a result. For inpatient utiliza-tion, required changes averaged 41.8 percent at the smallest MTFs, versus 20.7 percent at the largest. There was a similar, albeit less extreme, pattern for the other outcomes.
The frequency of systematic (that is, statistically significant) changes also varied with MTF size. The frequency of changes in total cost, for example, increased from 20.7 percent on average for the small-est MTFs to 42.0 percent for the largest. Outpatient and drug utiliza-tion exhibited similar, though less pronounced, patterns. The frequency for inpatient utilization first increased from 10.9 percent at the smallest MTFs to 14.1 percent at moderately sized MTFs, then decreased to 3.4 percent among the largest. Rapid growth at the small MTFs cannot explain this finding, as inpatient utilization grew faster at the largest MTFs than at the smallest. Overall, performance assessment is not consistently less effective at small MTFs.

Conclusions 63
Excluding Catastrophic Inpatient Care Is Practical and Potentially Useful
Finally, we excluded catastrophic cases from inpatient utilization for several reasons. Inpatient care is often important in treating these cases. Inpatient utilization was especially variable. Necessary data on hospital admissions in the MHS were also readily available for 2004.
We characterized a hospital admission as catastrophic if the DRG associated with the admission was relatively resource-intensive. We considered the top 1 percent, top 5 percent, and top 10 percent of diag-noses as thresholds for catastrophic admissions.
Catastrophic accounted for a disproportionate share of resources: 0.7 percent of admissions but 9.2 percent of inpatient utilization, based on the 5 percent threshold. This pattern varied little by MTF size.
Based on this threshold, the required change in noncatastrophic utilization was 17.9 percent on average, versus 28.2 percent for total inpatient utilization. The required change would be even smaller with the more inclusive 10 percent threshold.
With one year of data, we could not directly identify statistically significant changes in noncatastrophic utilization. We were able to simulate this frequency under some simplifying assumptions. Based on the 5 percent threshold for catastrophic admissions, the frequency of significant changes was 17.8 percent, versus 10.1 percent for total in patient utilization. It is possible that catastrophic care is a critical aspect of MTF performance that is, unfortunately, hard to assess.
Potential Refinements
Changes over time in average utilization and costs at MTFs may, despite their limitations, be useful measures of MTF performance. The practical importance of systematic bias in these measures would seem to merit investigation. If biases are substantial, there may be feasible modifications of the measures that would enhance their reliability. In addition, our review of performance assessment in health care suggests that alternative measures might complement average MTF outcomes.

64 Assessing the Performance of Military Treatment Facilities
Such alternative approaches as targeted assessments of episodes or clini-cians could help to diagnose MTF performance problems more reliably and to treat them more effectively. On the other hand, implementing such metrics may not be practical in the MHS context, given current data systems. Much remains unknown about these issues.

65
APPeNDIx A
Some Statistical Issues in Performance Assessment
This appendix supplements the discussion in Chapter Three of statisti-cal issues relating to performance assessment. We now present a more formal framework for concluding whether changes in outcomes over time are systematic or random in nature. We also offer some numerical examples of the potential roles that MTF size and catastrophic cases play in drawing these conclusions.
For concreteness, we will consider inpatient utilization at an MTF. (The framework applies equally to other outcomes.) Suppose that enrollee e’s utilization during period t is
u p u ve t t e t, ,=− + + , (1)
in which pt is the MTF’s performance in cost-effectively managing care, u is an enrollee’s typical need for and use of inpatient care based on his or her health status/risk, and ve,t is a random component of the enrollee’s utilization with a mean of 0. Note that better (that is, higher) performance is defined as lower utilization, given the negative sign that precedes pt.
In this appendix, we assume for simplicity that performance is the only systematic determinant of outcomes that varies over time.1
1 The model also assumes that performance and the random component of utilization are additively separable from all other factors (including each other). This assumption is common in performance assessment (see, e.g., Goldstein and Spiegelhalter, 1996).

66 Assessing the Performance of Military Treatment Facilities
In reality, changes in the health status/risk of enrollees systematically affect utilization. The quantitative analyses in the body of the report incorporated health status/risk based on age, gender, and beneficiary category. In addition, Chapter Three offered a theoretical perspective on the possibility that unobserved systematic factors lead to changes in outcomes over time.
OASD(HA) has been monitoring PMPM utilization and cost (see Chapters Two and Three). Based on equation 1, average inpatient utili-zation among the MTF’s enrollees is
u
u
n
p u v
np u
v
np
t
e te t e tet
e te
t
≡
≡
, , ,∑ ∑ ∑=
− + +=− + +
− + uu vt+ ,
(2)
in which n denotes the number of enrollees at the MTF, which is assumed to be constant over time for simplicity. The outcomes analyzed in this monograph are averaged over equivalent lives, not enrollment (see Chapter Three); we ignore this distinction here, having already assumed that health status/risk is identical across enrollees and over time. Equation 2 shows that average utilization depends on MTF per-formance and the average value of enrollees’ random utilization, vt .
Based on equation 2, the change in average inpatient utilization over time is
∆ − =− − + − −∆ +∆− − −u u u p p v v p vt t t t t t t t t≡ ≡1 1 1( ) ( ) . (3)
Thus, a change in utilization could be caused by a change either in per-formance or in the random utilization of enrollees on average.
It is then possible to test the hypothesis that an observed change in inpatient utilization is random, rather than systematic, in nature. The hypothesis is that ∆ =pt 0, and the likelihood of this hypothesis equals the likelihood of the event
∆ =∆v ut t . This latter likelihood is
determined by the probability distribution of ∆vt .

Some Statistical Issues in Performance Assessment 67
This distribution converges to a normal distribution as the number of enrollees approaches infinity, if ve,t is distributed independently and identically across enrollees and over time (Amemiya, 1994).2 The mean of vt under its asymptotic distribution is 0, and the variability is
SD v
nSD vt e t( ) ( ),∆ = ⋅
2,
(4)
where SD(x) is the standard deviation of a random variable x. The stan-dard deviation is defined as
E x Ex( )− 2 .
It can be estimated (as we do)3 by
( )x x
ni ii −
−( )∑ 2
1 ,
with
xx
niii=
∑.
The assumption that ve,t is independently and identically distributed across enrollees and over time means that SD ve t( ), and SD vt( )∆ are constants.
2 Such convergence can hold for the average of independent random variables even when their means and variances (as defined below) differ (Amemiya, 1994). In our benchmark analysis, we do not place any restrictions on the means or variances of average utilization, etc., across outcomes or MTFs, because we analyze each outcome at each MTF separately. With means or variances that vary over time during a period, convergence under more general conditions becomes necessary and may in fact hold. In this event, we are comparing average performance during the baseline period of FYs 2004–2005 with subsequent performance.3 The (n – 1) term in the denominator ensures that the estimated variance is unbiased.

68 Assessing the Performance of Military Treatment Facilities
An observer can reject the hypothesis that an observed change ∆ut is due to chance with a degree of confidence determined by SD vt( )∆ . The confidence level can be found by comparing the statistic
z
uSD v
i
i=∆
∆( )
with a standard normal distribution table (see Amemiya, 1994).Alternatively, an observer could specify the degree of confidence
required and then determine whether an observed change exceeds the change required for this confidence level. For example, if 95 percent confidence were required, a change of 1 96. ( )⋅ ∆SD vt —whether an increase or a decrease—would be required to reject the hypothesis that the change is due to chance. If, on the contrary, utilization during period t were within the confidence interval
v SD v v SD vt t t t− −− ⋅ ∆ + ⋅ ∆
1 11 96 1 96. ( ), . ( ) ,
this hypothesis could not be rejected.4
The required change (as well as the confidence interval) shrinks with the number of enrollees at an MTF. Table A.1 considers MTFs with 1,000, 10,000, and 100,000 enrollees. Inpatient utilization (RWPs) is set equal to its monthly average of 0.00615 per equivalent life (6.15 per thousand lives, as reported in Table 4.1) during FYs 2004–2005, so that this example is not confounded by a relationship between utilization and MTF size. We assume for numerical concreteness that SD ue t( ) ., = 0 05. Comparing MTFs with 1,000 and 10,000 enroll-ees, the required change is 0.00310 (or 50.4 percent) at the smaller MTF, versus 0.00098 (or 15.9 percent) at the larger one. Comparing MTFs with 10,000 and 100,000 enrollees, the required change is again smaller at the larger MTF, though by a lesser increment
(0.00098 – 0.00031 < 0.00310 – 0.00098).
4 Strictly speaking, the statement that a hypothesis of no change can be rejected if the observed change lies outside the confidence interval surrounding the original utilization level is valid under the normal distribution that obtains here, but not for other distributions.

Some Statistical Issues in Performance Assessment 69
The intuition in this example is that there is greater opportunity for individual enrollees’ random needs for inpatient care to balance out when there are more enrollees at an MTF.
Table A.1 also shows that smaller changes are required when the required level of confidence is smaller.5 That is, there will be fewer false negatives with 90 percent confidence. The cost, however, is that the false-positive rate will increase by a magnitude that varies with the context.
The required change may also shrink when catastrophic cases, such as organ transplants, are excluded from inpatient utilization. Because these cases occur somewhat randomly, an enrollee’s random need for inpatient care during a period can be decomposed:
v v ve t e tc
e tnc
, , ,= + , (5)
in which the superscript c denotes catastrophic inpatient care, while the superscript nc denotes noncatastrophic inpatient care. We then have
SD v Var v Cov v v Vare t e tc
e tc
e tnc( ) ( ) ( , ) (, , , ,= + +2 vve t
nc, ) ,
in which Var(x) is the variance of a random variable x, and Cov(x,y) is the covariance of random variables x and y. The variance of x is defined to be equal to the square of its standard deviation, while the covariance of x and y is defined as E x Ex y Ey( )( )− −
.
Catastrophic cases may contribute substantially to the standard deviation of total utilization. Even if catastophic cases are rare, utiliza-tion is quite high on those occasions.
Excluding catastrophic cases from inpatient utilization transforms the standard deviation of ∆ut by a factor of
Var v
Var v Var ve tnc
e tc
e tnc
( )
( ) ( ),
, ,+<1,
5 For a 90 percent confidence level, a change of 1 645. ( )⋅ ∆SD vt is required for statistical significance.

70 Assessin
g th
e Perform
ance o
f Military Treatm
ent Facilities
Table A.1Random Variability of Inpatient Utilization and Confidence Intervals for Statistically Significant Changes, by MTF Size and Confidence Level
Number of Enrollees (N)
Inpatient Utilization per
Enrollee
( )ut
Standard Deviation
of Enrollee Utilization
( ( )),SD ut e
Standard Deviation of
Utilization per Enrollee
( ( ))SD ut
95 Percent Confidence 90 Percent Confidence
Absolute Change
Confidence Interval
PercentageChange
Absolute Change
Confidence Interval
Percentage Change
1,000 0.00615 0.05 0.00158 0.00310 [0.00305,0.00925]
50.4 0.00260 [0.00355,0.00875]
42.3
10,000 0.00615 0.05 0.00050 0.00098 [0.00517,0.00713]
15.9 0.00082 [0.00533,0.00697]
13.4
100,000 0.00615 0.05 0.00016 0.00031 [0.00584,0.00646]
5.0 0.00026 [0.00589,0.00641]
4.2
NOTeS: Confidence interval and percentage changes are based on a level of utilization in the prior period equal to average inpatient utilization (rwPs) per 1,000 equivalent lives in FYs 2004–2005.

Some Statistical Issues in Performance Assessment 71
assuming that Cov(x,y) = 0. If, for example, the variance of catastrophic and noncatastrophic care were equal, then the required change, now in terms of noncatastrophic utilization, would shrink with the stan-dard deviation by nearly 30 percent [ ( )]/100 1 2 1 2⋅ − − . At the MTF with 10,000 enrollees in Table A.1, the required change, in percent-age terms, would decrease from 15.9 percent to 11.2 percent. With required changes that are relatively large at smaller MTFs, excluding catastrophic cases would bring greater gains in statistical power, and thus the effectiveness of performance assessment, for these MTFs.
As an alternative to excluding catastrophic cases, all cases of inpa-tient utilization could be included but normalized (i.e., divided) by a measure of their typical resource-intensiveness. Catastrophic and non-catastophic cases would then have similar influence on the level of aver-age inpatient utilization. Their impacts on the random variability of average utilization would turn on their variability around their typi-cal resource-intensiveness. Such an approach could identify systematic changes with greater frequency than a PMPM metric, without ignor-ing a potentially important group of cases, as a measure that excludes catastrophic cases would. This alternative, while potentially useful, was beyond the scope of this study.

73
APPeNDIx B
Detailed Results of Benchmark Analysis of MTF Outcomes
This appendix reports the detailed results of our benchmark analysis of MTF Prime enrollment and equivalent lives as well as PMPM out-comes, measured at a quarterly frequency and averaged over FYs 2004 and 2005. Chapter Four describes this analysis.
Table B.1 describes mean MTF size under the measures listed in Table 4.2, ordered by the number of non-active duty enrollees.
Tables B.2–B.5 report the mean of each outcome at each MTF as well as its standard deviation. The bounds describe the ends of the confidence intervals discussed in Appendix A, given a 95 percent con-fidence level; they therefore define the magnitudes of the changes required for a change to be statistically significant.
Finally, Table B.6 compares the estimated standard deviations of MTF outcomes in FYs 2004–2005 with their levels in FY 2006, based on MTF size. As in Table 4.3, we create five groups of similarly sized MTFs based on mean non-active duty enrollment.

74 Assessing the Performance of Military Treatment Facilities
Table B.1TRICARE Prime Enrollment and Equivalent Lives, FYs 2004–2005
MTF NameParent
DMIS ID
Enrollment Equivalent
Total
Excluding Active Duty Total
Excluding Active Duty
460th MeD GrP-BuCKLeY AFB 7200 4,181 824 3,989 821
71st MeD GrP-vANCe 338 3,837 2,496 4,046 2,932
47th MeD GrP-LAuGhLIN 114 4,094 2,670 4,540 3,318
PATTerSON AhC- FT. MONMOuTh
81 12,547 3,513 11,875 3,832
14th MeD GrP-COLuMBuS 74 5,138 3,528 5,736 4,379
97th MeD GrP-ALTuS 97 5,917 4,353 6,136 4,747
17th MeD GrP-GOODFeLLOw 364 7,187 4,791 7,189 5,011
319th MeD GrP-GrAND FOrKS 93 7,703 4,818 7,334 4,879
354th MeD GrP-eIeLSON 203 8,120 4,981 7,291 4,572
NhC ANNAPOLIS 306 11,225 5,257 10,829 5,797
66th MeD GrP-hANSCOM 310 8,312 5,296 8,291 5,331
61st MeD SQuAD-LOS ANGeLeS 248 8,687 5,378 8,860 5,719
9th MeD GrP-BeALe 15 9,059 5,563 8,830 5,787
579th MeD GrOuP-BOLLING 413 11,361 5,793 11,812 5,947
KeLLer ACh-weST POINT 86 12,061 5,816 11,633 6,216
30th MeD GrP-vANDeNBerG 18 9,287 6,113 9,287 6,551
27th MeD GrP-CANNON 85 9,824 6,236 9,692 6,681
341st MeD GrP-MALMSTrOM 77 10,440 6,645 10,481 7,263
5th MeD GrP-MINOT 94 11,671 6,703 10,862 6,638
90th MeD GrP-F.e. wArreN 129 10,285 6,704 10,058 6,944
weeD ACh-FT. IrwIN 131 11,799 6,800 10,590 6,473
95th MeD GrP-eDwArDS 19 10,262 6,980 9,912 7,135
23rd MeD GrP-MOODY 50 11,348 7,187 10,795 7,237
49th MeD GrP-hOLLOMAN 84 11,125 7,403 11,879 8,632
437th MeD GrP-ChArLeSTON 356 12,662 7,742 12,775 8,369

Detailed results of Benchmark Analysis of MTF Outcomes 75
Table B.1—Continued
MTF NameParent
DMIS ID
Enrollment Equivalent Lives
Total
Excluding Active Duty Total
Excluding Active Duty
366th MeD GrP-MOuNTAIN hOMe
53 12,335 7,959 12,437 8,657
43rd MeDICAL GrOuP-POPe 335 13,432 8,007 12,762 8,059
NhC PATuxeNT rIver 68 11,478 8,022 11,323 8,343
509th MeD GrP-whITeMAN 76 11,937 8,134 11,761 8,485
28th MeD GrP-eLLSwOrTh 106 11,867 8,167 12,364 9,182
22nd MeD GrP-MCCONNeLL 59 11,748 8,415 12,058 9,101
BASSeTT ACh-FT. wAINwrIGhT 5 16,125 8,441 14,397 8,356
15th MeD GrP-hICKAM 287 13,661 8,588 13,198 8,260
1st SPeC OPS MeD GrP-hurLBurT
7139 16,434 8,653 14,862 8,212
7th MeD GrP-DYeSS 112 14,561 9,197 14,298 9,816
62nd MeD GrP-MCChOrD 395 13,835 9,421 14,774 10,894
wALTer reeD AMC-wAShINGTON DC
37 23,720 9,813 28,020 12,458
305th MeD GrP-MCGuIre 326 16,942 9,896 16,109 9,481
314th MeD GrP-LITTLe rOCK 13 16,260 10,081 16,373 10,956
4th MeD GrP-SeYMOur JOhNSON
90 14,755 10,090 14,981 10,890
92nd MeD GrP-FAIrChILD 128 13,789 10,158 14,821 11,653
FOx AhC-reDSTONe ArSeNAL 1 11,475 10,170 13,722 12,426
Nh TweNTYNINe PALMS 30 13,530 10,172 13,600 10,894
436th MeD GrP-DOver 36 15,414 10,487 16,021 11,587
Nh BeAuFOrT 104 13,475 10,490 13,999 11,418
20th MeD GrP-ShAw 101 16,776 10,990 16,955 11,816
82nd MeD GrP-ShePPArD 113 15,199 11,030 15,719 11,972
LYSTer AhC-FT. ruCKer 3 15,096 11,500 16,060 12,893
2nd MeD GrP-BArKSDALe 62 17,997 11,733 18,531 13,102
325th MeD GrP-TYNDALL 43 16,152 11,743 17,451 13,524

76 Assessing the Performance of Military Treatment Facilities
Table B.1—Continued
MTF NameParent
DMIS ID
Enrollment Equivalent Lives
Total
Excluding Active Duty Total
Excluding Active Duty
KeNNer AhC-FT. Lee 122 15,598 11,913 16,051 12,401
r w BLISS AhC-FT. huAChuCA 8 16,469 12,376 17,807 14,120
Nh ChArLeSTON 103 20,999 12,647 21,886 15,435
Nh COrPuS ChrISTI 118 19,778 12,962 20,636 14,859
MuNSON AhC- FT. LeAveNwOrTh
58 17,024 12,975 17,450 13,652
Nh OAK hArBOr 127 16,035 13,050 16,326 13,788
Nh LeMOOre 28 16,514 13,070 16,730 13,823
45th MeD GrP-PATrICK 46 15,823 13,158 18,654 16,206
BAYNe-JONeS ACh-FT. POLK 64 22,705 13,568 21,676 14,284
Nh CherrY POINT 92 15,756 13,651 16,666 14,903
75th MeD GrP-hILL 119 19,697 13,675 19,383 14,156
NhC GreAT LAKeS 56 19,715 13,829 19,409 13,916
42nd MeDICAL GrOuP-MAxweLL
4 18,047 13,891 19,193 14,913
GuThrIe AhC-FT. DruM 330 31,409 14,207 27,357 13,353
78th MeD GrP-rOBINS 51 21,865 15,528 21,899 16,096
377th MeD GrP-KIrTLAND 83 20,294 15,587 22,809 18,516
L. wOOD ACh-FT. LeONArD wOOD
75 23,198 15,925 23,395 17,015
21st MeD GrP-PeTerSON 252 22,695 16,140 22,853 16,629
72nd MeD GrP-TINKer 96 25,611 16,890 26,123 18,398
IrwIN ACh-FT. rILeY 57 30,477 17,569 28,375 18,047
MONCrIeF ACh-FT. JACKSON 105 22,563 17,968 24,408 19,693
12th MeD GrP-rANDOLPh 366 23,025 18,370 26,230 21,583
NhC QuANTICO 385 27,253 18,787 25,279 18,348
355th MeD GrP-DAvIS MONThAN
10 26,363 18,931 28,395 21,745

Detailed results of Benchmark Analysis of MTF Outcomes 77
Table B.1—Continued
MTF NameParent
DMIS ID
Enrollment Equivalent Lives
Total
Excluding Active Duty Total
Excluding Active Duty
10th MeD GrOuP-uSAF ACADeMY CO
33 25,441 19,295 28,326 22,838
IreLAND ACh-FT. KNOx 61 33,347 19,456 32,866 20,336
56th MeD GrP-LuKe 9 27,580 20,687 30,867 24,742
55th MeD GrP-OFFuTT 78 28,113 20,703 28,390 21,609
reYNOLDS ACh-FT. SILL 98 30,834 21,423 29,091 21,439
NAvAL heALTh CAre New eNGLAND
6223 36,059 21,563 34,735 22,576
NhC hAwAII 280 30,211 21,801 28,908 21,301
1st MeD GrP-LANGLeY 120 32,005 22,549 31,150 21,966
MCDONALD AhC-FT. euSTIS 121 29,189 22,755 30,256 24,208
81st MeD GrP-KeeSLer 73 28,732 22,857 32,117 26,442
375th MeD GrP-SCOTT 55 30,368 23,448 32,340 25,355
79th MeD GrP-ANDrewS 66 31,453 24,128 33,294 25,584
3rd MeD GrP-eLMeNDOrF 6 31,806 24,197 31,545 24,744
NNMC BeTheSDA 67 41,233 24,604 46,120 29,321
6th MeD GrP-MACDILL 45 32,747 24,921 37,943 30,303
96th MeD GrP-eGLIN 42 34,199 25,121 35,874 27,923
88th MeD GrP-wrIGhT-PATTerSON
95 34,487 27,571 39,518 32,744
wILLIAM BeAuMONT AMC-FT. BLISS
108 40,111 27,828 42,187 31,068
60th MeD GrP-TrAvIS 14 37,298 27,911 44,189 35,357
99th MeD GrP-O’CALLAGhAN hOSP
79 37,095 28,608 41,956 34,525
Nh CAMP LeJeuNe 91 32,962 29,004 32,948 29,458
evANS ACh-FT. CArSON 32 46,799 29,370 45,461 31,511
MArTIN ACh-FT. BeNNING 48 43,937 29,844 43,720 31,962
Nh BreMerTON 126 35,107 29,972 35,848 31,330

78 Assessing the Performance of Military Treatment Facilities
Table B.1—Continued
MTF NameParent
DMIS ID
Enrollment Equivalent Lives
Total
Excluding Active Duty Total
Excluding Active Duty
KIMBrOuGh AMB CAr CeN- FT. MeADe
69 44,664 31,462 45,131 31,983
TrIPLer AMC- FT. ShAFTer
52 50,965 32,020 48,183 32,029
BrOOKe AMC-FT. SAM hOuSTON 109 38,504 32,999 46,808 40,938
wINN ACh-FT. STewArT 49 59,761 33,390 55,787 33,608
Nh PeNSACOLA 38 49,236 33,463 50,398 36,038
eISeNhOwer AMC-FT. GOrDON 47 52,880 35,266 57,598 40,293
59th MeD wING-LACKLAND 117 51,235 39,350 58,900 46,961
BLANChFIeLD ACh-FT. CAMPBeLL 60 65,845 39,433 60,294 39,191
Nh JACKSONvILLe 39 59,685 44,730 58,494 45,305
Nh CAMP PeNDLeTON 24 58,672 48,161 60,639 51,793
MADIGAN AMC-FT. LewIS 125 84,234 52,561 86,293 59,210
DArNALL AMC-FT. hOOD 110 109,119 56,724 97,505 54,139
wOMACK AMC-FT. BrAGG 89 100,686 58,808 92,404 57,943
DewITT ACh-FT. BeLvOIr 123 78,853 67,780 87,535 76,162
NMC SAN DIeGO 29 105,480 81,414 110,673 89,339
NMC POrTSMOuTh 124 121,079 85,109 116,328 83,240
NOTe: These statistics are measured at a quarterly frequency and averaged over FYs 2004–2005.

Detailed results of Benchmark Analysis of MTF Outcomes 79
Table B.2Monthly Inpatient Utilization (RWPs) per 1,000 Equivalent Lives, FYs 2004–2005
MTF NameParent
DMIS ID MeanStandard Deviation
95% Lower Bound
95% Upper Bound
460th MeD GrP-BuCKLeY AFB 7200 5.47 1.40 2.56 8.38
71st MeD GrP-vANCe 338 7.70 2.37 2.76 12.63
47th MeD GrP-LAuGhLIN 114 5.47 2.68 –0.10 11.03
PATTerSON AhC- FT. MONMOuTh
81 5.84 0.57 4.66 7.02
14th MeD GrP-COLuMBuS 74 5.49 0.96 3.48 7.49
97th MeD GrP-ALTuS 97 6.63 0.94 4.68 8.57
17th MeD GrP-GOODFeLLOw 364 5.75 0.47 4.78 6.73
319th MeD GrP-GrAND FOrKS 93 6.72 2.14 2.28 11.16
354th MeD GrP-eIeLSON 203 5.50 1.29 2.82 8.17
NhC ANNAPOLIS 306 2.41 0.71 0.94 3.88
66th MeD GrP-hANSCOM 310 5.38 0.98 3.35 7.41
61st MeD SQuAD-LOS ANGeLeS 248 5.31 1.07 3.08 7.54
9th MeD GrP-BeALe 15 5.82 1.28 3.15 8.49
579th MeD GrOuP-BOLLING 413 3.47 0.49 2.46 4.48
KeLLer ACh-weST POINT 86 6.41 0.67 5.02 7.81
30th MeD GrP-vANDeNBerG 18 5.04 0.77 3.44 6.64
27th MeD GrP-CANNON 85 6.84 1.25 4.24 9.43
341st MeD GrP-MALMSTrOM 77 6.64 1.07 4.40 8.87
5th MeD GrP-MINOT 94 6.07 1.15 3.67 8.46
90th MeD GrP-F.e. wArreN 129 5.91 0.91 4.02 7.80
weeD ACh-FT. IrwIN 131 7.73 1.52 4.58 10.88
95th MeD GrP-eDwArDS 19 5.39 0.68 3.98 6.81
23rd MeD GrP-MOODY 50 4.89 1.07 2.68 7.11
49th MeD GrP-hOLLOMAN 84 6.84 1.08 4.59 9.09
437th MeD GrP-ChArLeSTON 356 5.65 0.96 3.66 7.64

80 Assessing the Performance of Military Treatment Facilities
Table B.2—Continued
MTF NameParent
DMIS ID MeanStandard Deviation
95% Lower Bound
95% Upper Bound
366th MeD GrP-MOuNTAIN hOMe
53 6.72 1.01 4.61 8.82
43rd MeDICAL GrOuP-POPe 335 4.75 0.69 3.32 6.18
NhC PATuxeNT rIver 68 4.54 0.73 3.01 6.06
509th MeD GrP-whITeMAN 76 6.28 0.57 5.11 7.46
28th MeD GrP-eLLSwOrTh 106 5.93 1.22 3.40 8.46
22nd MeD GrP-MCCONNeLL 59 6.32 0.68 4.91 7.73
BASSeTT ACh-FT. wAINwrIGhT 5 7.45 1.00 5.36 9.54
15th MeD GrP-hICKAM 287 3.33 0.46 2.37 4.29
1st SPeC OPS MeD GrP-hurLBurT
7139 3.84 0.49 2.83 4.86
7th MeD GrP-DYeSS 112 6.98 0.97 4.97 8.99
62nd MeD GrP-MCChOrD 395 3.06 0.46 2.10 4.02
wALTer reeD AMC-wAShINGTON DC
37 26.37 3.07 19.99 32.75
305th MeD GrP-MCGuIre 326 5.84 2.11 1.45 10.24
314th MeD GrP-LITTLe rOCK 13 5.71 0.70 4.25 7.17
4th MeD GrP-SeYMOur JOhNSON
90 4.72 0.82 3.02 6.42
92nd MeD GrP-FAIrChILD 128 5.55 0.68 4.14 6.96
FOx AhC-reDSTONe ArSeNAL 1 5.73 0.85 3.97 7.49
Nh TweNTYNINe PALMS 30 7.24 0.85 5.47 9.02
436th MeD GrP-DOver 36 4.87 0.64 3.54 6.21
Nh BeAuFOrT 104 6.21 0.85 4.44 7.98
20th MeD GrP-ShAw 101 4.91 0.79 3.27 6.55
82nd MeD GrP-ShePPArD 113 5.48 0.64 4.15 6.80
LYSTer AhC-FT. ruCKer 3 6.61 0.65 5.26 7.96
2nd MeD GrP-BArKSDALe 62 7.29 0.94 5.34 9.24
325th MeD GrP-TYNDALL 43 6.63 0.97 4.61 8.64
KeNNer AhC-FT. Lee 122 4.88 0.56 3.73 6.03

Detailed results of Benchmark Analysis of MTF Outcomes 81
Table B.2—Continued
MTF NameParent
DMIS ID MeanStandard Deviation
95% Lower Bound
95% Upper Bound
r w BLISS AhC-FT. huAChuCA 8 5.48 0.61 4.22 6.74
Nh ChArLeSTON 103 8.72 0.99 6.66 10.78
Nh COrPuS ChrISTI 118 5.75 0.71 4.28 7.23
MuNSON AhC- FT. LeAveNwOrTh
58 4.92 0.58 3.72 6.12
Nh OAK hArBOr 127 5.96 0.40 5.13 6.79
Nh LeMOOre 28 6.28 0.81 4.58 7.97
45th MeD GrP-PATrICK 46 5.49 0.47 4.50 6.47
BAYNe-JONeS ACh-FT. POLK 64 6.47 0.66 5.10 7.84
Nh CherrY POINT 92 6.31 0.67 4.92 7.70
75th MeD GrP-hILL 119 5.49 0.43 4.59 6.39
NhC GreAT LAKeS 56 6.07 0.81 4.38 7.75
42ND MeDICAL GrOuP-MAxweLL
4 5.56 0.79 3.92 7.20
GuThrIe AhC-FT. DruM 330 5.03 1.06 2.84 7.23
78th MeD GrP-rOBINS 51 5.35 0.39 4.53 6.17
377th MeD GrP-KIrTLAND 83 2.84 0.60 1.60 4.07
L. wOOD ACh-FT. LeONArD wOOD
75 8.55 1.06 6.35 10.76
21st MeD GrP-PeTerSON 252 4.67 0.50 3.63 5.72
72nd MeD GrP-TINKer 96 6.34 0.35 5.61 7.08
IrwIN ACh-FT. rILeY 57 7.07 0.98 5.04 9.10
MONCrIeF ACh-FT. JACKSON 105 5.35 0.52 4.28 6.43
12th MeD GrP-rANDOLPh 366 2.07 0.27 1.52 2.63
NhC QuANTICO 385 3.85 0.82 2.16 5.55
355th MeD GrP-DAvIS MONThAN
10 5.77 0.59 4.55 6.99
10th MeD GrOuP-uSAF ACADeMY CO
33 5.05 0.75 3.49 6.60
IreLAND ACh-FT. KNOx 61 6.85 1.15 4.46 9.25

82 Assessing the Performance of Military Treatment Facilities
Table B.2—Continued
MTF NameParent
DMIS ID MeanStandard Deviation
95% Lower Bound
95% Upper Bound
56th MeD GrP-LuKe 9 7.25 0.60 6.00 8.50
55th MeD GrP-OFFuTT 78 6.33 0.82 4.62 8.04
reYNOLDS ACh-FT. SILL 98 7.32 0.47 6.35 8.29
NAvAL heALTh CAre New eNGLAND
6223 6.57 1.04 4.42 8.73
NhC hAwAII 280 4.63 0.37 3.86 5.39
1st MeD GrP-LANGLeY 120 4.07 0.22 3.62 4.52
MCDONALD AhC-FT. euSTIS 121 4.33 0.40 3.50 5.17
81st MeD GrP-KeeSLer 73 8.29 0.77 6.69 9.89
375th MeD GrP-SCOTT 55 6.15 0.38 5.37 6.94
79th MeD GrP-ANDrewS 66 4.84 0.34 4.13 5.55
3rd MeD GrP-eLMeNDOrF 6 5.59 0.31 4.95 6.24
NNMC BeTheSDA 67 9.83 1.20 7.33 12.33
6th MeD GrP-MACDILL 45 5.53 0.69 4.11 6.96
96th MeD GrP-eGLIN 42 6.30 0.85 4.53 8.07
88th MeD GrP-wrIGhT-PATTerSON
95 6.32 0.49 5.29 7.35
wILLIAM BeAuMONT AMC- FT. BLISS
108 7.57 0.86 5.77 9.36
60th MeD GrP-TrAvIS 14 6.86 0.66 5.48 8.24
99th MeD GrP-O’CALLAGhAN hOSP
79 6.89 0.73 5.39 8.40
Nh CAMP LeJeuNe 91 6.96 0.58 5.75 8.18
evANS ACh-FT. CArSON 32 7.20 0.78 5.58 8.82
MArTIN ACh-FT. BeNNING 48 5.74 0.50 4.70 6.78
Nh BreMerTON 126 5.12 0.66 3.76 6.49
KIMBrOuGh AMB CAr CeN- FT. MeADe
69 4.34 0.50 3.31 5.37
TrIPLer AMC-FT. ShAFTer 52 8.17 0.84 6.42 9.92
BrOOKe AMC-FT. SAM hOuSTON 109 10.01 0.71 8.52 11.49

Detailed results of Benchmark Analysis of MTF Outcomes 83
Table B.2—Continued
MTF NameParent
DMIS ID MeanStandard Deviation
95% Lower Bound
95% Upper Bound
wINN ACh-FT. STewArT 49 5.64 0.61 4.36 6.91
Nh PeNSACOLA 38 5.90 0.43 5.01 6.78
eISeNhOwer AMC-FT. GOrDON 47 6.16 0.46 5.20 7.12
59th MeD wING-LACKLAND 117 9.59 0.74 8.04 11.13
BLANChFIeLD ACh-FT. CAMPBeLL 60 6.92 1.16 4.50 9.34
Nh JACKSONvILLe 39 6.04 0.47 5.07 7.02
Nh CAMP PeNDLeTON 24 5.96 0.48 4.96 6.96
MADIGAN AMC-FT. LewIS 125 7.50 0.66 6.13 8.87
DArNALL AMC-FT. hOOD 110 6.18 0.52 5.08 7.27
wOMACK AMC-FT. BrAGG 89 7.09 0.84 5.34 8.84
DewITT ACh-FT. BeLvOIr 123 3.16 0.34 2.45 3.86
NMC SAN DIeGO 29 8.24 0.74 6.69 9.78
NMC POrTSMOuTh 124 7.77 1.12 5.45 10.10
NOTe: These outcomes are measured at a quarterly frequency and averaged over FYs 2004–2005.

84 Assessing the Performance of Military Treatment Facilities
Table B.3Monthly Outpatient Utilization (Relative Value Units) per 100 Equivalent Lives, FYs 2004–2005
MTF NameParent
DMIS ID MeanStandard Deviation
95% Lower Bound
95% Upper Bound
460th MeD GrP-BuCKLeY AFB 7200 60.6 7.0 44.8 76.3
71st MeD GrP-vANCe 338 70.4 6.0 57.0 83.8
47th MeD GrP-LAuGhLIN 114 53.7 8.0 35.7 71.7
PATTerSON AhC- FT. MONMOuTh
81 79.5 3.8 70.9 88.0
14th MeD GrP-COLuMBuS 74 56.3 6.8 41.1 71.5
97th MeD GrP-ALTuS 97 64.3 5.1 52.9 75.7
17th MeD GrP-GOODFeLLOw 364 71.9 9.2 51.2 92.6
319th MeD GrP-GrAND FOrKS 93 59.1 8.2 40.7 77.6
354th MeD GrP-eIeLSON 203 58.7 3.2 51.6 65.9
NhC ANNAPOLIS 306 65.8 3.1 58.8 72.8
66th MeD GrP-hANSCOM 310 67.2 3.7 58.9 75.5
61st MeD SQuAD-LOS ANGeLeS 248 60.0 3.0 53.2 66.8
9th MeD GrP-BeALe 15 58.5 3.2 51.3 65.8
579th MeD GrOuP-BOLLING 413 58.0 4.3 48.3 67.6
KeLLer ACh-weST POINT 86 66.1 5.1 54.7 77.6
30th MeD GrP-vANDeNBerG 18 65.2 5.8 52.2 78.1
27th MeD GrP-CANNON 85 59.8 4.8 49.1 70.6
341st MeD GrP-MALMSTrOM 77 66.0 5.3 54.1 77.9
5th MeD GrP-MINOT 94 56.9 4.6 46.7 67.2
90th MeD GrP-F.e. wArreN 129 68.2 5.0 57.1 79.4
weeD ACh-FT. IrwIN 131 63.1 6.5 48.6 77.6
95th MeD GrP-eDwArDS 19 59.1 4.2 49.7 68.6
23rd MeD GrP-MOODY 50 68.3 3.7 60.0 76.6
49th MeD GrP-hOLLOMAN 84 58.3 4.5 48.3 68.4
437th MeD GrP-ChArLeSTON 356 59.6 4.5 49.4 69.7

Detailed results of Benchmark Analysis of MTF Outcomes 85
Table B.3—Continued
MTF NameParent
DMIS ID MeanStandard Deviation
95% Lower Bound
95% Upper Bound
366th MeD GrP-MOuNTAIN hOMe
53 59.7 3.5 51.8 67.7
43rd MeDICAL GrOuP-POPe 335 56.2 4.5 46.2 66.2
NhC PATuxeNT rIver 68 69.1 3.2 62.0 76.3
509th MeD GrP-whITeMAN 76 65.5 5.5 53.0 77.9
28th MeD GrP-eLLSwOrTh 106 61.8 3.8 53.4 70.3
22nd MeD GrP-MCCONNeLL 59 71.8 4.2 62.3 81.3
BASSeTT ACh-FT. wAINwrIGhT 5 70.0 6.0 56.5 83.5
15th MeD GrP-hICKAM 287 62.8 4.9 51.7 73.9
1st SPeC OPS MeD GrP-hurLBurT
7139 65.6 5.7 52.9 78.3
7th MeD GrP-DYeSS 112 69.8 8.4 51.1 88.6
62nd MeD GrP-MCChOrD 395 61.9 3.5 54.0 69.8
wALTer reeD AMC-wAShINGTON DC
37 114.9 18.2 74.1 155.7
305th MeD GrP-MCGuIre 326 59.2 4.9 48.3 70.1
314th MeD GrP-LITTLe rOCK 13 67.3 5.0 56.1 78.5
4th MeD GrP-SeYMOur JOhNSON
90 59.8 4.5 49.8 69.8
92nd MeD GrP-FAIrChILD 128 60.4 5.8 47.2 73.5
FOx AhC-reDSTONe ArSeNAL 1 62.6 3.5 54.7 70.6
Nh TweNTYNINe PALMS 30 72.1 6.1 58.5 85.8
436th MeD GrP-DOver 36 60.2 3.9 51.5 68.9
Nh BeAuFOrT 104 60.5 4.7 50.0 70.9
20th MeD GrP-ShAw 101 60.3 6.2 46.4 74.3
82nd MeD GrP-ShePPArD 113 75.3 4.2 65.8 84.8
LYSTer AhC-FT. ruCKer 3 63.5 7.1 47.5 79.5
2nd MeD GrP-BArKSDALe 62 62.4 4.2 53.0 71.8
325th MeD GrP-TYNDALL 43 70.0 4.4 60.2 79.8
KeNNer AhC-FT. Lee 122 57.2 2.1 52.6 61.9

86 Assessing the Performance of Military Treatment Facilities
Table B.3—Continued
MTF NameParent
DMIS ID MeanStandard Deviation
95% Lower Bound
95% Upper Bound
r w BLISS AhC-FT. huAChuCA 8 58.4 1.7 54.4 62.3
Nh ChArLeSTON 103 61.2 5.1 49.7 72.7
Nh COrPuS ChrISTI 118 65.7 2.8 59.3 72.0
MuNSON AhC- FT. LeAveNwOrTh
58 71.0 4.2 61.6 80.5
Nh OAK hArBOr 127 68.3 5.3 56.4 80.2
Nh LeMOOre 28 61.5 3.5 53.5 69.4
45th MeD GrP-PATrICK 46 66.2 5.2 54.4 78.0
BAYNe-JONeS ACh-FT. POLK 64 73.4 4.5 63.4 83.4
Nh CherrY POINT 92 68.0 3.6 60.0 76.0
75th MeD GrP-hILL 119 67.7 3.1 60.8 74.7
NhC GreAT LAKeS 56 68.3 3.7 60.0 76.7
42nd MeDICAL GrOuP-MAxweLL
4 67.5 3.1 60.4 74.5
GuThrIe AhC-FT. DruM 330 76.2 2.8 70.0 82.4
78th MeD GrP-rOBINS 51 64.7 3.0 58.1 71.3
377th MeD GrP-KIrTLAND 83 46.5 4.5 36.3 56.7
L. wOOD ACh-FT. LeONArD wOOD
75 67.0 3.5 59.2 74.9
21st MeD GrP-PeTerSON 252 64.8 2.9 58.3 71.3
72nd MeD GrP-TINKer 96 66.1 2.4 60.7 71.6
IrwIN ACh-FT. rILeY 57 69.2 4.1 60.0 78.3
MONCrIeF ACh-FT. JACKSON 105 60.4 2.6 54.7 66.2
12th MeD GrP-rANDOLPh 366 54.3 2.0 49.9 58.7
NhC QuANTICO 385 64.6 3.3 57.2 72.0
355th MeD GrP-DAvIS MONThAN
10 59.2 3.4 51.7 66.8
10th MeD GrOuP-uSAF ACADeMY CO
33 57.5 3.1 50.6 64.4
IreLAND ACh-FT. KNOx 61 70.4 3.7 62.2 78.6

Detailed results of Benchmark Analysis of MTF Outcomes 87
Table B.3—Continued
MTF NameParent
DMIS ID MeanStandard Deviation
95% Lower Bound
95% Upper Bound
56th MeD GrP-LuKe 9 58.0 6.6 43.2 72.8
55th MeD GrP-OFFuTT 78 64.4 6.6 49.7 79.2
reYNOLDS ACh-FT. SILL 98 67.8 4.7 57.3 78.3
NAvAL heALTh CAre New eNGLAND
6223 75.7 4.9 64.6 86.8
NhC hAwAII 280 76.2 3.3 68.8 83.5
1st MeD GrP-LANGLeY 120 64.0 6.0 50.4 77.5
MCDONALD AhC-FT. euSTIS 121 64.0 4.3 54.4 73.6
81st MeD GrP-KeeSLer 73 59.5 5.5 47.1 71.9
375th MeD GrP-SCOTT 55 58.3 2.1 53.6 63.0
79th MeD GrP-ANDrewS 66 60.6 2.6 54.8 66.4
3rd MeD GrP-eLMeNDOrF 6 50.9 3.2 43.8 58.0
NNMC BeTheSDA 67 74.6 4.6 64.3 84.9
6th MeD GrP-MACDILL 45 54.4 4.7 43.9 65.0
96th MeD GrP-eGLIN 42 61.6 3.7 53.3 69.8
88th MeD GrP-wrIGhT-PATTerSON
95 59.2 5.7 46.4 72.1
wILLIAM BeAuMONT AMC- FT. BLISS
108 51.6 3.8 43.0 60.2
60th MeD GrP-TrAvIS 14 48.0 4.6 37.7 58.3
99th MeD GrP-O’CALLAGhAN hOSP
79 54.1 5.1 42.7 65.6
Nh CAMP LeJeuNe 91 68.1 5.7 55.2 80.9
evANS ACh-FT. CArSON 32 69.3 1.7 65.5 73.1
MArTIN ACh-FT. BeNNING 48 63.6 4.9 52.6 74.6
Nh BreMerTON 126 61.8 2.8 55.5 68.1
KIMBrOuGh AMB CAr CeN- FT. MeADe
69 67.3 2.6 61.5 73.1
TrIPLer AMC-FT. ShAFTer 52 78.6 3.3 71.1 86.1
BrOOKe AMC-FT. SAM hOuSTON 109 66.9 2.0 62.3 71.5

88 Assessing the Performance of Military Treatment Facilities
Table B.3—Continued
MTF NameParent
DMIS ID MeanStandard Deviation
95% Lower Bound
95% Upper Bound
wINN ACh-FT. STewArT 49 65.1 4.4 55.2 75.0
Nh PeNSACOLA 38 62.7 3.8 54.2 71.2
eISeNhOwer AMC-FT. GOrDON 47 57.5 2.2 52.7 62.3
59th MeD wING-LACKLAND 117 57.9 2.8 51.7 64.1
BLANChFIeLD ACh-FT. CAMPBeLL 60 63.5 3.6 55.4 71.6
Nh JACKSONvILLe 39 71.8 2.7 65.8 77.8
Nh CAMP PeNDLeTON 24 55.1 3.0 48.3 61.9
MADIGAN AMC-FT. LewIS 125 65.5 1.6 61.8 69.2
DArNALL AMC-FT. hOOD 110 72.1 4.6 61.7 82.5
wOMACK AMC-FT. BrAGG 89 62.9 3.8 54.2 71.5
DewITT ACh-FT. BeLvOIr 123 61.6 2.0 57.1 66.1
NMC SAN DIeGO 29 55.8 2.2 50.9 60.7
NMC POrTSMOuTh 124 69.1 2.8 62.9 75.3
NOTe: These outcomes are measured at a quarterly frequency and averaged over FYs 2004–2005.

Detailed results of Benchmark Analysis of MTF Outcomes 89
Table B.4Monthly Drug Utilization (30-Day Prescriptions Filled) per 100 Equivalent Lives, FYs 2004–2005
MTF NameParent
DMIS ID MeanStandard Deviation
95% Lower Bound
95% Upper Bound
460th MeD GrP-BuCKLeY AFB 7200 66.3 5.1 55.1 77.6
71st MeD GrP-vANCe 338 123.7 6.0 110.4 137.0
47th MeD GrP-LAuGhLIN 114 101.6 5.0 90.7 112.6
PATTerSON AhC- FT. MONMOuTh
81 88.9 4.3 79.4 98.4
14th MeD GrP-COLuMBuS 74 106.8 7.2 90.9 122.8
97th MeD GrP-ALTuS 97 107.0 6.6 92.4 121.6
17th MeD GrP-GOODFeLLOw 364 100.1 4.3 90.5 109.6
319th MeD GrP-GrAND FOrKS 93 77.9 5.4 65.9 89.9
354th MeD GrP-eIeLSON 203 65.8 2.8 59.7 71.9
NhC ANNAPOLIS 306 121.6 7.3 105.4 137.8
66th MeD GrP-hANSCOM 310 83.6 2.5 78.0 89.1
61st MeD SQuAD-LOS ANGeLeS 248 66.3 3.8 58.0 74.6
9th MeD GrP-BeALe 15 83.0 4.5 73.2 92.9
579th MeD GrOuP-BOLLING 413 77.1 4.8 66.5 87.8
KeLLer ACh-weST POINT 86 93.9 5.9 80.9 106.9
30th MeD GrP-vANDeNBerG 18 77.6 2.5 72.1 83.1
27th MeD GrP-CANNON 85 91.3 3.2 84.3 98.4
341st MeD GrP-MALMSTrOM 77 83.2 5.3 71.4 95.0
5th MeD GrP-MINOT 94 90.4 3.0 83.8 96.9
90th MeD GrP-F.e. wArreN 129 85.9 3.6 77.9 94.0
weeD ACh-FT. IrwIN 131 79.1 6.4 64.9 93.2
95th MeD GrP-eDwArDS 19 71.3 3.8 62.8 79.8
23rd MeD GrP-MOODY 50 90.1 7.4 73.7 106.4
49th MeD GrP-hOLLOMAN 84 104.3 4.2 95.1 113.5
437th MeD GrP-ChArLeSTON 356 96.8 2.9 90.4 103.2

90 Assessing the Performance of Military Treatment Facilities
Table B.4—Continued
MTF NameParent
DMIS ID MeanStandard Deviation
95% Lower Bound
95% Upper Bound
366th MeD GrP-MOuNTAIN hOMe
53 87.8 4.6 77.5 98.0
43rd MeDICAL GrOuP-POPe 335 80.9 2.5 75.4 86.3
NhC PATuxeNT rIver 68 105.0 3.4 97.6 112.5
509th MeD GrP-whITeMAN 76 98.7 6.6 84.1 113.4
28th MeD GrP-eLLSwOrTh 106 93.8 2.5 88.4 99.2
22nd MeD GrP-MCCONNeLL 59 126.9 5.5 114.8 139.0
BASSeTT ACh-FT. wAINwrIGhT 5 90.4 2.8 84.2 96.7
15th MeD GrP-hICKAM 287 78.3 7.0 62.9 93.7
1st SPeC OPS MeD GrP-hurLBurT
7139 85.2 5.2 73.8 96.6
7th MeD GrP-DYeSS 112 101.8 7.0 86.4 117.2
62nd MeD GrP-MCChOrD 395 93.0 3.4 85.4 100.6
wALTer reeD AMC-wAShINGTON DC
37 143.4 5.9 130.5 156.4
305th MeD GrP-MCGuIre 326 74.0 3.0 67.4 80.6
314th MeD GrP-LITTLe rOCK 13 97.9 4.6 87.7 108.1
4th MeD GrP-SeYMOur JOhNSON
90 93.3 4.8 82.7 104.0
92nd MeD GrP-FAIrChILD 128 88.3 3.6 80.3 96.2
FOx AhC-reDSTONe ArSeNAL 1 108.5 2.6 102.7 114.3
Nh TweNTYNINe PALMS 30 88.4 3.7 80.1 96.6
436th MeD GrP-DOver 36 95.8 4.3 86.3 105.3
Nh BeAuFOrT 104 99.9 5.2 88.5 111.4
20th MeD GrP-ShAw 101 93.0 4.1 84.0 102.0
82nd MeD GrP-ShePPArD 113 113.6 12.1 86.8 140.4
LYSTer AhC-FT. ruCKer 3 120.1 7.5 103.4 136.7
2nd MeD GrP-BArKSDALe 62 97.2 3.0 90.7 103.8
325th MeD GrP-TYNDALL 43 104.4 4.2 95.2 113.6
KeNNer AhC-FT. Lee 122 87.4 3.5 79.8 95.1

Detailed results of Benchmark Analysis of MTF Outcomes 91
Table B.4—Continued
MTF NameParent
DMIS ID MeanStandard Deviation
95% Lower Bound
95% Upper Bound
r w BLISS AhC-FT. huAChuCA 8 94.8 3.0 88.1 101.5
Nh ChArLeSTON 103 113.7 3.1 106.8 120.6
Nh COrPuS ChrISTI 118 108.3 4.3 98.8 117.8
MuNSON AhC- FT. LeAveNwOrTh
58 103.4 5.9 90.3 116.5
Nh OAK hArBOr 127 95.4 4.0 86.7 104.1
Nh LeMOOre 28 102.3 5.7 89.8 114.8
45th MeD GrP-PATrICK 46 110.9 5.7 98.3 123.6
BAYNe-JONeS ACh-FT. POLK 64 104.3 4.6 94.2 114.4
Nh CherrY POINT 92 98.5 2.0 94.0 103.0
75th MeD GrP-hILL 119 91.5 3.2 84.5 98.5
NhC GreAT LAKeS 56 105.4 3.2 98.4 112.4
42nd MeDICAL GrOuP-MAxweLL
4 104.1 3.6 96.2 112.1
GuThrIe AhC-FT. DruM 330 93.6 4.5 83.6 103.6
78th MeD GrP-rOBINS 51 112.6 2.9 106.2 119.1
377th MeD GrP-KIrTLAND 83 94.8 4.7 84.4 105.2
L. wOOD ACh-FT. LeONArD wOOD
75 125.0 6.6 110.6 139.5
21st MeD GrP-PeTerSON 252 90.3 4.6 80.0 100.6
72nd MeD GrP-TINKer 96 103.8 6.1 90.4 117.3
IrwIN ACh-FT. rILeY 57 97.9 7.3 81.8 114.1
MONCrIeF ACh-FT. JACKSON 105 112.1 2.2 107.2 117.0
12th MeD GrP-rANDOLPh 366 111.2 4.0 102.4 120.1
NhC QuANTICO 385 90.8 4.2 81.6 100.0
355th MeD GrP-DAvIS MONThAN
10 94.3 3.6 86.3 102.2
10th MeD GrOuP-uSAF ACADeMY CO
33 99.1 6.5 84.7 113.5
IreLAND ACh-FT. KNOx 61 127.6 4.7 117.1 138.0
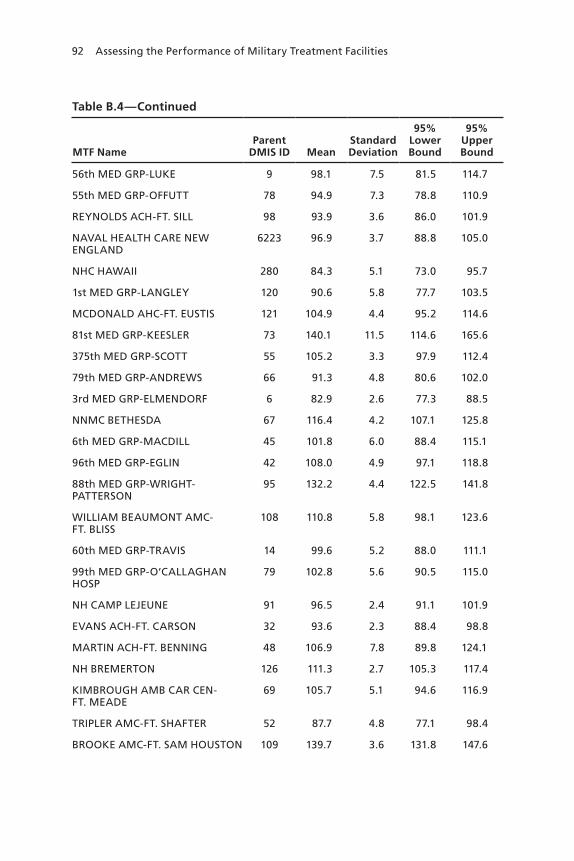
92 Assessing the Performance of Military Treatment Facilities
Table B.4—Continued
MTF NameParent
DMIS ID MeanStandard Deviation
95% Lower Bound
95% Upper Bound
56th MeD GrP-LuKe 9 98.1 7.5 81.5 114.7
55th MeD GrP-OFFuTT 78 94.9 7.3 78.8 110.9
reYNOLDS ACh-FT. SILL 98 93.9 3.6 86.0 101.9
NAvAL heALTh CAre New eNGLAND
6223 96.9 3.7 88.8 105.0
NhC hAwAII 280 84.3 5.1 73.0 95.7
1st MeD GrP-LANGLeY 120 90.6 5.8 77.7 103.5
MCDONALD AhC-FT. euSTIS 121 104.9 4.4 95.2 114.6
81st MeD GrP-KeeSLer 73 140.1 11.5 114.6 165.6
375th MeD GrP-SCOTT 55 105.2 3.3 97.9 112.4
79th MeD GrP-ANDrewS 66 91.3 4.8 80.6 102.0
3rd MeD GrP-eLMeNDOrF 6 82.9 2.6 77.3 88.5
NNMC BeTheSDA 67 116.4 4.2 107.1 125.8
6th MeD GrP-MACDILL 45 101.8 6.0 88.4 115.1
96th MeD GrP-eGLIN 42 108.0 4.9 97.1 118.8
88th MeD GrP-wrIGhT-PATTerSON
95 132.2 4.4 122.5 141.8
wILLIAM BeAuMONT AMC- FT. BLISS
108 110.8 5.8 98.1 123.6
60th MeD GrP-TrAvIS 14 99.6 5.2 88.0 111.1
99th MeD GrP-O’CALLAGhAN hOSP
79 102.8 5.6 90.5 115.0
Nh CAMP LeJeuNe 91 96.5 2.4 91.1 101.9
evANS ACh-FT. CArSON 32 93.6 2.3 88.4 98.8
MArTIN ACh-FT. BeNNING 48 106.9 7.8 89.8 124.1
Nh BreMerTON 126 111.3 2.7 105.3 117.4
KIMBrOuGh AMB CAr CeN- FT. MeADe
69 105.7 5.1 94.6 116.9
TrIPLer AMC-FT. ShAFTer 52 87.7 4.8 77.1 98.4
BrOOKe AMC-FT. SAM hOuSTON 109 139.7 3.6 131.8 147.6

Detailed results of Benchmark Analysis of MTF Outcomes 93
Table B.4—Continued
MTF NameParent
DMIS ID MeanStandard Deviation
95% Lower Bound
95% Upper Bound
wINN ACh-FT. STewArT 49 101.5 4.0 92.7 110.3
Nh PeNSACOLA 38 112.6 4.3 103.0 122.2
eISeNhOwer AMC-FT. GOrDON 47 128.9 4.5 119.1 138.7
59th MeD wING-LACKLAND 117 119.4 2.5 113.8 125.0
BLANChFIeLD ACh-FT. CAMPBeLL 60 99.7 3.6 91.8 107.7
Nh JACKSONvILLe 39 107.9 3.5 100.1 115.6
Nh CAMP PeNDLeTON 24 79.8 3.3 72.5 87.1
MADIGAN AMC-FT. LewIS 125 106.9 4.9 96.1 117.6
DArNALL AMC-FT. hOOD 110 97.6 7.7 80.7 114.6
wOMACK AMC-FT. BrAGG 89 87.5 4.8 76.8 98.1
DewITT ACh-FT. BeLvOIr 123 100.6 3.8 92.3 109.0
NMC SAN DIeGO 29 97.0 3.2 90.0 104.1
NMC POrTSMOuTh 124 114.5 4.4 104.6 124.3
NOTe: These outcomes are measured at a quarterly frequency and averaged over FYs 2004–2005.
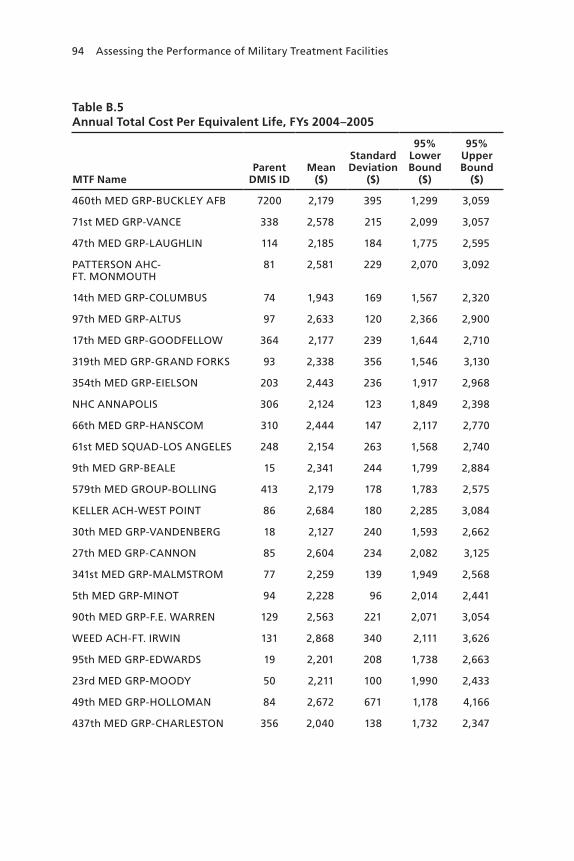
94 Assessing the Performance of Military Treatment Facilities
Table B.5Annual Total Cost Per Equivalent Life, FYs 2004–2005
MTF NameParent
DMIS IDMean
($)
Standard Deviation
($)
95% Lower Bound
($)
95% Upper Bound
($)
460th MeD GrP-BuCKLeY AFB 7200 2,179 395 1,299 3,059
71st MeD GrP-vANCe 338 2,578 215 2,099 3,057
47th MeD GrP-LAuGhLIN 114 2,185 184 1,775 2,595
PATTerSON AhC- FT. MONMOuTh
81 2,581 229 2,070 3,092
14th MeD GrP-COLuMBuS 74 1,943 169 1,567 2,320
97th MeD GrP-ALTuS 97 2,633 120 2,366 2,900
17th MeD GrP-GOODFeLLOw 364 2,177 239 1,644 2,710
319th MeD GrP-GrAND FOrKS 93 2,338 356 1,546 3,130
354th MeD GrP-eIeLSON 203 2,443 236 1,917 2,968
NhC ANNAPOLIS 306 2,124 123 1,849 2,398
66th MeD GrP-hANSCOM 310 2,444 147 2,117 2,770
61st MeD SQuAD-LOS ANGeLeS 248 2,154 263 1,568 2,740
9th MeD GrP-BeALe 15 2,341 244 1,799 2,884
579th MeD GrOuP-BOLLING 413 2,179 178 1,783 2,575
KeLLer ACh-weST POINT 86 2,684 180 2,285 3,084
30th MeD GrP-vANDeNBerG 18 2,127 240 1,593 2,662
27th MeD GrP-CANNON 85 2,604 234 2,082 3,125
341st MeD GrP-MALMSTrOM 77 2,259 139 1,949 2,568
5th MeD GrP-MINOT 94 2,228 96 2,014 2,441
90th MeD GrP-F.e. wArreN 129 2,563 221 2,071 3,054
weeD ACh-FT. IrwIN 131 2,868 340 2,111 3,626
95th MeD GrP-eDwArDS 19 2,201 208 1,738 2,663
23rd MeD GrP-MOODY 50 2,211 100 1,990 2,433
49th MeD GrP-hOLLOMAN 84 2,672 671 1,178 4,166
437th MeD GrP-ChArLeSTON 356 2,040 138 1,732 2,347

Detailed results of Benchmark Analysis of MTF Outcomes 95
Table B.5—Continued
MTF NameParent
DMIS IDMean
($)
Standard Deviation
($)
95% Lower Bound
($)
95% Upper Bound
($)
366th MeD GrP-MOuNTAIN hOMe
53 2,462 149 2,131 2,793
43rd MeDICAL GrOuP-POPe 335 1,822 98 1,603 2,041
NhC PATuxeNT rIver 68 2,406 90 2,206 2,607
509th MeD GrP-whITeMAN 76 2,274 150 1,940 2,608
28th MeD GrP-eLLSwOrTh 106 2,406 484 1,329 3,483
22nd MeD GrP-MCCONNeLL 59 2,246 129 1,959 2,534
BASSeTT ACh-FT. wAINwrIGhT 5 2,958 244 2,414 3,501
15th MeD GrP-hICKAM 287 1,952 177 1,557 2,347
1st SPeC OPS MeD GrP-hurLBurT
7139 2,000 143 1,682 2,318
7th MeD GrP-DYeSS 112 2,436 230 1,923 2,948
62nd MeD GrP-MCChOrD 395 1,764 136 1,460 2,067
wALTer reeD AMC-wAShINGTON DC
37 6,904 382 6,053 7,755
305th MeD GrP-MCGuIre 326 2,413 367 1,595 3,230
314th MeD GrP-LITTLe rOCK 13 2,008 104 1,776 2,240
4th MeD GrP-SeYMOur JOhNSON
90 1,950 141 1,636 2,263
92nd MeD GrP-FAIrChILD 128 2,078 147 1,751 2,406
FOx AhC-reDSTONe ArSeNAL 1 2,225 137 1,920 2,530
Nh TweNTYNINe PALMS 30 3,076 187 2,659 3,493
436th MeD GrP-DOver 36 1,807 206 1,347 2,266
Nh BeAuFOrT 104 2,443 282 1,817 3,070
20th MeD GrP-ShAw 101 1,903 116 1,646 2,161
82nd MeD GrP-ShePPArD 113 2,477 192 2,049 2,905
LYSTer AhC-FT. ruCKer 3 2,163 120 1,896 2,430
2nd MeD GrP-BArKSDALe 62 2,198 205 1,742 2,655
325th MeD GrP-TYNDALL 43 2,288 143 1,970 2,607

96 Assessing the Performance of Military Treatment Facilities
Table B.5—Continued
MTF NameParent
DMIS IDMean
($)
Standard Deviation
($)
95% Lower Bound
($)
95% Upper Bound
($)
KeNNer AhC-FT. Lee 122 1,907 190 1,483 2,331
r w BLISS AhC-FT. huAChuCA 8 2,266 204 1,812 2,720
Nh ChArLeSTON 103 2,761 269 2,161 3,360
Nh COrPuS ChrISTI 118 2,418 128 2,133 2,704
MuNSON AhC- FT. LeAveNwOrTh
58 2,326 162 1,965 2,686
Nh OAK hArBOr 127 2,191 88 1,994 2,387
Nh LeMOOre 28 2,590 155 2,245 2,936
45th MeD GrP-PATrICK 46 2,069 108 1,829 2,309
BAYNe-JONeS ACh-FT. POLK 64 2,407 74 2,242 2,571
Nh CherrY POINT 92 2,379 127 2,095 2,662
75th MeD GrP-hILL 119 2,078 98 1,861 2,295
NhC GreAT LAKeS 56 2,166 151 1,831 2,502
42ND MeDICAL GrOuP-MAxweLL
4 2,095 125 1,816 2,375
GuThrIe AhC-FT. DruM 330 1,889 141 1,576 2,203
78th MeD GrP-rOBINS 51 2,054 65 1,909 2,199
377th MeD GrP-KIrTLAND 83 1,763 148 1,433 2,093
L. wOOD ACh-FT. LeONArD wOOD
75 2,764 177 2,371 3,157
21st MeD GrP-PeTerSON 252 1,709 131 1,416 2,001
72nd MeD GrP-TINKer 96 2,329 58 2,201 2,457
IrwIN ACh-FT. rILeY 57 2,320 258 1,746 2,893
MONCrIeF ACh-FT. JACKSON 105 1,991 112 1,742 2,240
12th MeD GrP-rANDOLPh 366 1,814 83 1,630 1,997
NhC QuANTICO 385 2,018 129 1,731 2,304
355th MeD GrP-DAvIS MONThAN
10 2,010 138 1,704 2,317

Detailed results of Benchmark Analysis of MTF Outcomes 97
Table B.5—Continued
MTF NameParent
DMIS IDMean
($)
Standard Deviation
($)
95% Lower Bound
($)
95% Upper Bound
($)
10th MeD GrOuP-uSAF ACADeMY CO
33 2,100 103 1,870 2,330
IreLAND ACh-FT. KNOx 61 2,533 215 2,056 3,011
56th MeD GrP-LuKe 9 2,366 249 1,813 2,919
55th MeD GrP-OFFuTT 78 2,320 247 1,770 2,871
reYNOLDS ACh-FT. SILL 98 2,147 51 2,035 2,260
NAvAL heALTh CAre New eNGLAND
6223 2,688 296 2,029 3,346
NhC hAwAII 280 2,112 120 1,845 2,379
1st MeD GrP-LANGLeY 120 2,054 141 1,740 2,368
MCDONALD AhC-FT. euSTIS 121 1,968 129 1,681 2,255
81st MeD GrP-KeeSLer 73 2,653 142 2,336 2,969
375th MeD GrP-SCOTT 55 2,434 97 2,218 2,649
79th MeD GrP-ANDrewS 66 2,637 171 2,258 3,017
3rd MeD GrP-eLMeNDOrF 6 2,179 95 1,968 2,390
NNMC BeTheSDA 67 3,435 284 2,803 4,068
6th MeD GrP-MACDILL 45 2,113 158 1,761 2,465
96th MeD GrP-eGLIN 42 2,349 97 2,133 2,565
88th MeD GrP-wrIGhT-PATTerSON
95 2,834 255 2,267 3,402
wILLIAM BeAuMONT AMC- FT. BLISS
108 2,549 126 2,268 2,831
60th MeD GrP-TrAvIS 14 2,558 110 2,314 2,802
99th MeD GrP-O’CALLAGhAN hOSP
79 2,647 264 2,061 3,234
Nh CAMP LeJeuNe 91 2,299 215 1,821 2,777
evANS ACh-FT. CArSON 32 2,426 126 2,145 2,706
MArTIN ACh-FT. BeNNING 48 1,964 102 1,736 2,191
Nh BreMerTON 126 2,497 171 2,117 2,877
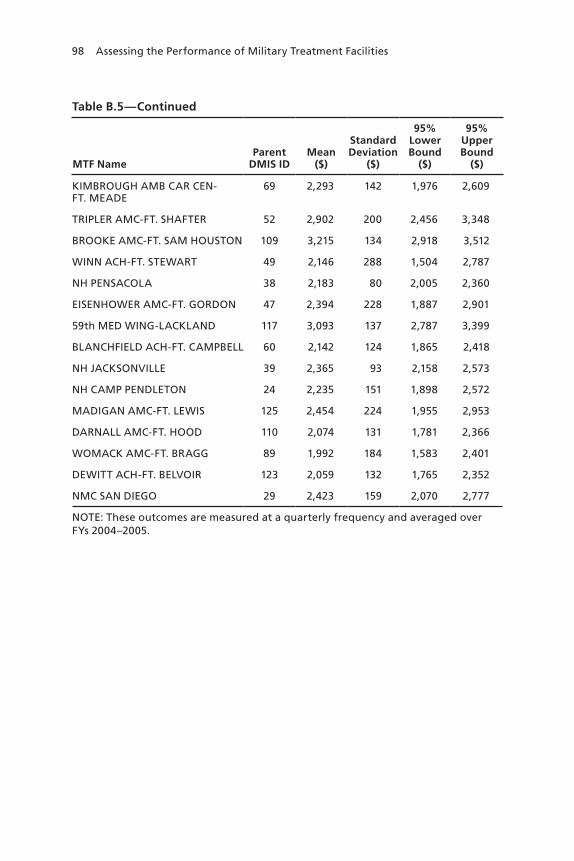
98 Assessing the Performance of Military Treatment Facilities
Table B.5—Continued
MTF NameParent
DMIS IDMean
($)
Standard Deviation
($)
95% Lower Bound
($)
95% Upper Bound
($)
KIMBrOuGh AMB CAr CeN- FT. MeADe
69 2,293 142 1,976 2,609
TrIPLer AMC-FT. ShAFTer 52 2,902 200 2,456 3,348
BrOOKe AMC-FT. SAM hOuSTON 109 3,215 134 2,918 3,512
wINN ACh-FT. STewArT 49 2,146 288 1,504 2,787
Nh PeNSACOLA 38 2,183 80 2,005 2,360
eISeNhOwer AMC-FT. GOrDON 47 2,394 228 1,887 2,901
59th MeD wING-LACKLAND 117 3,093 137 2,787 3,399
BLANChFIeLD ACh-FT. CAMPBeLL 60 2,142 124 1,865 2,418
Nh JACKSONvILLe 39 2,365 93 2,158 2,573
Nh CAMP PeNDLeTON 24 2,235 151 1,898 2,572
MADIGAN AMC-FT. LewIS 125 2,454 224 1,955 2,953
DArNALL AMC-FT. hOOD 110 2,074 131 1,781 2,366
wOMACK AMC-FT. BrAGG 89 1,992 184 1,583 2,401
DewITT ACh-FT. BeLvOIr 123 2,059 132 1,765 2,352
NMC SAN DIeGO 29 2,423 159 2,070 2,777
NOTe: These outcomes are measured at a quarterly frequency and averaged over FYs 2004–2005.

Detailed results of Benchmark Analysis of MTF Outcomes 99
Table B.6Standard Deviations of MTF Outcomes in FYs 2004–2005 and FY 2006, Mean by MTF Size Quintile
Size QuintileStandard Deviation,
FYs 2004–2005Standard Deviation,
FY 2006Ratio of FY 2006 to
FYs 2004–2005
Inpatient utilization
All 0.57 0.66 1.61
1 (smallest) 0.82 0.92 2.33
2 0.68 0.76 1.49
3 0.49 0.70 1.65
4 0.43 0.46 1.30
5 (largest) 0.40 0.44 1.27
Outpatient utilization
All 3.2 4.3 1.47
1 (smallest) 3.4 4.9 1.53
2 3.7 5.1 1.40
3 3.0 3.9 1.41
4 3.4 4.0 1.30
5 (largest) 2.4 3.7 1.74
Drug utilization
All 3.4 4.4 1.48
1 (smallest) 3.4 4.3 1.43
2 3.3 4.3 1.56
3 3.3 4.8 1.66
4 3.9 4.7 1.32
5 (largest) 3.0 3.9 1.43
Total cost
All $112 $147 1.75
1 (smallest) $141 $230 2.04
2 $146 $147 1.56
3 $94 $119 1.65
4 $91 $109 1.55
5 (largest) $87 $129 1.94
NOTe: Standard deviations are in levels. Size quintiles are defined by mean non-active duty Prime enrollment in FYs 2004–2005; see Table 4.3.


101
APPeNDIx C
Outpatient Utilization and MTF Size
Mean outpatient utilization among MTFs’ enrollees decreased (albeit modestly) with MTF size in Figure 4.3, while the mean levels of the other outcomes increased with size. OASD(HA) has noted that out-patient care received from MTFs does not include ancillary workload, while outpatient care received from civilian health care providers does. If large MTFs are less reliant on civilian providers for this care, mean outpatient utilization may appear to be lower at these MTFs, even if outpatient utilization did not vary (or actually increased) with size. We investigate this possibility by regressing mean outpatient utiliza-tion at MTFs during FYs 2004–2005 on the number of non-active duty enrollees, as well as the share of outpatient utilization delivered by civilian providers.1
The results appear in Table C.1. In the first specification, a larger number of non-active duty enrollees is associated with modestly lower utilization; we cannot, however, reject the hypothesis that there is in fact no relationship. In the second specification, the civilian share of outpatient care is included. We cannot reject the hypothesis that this share is unrelated to utilization, suggesting that under-reporting of outpatient workload at MTFs does not lead to a spurious relationship between mean outpatient utilization and MTF size. Indeed, we are again unable to reject the hypothesis that utilization is unrelated to the number of non-active duty enrollees, suggesting that this relationship is negligible.
1 The results are similar when size is measured by the number of non-active duty equivalent lives enrolled at MTFs.

102 Assessing the Performance of Military Treatment Facilities
Table C.1Regression of Outpatient Utilization
Specification
1 2
Parameter estimate (Standard error)
Constant 64.668***
(1.157)
61.146***
(2.767)
Number of non-active duty enrollees (thousands)
–0.029
(0.048)
–0.064
(0.054)
Civilian share of outpatient utilization (%) —
0.077
(0.055)
Other Statistics
r-squared 0.003 0.020
N 114
NOTeS: Dependent and independent variables are FY 2004–2005 means.
* denotes statistical significance at the 10 percent level.
** denotes statistical significance at the 5 percent level.
*** denotes statistical significance at the 1 percent level.

103
APPeNDIx D
Catastrophic Hospital Admissions
We identified hospital admissions as catastrophic if the DRG associated with the diagnosis was sufficiently resource-intensive. The resource use of DRGs was measured by RWPs. Alternative thresholds were the top 1, 5, and 10 percent of DRGs with respect to RWPs. Table D.1 identi-fies these catastrophic DRGs, describes them, and notes the most strin-gent threshold met. For example, DRG 106 (Coronary Bypass with PTCA) is in the top 5 percent of DRGs by RWPs; as a result, this DRG is in the top 10 percent but not the top 1 percent.

104 Assessing the Performance of Military Treatment Facilities
Table D.1Top 10 Percent of DRGs, by RWPs
DRG DescriptionThreshold
(%)
1 CrANIOTOMY AGe >17 w CC 10
103 heArT & heArT/LuNG TrANSPLANT 1
104 CArDIAC vALve & OTher MAJOr CArDIOThOrACIC PrOC w CArDIAC CATh
5
105 CArDIAC vALve & OTher MAJOr CArDIOThOrACIC PrOC w/O CArDIAC CATh
10
106 COrONArY BYPASS w PTCA 5
107 COrONArY BYPASS w CArDIAC CATh 10
108 OTher CArDIOThOrACIC PrOCeDureS 10
109 COrONArY BYPASS w/O CArDIAC CATh 10
110 MAJOr CArDIOvASCuLAr PrOCeDureS w CC 10
113 AMPuTATION FOr CIrC SYSTeM DISOrDerS exCePT uPPer LIMB & TOe
10
115 PrM CArD PACeM IMPL w AMI/hF/ShOCK Or AICD LeAD Or GNrTr PrOC
10
154 STOMACh: eSOPhAGeAL & DuODeNAL PrOCeDureS AGe >17 w CC
10
191 PANCreAS: LIver & ShuNT PrOCeDureS w CC 10
201 OTher hePATOBILIArY Or PANCreAS O.r. PrOCeDureS 10
292 OTher eNDOCrINe: NuTrIT & MeTAB O.r. PrOC w CC 10
302 KIDNeY TrANSPLANT 10
473 ACuTe LeuKeMIA w/O MAJOr O.r. PrOCeDure AGe >17 5
475 reSPIrATOrY SYSTeM DIAGNOSIS wITh veNTILATOr SuPPOrT 10
480 LIver TrANSPLANT 5
481 BONe MArrOw TrANSPLANT 5
482 TrACheOSTOMY FOr FACe, MOuTh & NeCK DIAGNOSeS 10
483 TrACh w MeCh veNT 96+ hrS Or PDx exCePT FACe, MOuTh & NeCK DIAG
1
484 CrANIOTOMY FOr MuLTIPLe SIGNIFICANT TrAuMA 5
485 LIMB reATTAChMeNT: hIP AND FeMur PrOC FOr MuLTIPLe SIGNIFICANT T
10

Catastrophic hospital Admissions 105
Table D.1—Continued
DRG DescriptionThreshold
(%)
486 OTher O.r. PrOCeDureS FOr MuLTIPLe SIGNIFICANT TrAuMA 10
488 hIv w exTeNSIve O.r. PrOCeDure 10
495 LuNG TrANSPLANT 5
496 COMBINeD ANTerIOr/POSTerIOr SPINAL FuSION 10
497 SPINAL FuSION exCePT CervICAL w CC 10
504 exTeNSIve 3rD DeGree BurNS w SKIN GrAFT 5
506 FuLL ThICKNeSS BurN w SKIN GrAFT Or INhAL INJ w CC Or SIG TrAuMA
10
512 SIMuLTANeOuS PANCreAS/KIDNeY TrANSPLANT 10
515 CArDIAC DeFIBrILLATOr IMPLANT w/O CArDIAC CATh 5
525 heArT ASSIST SYSTeM IMPLANT 1
528 INTrACrANIAL vASCuLAr PrOCeDureS w PDx heMOrrhAGe 5
531 SPINAL PrOCeDureS w CC 10
535 CArDIAC DeFIB IMPLANT w CArDIAC CATh w AMI/hF/ShOCK 5
536 CArDIAC DeFIB IMPLANT w CArDIAC CATh w/O AMI/hF/ShOCK
5
539 LYMPhOMA & LeuKeMIA w MAJOr O.r. PrOCeDure w CC 10
602 NeONATe: BIrThwT <750G: DISChArGeD ALIve 1
603 NeONATe: BIrThwT <750G: DIeD 5
604 NeONATe: BIrThwT 7500–0999G: DISChArGeD ALIve 5
606 NeONATe: BIrThwT 10000–01499G: w SIGNIF Or PrOC: DISChArGeD ALIve
1
607 NeONATe: BIrThwT 10000–01499G: w/O SIGNIF Or PrOC: DISChArGeD ALI
5
608 NeONATe: BIrThwT 10000–01499G: DIeD 5
609 NeONATe: BIrThwT 15000–01999G: w SIGNIF Or PrOC: w MuLT MAJOr PrOB
5
611 NeONATe: BIrThwT 15000–01999G: w/O SIGNIF Or PrOC: w MuLT MAJOr PrOB
10
615 NeONATe: BIrThwT 20000–02499G: w SIGNIF Or PrOC: w MuLT MAJOr PrOB
5

106 Assessing the Performance of Military Treatment Facilities
Table D.1—Continued
DRG DescriptionThreshold
(%)
616 NeONATe: BIrThwT 20000–02499G: w SIGNIF Or PrOC: w/O MuLT MAJOr PrOB
10
617 NeONATe: BIrThwT 20000–02499G: w/O SIGNIF Or PrOC: w MuLT MAJOr PrOB
10
622 NeONATe: BIrThwT >2499G: w SIGNIF Or PrOC: w MuLT MAJOr PrOB
5

107
APPeNDIx e
Detailed Results of Analysis of Catastrophic Hospital Admissions
Tables E.1–E.3 report the results of the regressions of total inpatient utilization (RWPs) per 1,000 equivalent lives per month on cata-strophic utilization—as well as indicator variables for each MTF for the summer, fall, and winter quarters—for FY 2004. The regressions exclude the 460th Medical Group at Buckley Air Force Base (Parent DMIS ID 7200), whose outcomes were extreme outliers. As in our benchmark analysis, the utilization data are quarterly averages. Each table corresponds to a different threshold according to which high-RWP DRGs define catastrophic hospital admissions, as described in Chapter Five.

108 Assessing the Performance of Military Treatment Facilities
Table E.1Results of Regression of Total Inpatient Utilization, with Catastrophic Admissions Defined by the Highest 1 Percent of DRGs by Resource Use
Parameter estimate (Standard error)
Catastrophic inpatient utilization 1.053*** (0.104)
Summer quarter 0.661*** (0.105)
Fall quarter 0.487*** (0.106)
winter quarter 0.358*** (0.105)
Other Statistics
r-squared 0.909
N 452
NOTeS: Parameter estimates corresponding to MTF indicator variables are not reported here. * denotes statistical significance at the 10 percent level.
** denotes statistical significance at the 5 percent level.
*** denotes statistical significance at the 1 percent level.
Table E.2Results of Regression of Total Inpatient Utilization, with Catastrophic Admissions Defined by the Highest 5 Percent of DRGs by Resource Use
Parameter estimate (Standard error)
Catastrophic inpatient utilization 1.013*** (0.064)
Summer quarter 0.528*** (0.092)
Fall quarter 0.364*** (0.092)
winter quarter 0.249*** (0.091)
Other Statistics
r-squared 0.932
N 452
NOTeS: Parameter estimates corresponding to MTF indicator variables are not reported here.
* denotes statistical significance at the 10 percent level.
** denotes statistical significance at the 5 percent level.
*** denotes statistical significance at the 1 percent level.

Detailed results of Analysis of Catastrophic hospital Admissions 109
Table E.3Results of Regression of Total Inpatient Utilization, with Catastrophic Admissions Defined by the Highest 10 Percent of DRGs by Resource Use
Parameter estimate (Standard error)
Catastrophic inpatient utilization 1.028*** (0.050)
Summer quarter 0.456*** (0.080)
Fall quarter 0.272*** (0.081)
winter quarter 0.174*** (0.080)
Other Statistics
r-squared 0.948
N 452
NOTeS: Parameter estimates corresponding to MTF indicator variables are not reported here.
* denotes statistical significance at the 10 percent level.
** denotes statistical significance at the 5 percent level.
*** denotes statistical significance at the 1 percent level.


111
Bibliography
Amemiya, Takeshi, Introduction to Statistics and Econometrics, Cambridge, Mass.: Harvard University Press, 1994.
Atkinson, Gregory, PMPM Calculation, emailed to the authors, January 3, 2007a.
———, PMPM Summary March 2007 with Beneficiary Categories file, emailed to the authors, May 14, 2007b.
Bronskill, Susan, Sharon-Lise Normand, Mary Beth Landrum, and Robert Rosenheck, “Longitudinal Profiles of Health Care Providers,” Statistics in Medicine, Vol. 21, 2002, pp. 1067–1088.
Consumer-Purchaser Disclosure Project, More Efficient Physicians: A Path to Significant Savings in Health Care, Washington, D.C., 2003.
Donabedian, Avedis, “The Quality of Care: How Can It Be Assessed?” Journal of the American Medical Association, Vol. 260, No. 12, 1988, pp. 1743–1748.
Dranove, David, Daniel Kessler, Mark McClellan, and Mark Satterthwaite, “Is More Information Better? The Effects of “Report Cards” on Health Care Providers,” Journal of Political Economy, Vol. 111, No. 3, 2003, pp. 555–588.
Goldstein, Harvey, and David J. Spiegelhalter, “League Tables and Their Limitations: Statistical Issues in Comparisons of Institutional Performance,” Journal of the Royal Statistical Society, Series A (Statistics in Society), Vol. 159, No. 3, 1996, pp. 385–443.
Greene, William H., Econometric Analysis, 5th Edition, Upper Saddle River, N.J.: Prentice Hall, 2003.
Hanchate, A., N. McCall, and A. Ash, The Adoption of Risk Adjustment Modeling for Prospective Payments, Falls Church, Va.: TRICARE Management Activity, Health Program Analysis and Evaluation Division, Center for Health Care Management Studies, RTI Project Number 08490-013, June 2006.
Huang, I-Chan, Francesca Dominici, Constantine Frangakis, Gregory B. Diette, Cheryl L. Damberg, and Albert W. Wu, “Is Risk-Adjustor Selection More Important Than Statistical Approach for Provider Profiling? Asthma as an Example,” Medical Decision Making, Vol. 25, No. 1, 2005, pp. 20–34.

112 Assessing the Performance of Military Treatment Facilities
Linden, Ariel, John L. Adams, and Nancy Roberts, “An Assessment of the Total Population Approach for Evaluating Disease Management Program Effectiveness,” Disease Management, Vol. 6, No. 2, 2003, pp. 93–102.
Luft, Harold S., Sandra S. Hunt, and Susan C. Maerki, “The Volume-Outcome Relationship: Practice-Makes-Perfect or Selective Referral Patterns?” Health Services Research, Vol. 22, No. 2, 1987, pp. 157–182.
Marshall, Guillermo, A. Laurie W. Shroyer, Fred L. Grover, and Karl E. Hammermeister, “Time Series Monitors of Outcomes: A New Dimension for Measuring Quality,” Medical Care, Vol. 36, No. 3, 1998, pp. 348–356.
McGlynn, Elizabeth A., Paul G. Shekelle, et al., Identifying, Categorizing, and Evaluating Health Care Efficiency Measures, Rockville, Md.: U.S. Department of Health and Human Services, Agency for Healthcare Research and Quality, 2008. As of June 25, 2009: http://www.ahrq.gov/qual/efficiency/index.html
Military Health System, MHS Strategic Plan Balanced Scorecard Overview, no date. As of April 21, 2009: http://www.ha.osd.mil/strat_plan/MHS%20Strategic%20Plan%20Overview.ppt
———, Military Health System Strategic Plan, April 2007. As of April 27, 2007: http://www.ha.osd.mil/strat_plan/MHS_Strategic_Plan_07Apr.pdf
Newhouse, Joseph P., Melinda Beeuwkes Buntin, and John D. Chapman, “Risk Adjustment and Medicare: Taking a Closer Look,” Health Affairs, Vol. 16, No. 5, 1997, pp. 26–43.
Office of Statewide Health Planning and Development (California), Community-Acquired Pneumonia in California: Hospital Outcomes in 2002–2004, Sacramento, Calif.: Office of Statewide Health Planning and Development, Healthcare Information Division, 2006.
Opsut, Robert, meeting with project monitor, December 20, 2006.
Solon, Jerry A., James J. Feeney, Sally H. Jones, Ruth D. Rigg, and Cecil G. Sheps, “Delineating Episodes of Medical Care,” American Journal of Public Health, Vol. 57, No. 3, 1967, pp. 401–408.
Tapei Branch of Bureau of National Health Insurance, “Application of Catastrophic Illness Certificate,” Web page, 2008. As of June 25, 2009: http://www.nhitb.gov.tw/english/peopcure/illness.asp
TRICARE Management Activity—See U.S. Department of Defense, Office of the Assistant Secretary of Defense for Health Affairs, Health Program Analysis and Evaluation Directorate, TRICARE Management Activity.
U.S. Department of Defense, “Department of Defense Medicare Eligible Retiree Health Care Fund Operations,” Instruction Number 6070.2, July 19, 2002. As of June 25, 2009: http://www.dtic.mil/whs/directives/corres/pdf/607002p.pdf

Bibliography 113
U.S. Department of Defense, Office of the Assistant Secretary of Defense for Health Affairs, Health Program Analysis and Evaluation Directorate, TRICARE Management Activity, “TRICARE Costs,” Web page, no date. As of June 25, 2009: http://www.tricare.mil/tricarecost.cfm
———, TRICARE Operations Manual 6010.51-M, August 1, 2002. As of June 25, 2009: http://manuals.tricare.osd.mil/
———, “Leveraging the Quadrennial Defense Review (QDR) to Transform the Military Health System,” presentation at the State of the MHS—2006 Annual TRICARE Conference, Washington, D.C., January 31, 2006. As of June 25, 2009: http://www.tricare.mil/conferences/2006/download/092Foster.ppt
———, Evaluation of the TRICARE Program: FY 2007 Report to Congress, 2007a. As of June 25, 2009: http://www.tricare.mil/hpae/_docs/FY2007_2_27_07.pdf
———, “Prospective Payment System,” presentation at the State of the MHS—2007 Annual TRICARE Conference, Washington, D.C., January 29, 2007b. As of June 25, 2009: http://www.tricare.mil/conferences/2007/Mon/M400.ppt
———, “Per Member Per Month (PMPM): Metric Methodologies,” presentation to the State of the MHS—2007 Annual TRICARE Conference, Washington, D.C., January 31, 2007c. As of June 25, 2009: http://www.tricare.mil/conferences/2007/Wed/W420.ppt
———, “Transforming to Performance Based Financial Management,” presentation to the State of the MHS—2007 Annual TRICARE Conference, Washington, D.C., January 31, 2007d. As of June 25, 2009: http://www.tricare.mil/conferences/2007/Wed/W414.ppt
U.S. Department of Defense, Task Force on the Future of Military Health Care, Final Report, December 2007. As of June 25, 2009: http://www.dodfuturehealthcare.net/
U.S. Department of Health and Human Services, Centers for Medicare and Medicaid Services, Report to Congress: Plan to Implement a Medicare Hospital Value-Based Purchasing Program, 2007. As of June 25, 2009: http://www.cms.hhs.gov/AcuteInpatientPPS/downloads/HospitalVBPPlanRTCFINALSUBMITTED2007.pdf
U.S. Government Accountability Office, Medicare: Focus on Physician Practice Patterns Can Lead to Greater Efficiency, Washington, D.C., GAO-07-307, 2007a. As of June 25, 2009: http://www.gao.gov/cgi-bin/getrpt?GAO-07-307

114 Assessing the Performance of Military Treatment Facilities
———, Military Health Care: TRICARE Cost-Sharing Proposals Would Help Offset Increasing Health Care Spending, but Projected Savings Are Likely Overestimated, Washington, D.C., GAO-07-647, 2007b. As of June 25, 2009: http://www.gao.gov/new.items/d07647.pdf