assessing the likely ecological effects of environmental ... · causality in environmental science....
TRANSCRIPT

Susan Nichols & Renee Brawata
Institute for Applied Ecology & MDBfutures CRN
University of Canberra
Assessing the likely ecological effects
of environmental flows:
Systematic evaluation of ecological
literature to support causal inference

Susan Nichols
Institute for Applied Ecology & MDBfutures CRN
University of Canberra
Richard Norris, Angus Webb, Mike Stewardson
The case for causal criteria analysis
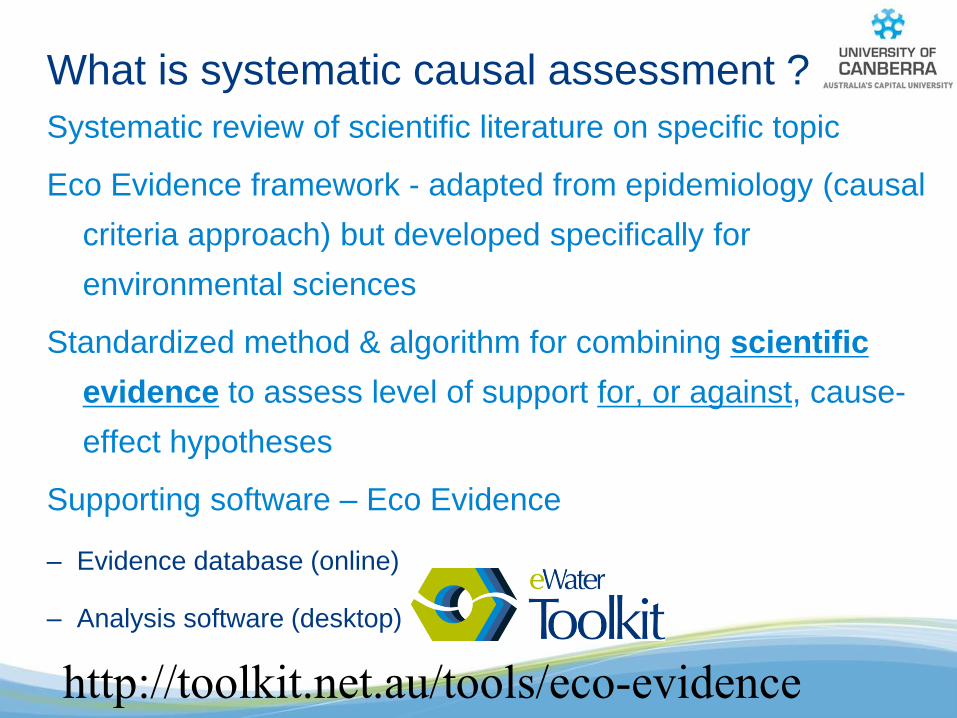
What is systematic causal assessment ?
Systematic review of scientific literature on specific topic
Eco Evidence framework - adapted from epidemiology (causal
criteria approach) but developed specifically for
environmental sciences
Standardized method & algorithm for combining scientific
evidence to assess level of support for, or against, cause-
effect hypotheses
Supporting software – Eco Evidence
– Evidence database (online)
– Analysis software (desktop)
http://toolkit.net.au/tools/eco-evidence

Don’t we use the literature already?
Anecdotal evidence may suggest we don’t
use it well - Who has ever searched for that one reference to support a statement?
- Have you ever read only the article’s abstract?
- Do you accept the result without really assessing the quality of the study?
- Do you read the paper without recording key findings?

Our motivation for Eco Evidence
• To facilitate adoption of evidence-based
practice that could make better use of
scientific literature
• To develop a logical framework to combine
& evaluate multiple lines of scientific
evidence
• To develop a standardized causal criteria
approach to provide transparency &
strengthen confidence in conclusions
• Database to store & reuse evidence items
• Efficient & effective use of research
literature

What can it be used for? • When more evidence is required to
confidently infer causality
• Augment results from local field
studies to assess general applicability,
or transferability of results
• To support evidence-based practice in
environmental management
• Assess likely environmental effects of
a proposed development or
restoration activity
• Identifying most likely cause/s of an
observed environmental impact

…what else can it be used for?
• To complement environmental risk assessments
• To provide quality assurance & a reusable resource for any literature
review undertaken by consultants to environmental management
organizations
• To present evidence in a transparent & defensible format suitable for
use in legal cases or administrative action over environmental
impacts
• To focus a literature review of specific topics to be published as a
succinct & defensible review paper

Why do we need it? Legal challenges are becoming more frequent
– Defensible, repeatable, transparent, evidence-
based approach to support decision-making
Managers required to use ‘best available
science’ to conduct ‘evidence-based’ decision
making’
– Effectiveness – e.g. restorations that are likely to
work, effective environmental flows, etc.
Murray-Darling Basin Plan will return water to
rivers specifically for environmental purposes
– such investment can be controversial if the
ecological benefits are poorly understood
Demonstrating cause–effect relationships in
natural systems is challenging

The challenge of demonstrating cause–effect
• Difficulties with natural variability
• Performing suitably scaled experiments
• Lack of true replication & randomization
• Presence of confounding influences
• Before After Control Impact - powerful designs
• But what if elements are missing? e.g. no ‘before’ period, lack of
control
• Cannot fix the problem with a ‘better’ study design if we cannot
replace the missing information
• All this = uncertainty in inferring a causal link
• What can we do?

Causal Criteria defined in US Surgeon
General’s report on health effects of
smoking (USDHEW 1964)
• Consistency of Association
• Strength of Association
• Specificity of Association
• Temporal Relationship
• Coherence
Epidemiologists faced similar challenges

Causal Criteria defined in US Surgeon
General’s report on health effects of
smoking (USDHEW 1964)
• Consistency of Association
• Strength of Association
• Specificity of Association
• Temporal Relationship
• Coherence
• Biological gradient (dose–response)
• Biological plausibility
• Experiment
• Analogy
Epidemiology faced similar challenges

Problem-Focused Analysis Framework
Norris RH, Webb JA, Nichols SJ, Stewardson MJ & Harrison ET (2012) Analyzing cause and
effect in environmental assessments: using weighted evidence from the literature. Freshwater
Science 31(1): 5–21

Publications & more in press 1. Norris, R H, Webb J A, Nichols S J, Stewardson M J & Harrison E T (2012). Analyzing cause and effect in environmental assessments: using
weighted evidence from the literature. Freshwater. Science 31(1): 5–21.
2. Webb, J A, S R Wealands, P Lea, S J Nichols, S C de Little, M . Stewardson & R H Norris (2012). Eco Evidence: using the scientific literature
to inform evidence-based decision making in environmental management. in F. Chan, D. Marinova and R. S. Anderssen (editors).
MODSIM2011 International Congress on Modelling and Simulation. Modelling and Simulation Society of Australia and New Zealand,
Australia.
3. Webb, J A., S J Nichols, R H Norris, M J Stewardson, S R Wealands & P Lea (2012). Ecological responses to flow alteration: assessing
causal relationships with Eco Evidence. Wetlands 32(2): 203-213.
4. Grove, J. R., J. A. Webb, P. M. Marren, M. J. Stewardson, and S. R. Wealands. in press. High and dry: an investigation using the causal
criteria methodology to investigate the effects of regulation, and subsequent environmental flows, on floodplain geomorphology. Wetlands
32(2): 215-224.
5. Greet, J, J. A. Webb, and R. D. Cousens. 2011. The importance of seasonal flow timing for riparian vegetation dynamics: a systematic review
using causal criteria analysis. Freshwater Biology 56:1231-1247.
6. Nichols, S J, A Webb, R Norris and M Stewardson (2011). Eco Evidence analysis methods manual: a systematic approach to evaluate
causality in environmental science. eWater Cooperative Research Centre, Canberra. (Available from: http://toolkit.net.au/Tools/Eco-
Evidence/documentation)
7. Harrison, E T (2010). Fine sediment in rivers: scale of ecological outcomes. PhD Dissertation. University of Canberra, Canberra, Australia.
(Available from: http://tinyurl.com/Harrison-2010)
8. Norris, R H, P Liston, J Mugodo, S Nichols, G P Quinn, P Cottingham, L Metzeling, S Perriss, D Robinson, D Tiller, & G Wilson (2005).
Multiple lines and levels of evidence for detecting ecological responses to management intervention. Pages 456-463 in I. D. Rutherfurd, I.
Wiszniewski, M. J. Askey-Doran and R. Glazik (editors). Proceedings of the 4th Australian Stream Management Conference: linking rivers
to landscapes. Department of Primary Industries, Water and Environment, Launceston, Tasmania. (Available from:
http://tinyurl.com/Norris-et-al-2005)
9. Skinner D S, Webb J A, Nichols S J & Stewardson M J (2012). Eco Evidence for systematic causal inference and knowledge transfer
between science and policy. In: Climate Change 2012: Water and Climate: Policy Implementation Changes; Proceedings of the 2nd
Practical Responses to Climate Change Conference, 1–3 May 2012, Canberra. Barton, A.C.T.: Engineers Australia, 2012: 647–654.


Adaptive management cycle
From Jones (2005).
15

Causal Criteria in Eco Evidence
Causal criterion Description & basis for selection
Plausibility Plausible mechanism (e.g., biochemical reaction) that could explain the relationship between causal agent & potential effect - conceptual model
Evidence of response
study reports an association between causal agent & potential effect e.g. statistically significant
Dose response Association between causal agent & potential effect is in the form of a “dose–response” relation
Consistency of association
Potential effect occurs in the presence of the causal agent in all, or almost all, of the studies
Evidence of stressor in biota
This would include evidence of a chemical residue within an organism of interest
Agreement among hypotheses
When results for individual cause–effect hypotheses are considered collectively, do they support or refute the question
A few non-significant or contrary results may not
necessarily indicate a lack of consistency - thus criterion
thresholds

Weighting evidence Studies that account better for environmental variability or error
should carry more weight in the analysis - improves inferential power
Study Design Points
After impact 1
Before-after or Control-
impact
2
Gradient designs 3
BACI & derivatives 4
Factorial design
Replication
Points
# Impact sampling units
1 0
2 2
>2 3
# Control sampling units
0 0
1 2
>1 3
Gradient design
Replication
Points
# Sampling units
3 0
4 2
5 4
>5 6
Design weight +
Replication weight
= Evidence Weight for each
evidence item

Assessing support: combine across the criteria
Evidence of
Response
Dose-
Response
Consistency
of Association
Conclusion
≥ 20 ≥ 20 < 20 Support for hypothesis
≥ 20 < 20 < 20 Support for hypothesis
< 20 < 20 < 20 Insufficient evidence
≥ 20 ≥ 20 ≥ 20 Inconsistent evidence
≥ 20 < 20 ≥ 20 Inconsistent evidence
< 20 < 20 ≥ 20 Support for alternate
hypothesis
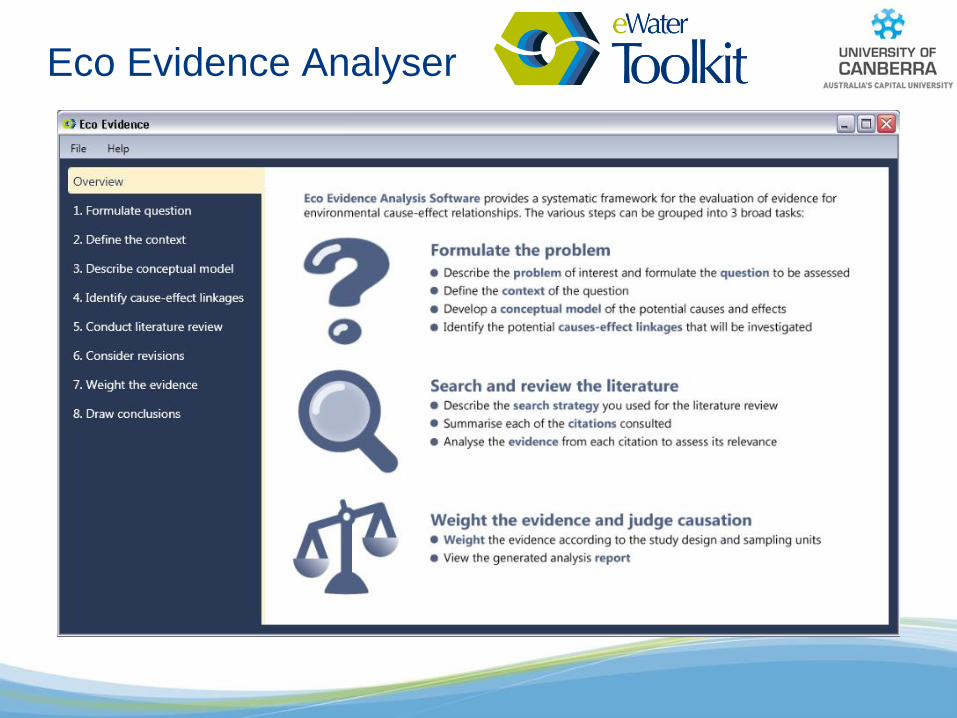
Eco Evidence Analyser

http://www.toolkit.net.au/Tools/Eco-Evidence
Online database for recording &
retrieving studies & metadata
concerning associations between
a cause (X) & an effect (Y)

Effects of inundation on wetland plants – Wallis

Effectiveness of artificial fish habitat Ebner, Lintermans, Nichols

Effects of flooding on river ecology – Harrison, Nichols

Sediment effects on aquatic invertebrates
– Harrison & Nichols

Effects of overbank flows on floodplain vegetation
– Webb

More Case Studies
• Effects of seasonal flow inversion on riparian vegetation – Greet
• Effects of Groundwater abstraction of stream flow – Barlow, Nichols
• Effects of flow regulation on floodplain geomorphology – Grove
• Effects of flow regulation on riverine biota: reanalysis of Poff & Zimmerman (2010) – King

CRN Project: Using an evidence-based approach
in the optimization of water allocation decisions
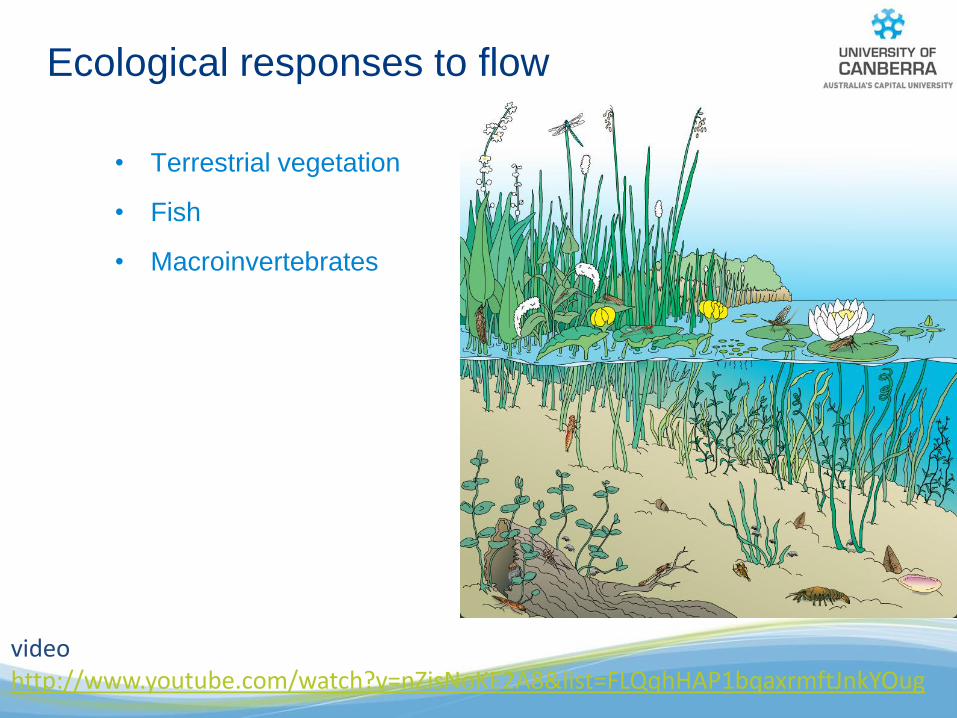
Ecological responses to flow
• Terrestrial vegetation
• Fish
• Macroinvertebrates
video http://www.youtube.com/watch?v=nZisNoKE2A8&list=FLQqhHAP1bqaxrmftJnkYOug
Renee Brawata
Institute for Applied Ecology & MDBfutures CRN
University of Canberra
Application of Eco Evidence to explore ecological response to flow:
A Case Study from the Cotter River, ACT
Steps of the Eco Evidence framework….
Describe the problem
Define the context
Develop a conceptual model
identifying cause & effect linkages
Search the literature
Select relevant citations
Systematically enter into database
Weigh the evidence
Write up the findings
using generated report

Describe the problem
Identify a broad area of interest:
Can we use existing literature to help make predictions
about the response of macroinvertebrates to extreme flow
events in rivers like the Cotter River?
• Climate change – predicted increase in extreme events
• Human impacts – need to provide environmental water
• Macroinvertebrates used as indicator of eflow success

Define the context
The Cotter River Regulated river ( Three
reservoirs; Corin, Bendora
& Cotter Dams)
Upland ecosystem – 1760m
to approx. 400m elevation
Temperate zone of Australia
Perennial river – maintains
flow even when not raining
because of groundwater
Mostly natural land use
(88% of catchment within
Namadgi NP)
Catchment area of 482km2
& river is 74km
Cobble dominated substrate
Corin Dam
Con
dor
Creek
Cot
ter
Co
tter
Riv
er
Rive
r
Riv
er
Ck
River
Riv
er
Riv
er
Rive
r
Paddys
Nass
Gudge
nby
Orroral
Murru
mbid
gee
Murrum
bidgee
PHABSIM sites
Cotter River Catchment Boundary
0 2 4 6 8 10km
Bendora Dam
Cotter Dam
Sa
wp
it
Vanity’s Crossing
Spur Hole
Figure 2 - The location of the Cotter River catchment and the two PHABSIM sites

Can be general to begin with, but needs to be specific enough to
inform the construction of a conceptual model….
Formulate a broad question
Does the timing & magnitude of extreme flow
events alter macroinvertebrate communities in
rivers like the Cotter River, ACT?
Quantify cause &
effect terms

Develop a conceptual model - HF
Measurement of changes in communities:
• Taxon diversity and richness
• Total abundance
• Assemblage structure (relative abundance)
Effect
Cause
Linkages
(processes)
Extreme
Flow
Event
Flow magnitude (volume/velocity) (3 x magnitude median baseflow)
Baseflow is flow supported by groundwater
Time between events (frequency consecutive HF vs. one-off)
Physical
removal of
habitat and
taxa
Riparian - adults Substrate stability

Develop a conceptual model - LF
Effect
Cause
Linkages
(processes)
Extreme
Flow
Event
Flow magnitude (volume/velocity) (magnitude 90%tile or lower)
Flow is at that level or >90% of the time
Duration of low flow and
time between events (no. of days CTF and frequency) Change in
water quality,
increases in
temperature
and algae
Measurement of changes in communities:
• Taxon diversity and richness
• Total abundance
• Assemblage structure (relative abundance)
Riparian – adults
and temperature Eflows – flow maintenance

Selecting relevant citations
Using Context and Conceptual model to focus literature search:
• Perennial rivers only (ground water sourced, flowing), not ephemeral/
intermittent streams or still water bodies (e.g. lakes) because of risk of
naturally adapted biota to dry/flushing periods
• Only included extreme flow events
• Reduced confounding from urban streams because of pollution, flooding
after bushfires or drying/flooding after insecticide, but studies in grasslands
& minimal impact agriculture were used
• Included stone/substrate movement & acidification (flood/drought-induced
only, not all) as an important mechanism of the impact on
macroinvertebrates

Documenting the process
Literature Search Strategies
• Recorded search strategies, including search
engines and search terms used.
‘Supra-seasonal’, ‘macroinvertebrates’, ‘extreme’,
‘drought’, ‘flood’, ‘high flow’, ‘low flow’
• Used all relevant media types available: journal
papers, books, reports, conference proceedings.
• Summarised the findings:
We collected 193 references
including 27 review papers
(reference lists used only)
Justification, repeatability and transparency

The Eco Evidence online database
Step by step through software component 1

Systematically entering a citation


Identifying cause and effect linkages


Weighting the evidence
Refining & defining the questions for analysis….
High Flow
1. Do extreme high flows over
consecutive years (or closer)
change macroinvertebrate
assemblages?
2. Do extreme high flows
following a period of extreme
low flow change
macroinvertebrate
assemblages?
Low Flow
1. Does the frequency of extreme
low flows over consecutive
years (or closer) change
macroinvertebrate assemblages?
2. Do extended extreme low flows
(duration of >1 week CTF)
change macroinvertebrate
assemblages?
Step by step through software component 2
Question too broad –
inconclusive results
Question too narrow –
little evidence

Using Eco Analyser – first steps (1-3)

Identify cause and effects (Step 4)

Conduct a literature review (Step 5)
Description
of study
design
below

Is my question still relevant? Too broad?
Was my literature search too narrow? Did I
miss something?
Are my conceptual models/linkages still
representative of what I am interested in?
Consider Revisions (Step 6)

Weight the evidence (Step 7)
We asked the question for the same cause but evaluated
different effects (e.g. taxon diversity/richness)
For and against the hypothesis

Draw Conclusions (Step 8)
• Write up findings using succinct, generated report.
• Report can be used as the basis of a review paper.
• Make new hypotheses - Why did macroinvertebrate
assemblages not change in some studies?

• Provides leaf litter for shedders in LF
conditions (maintains assemblage)
• Thermal regulation (reduces water
temperatures)
• Assists in maintenance of pools from
which populations may recover
Management of extreme flow impacts:
• Provides support / refuge for
adults to recolonise after the
flood/drought
Low Flow
Retaining riparian
vegetation:
mechanisms for recovery
High Flow
Processes
Effect Maintenance of macroinvertebrate assemblage,
taxon richness and/or diversity?
Cause

Conclusion
• Study is a series of questions surrounding effects of
extreme flow events - will be written up as a review
paper
• Evidence used to establish support for example
hypothesis
• Evaluate further questions on the influence of riparian
vegetation on reducing impacts of extreme flow
events
• Next part of the project aims to see if we can quantify
these processes using extensive datasets and
literature
• Transparency of output report - easy to evaluate
• Efficient - once evidence items are in the database
can be re-analysed
• Identifies research gaps & priority areas for field
studies where little evidence exists