assessing the impact of driving bans with data analysis€¦ · lecture notes in informatics (lni),...
TRANSCRIPT

cba
(Hrsg.): BTW 2019,Lecture Notes in Informatics (LNI), Gesellschaft für Informatik, Bonn 2019 1
Assessing the Impact of Driving Bans with Data AnalysisLucas Woltmann1, Claudio Hartmann1, Wolfgang Lehner1
1 Introduction
Suspended particulate matter (SPM) is a significant problem discussed in current environ-mental research with an impact on the every-day life of many people. Our goal for the BTW2019 Data Science Challenge (DSC) is to leverage information from available sensor dataabout SPM and assess the benefits and disadvantages of driving bans. Our application buildsupon data of 57 sensors in the city of Dresden and 338 sensors in the city of Stuttgart. Eachsensor tracks particle concentration, temperature, and humidity. Stuttgart has a particularinteresting situation because of the driving ban for outdated diesel engines on roads inthe inner city introduced in January 2019. This gives us the possibility to compare theeffectiveness of driving bans not only over time but also between two cities. While we onlyanalyze two cities exemplary in this report, we see high potential of applying our tools toother cities and scenarios. We think, this universality of our approach is an important factorin knowledge transfer. The applications are not limited to SPM analyses but can be extendedfor example to weather and climate research.
The following sections address the tasks and sketch our approaches. Section 2 discusses datacleaning and preparation. This includes a minute-wise aggregation and a linear interpolationof the data. Then, we show visualization techniques used to identify patterns for anassessment of driving bans (Section 3). Furthermore, we predict the future development ofSPM with a technique called Cross-sectional AutoRegession (CSAR) [Ha19], developedin our group (Section 4). In Section 5, we condense the results of previous analyses anddefine no-go areas with the highest particle concentrations and also identify the reasons forparticular no-go areas. We close our work with a short conclusion in Section 6.
2 Data Cleaning and Preparation
First, the data of all sensors in Dresden and Stuttgart is collected. We use a nearest neighborsearch around the city center of both cities with a radius of 10km to retrieve all sensors inboth city areas.
A general problem is the division of sensor types into SPM sensors and temperature/humiditysensors. To construct a common base for the analysis, we need to integrate the SPM sensors1 Technische Universität Dresden, Database Systems Group, 01062 Dresden, Germany<firstname.lastname>@tu-dresden.de
cba doi:10.18420/btw2019-ws-31
H. Meyer et al. (Hrsg.): BTW 2019 — Workshopband,Lecture Notes in Informatics (LNI), Gesellschaft für Informatik, Bonn 2019 287

2 Lucas Woltmann, Claudio Hartmann, Wolfgang Lehner
0
6
12
18
24
30
0
25
50
75
100
Sep 03 00:00 Sep 03 06:00 Sep 03 12:00 Sep 03 18:00 Sep 04 00:00
Date and time
Par
ticle
con
cent
ratio
n [µ
/m³]
Relative hum
idity [%]
Measurements
humidity
P1
Sensor 5301 intraday
(a) Comparison Dresden
0
20
40
60
80
100
0
25
50
75
100
Sep 03 00:00 Sep 03 06:00 Sep 03 12:00 Sep 03 18:00 Sep 04 00:00Date and time
Par
ticle
con
cent
ratio
n [µ
/m³]
Relative hum
idity [%]
Measurements
humidity
P1
Sensor 609 intraday
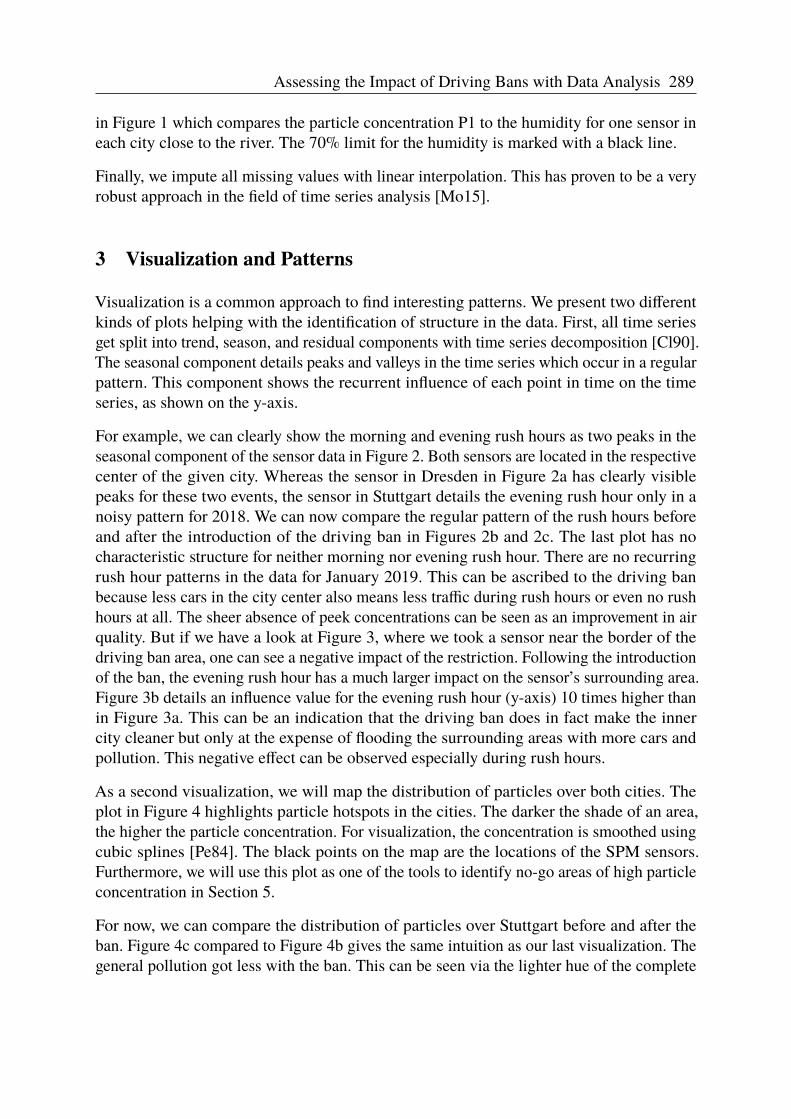
(b) Comparison StuttgartFig. 1: Particle concentration P1 compared to humidity.
and the humidity/temperature sensors into one data set. Therefore, we aggregate the data foreach sensor type to a minute-wise time scale by averaging all measurement within everyminute for each sensor. This provides a common minute granularity for all sensors. The nextstep is to merge the temperature and humidity data with the particle concentration data bysensor location and time. Note that this is only possible in a standardized minute granularityin both sensor type data.
From the resulting table, we remove all particle concentrations where the humidity is largerthan 70% because above this value the particle sensors do not provide reliable reads [No15].This leads to sparse data for both Dresden and Stuttgart because both cities have a ratherhumid river climate. Additionally, both cities are located in a valley. This problem is shown
288 Lucas Woltmann, Claudio Hartmann, Wolfgang Lehner
SPM DSC BTW 2019 - TU Dresden 3
in Figure 1 which compares the particle concentration P1 to the humidity for one sensor ineach city close to the river. The 70% limit for the humidity is marked with a black line.
Finally, we impute all missing values with linear interpolation. This has proven to be a veryrobust approach in the field of time series analysis [Mo15].
3 Visualization and Patterns
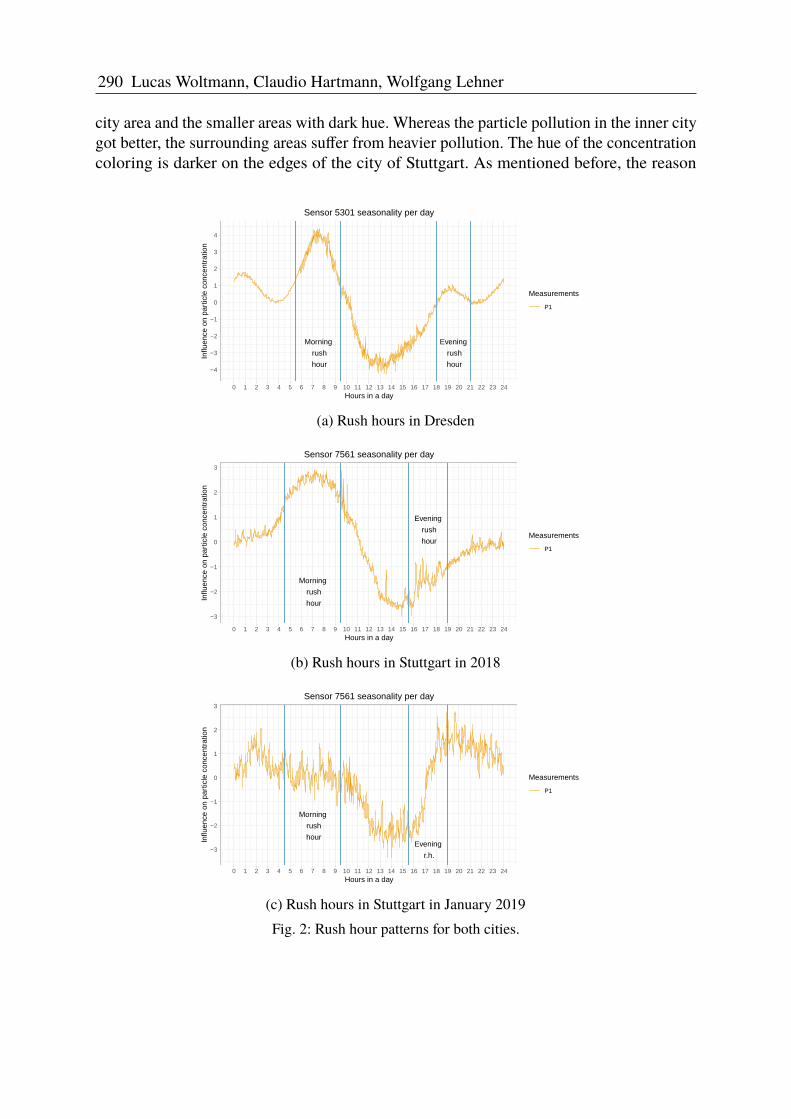
Visualization is a common approach to find interesting patterns. We present two differentkinds of plots helping with the identification of structure in the data. First, all time seriesget split into trend, season, and residual components with time series decomposition [Cl90].The seasonal component details peaks and valleys in the time series which occur in a regularpattern. This component shows the recurrent influence of each point in time on the timeseries, as shown on the y-axis.
For example, we can clearly show the morning and evening rush hours as two peaks in theseasonal component of the sensor data in Figure 2. Both sensors are located in the respectivecenter of the given city. Whereas the sensor in Dresden in Figure 2a has clearly visiblepeaks for these two events, the sensor in Stuttgart details the evening rush hour only in anoisy pattern for 2018. We can now compare the regular pattern of the rush hours beforeand after the introduction of the driving ban in Figures 2b and 2c. The last plot has nocharacteristic structure for neither morning nor evening rush hour. There are no recurringrush hour patterns in the data for January 2019. This can be ascribed to the driving banbecause less cars in the city center also means less traffic during rush hours or even no rushhours at all. The sheer absence of peek concentrations can be seen as an improvement in airquality. But if we have a look at Figure 3, where we took a sensor near the border of thedriving ban area, one can see a negative impact of the restriction. Following the introductionof the ban, the evening rush hour has a much larger impact on the sensor’s surrounding area.Figure 3b details an influence value for the evening rush hour (y-axis) 10 times higher thanin Figure 3a. This can be an indication that the driving ban does in fact make the innercity cleaner but only at the expense of flooding the surrounding areas with more cars andpollution. This negative effect can be observed especially during rush hours.
As a second visualization, we will map the distribution of particles over both cities. Theplot in Figure 4 highlights particle hotspots in the cities. The darker the shade of an area,the higher the particle concentration. For visualization, the concentration is smoothed usingcubic splines [Pe84]. The black points on the map are the locations of the SPM sensors.Furthermore, we will use this plot as one of the tools to identify no-go areas of high particleconcentration in Section 5.
For now, we can compare the distribution of particles over Stuttgart before and after theban. Figure 4c compared to Figure 4b gives the same intuition as our last visualization. Thegeneral pollution got less with the ban. This can be seen via the lighter hue of the complete
Assessing the Impact of Driving Bans with Data Analysis 289
4 Lucas Woltmann, Claudio Hartmann, Wolfgang Lehner
city area and the smaller areas with dark hue. Whereas the particle pollution in the inner citygot better, the surrounding areas suffer from heavier pollution. The hue of the concentrationcoloring is darker on the edges of the city of Stuttgart. As mentioned before, the reason
Morning
rush
hour
Evening
rush
hour−4
−3
−2
−1
0
1
2
3
4
0 1 2 3 4 5 6 7 8 9 10 11 12 13 14 15 16 17 18 19 20 21 22 23 24Hours in a day
Influ
ence
on
part
icle
con
cent
ratio
n
Measurements
P1
Sensor 5301 seasonality per day
(a) Rush hours in Dresden
Morning
rush
hour
Evening
rush
hour
−3
−2
−1
0
1
2
3
0 1 2 3 4 5 6 7 8 9 10 11 12 13 14 15 16 17 18 19 20 21 22 23 24Hours in a day
Influ
ence
on
part
icle
con
cent
ratio
n
Measurements
P1
Sensor 7561 seasonality per day
(b) Rush hours in Stuttgart in 2018
Morning
rush
hourEvening
r.h.−3
−2
−1
0
1
2
3
0 1 2 3 4 5 6 7 8 9 10 11 12 13 14 15 16 17 18 19 20 21 22 23 24Hours in a day
Influ
ence
on
part
icle
con
cent
ratio
n
Measurements
P1
Sensor 7561 seasonality per day
(c) Rush hours in Stuttgart in January 2019Fig. 2: Rush hour patterns for both cities.
290 Lucas Woltmann, Claudio Hartmann, Wolfgang Lehner

SPM DSC BTW 2019 - TU Dresden 5
for that might be the diverted traffic now filling the streets around the city creating morepollution there.
If we compare Dresden, a city without a driving ban, to Stuttgart, we only need to take alook at the data for 2018 because there is no active change in pollution in Dresden. Dresdenhas a lighter coloring and therefore less pollution because of having less traffic in the cityarea than Stuttgart [IN17]. The data in Stuttgart is less sparse because there are more sensorsavailable. This leads to a finer gradient in color for the visualization and a more detailedview on pollution compared to Dresden. Nevertheless, the similar topology of both citiescause the same problems. Both cities have large areas of congestion on their access roadsto the Autobahn (see Section 5). The valley position of both cities can dictate long accessroad to the Autobahn because building interstate roads near or in the valley might be eithervery expensive or very polluting. Long access roads mean more potential for heavy traffic.
Morning
rush
hour
Evening
r.h.−6
−4
−2
0
2
4
6
8
0 1 2 3 4 5 6 7 8 9 10 11 12 13 14 15 16 17 18 19 20 21 22 23 24Hours in a day
Influ
ence
on
part
icle
con
cent
ratio
n
Measurements
P1
Sensor 609 seasonality per day
(a) Rush hours in 2018
Morning
rush
hour
Evening
r.h.−6
−4
−2
0
2
4
6
8
10
12
14
16
18
20
0 1 2 3 4 5 6 7 8 9 10 11 12 13 14 15 16 17 18 19 20 21 22 23 24Hours in a day
Influ
ence
on
part
icle
con
cent
ratio
n
Measurements
P1
Sensor 609 seasonality per day
(b) Rush hours in January 2019Fig. 3: Rush hour patterns for sensor outside the driving ban area.
Assessing the Impact of Driving Bans with Data Analysis 291

6 Lucas Woltmann, Claudio Hartmann, Wolfgang Lehner
(a) Particle distribution over Dresden in 2018.
(b) Particle distribution over Stuttgart in December2018.
(c) Particle distribution over Stuttgart in January2019.
Fig. 4: Particle distribution over the cities.
Even though the valley structure of both cities is hardly visible in the data visualization,one could argue that in Stuttgart one can see the southwest to northeast valley around theNesenbach and the Neckar valley east of the city center in a darker hue. This assumptiondoes not hold for Dresden, mainly due to the sparsity of sensors.
292 Lucas Woltmann, Claudio Hartmann, Wolfgang Lehner

SPM DSC BTW 2019 - TU Dresden 7
0
20
40
60
80
Nov Dez Jan Feb
Time
Par
ticle
con
cent
ratio
nMeasurements
Real
Forecast
Top Aggregat Dresden
(a) Forecast January 2019 Dresden
0
20
40
60
80
Nov Dez Jan Feb
Time
Par
ticle
con
cent
ratio
n
Measurements
Real
Forecast
Top Aggregat Stuttgart
(b) Forecast January 2019 StuttgartFig. 5: Comparison of forecasts and actual sensor readings.
Given our analysis results, we can show that visualization is a powerful tool for assessingparticle concentration and its impact on the environment. We see high potential forour approach to be applied to other cities and use cases. This could also help domainexperts making decisions and drawing conclusions with a more profound background inenvironmental research than us.
4 Time Series Forecasting
Time series forecasting is a technique that allows computation of expected values for thefuture behavior of time-dependent measure values. In our previous work we designed aforecast technique called CSAR [Ha19] that focuses on the prediction of many time seriesthat originate from the same domain, i.e. SPM sensor readings. Thorough predictions enablethe comparison of predicted sensor readings without a driving ban and the actual measuredvalues after the driving ban takes effect.
Assessing the Impact of Driving Bans with Data Analysis 293

8 Lucas Woltmann, Claudio Hartmann, Wolfgang Lehner
(a) No-go areas in Dresden in 2018. (b) No-go areas in Stuttgart in 2018.Fig. 6: No-go areas in both cities.
We predict the readings for all sensors in both cities using a dedicated CSAR model forDresden and one for Stuttgart. The results of our experiment are shown in Figure 5. For theforecast, we aggregate the sensor readings to a daily granularity. Otherwise, the predictionof the entire January would end up with a forecast horizon too long to calculate reliably.For both cities, we see that the actual SPM levels (orange line) are slightly lower than thecorresponding forecast values (blue line). For Stuttgart (Figure 5b) this might be attributedto the driving ban that took effect in January. The results for Dresden (Figure 5a), showthat other external factor might influence the SPM levels too, such that there is a visibledeviation.
However, the comparison of only two cities is too little data to draw a reliable conclusionfrom. More data and an in-depth analysis are required to assess the actual role of drivingbans. Furthermore, other external influences that affect the SPM levels have to be identifiedand taken into account during the forecasting process. This would lead to more accurateforecast results and enable more reliable decisions on the effectiveness of driving bans.
5 No-go Areas
As mentioned earlier, we will identify no-go areas with the highest particle concentrationsusing the generated maps. We calculate the centroids for all areas with a dark hue. Thecentroid gives us the possibility to analyze nearby points of interest which could generatesuch a high concentration. Currently, we already identified six of the top concentrationaccumulations in Dresden in Figure 6a and the top six in Stuttgart in Figure 6b.
In Dresden, the accumulation in the north and south are the access roads from the surroundingareas to the city center. This includes two long tunnels on the Autobahn producing a highconcentration at their entrances. The northwestern area is an Autobahn exit which has a lotof traffic backup from a large shopping center located right next to the Autobahn. The one
294 Lucas Woltmann, Claudio Hartmann, Wolfgang Lehner

SPM DSC BTW 2019 - TU Dresden 9
cluster near the city center is the river harbor. Ships are well-known for not having cleanengines [Sm15].
The Neckar harbor in the eastern part of Stuttgart has a similar influence. A high particleconcentration can be spotted there. Near the harbor, there is an industrial area which isvisible in the concentration as well. The city center has also a high particle concentrationdue to a lot of traffic going through. A particular interesting point is the ridge aroundthe Birkenkopf hill southwest of the city center (marked with the mountain symbol). Thecurvature of the ridge forms a barrier in the particle concentration. The reason for thisphenomenon could be the agglomeration of particles in front of the ridge if the wind flowsperpendicular to the ridge. Last, one can see two darker areas for the access roads to thewestern Autobahn in the north and northwest of Stuttgart.
6 Conclusion
We have shown a multi-tool workbench for assessing the impact of SPM and driving bansin city areas. We use visualization and forecasting to find interesting patterns. This is donecompletely with a pure data-driven approach. Our argumentation closely follows the findingsfrom the data. So, we rely on the correctness and completeness of the data. Data analysisonly can be as good as the data fulfilling these two criteria. In our case the sparsity of themeasurements due to the high humidity in some areas and the sparsity of the sensor networkitself are negative factors for the analysis. The sparsity introduces uncertainty which cannot be modeled correctly or can not be modeled at all. Complete data would require aorganized network of sensors in our use case. Whereas the idea of open data and citizenscience to collect relevant data is a good one, we see potential in getting a more organizedstructure into the project. Given the severity of the SPM topic, this could extend into agovernment-organized data collection scheme.
We think our work can be extended to different cities but also to a different set of problems.Any data which can be represented both as a concentration distribution and a time serieswill be assessable with our framework. Topics closely aligned would be weather and climateresearch, market research, and energy research. We see our approach as an important toolfor knowledge transfer between people from different areas of research. The main goalwould be to give domain experts a robust analysis platform for their decision making.
References[Cl90] Cleveland, Robert B; Cleveland, William S; McRae, Jean E; Terpenning, Irma: STL: A
Seasonal-Trend Decomposition. Journal of Official Statistics, 6(1):3–73, 1990.[Ha19] Hartmann, Claudio; Ressel, Franziska; Hahmann, Martin; Habich, Dirk; Lehner, Wolfgang:
CSAR: the cross-sectional autoregression model for short and long-range forecasting.International Journal of Data Science and Analytics, jan 2019.
Assessing the Impact of Driving Bans with Data Analysis 295

10 Lucas Woltmann, Claudio Hartmann, Wolfgang Lehner
[IN17] INRIX Global Traffic Scoreboard, http://inrix.com/scorecard/, Accessed on 08-02-2019.[Mo15] Moritz, S.; Sardá, A.; Bartz-Beielstein, T.; Zaefferer, M.; Stork, J.: Comparison of different
Methods for Univariate Time Series Imputation in R. ArXiv e-prints, October 2015.[No15] SDS011 Laser PM2.5 Sensor specification, http://ecksteinimg.de/Datasheet/SDS011 laser
PM2.5 sensor specification-V1.3.pdf, Accessed on 08-02-2019.[Pe84] Peter Alfeld: A trivariate Clough-Tocher scheme for tetrahedral data. Computer Aided
Geometric Design, 1(2):169–181, 1984.[Sm15] Smith, T. W. P. et al.: Third IMO Greenhouse Gas Study 2014. International Maritime
Organization, United Kingdom, 2015.
296 Lucas Woltmann, Claudio Hartmann, Wolfgang Lehner