assessing the feasibility of forest plantation of native
TRANSCRIPT

BIODIVERSITAS ISSN: 1412-033X Volume 20, Number 9, September 2019 E-ISSN: 2085-4722 Pages: 2453-2461 DOI: 10.13057/biodiv/d2009
Assessing the feasibility of forest plantation of native species: A case
study of Agathis dammara and Eusideroxylon zwageri in Balikpapan,
East Kalimantan, Indonesia
BUDI SETIAWAN1,2,, ABUBAKAR M. LAHJIE3,, SYAHRIR YUSUF3, YOSEP RUSLIM3, 1Faculty of Forestry, Universitas Tadulako. Jl. Soekarno Hatta Km. 9, Kampus Bumi Tadulako, Tondo, Mantikulore, Palu 94148, Central Sulawesi,
Indonesia. email: [email protected], [email protected] 2Graduate Program in Forestry, Universitas Mulawarman. Jl. Ki Hajar Dewantara, Gunung Kelua, Samarinda 75123, East Kalimantan, Indonesia
3Faculty of Forestry, Universitas Mulawarman. Jl. Ki Hajar Dewantara, Gunung Kelua, Samarinda 75123, East Kalimantan, Indonesia
Tel./fax.:+62-541-735379, email: [email protected]; [email protected]
Manuscript received: 2 June 2019. Revision accepted: 8 August 2019.
Abstract. Setiawan B, Lahjie AM, Yusuf S, Ruslim Y. 2019. Assessing the feasibility of forest plantation of native species: A case study of Agathis dammara and Eusideroxylon zwageri in Balikpapan, East Kalimantan, Indonesia. Biodiversitas 20: 2453-2461. Plantation forest using native species is very important effort to support biodiversity conservation. Still, analysis on its feasibility is needed to
guarantee the sustainable forest management. The research aims were to assess the feasibility of plantation forestry of Agathis dammara and Eusideroxylon zwageri based on production models and financial simulation of stands management. The production models were developed based on plantation forests in Balikpapan, East Kalimantan, Indonesia. Using these plantation we developed models to estimate tree volume, total volume per hectare, Mean Annual Volume Increment (MAI) and Current Annual Increment (CAI) for each species. Financial analyses were carried out to assess the Pay Back Period (PBP), Net Present Value (NPV), Net Benefit/Cost (B/C) Ratio, Internal Rate of Return (IRR) and Equivalent Annual Annuity (EAA). The results of production model showed that A. dammara stands would reach optimum production at the age of 25 years while that of E. zwageri at the age of 150 years. A. dammara stands produce higher MAI of 15.67 m3ha-1 year-1 and total volume of 383.72 m3ha-1 than E. zwageri with MAI 1.89 m3ha-1 year-1 and total
volume of 282.78 m3ha-1. The result of financial analysis showed that A. dammara plantation had the IRR higher than the Minimum Acceptable Rate (MAR) and the Net B/C Ratio of higher than 1, while E. zwageri had the Net B/C Ratio of lower than 1. A. dammara plantation also had a positive NPV value of IDR 78,699,974 while E. zwageri plantation had a negative NPV value of IDR 91,439,292. These results suggest that developing A. dammara plantation is more desirable than E. zwageri plantation.
Keywords: Agathis dammara, Eusideroxylon zwageri, financial analysis, plantation forest, production model
INTRODUCTION
Conservation of biodiversity is one of key indicators of
the success of sustainable forest management in the future.
Biodiversity elements that exist in a forest environment
system play important role in developing forest dynamics.
However, the conversion of forest land to agriculture and
forest plantation using introduced species reduces the extent of primary and secondary forests and threatens the
biodiversity. In the context of forest plantation, the
expansion of plantations becomes problematic, as such
several alternatives should developed in a targeted manner
in the hope that it can minimize the impacts on biodiversity
(Brockerhoff et al. 2008; Barkin et al. 2013; Dems et al.
2013; Sawada et al. 2016). In some cases, forest plantation
using native species within the frame of restoration
planting might be required to support biodiversity
conservation and to deliver ecosystem services (Budiharta
et al. 2014; Budiharta et al. 2018). Therefore, one of the research efforts important to develop is the comparison
between managed and not managed forest planting
management using native species (Barkin et al. 2013;
Nouri et al. 2015).
Increasing public knowledge and awareness is needed
to achieve the objectives of sustainable forest management.
The knowledge includes cost calculations and business
analyses that can guarantee the sustainability of the forest
itself (Linger 2014; Hartoyo et al. 2016; Muliadi et al.
2017). Good and appropriate development strategies are
also required in managing timber harvesting business especially to meet the increasing demand for quality timber
while protecting tropical forest diversity (Ruslim 2011;
Ruslim et al. 2016).
Economic analysis can be used to compare the
productivity between mixed/heterogeneous forest
management commonly conducted in tropical region and
homogeneous forests plantation using few timber species
(Friedrich et al. 2019; Sandalayuk et al. 2019). In order to
develop forest management business model, a detailed
understanding of all costs incurred in various activities is
needed to estimate the financial performance. Financial analysis using different cost assumption will have different
implication on the financial results expected in the future,
either too high or too low (Barkin et al. 2013; Dems et al.
2013; Callaghan et al. 2019). Information about finance,
investment, statistics and marketing results must be

BIODIVERSITAS 20 (9): 2453-2461, September 2019
2454
combined to obtain a complete comparison. Financial
analysis makes it possible to provide a forward-looking
picture if a decision will be taken as part of the business
risk analysis model plan. Risk analysis can help managers
to show the potential financial threats and opportunities in
the future whenever there are risks of danger identified so
that they can be anticipated in advance (Vavrek 2014;
Lahjie et al. 2018a).
Silvicultural activities such as maintenance, thinning
and harvesting must be carried out with prudence consideration, not only on technical aspects but also on
financial perspectives (Khasanah et al. 2015; Lahjie et al.
2018b). Optimization analysis of forest development must
be conducted to assess the uncertainty in stand growth and
costs spent during the management regimes from planting
to harvesting. This analysis allows to calculate profitable
business scale, current net value (NPV) and optimal
volume of increment growth (Nghiem and Tran 2016;
Soares et al. 2019). Economic valuation is needed to
include all important variables so that they can become a
reference for further activities (Arias et al. 2011; Price et al. 2011; Latifah and Sulistiyono 2013; Bijalwan 2014).
Forest plantation business has a long period of
investment. As such, the longer is the investment period,
the interest rate should be lower. In this context, the
government needs to adopt a policy that can imply a
reduction in interest rates for plantation forestry.
Otherwise, problems will arise when the discount rate
increases and the investment period will be longer than it
should (Price 2011).
Dammar, a natural resin produced from Agathis
dammara, became popular since the middle of the 19-century in Occident mostly used in art painting materials as
final protective coating (varnish) as well as a component of
pictorial media. The damar tree A. dammara Lamb is a type
of tree member of the conifers (Gymnosperms) which is a
native plant of Indonesia. Damar spread across Maluku,
Sulawesi, to the Philippines (Palawan and Samar). In Java,
this plant is cultivated for the sap or hars. This resin is
processed to be a copal (Scalarone 2005).
Ulin (Eusideroxylon zwageri Teijsm & Binn) or also
referred to as bulian or iron wood is a woody tree and is a
typical plant of Kalimantan. Ulin is a species of native
Indonesian tree (indigenous tree species) belong to Lauraceae family. Ulin varieties in West Kalimantan are
distinguished based on the use and color of the stem,
namely tando ulin with reddish brown bar, wax ulin with
dark brown bar, copper ulin with yellowish stem color and
lime ulin with light brown bar. Ironwood, candles and
copper are usually used for building foundations and floors.
Lime ulin is the only iron wood that is easily split, making
it suitable for raw materials for shingles (Heyne 1987;
Yusliansyah et al. 2004). Ulin has an important meaning as
one of the endangered native species of Kalimantan which
is very slow to grow, but it has a very high economic
values. There is growing idea to develop ulin plantations to
sustainably manage the species not only to gain the
economic benefits, but also as conservation efforts.
The aims of this study were to assess the feasibility of
plantation forestry of A. dammara and E. zwageri based on
production models and financial simulation of stands management. These were achieved by determining the
volume increments of A. dammara and E. zwageri, finding
out the optimum age and maximum increment of both
species which meet the wood processing industry
requirements, analyzing the financial feasibility of the
business of plantation forestry of both species, identifying
the rate of interest to be feasible, and knowing the
resilience of the plantation forestry using sensitivity
analysis.
MATERIALS AND METHODS
Study area This research was carried out in Arboretum Inhutani I
area of Balikpapan in Karang Joang Village, Balikpapan
City, East Kalimantan Province, Indonesia. The study sites
were located at geographical coordinates of 1° 11’ 14.5” S
- 116° 52’ 46.6” E (Figure 1).
Data collection
The study was conducted for 6 months from May 2018
to October 2018, which included research preparation,
primary and secondary data collection, data analysis and
preparation of reports. Specifically for preparation and
retrieval activities, some secondary data on the general information of the area had been started since April 2018.
Production model
Table 1 shows that A. dammara stand has an age of 31
years. It has planting space of 4 x 4 m with a total
population of 285 trees. We sampled 20% of the
population, equating to 57 trees. Similarly, E. zwageri
stand has an age of 31 years with planting space 4 x 4 m
and total population of 425 trees. We took 85 trees as a
sample, equating to 20% of the population. Both stands had
been planted in the secondary forest owned by Inhutani I
company Balikpapan, East Kalimantan since 1987 using
system monoculture technique.
Table 1. Production model developed in this study consisting of information of land management with stands composition
Stands Spacing
(m)
Extent
(m2)
Number of
individual (trees)
Number of
sample (20%)
Production Model I: Agathis dammara (31 years age) 4 x 4 10,000 285 57 Production Model II: Eusideroxylon zwageri (31 years age) 4 x 4 10,000 425 85

SETIAWAN et al. – The feasibility of forest plantation of native species
2455
Figure 1. Study sites at Arboretum Inhutani I Km. 10 area of Balikpapan in Karang Joang Village (■), Balikpapan District, East Kalimantan, Indonesia
Growth and volume analysis
The variables measured within the plots to obtain
estimates of the potential production of A. dammara and E.
zwageri were as follows: tree volume, total volume per
hectare, Mean Annual Volume Increment (MAI), and
Current Annual Increment (CAI) (Van Gardingen et al.
2003; Lahjie et al. 2019).
MAI =Vt
t
Where, MAI = Mean Annual Increment (m3ha-1year-1),
Vt = total volume at age t (m3ha-1), t = tree age (in years)
CAI =Vt − Vt − 1
n
Where, CAI = Current Annual Increment (m3ha-1year-1),
Vt = Total volume at age t (m3ha-1), Vt-1 = Previous total
volume (m3ha-1), T = Second age minus the first age (in
years).
Mean Annual Increment increased significantly with
increasing spacing while spacing did not have significant
efect on total volume production and basal area. Stand
density is also not afected by spacing while heartwood
proportion increases as planting spacing increases (Zahabu
et al. 2015).
Financial analysis
Based on the data obtained, financial analysis was then
performed according to the research objectives. Based on
Kadariah (1987), the data analysis criteria used using the
calculation formula as follows:
Payback Periods (PP)
Payback Periods are the period of time required to
repay (return) all costs incurred in the investment of a
project.
PP =Cost of capital invested
Average net cost per year
Net Benefit Cost Ratio (Net B/C)
Net B/C is a comparison between the Present Value of a
positive Net Benefit (+) and the Present Value of a negative
Net Benefit. The mathematical formula of Net B/C can be written as follows (Kadariah 1987):
Net Benefit Cost Ratio =∑Present Value Net Benefit (+)
∑Present Value Net Benefit (−)
Net Benefit Cost Ratio =[∑
Bt − Ct − Kt (1 + i)t
nt=1 ] (+)
[∑Bt − Ct − Kt
(1 + i)tnt=1 ] (−)

BIODIVERSITAS 20 (9): 2453-2461, September 2019
2456
Where, Bt = net benefit during the year of operation t,
Ct = net cost in business years t, Kt = investment at the
beginning of year 0, n = economic age of exploitation time
(rotation), i = applicable interest rate (discount rate).
If Net B / C ≥ 1, then the project is declared to be able to
continue or benefit, but if Net B / C ˂ 1, then the project
does not provide benefits and should not be attempted.
Net Present Value (NPV) or Net Present Worth (NPW)
NPV is the difference between Present Value Benefit
and Net Present Value of Cost. The formula of NPV can be
written as follows (Kadariah 1987):
NPV = Present Value Benefit − Present Value Cost (NPV = B − C)
Where, B = benefits in present value, C = cost in
present value.
The NPV project analysis can be formulated
mathematically as follows:
𝑁PV = −KtB1 − C1
(1 + i)t+
B2 − C2
(1 + i)t… . .
Bn − Cn
(1 + i)n
NPV = [∑Bt − Ct − Kt
(1 + i)t
n
t=1
]
Where, Kt = capital used in the investment period, B1,
B2, ... Bn = receipts in the first to ninth years, C1, C2, ... Cn = expenditures in the 1st year to the (n)th year, i =
interest rate (discount rate).
If an NPV ≥ 0 is obtained, the project can be accepted
or continued and if NPV ≤ 0, the project is not feasible.
Internal Rate of Return (IRR)
IRR is a discount rate that can make the Net Present Value of the project equal to zero (NPV = 0), or can make a
Benefit Cost Ratio equal to one (B/C = 1). The formula in
project analysis, IRR can be written as follows (Kadariah
1987):
IRR = [i′ +NPV′
NPV′ − NPV′′(i′ − i′′) ]
Where, i' = lowest discount factor, i" = higher discount
factor, NPV = Positive Net Present Value (+), NPV" =
Negative Net Present Value (-).
If IRR ≥ the interest rate of the bank, the project is
feasible to be undertaken, whereas if IRR ˂ the prevailing
bank interest rate, the project is not feasible.
Equivalent Annual Annuity (EAA)
EAA is used in determining the scale of land
management businesses based on the average needs of
household heads per year (5 people/head of family) with an average net income per year per hectare which is
equivalent in value. The formula used in calculating the
EAA as follows (Kadariah 1987):
EAA = NPVi
1 − (1 + i)−n
Where, i = interest rate, n = long of time period.
Sensitivity analysis
Sensitivity analysis is used to determine the likelihood
of the results of the analysis if there are changes or errors in
the basics of calculating costs and revenues. These changes
or errors will affect the NPV, Net B/C ratio and IRR
values. The basics used in sensitivity testing or sensitivity
analysis were: (i) The simulation of benefit was decreased
by 10%, while other factors were considered constant; (ii)
The simulation of costs was increased by 10%, while other
factors were considered constant. The simulation of benefit
was decreased by 10%, while other factors were considered constant.
RESULTS AND DISCUSSIONS
Production model
Production model I: Agathis dammara
Agathis dammara stands had spacing of 4 m x 4 m with
planting area of 1 hectare. The number of seedlings planted
in the first year was 625 ha-1. Measurements of stands were
conducted at the age of 2, 4, 8, 10, 15, 20, 25 and 30 years,
respectively (Lahjie et al. 2018a). The total population of
31 years stands was 285 ha-1 and the sample taken was
20%, equating to 87 in. ha-1. The estimated stand production cycle was assumed to be 30 years old.
Table 2 shows that the number of stands decreases
naturally and as a result of thinning processes as the age of
stands increase. Total population of stands at the starting
age of 2 years was 580 ha-1. According to economically
cycle at the harvesting age of 25 years was 340 ha-1. The
average diameter of stands at the age of 20 to 27.0 cm. The
diameter distribution at the age of 25 years ranged between
27 cm and 36 cm with the most frequent diameter of 32
cm. Branch free height on average at the age of 20 years
was 16.5 m.
The analysis of the Mean Annual Increment (MAI) and the Current Annual Increment (CAI) shows that the lowest
difference between both variables (i.e. 0.32 m3ha-1 year-1) is
achieved at the age of 25 years, implying the optimum age
for production cycle. At the age of 25 years, the average
volume of each tree was 1.13 m3, the average diameter of
each tree was 32.0 cm, the average of branch free height
was 18 m, the total stand volume was 383.72 m3ha-1, while
the MAI was 15.35 m3ha-1 year-1 and the CAI was 15.67
m3ha-1 year-1. The reduction in the number of trees
increases the MAI to be optimum at the age of 25 years
(with 15.35 m3ha-1 year-1), but was less influential at later ages, as shown that at the age of 30 years the MAI was
slightly increase to 15.67 m3ha-1 year-1.
Figure 2 shows clearly that the intersection point
between MAI and CAI which occurs at the age of 25 years.
This means that at the age of 25 years, the stands are ready
to be harvested with a total production volume of 383.72
m3ha-1 year-1 (Sarjono et al. 2017).

SETIAWAN et al. – The feasibility of forest plantation of native species
2457
Figure 2. A. Agathis dammara stands at the age of 31 years with spacing of 4 m x 4 m; and B. Branch free height (H) of tree’s
dimension
Figure 3. Eusideroxylon zwagery stands at the age of 31 years with spacing of 4 m x 4 m; and B. Branch free height (H) of tree’s dimension
Figure 2. Intersection point between MAI and CAI of Agathis
dammara which occurs at the age of 25 years stands
Figure 4. Intersection point between MAI and CAI of Eusideroxylon zwageri which occurs at the age of 150 years stands
A B
A B
BIODIVERSITAS 20 (9): 2453-2461, September 2019
2458
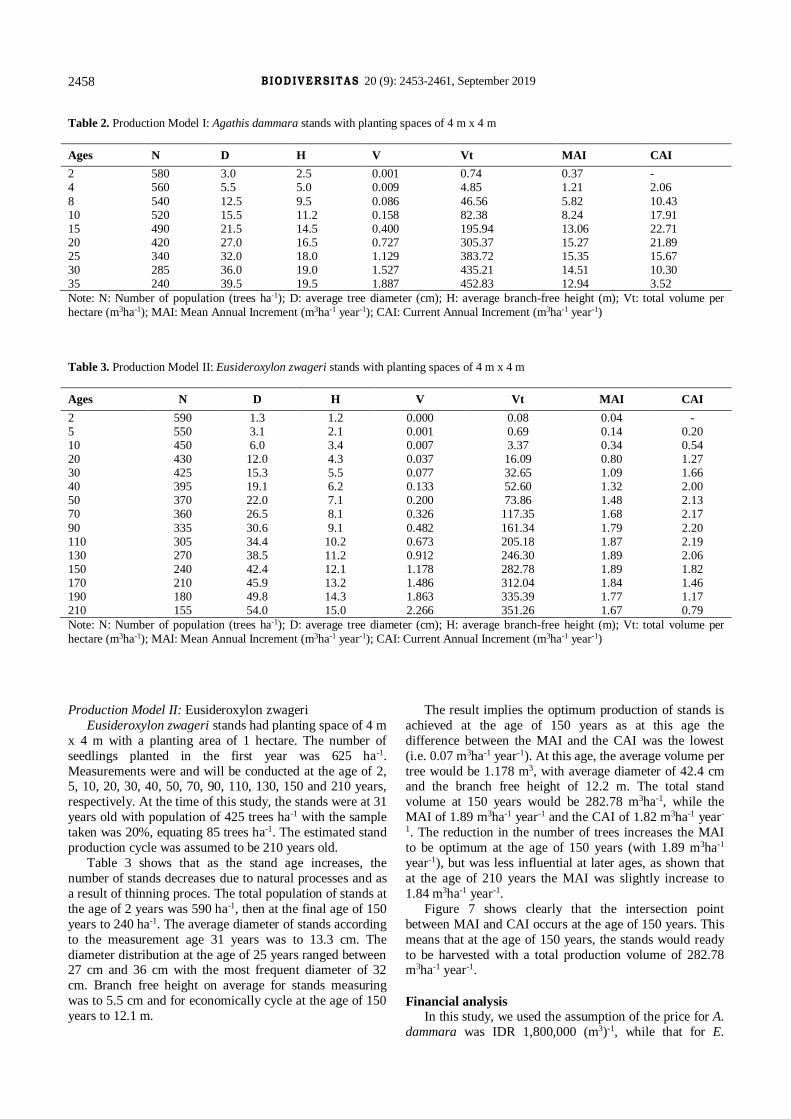
Table 2. Production Model I: Agathis dammara stands with planting spaces of 4 m x 4 m
Ages N D H V Vt MAI CAI
2 580 3.0 2.5 0.001 0.74 0.37 - 4 560 5.5 5.0 0.009 4.85 1.21 2.06
8 540 12.5 9.5 0.086 46.56 5.82 10.43 10 520 15.5 11.2 0.158 82.38 8.24 17.91 15 490 21.5 14.5 0.400 195.94 13.06 22.71 20 420 27.0 16.5 0.727 305.37 15.27 21.89 25 340 32.0 18.0 1.129 383.72 15.35 15.67 30 285 36.0 19.0 1.527 435.21 14.51 10.30 35 240 39.5 19.5 1.887 452.83 12.94 3.52
Note: N: Number of population (trees ha-1); D: average tree diameter (cm); H: average branch-free height (m); Vt: total volume per
hectare (m3ha-1); MAI: Mean Annual Increment (m3ha-1 year-1); CAI: Current Annual Increment (m3ha-1 year-1) Table 3. Production Model II: Eusideroxylon zwageri stands with planting spaces of 4 m x 4 m
Ages N D H V Vt MAI CAI
2 590 1.3 1.2 0.000 0.08 0.04 - 5 550 3.1 2.1 0.001 0.69 0.14 0.20 10 450 6.0 3.4 0.007 3.37 0.34 0.54 20 430 12.0 4.3 0.037 16.09 0.80 1.27 30 425 15.3 5.5 0.077 32.65 1.09 1.66 40 395 19.1 6.2 0.133 52.60 1.32 2.00 50 370 22.0 7.1 0.200 73.86 1.48 2.13 70 360 26.5 8.1 0.326 117.35 1.68 2.17
90 335 30.6 9.1 0.482 161.34 1.79 2.20 110 305 34.4 10.2 0.673 205.18 1.87 2.19 130 270 38.5 11.2 0.912 246.30 1.89 2.06 150 240 42.4 12.1 1.178 282.78 1.89 1.82 170 210 45.9 13.2 1.486 312.04 1.84 1.46 190 180 49.8 14.3 1.863 335.39 1.77 1.17 210 155 54.0 15.0 2.266 351.26 1.67 0.79
Note: N: Number of population (trees ha-1); D: average tree diameter (cm); H: average branch-free height (m); Vt: total volume per
hectare (m3ha-1); MAI: Mean Annual Increment (m3ha-1 year-1); CAI: Current Annual Increment (m3ha-1 year-1)
Production Model II: Eusideroxylon zwageri
Eusideroxylon zwageri stands had planting space of 4 m
x 4 m with a planting area of 1 hectare. The number of
seedlings planted in the first year was 625 ha-1.
Measurements were and will be conducted at the age of 2, 5, 10, 20, 30, 40, 50, 70, 90, 110, 130, 150 and 210 years,
respectively. At the time of this study, the stands were at 31
years old with population of 425 trees ha-1 with the sample
taken was 20%, equating 85 trees ha-1. The estimated stand
production cycle was assumed to be 210 years old.
Table 3 shows that as the stand age increases, the
number of stands decreases due to natural processes and as
a result of thinning proces. The total population of stands at
the age of 2 years was 590 ha-1, then at the final age of 150
years to 240 ha-1. The average diameter of stands according
to the measurement age 31 years was to 13.3 cm. The
diameter distribution at the age of 25 years ranged between 27 cm and 36 cm with the most frequent diameter of 32
cm. Branch free height on average for stands measuring
was to 5.5 cm and for economically cycle at the age of 150
years to 12.1 m.
The result implies the optimum production of stands is
achieved at the age of 150 years as at this age the
difference between the MAI and the CAI was the lowest
(i.e. 0.07 m3ha-1 year-1). At this age, the average volume per
tree would be 1.178 m3, with average diameter of 42.4 cm and the branch free height of 12.2 m. The total stand
volume at 150 years would be 282.78 m3ha-1, while the
MAI of 1.89 m3ha-1 year-1 and the CAI of 1.82 m3ha-1 year-
1. The reduction in the number of trees increases the MAI
to be optimum at the age of 150 years (with 1.89 m3ha-1
year-1), but was less influential at later ages, as shown that
at the age of 210 years the MAI was slightly increase to
1.84 m3ha-1 year-1.
Figure 7 shows clearly that the intersection point
between MAI and CAI occurs at the age of 150 years. This
means that at the age of 150 years, the stands would ready
to be harvested with a total production volume of 282.78 m3ha-1 year-1.
Financial analysis
In this study, we used the assumption of the price for A.
dammara was IDR 1,800,000 (m3)-1, while that for E.

SETIAWAN et al. – The feasibility of forest plantation of native species
2459
zwageri was IDR 7,000,000 (m3)-1. We simulated financial
analysis using varying discount interests for each stand:
5%, 10% and 15%. The harvesting cycle for A. dammara
was 25 years, while that of E. zwageri was 150 years.
Equivalent Annual Annuity (EAA) value was estimated
based on the assumption of the total expenditure required
for each family to live decently, which was IDR 3,500,000
month-1.
Financial analysis of production model I: Agathis
dammara Table 10 shows that the financial analysis of Production
Model I for A. dammara stand with a 5% interest rate
produces an estimated value of the Pay Back Period (PBP)
of 10.6 years while the Net Present Value (NPV) of IDR
78,699,974 with the Net Benefit/Cost (B/C) Ratio of 1.97,
the Internal Rate of Return (IRR) of 8.6%, Equivalent
Annual Annuity (EAA) of IDR 5,119,546 and a business
scale of 8 ha. Based on these results, it could be concluded
that developing plantation forest of A. dammara is feasible
because it had a positive NPV value and a Net B/C Ratio >
1, meaning that for each IDR 1 of money invested would return of 1.97 times. This statement is strengthened by the
IRR value of 8.6% which is still greater than the Minimum
Acceptable Rate (MAR) value of 5%. The invested capital
would return in the next 10.6 year with a business profit up
to 25 years. The results of the EAA analysis mean that the
value of money that could be paid annually is equal to IDR
5,119,546 with an interest rate of 5%.
Financial analysis of production model II: Eusideroxylon
zwageri
Table 10 shows that the financial analysis of Production
Model II for E. zwageri with an interest rate of 5% results
in an estimated 55.1 year of Pay Back Period (PBP) while
the Net Present Value (NPV) of IDR -91,439,292, with the
Net Benefit/Cost (B/C) Ratio of 0.05, the Internal Rate of
Return (IRR) of 13%, Equivalent Annual Annuity (EAA)
of IDR -4,572,127 and business scale of -15 ha. These
results suggest that developing E. zwageri plantation is not
feasible because it had a negative NPV value and Net B/C
Ratio ˂1, meaning that for every IDR 1 invested would
only return 0.05 times or the capital will not return to
normal. This statement is reinforced by the IRR value which is smaller than the Minimum Acceptable Rate
(MAR) of 5%. The invested capital would return in the
year 55.1. The negative EAA indicates that the value of
money cannot be paid annually in the same amount of IDR
-4,572,127 with an interest rate of 5%.
Sensitivity analysis of production Model I and Model II
using cost raised simulation to 10%
Table 5 demonstrates that A. dammara as Model I had
positive NPV by discount factor simulation only to 5%, but
negative NPV by discount factor simulation to 10% and
15%. It is feasible at a discount rate of 5% with Net B/C Ratio of 1.71, but it is not feasible at a discount rate of 10%
and 15%. E. zwageri as Model II had all negative NPV at
all discount rates (5%, 10% and 15%). This means that for
E. zwageri it needs discount factor of less than 5%. The
same result for its Net B/C Ratio which not feasible
economically because the result was less than 1. However,
planting E. zwageri might be chosen by farmer for
biodiversity conservation reason. Another the possible
approach is by giving a much higher price for E. zwageri
product than the existing price to increase the benefits and
to fulfill the need of farmer.
Table 4. The comparison of financial analysis between production Model I and Model II using 5% interest rate
Stands Spacing
(m)
Cycle
(years) MAI
TV
(m3)
PP
(year) NPV (IDR)
Net B/C
Ratio IRR (%) EAA (IDR)
Business
scale (ha)
Agathis dammara 4x4 25 15.67 383.72 10.6 78,699,974 1.97 8.6% 5,119,546 8 Eusideroxylon zwageri 4x4 150 1.89 282.78 55.1 (120,369,546) 0.02 11.9% (6.018.691) -7
Table 5. The sensitivity analysis of Production Model I and Model II using 5%, 10% and 15% interest rates and cost raised to 10%
Stands NPV (x Rp.1000) by discount rate Net B/C Ratio by discount rate IRR
5% 10% 15% 5% 10% 15% (%)
Agathis dammara 64,613 (23,249) (45,627) 1.72 0.675 0.25861 7.9 Eusideroxilon zwagery (132,368) (100,517) (88,099) 0.017055 0.000179 0.000004 11
Table 6. The sensitivity analysis of Production Model I and Model II using 5%, 10% and 15% interest rates and benefit decrease to 10%.
Stands NPV (x Rp.1000)
Net B/C Rasio
IRR
5% 10% 15% 5% 10% 15% (%)
Agathis dammara 56,743 (21,767) (41,690) 1.70 0.66 0.25 7.8 Eusideroxylon zwageri (120,370) (91,379) (80,090) 0,01677 0,00018 0,000003 10.9
BIODIVERSITAS 20 (9): 2453-2461, September 2019
2460
Sensitivity analysis of production Model I and Model II
using benefit decreased simulation to 10%
Table 6 shows the same result as above in which A.
dammara had a positive NPV value by discount rate 5%,
but E. zwageri had negative NPV value, moreover if using
a discount rate of 10% and 15%. The slight difference in
the case of A. dammara that it is feasible when using a 5%
discount rate, but it is not feasible at 10% and 15%
discount rate. E. zwageri was not feasible at discount rates
of 5%, 10% and 15% in which resulted in less than 1 of Net
B/C Ratio. In conclusion, Production Model I that estimated the
yield of A. dammara plantation is feasible because the IRR
value is higher than the Minimum Acceptable Rate (MAR)
of 5% and the Net B/C Ratio is higher than 1. On the other
hand, Production Model II that estimated the yield of E.
zwageri plantation is not feasible because the IRR is lower
than MAR of 5% and the Net B/C Ratio is lower than 1.
The optimum period of Production Model I is reached at
the age of 25 years while Production Model II would be at
the age of 150 years. In A. dammara plantation (Production
Model I) will produce higher MAI of 15.67 m3ha-1 year-1
and total volume of 383.72 m3ha-1 than Production Model II (E. zwageri) with MAI of 1.89 m3ha-1 year-1 and total
volume of 282.78 m3ha-1. The financial analysis
demonstrated that Production Model I had a positive NPV
value of IDR 78,699,974 while Production Model II had a
negative NPV value of IDR 91,439,292. These results
suggest that developing A. dammara plantation is more
desirable than E. zwageri plantation.
AKNOWLEDGEMENTS
We convey our sincere gratitude and appreciation to all
reviewers who gave opinions and final suggestions on the
manuscript. Our sincere gratitude and appreciation also goes to Aisyah Darmawan and Arnanda, who has helped us
in editing and accomplishing this research and Haris
Priyana for helping with the study site map. We appreciate
and thank to all respondent who give information data
which valuable to completing the research. We would like
to thank to anonymous reviewer for constructive feedback.
REFERENCES
Arias D, Calvo-Alvarado J, Richter D de B, Dohrenbusch A. 2011.
Productivity, aboveground biomass, nutrient uptake and carbon
content in fast-growing tree plantations of native and introduced
species in the Southern region of Costa Rica. J Biomass Bioenerg 35
(5): 1779-1788.
Barkin D, Fuente M. 2013. Community forest management: can the green
economy contribute to environmental justice? Nat Res Forum 37 (3):
200-210.
Bijalwan A. 2014. A potential fast growing tree for agroforestry and
carbon sequestration in India: Anthocephalus cadamba (Roxb.) Miq. J
Agric For 2 (6): 296.
Brockerhoff EG, Jactel H, Parrotta JA, Quine CP, Sayer J. 2008.
Plantation forests and biodiversity: Oxymoron or opportunity? J
Biodivers Conserv 17 (5): 925-951.
Budiharta S, Meijaard, Erskine PD, Rondinini C, Pacifici M, Wilson KA.
2014 Restoring degraded tropical forests for carbon and biodiversity.
Env Res Lett 9: 114020
Budiharta S, Meijaard E, Gaveau DLA, Struebig MJ, Wilting A, Kramer-
Schadt S, Niedballa J, Raes N, Maron M., Wilson KA. 2018
Restoration to offset the impacts of developments at a landscape scale
reveals opportunities, challenges and tough choices. Glob Environ
Change 52, 152-161.
Callaghan D, Khanal P, Straka T, Hagan D. 2019. Influence of forestry
practices cost on financial performance of forestry investments. J
Resour 8 (1): 28.
Dems A, Rousseau LM, Frayret, JM. 2013. Effects of different cut-to-
length harvesting structures on the economic value of a wood
procurement planning problem. J Ann Operations Res 21 (2): 303-
317.
Friedrich S, Paul C, Brandl S, Biber P, Messerer K Knoke T. 2019.
Economic impact of growth effects in mixed stands of Norway spruce
and European beech - a simulation based study. J For Pol Econ 104:
65-80.
Hartoyo APP, Siregar IZ, Supriyanto, Prasetyo, LB,Thelaide I. 2016.
Biodiversity, carbon stocks and community monitoring in traditional
agroforestry practices: Preliminary results from two investigated
villages in Berau, East Kalimantan. J Procedia Environ Sci 33: 376-
385.
Heyne K. 1987. Tumbuhan berguna Indonesia II. Badan Litbang
Kehutanan, Forestry Departement, Jakarta. [Indonesian]
Kadariah. 1987. Pengantar Evaluasi Proyek. Fakultas Ekonomi,
Universitas Indonesia, Jakarta. [Indonesian]
Khasanah N, Perdana, Rahmanullah A, Manurung G, Roshetko JM, van
Noordwijk M. 2015. Intercropping teak (Tectona grandis) and maize
(Zea mays): bioeconomic trade-off analysis of agroforestry
management practices in Gunungkidul, West Java. Agrofor Syst 89
(6): 1019-1033.
Lahjie AM, Isminarti I, Simarangkir BDAS Kristiningrum R, Ruslim Y.
2018a. Community forest management: comparison of simulated
production and financial returns from agarwood, tengkawang and
rubber trees in West Kutai, Indonesia. Biodiversitas 19 (1): 126-133.
Lahjie AM, Lepong A, Simarangkir BDAS, Kristiningrum R, Ruslim Y .
2018b. Financial analysis of dipterocarp log production and rubber
production in the forest and land rehabilitation program of Sekolaq
Muliaq, West Kutai District, Indonesia. Biodiversitas 19 (3): 707-716.
Lahjie AM, Nouval B, Annisa AL, Ruslim Y, Kristiningrum R. 2019.
Economic valuation from direct use of mangrove forest restoration in
Balikpapan Bay, East Kalimantan, Indonesia. J F1000 Res.
Latifah S, Sulistiyono N. 2013. Carbon sequestration potential in
aboveground biomass of hybrid eucalyptus plantation forest. J Trop
For Manag 19 (1): 54-62.
Linger E. 2014. Agro-ecosystem and socio-economic role of homegarden
agroforestry in Jabithenan district, North-Western Ethiopia:
Implication for climate change adaptation. SpringerPlus 3 (1): 154.
Muliadi M, Lahjie AM, Simarangkir BDAS, Ruslim Y. 2017.
Bioeconomic and environmental valuation of dipterocarp estate forest
based on local wisdom in Kutai Kartanegara, Indonesia. Biodiversitas
18 (1): 401-408.
Nghiem N, Tran H. 2016. The biodiversity benefits and opportunity costs
of plantation forest management: A modelling case study of Pinus
radiata in New Zealand. J For 7 (12): 297.
Nouri Z, Zobeiri M, Feghhi J, Amiri GZ, Mohadjer MR. 2015.
Comparison of woody species diversity between managed and
unmanaged forests considering vertical structure in Hyrcanian forests,
Iran. Biodiversitas 16 (1): 95-101.
Price C. 2011. Optimal rotation with declining discount rate. J For Econ
17 (3): 307-318.
Ruslim Y. 2011. Implementing reduced impact logging with mono-cable
winch. J Trop For Manag 17 (3): 103-110.
Ruslim Y, Sihombing R, Liah Y. 2016. Stand damage due to mono-cable
winch and bulldozer yarding in a selectively logged tropical forest.
Biodiversitas 17 (1): 222-228.
Sandalayuk D, Lahjie AM, Simarangkir BDAS, Ruslim Y. 2019. Analysis
growth and makro hara elements Jabon (Anthocephalus cadamba),
Jati (Tectona grandis) in Gorontalo. IOP Conf Ser Earth Environ Sci
270: 012045. DOI: 10.1088/1755-1315/270/1/012045
Sarjono A, Lahjie AM, Simarangkir B.D.A.S, Kristiningrum R, Ruslim Y.
2017. Carbon sequestration and growth of Anthocephalus cadamba

SETIAWAN et al. – The feasibility of forest plantation of native species
2461
plantation in North Kalimantan, Indonesia. Biodiversitas 18 (4):
1385-1393.
Sawada Y, Aiba S, Seino T, Kitayama K. 2016. Size structure, growth and
regeneration of tropical conifers along a soil gradient related to
altitude and geological substrates on Mount Kinabalu, Borneo. J Plant
Soil 403 (1-2): 103-114.
Scalarone D, Duursma MC, Boon JJ, Chiantoire, O. Maldi-Tof. 2005.
Mass spectrometry on cellulosic surfaces of fresh and photo-aged di-
and triterpenoid varnish resins. J Mass Spec 40: 1527-1535.
Soares M, Lahjie AM. 2019. Analisis produksi kayu bulat dan peluang
usaha bagi hasil jenis Shorea leprosula dan Shorea smithiana di PT
Inhutani I Bukit Bangkirai Balikpapan. J Agrifor 18 (1): 1-12.
[Indonesian]
Van Gardingen PR, McLeish MJ, Philips PD, Fadilah D, Tyrie G, Yasman
I. 2003. Financial and ecological analysis of management options for
logged-over dipterocarp forest in Indonesia Borneo. For Ecol Manag
183: 1-29.
Vavrek PR. 2014. Use of financial analysis in compiling a risk.
Management Faculty of Prešov University, Konštantínova, Prešov (2)
1 27-35.
Yusliansyah, Effendi E, Ngatiman, Sukanda, Ernayati, Wahyuni, T. 2004.
Status litbang ulin (Eusideroxylon zwagery Teisjm & Binn). Balai
Penelitian dan Pengembangan Kehutanan Kalimantan. Samarinda.
[Indonesian]
Zahabu E, Raphael, T, Chamshama SAO, Iddi S, Malimbwi RE. 2015.
Effect of spacing regimes on growth, yield, and wood properties of
Tectona grandis at Longuza forest plantation, Tanzania. Intl J For Res
2015: 469760. DOI: 10.1155/2015/469760.