assessing the effect of ... - head & face medicine
TRANSCRIPT

Ratzmann et al. Head & Face Medicine (2018) 14:22 https://doi.org/10.1186/s13005-018-0174-4
RESEARCH Open Access
Assessing the effect of multibracketappliance treatment on tooth color byusing electronic measurement
Anja Ratzmann1*, Christan Schwahn2, Anja Treichel3, Andreas Faltermeier4 and Alexander Welk5Abstract
Background: The purpose of this study was to investigate how tooth color is affected by multibracket appliance(MBA) treatment.
Methods: The color of teeth #14 to #24 of 15 patients with MBA was measured on body and gingival toothsegments using the spectrophotometer Shade Inspector™. Colors of both segments were recorded before start ofMBA treatment (baseline T0), end of MBA treatment (T1; 2 years ±0.3), and 3 months after T1 (T2). A 2D color systemand a 3D system served as reference systems.Multilevel models were used to analyze color change within segments and to compare the difference in colorchange between segments (treatment effect).
Results: 2D system. Changes within tooth segments from T0 to T2 were at worst 2.0 units (ΔE in the gingivalsegment), which is less than the threshold of 2.7 units for a clinically meaningful difference. Confidence intervals forthe treatment effect indicated no clinically important differences in color change between body and gingivalsegments.3D system. Changes within tooth segments from T0 to T2 were at worst 2.3 units (ΔE in the body segment), whichis less than the threshold of 2.7 units for a clinically meaningful difference. Confidence intervals for the treatmenteffect indicated no clinically important differences in color change between body and gingival segments.Thus, MBA treatment did not lead to clinically relevant changes in tooth color.
Conclusion: Within the limitation of this study the MBA treatment can be seen as a safe method with respect totooth color.
BackgroundChanges in tooth color may be caused by several factors,for instance, by extrinsic (external) and intrinsic (internal)discolorations, or by aging [1]. Further causes of colorchanges are dental treatments, including bleaching orrestorative therapy [2]. In addition, tooth color can bechanged by the acid-etching process used for bondingorthodontic brackets [3]. Formation of white spots and ir-reversible penetration of resin tags that remain in the en-amel as the two main causes have been reported [4–7].Therefore, multibracket treatment (MBA) may be
* Correspondence: [email protected] of Orthodontics and Department of Dental Propaedeutics/Community Dentistry, Dental School, University Medicine, Walther-RathenauStraße 42a, 17475 Greifswald, GermanyFull list of author information is available at the end of the article
© The Author(s). 2018 Open Access This articInternational License (http://creativecommonsreproduction in any medium, provided you gthe Creative Commons license, and indicate if(http://creativecommons.org/publicdomain/ze
associated with enamel discoloration due to changes inthe enamel by tooth cleaning, enamel conditioning proce-dures (etching), and the debonding and subsequent pol-ishing processes [8, 9].Association between tooth color changes due to bond-
ing and debonding procedure and multibracket treatment(MBA) is discussed controversial. Some studies [4, 10, 11]have shown that enamel color variables were significantlyaffected by bonding and debonding procedures, other in-vestigations [3, 12–14] did not find clinically important in-fluence of this procedures on the enamel discolorations.The purpose of this in vivo study was to investigate
how tooth color is affected by multibracket appliance(MBA) treatment, especially whether: (1) the change intooth color during MBA treatment is clinically import-ant; (2) the color change differs by bracket (body) and
le is distributed under the terms of the Creative Commons Attribution 4.0.org/licenses/by/4.0/), which permits unrestricted use, distribution, andive appropriate credit to the original author(s) and the source, provide a link tochanges were made. The Creative Commons Public Domain Dedication waiverro/1.0/) applies to the data made available in this article, unless otherwise stated.

Ratzmann et al. Head & Face Medicine (2018) 14:22 Page 2 of 11
non-bracket (gingival) tooth segments; and (3) thechange is substantially the same for the conventionallyused 2D system and the scientifically favorable 3Dsystem.
MethodsSubjects and clinical examination procedureAll subjects expecting MBA treatment were regular pa-tients of the orthodontic department and participated ona voluntary basis. All measurements were performedduring regular visits. All procedures performed in thisstudy were in accordance with the ethical standards ofthe institutional research committee ÄrztekammerMecklenburg-Vorpommern (Reg. Nr.III UV 15/08). In-formed consent was obtained from the patients and par-ents before start of the study. Initially, 26 patients wereincluded. The inclusion criteria were good oral hygiene,non-carious and restoration-free permanent teeth, and
Fig. 1 Consort Flow Diagram
no white spots. The multibracket appliances had beenpresent in situ for 2.0 (SD ± 0.3) years (individual studyperiod of each patient). The entire period of study datacollection lasted from 2005 to 2009. Time points ofmeasurements were start of MBA treatment (baseline -T0), end of MBA treatment (2 years SD ± 0.3 - T1), and3-month after end of MBA treatment (T2) (Fig. 1). Thecomplete clinical procedure was performed by an experi-enced orthodontist under standardized conditions (colorneutral such as same room and light conditions, patientwas covered by a drape, tooth surfaces were alwayssaliva-wet) according to the standardized bonding proto-col of the orthodontic department. Enamel was etchedwith 35% orthoposphoric acid (Scotchbond, 3 M Unitek)for 10 s, rinsed with air-water spray for 20 s and dried for10 s. Transbond XT™ Ligth Cure Primer (3 M, Unitek)was used in conjunction with Transbond XT™ Ligth CureAdhesive (3 M Unitek) according to the manufacturer’s

Fig. 3 Shade Inspector™ - Measurement of the gingival segment (S1)
Ratzmann et al. Head & Face Medicine (2018) 14:22 Page 3 of 11
instructions for bonding Mini-Mono – .022 Roth Tech-nique Stainless Steel Brackets (Forestadent, Germany).After that the bracket was pressed firmly on the enamelsurface and the excess adhesive resin was removed witha probe. Light curing was performed with LED sourceStarlight Pro (Mectron, Germany) for 10 s. For studypurposes, the protocol was slightly modified by theadditional advice “avoiding etching of the gingival seg-ment”. Each tooth was categorized into the gingival(S1), the body (S2), and the incisal (S3) segment (Fig. 2).For standardization of the measurements, we used thefacial axis point (FA point) for placing the bracket de-termined with a Dental Bracket Placement Gauge ac-cordingly the MBT™-technique for the middle segmentS2 and for gingival segment S1 we placed the tip of themeasuring probe perpendicularly 1 mm above of themiddle point of the gingival line of the correspondingtooth (Fig. 3). The probe was moved slightly around thedefined measurement points measuring automaticallyfour times giving an overall value of these measure-ments at the end. The incisal segment S3 was not in-cluded into analysis because of its transparency. Allmeasurements were performed by a calibrated exam-iner from a pilot study [15].During the entire study period we lost 11 patients.
Drop out reasons were lack of oral hygiene with breakupof fixed orthodontic treatment, move, repeated schedulefailure and withdrawal of informed consent.
Electronic color measurementTooth color was measured electronically with thespectrophotometer Shade Inspector™ (Schuetz Dental,Rosbach, Germany- presently not available). The toothcolor measuring device operates independently oflight on the principle of spectral photometry. Forcolor determination, the color data of the test speci-men are compared with manufacturer-furnished color
Fig. 2 Measuring report by Shade Inspector™
rings. The tested spectrophotometer is calibrated witha factory-provided selection of industrially fabricatedcolor reference scale VITAPAN Classical® and VITA3D-Master® by the company (Schuetz Dental, Rosbach,Germany). In the present study, the color referencesVITAPAN Classical® and VITA SYSTEM 3D-Master®were selected from the device software. The VITAPAN®Classical Color System has a two-dimensional structurethat enables the description of hue (category A to D) andlightness including chroma (group 1 to 4) [16, 17]. Itserves as standard shade guide for visual color assessmentin dental praxis. The VITA 3D-Master® Color System hasa three-dimensional structure that enables the separatedescription of lightness (1 to 5 and 0 for bleaching),chroma (1 to 3, including half points), and hue (M, L,R) [18]. It was developed to obtain a method for sys-tematic and ordered color determination and a betterhit rate. The examiners were provided with device op-erating instructions to ensure observance of the man-ufacturer’s specifications and calibrated in a pilotstudy [15]. Within a 1 mm measurement range diam-eter, the probe measures 26 standard colors and threebleaching colors from the VITA 3D–Master® colorring as well as 16 standard colors and 48 intermedi-ate colors (calculated) from the VITA Classical® colorring. The measuring probe was protected by a detach-able hygiene cap. During the measurements the probewas placed vertically to the tooth surface (Fig. 3).
Statistical methodsAs the 3D-system (VITA 3D-Master) is “a more orderedshade guide” than the 2D-system (VITAPAN® Classical)[16], we considered the 3D-system as the primary out-come [19, 20].Besides lightness and chroma, we analyzed color distri-
butions in terms of L* (CIE lightness) and C*ab (CIEchroma) after having assigned VITA 3D-Master® shadesto values given in Table 1 in Ahn et al. [21] via data
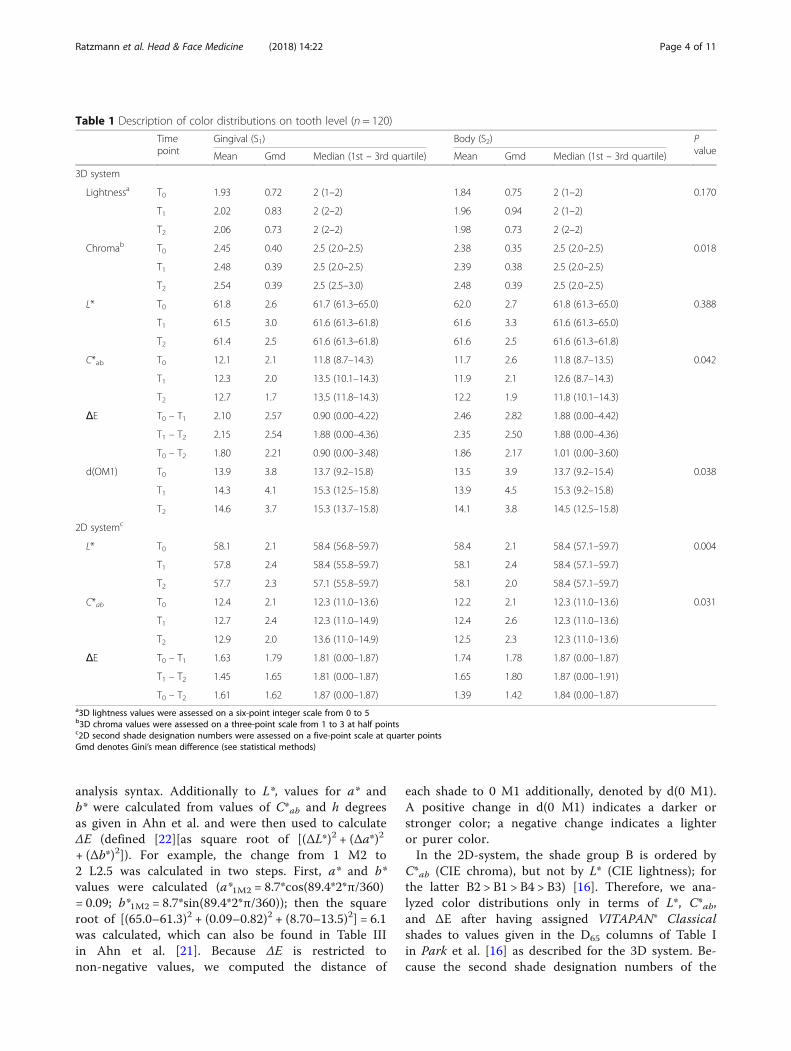
Table 1 Description of color distributions on tooth level (n = 120)
Timepoint
Gingival (S1) Body (S2) PvalueMean Gmd Median (1st – 3rd quartile) Mean Gmd Median (1st – 3rd quartile)
3D system
Lightnessa T0 1.93 0.72 2 (1–2) 1.84 0.75 2 (1–2) 0.170
T1 2.02 0.83 2 (2–2) 1.96 0.94 2 (1–2)
T2 2.06 0.73 2 (2–2) 1.98 0.73 2 (2–2)
Chromab T0 2.45 0.40 2.5 (2.0–2.5) 2.38 0.35 2.5 (2.0–2.5) 0.018
T1 2.48 0.39 2.5 (2.0–2.5) 2.39 0.38 2.5 (2.0–2.5)
T2 2.54 0.39 2.5 (2.5–3.0) 2.48 0.39 2.5 (2.0–2.5)
L* T0 61.8 2.6 61.7 (61.3–65.0) 62.0 2.7 61.8 (61.3–65.0) 0.388
T1 61.5 3.0 61.6 (61.3–61.8) 61.6 3.3 61.6 (61.3–65.0)
T2 61.4 2.5 61.6 (61.3–61.8) 61.6 2.5 61.6 (61.3–61.8)
C*ab T0 12.1 2.1 11.8 (8.7–14.3) 11.7 2.6 11.8 (8.7–13.5) 0.042
T1 12.3 2.0 13.5 (10.1–14.3) 11.9 2.1 12.6 (8.7–14.3)
T2 12.7 1.7 13.5 (11.8–14.3) 12.2 1.9 11.8 (10.1–14.3)
ΔE T0 – T1 2.10 2.57 0.90 (0.00–4.22) 2.46 2.82 1.88 (0.00–4.42)
T1 – T2 2.15 2.54 1.88 (0.00–4.36) 2.35 2.50 1.88 (0.00–4.36)
T0 – T2 1.80 2.21 0.90 (0.00–3.48) 1.86 2.17 1.01 (0.00–3.60)
d(OM1) T0 13.9 3.8 13.7 (9.2–15.8) 13.5 3.9 13.7 (9.2–15.4) 0.038
T1 14.3 4.1 15.3 (12.5–15.8) 13.9 4.5 15.3 (9.2–15.8)
T2 14.6 3.7 15.3 (13.7–15.8) 14.1 3.8 14.5 (12.5–15.8)
2D systemc
L* T0 58.1 2.1 58.4 (56.8–59.7) 58.4 2.1 58.4 (57.1–59.7) 0.004
T1 57.8 2.4 58.4 (55.8–59.7) 58.1 2.4 58.4 (57.1–59.7)
T2 57.7 2.3 57.1 (55.8–59.7) 58.1 2.0 58.4 (57.1–59.7)
C*ab T0 12.4 2.1 12.3 (11.0–13.6) 12.2 2.1 12.3 (11.0–13.6) 0.031
T1 12.7 2.4 12.3 (11.0–14.9) 12.4 2.6 12.3 (11.0–13.6)
T2 12.9 2.0 13.6 (11.0–14.9) 12.5 2.3 12.3 (11.0–13.6)
ΔE T0 – T1 1.63 1.79 1.81 (0.00–1.87) 1.74 1.78 1.87 (0.00–1.87)
T1 – T2 1.45 1.65 1.81 (0.00–1.87) 1.65 1.80 1.87 (0.00–1.91)
T0 – T2 1.61 1.62 1.87 (0.00–1.87) 1.39 1.42 1.84 (0.00–1.87)a3D lightness values were assessed on a six-point integer scale from 0 to 5b3D chroma values were assessed on a three-point scale from 1 to 3 at half pointsc2D second shade designation numbers were assessed on a five-point scale at quarter pointsGmd denotes Gini’s mean difference (see statistical methods)
Ratzmann et al. Head & Face Medicine (2018) 14:22 Page 4 of 11
analysis syntax. Additionally to L*, values for a* andb* were calculated from values of C*ab and h degreesas given in Ahn et al. and were then used to calculateΔE (defined [22][as square root of [(ΔL*)2 + (Δa*)2
+ (Δb*)2]). For example, the change from 1 M2 to2 L2.5 was calculated in two steps. First, a* and b*values were calculated (a*1M2 = 8.7*cos(89.4*2*π/360)= 0.09; b*1M2 = 8.7*sin(89.4*2*π/360)); then the squareroot of [(65.0–61.3)2 + (0.09–0.82)2 + (8.70–13.5)2] = 6.1was calculated, which can also be found in Table IIIin Ahn et al. [21]. Because ΔE is restricted tonon-negative values, we computed the distance of
each shade to 0 M1 additionally, denoted by d(0 M1).A positive change in d(0 M1) indicates a darker orstronger color; a negative change indicates a lighteror purer color.In the 2D-system, the shade group B is ordered by
C*ab (CIE chroma), but not by L* (CIE lightness); forthe latter B2 > B1 > B4 > B3) [16]. Therefore, we ana-lyzed color distributions only in terms of L*, C*ab,and ΔE after having assigned VITAPAN® Classicalshades to values given in the D65 columns of Table Iin Park et al. [16] as described for the 3D system. Be-cause the second shade designation numbers of the

Ratzmann et al. Head & Face Medicine (2018) 14:22 Page 5 of 11
2D-system were assessed on a five-point scale atquarter points, extrapolation to five and interpolationto quarter points were applied.In the 2D-system, the shade group B is ordered by
C*ab (CIE chroma), but not by L* (CIE lightness); for thelatter B2 > B1 > B4 > B3) [16]. Therefore, we analyzedcolor distributions only in terms of L*, C*ab, and ΔE afterhaving assigned VITAPAN® Classical shades to valuesgiven in the D65 columns of Table I in Park et al. [16] asdescribed for the 3D system. Because the second shadedesignation numbers of the 2D-system were assessed on afive-point scale at quarter points, extrapolation to five andinterpolation to quarter points were applied.As the American Statistical Association [23] recom-
mends to avoid over-reliance on p-values, we estimatedand interpreted confidence intervals [24]. Treatment ef-fects were corrected for tooth level and subject level byusing multilevel modeling [25], and adjusted for toothtype and quadrant. The group difference in change frombaseline was calculated in order to estimate treatment ef-fects. Originally, a difference in shade ≥3.7 CIELAB unitshad been prespecified as clinically meaningful both forchanges within groups and treatment effects [16] whichwas revised to ≥2.7 [26]. The treatment group differencein change (change in S1 versus change in S2) was esti-mated by linear multilevel models with Kenward-Rogercorrection for small samples [27] via the procedure“mixed” by Stata software, release 14.2 (Stata Corporation,College Station, TX, USA); changes within groups werecomputed afterwards using the command “margin”. Therelative treatment effect of the difference in change wasestimated by ordinal logistic multilevel models via Stata’sprocedure “meologit”. Odds ratios in the ordinal logisticregression can be interpreted as those in the binary logis-tic regression whatever the cutoff point of the ordinal out-come is [28]. Box plots and descriptive statistics, includingquantiles and Gini’s mean difference (Gmd) as a robustmeasure of dispersion [28], were generated using R, re-lease 3.3.3 (R Core Team (2017). R: A Language andEnvironment for Statistical Computing. R Foundationfor Statistical Computing. Vienna, Austria. https://www.r-project.org), especially the “ggplot2” package[29].
ResultsSubjects, teeth, and observationsThe initial study sample consisted of 26 consecutive pa-tients. Eleven patients were excluded from the study fordifferent reasons, including lack of oral hygiene, decalci-fication, or relocation. The multibracket appliances hadbeen present in situ for 2.0 years (SD ± 0.3). At the endof MBA treatment, data for tooth color of 120 teeth ofthe upper jaw (#14 to #24) of 12 female and 3 maleswere available, resulting in a total of 720 observations
for each color system (120 teeth, 2 tooth segments, 3time points). All patients were Caucasian, aged 11 to18 years.
Measurements results2D-systemAt baseline, 13 different shades were measured (Fig. 4a).Five shades with a frequency greater than 30 occurred:B2, B2.25, B2.5, B2.75 and B3 (Fig. 4a). Coordinates (CIEL*, a*, b*) of quarter points for the second shade desig-nation number were interpolated to (61.0, 59.7, 58.4,57.1, and 55.8) for L* of B2, B2.25, B2.5, B2.75 and B3,respectively, and to (9.8, 11.1, 12.4, 13.6, and 14.9) forC*ab of B2, B2.25, B2.5, B2.75 and B3, respectively(Fig. 5). Note that B2.25, B2.5, and B2.75 lie in a spacenot well covered by the 3D-system (Fig. 5). Gingival seg-ments were darker (L*) and stronger (C*ab) than bodysegments (P = 0.004 and P = 0.031, respectively; Table 1).Changes within segments S1 and S2 from baseline to 3
months after MBA treatment (T0 – T2) were at worst1.97 ≈ 2.0 units (ΔE for gingival segment; Table 2), whichis less than the threshold of 2.7 units for a clinical mean-ingful difference (Fig. 6a). Moreover, confidence intervalsfor the treatment effects in terms of the difference inchange indicated no clinically important differences be-tween body and gingival segments (Table 2).
3D-systemAt baseline, 13 different shades were measured (Fig. 4b).Four shades with a frequency greater than 30 occurred:1 M2, 2 L2.5, 2 M3, and 3R2.5 (Fig. 4b). Note that shades2 L2.5, 2 M3, and 3R2.5 limit a space that is not well cov-ered by the 3D system (Fig. 5; 3R2.5 is nearest neighbor of3 L2.5). Chroma of gingival segments was stronger thanthat of body segments (P = 0.018; Table 1); differences inlightness were uncertain (P = 0.17; Table 1).Changes within segments S1 and S2 from baseline to 3
months after MBA treatment (T0 – T2) were at worst2.28 ≈ 2.3 units (ΔE for body segment; Table 2), which isless than the threshold of 2.7 units for a clinical mean-ingful difference. Figs. 6b and 7 illustrate that ΔE isprone to information bias (measurement error). Thevalue of ΔE = 9.9 for T0 – T1 and T1 – T2 at the gingivalsegment as shown in Fig. 6b resulted from a changefrom 1 M2 to 3 L2.5 and back to 1 M2 for T0, T1, andT2, respectively. This change is more appropriately de-scribed in terms of d(0 M1): Values of 9.2, 19.0, and 9.2for T0, T1, and T2, respectively, correspond to a changein d(0 M1) of 9.8, and − 9.8 for T0 – T1 and T1 – T2, re-spectively, because d(0 M1) allows negative values to de-scribe purer or lighter changes. Moreover, confidenceintervals for the treatment effects in terms of the differ-ence in change indicated no clinically important differ-ences between body and gingival segments (Table 2).

Fig. 4 a, b Frequencies of 2D and 3D shades in gingival and body segments of 120 teeth at baseline
Ratzmann et al. Head & Face Medicine (2018) 14:22 Page 6 of 11
DiscussionDuring MBA treatment, color changes in bracket (body)and non-bracket (gingival) tooth segments were not clin-ically relevant. Moreover, body and gingival tooth seg-ments differed in change in tooth color only slightly andpossibly by zero. The extent of change in color dependedon color metrics (2D, 3D); nevertheless, our findingsusing different color metrics were sufficiently robust in-sofar as color change during MBA treatment was notclinically relevant, even if using small thresholds downto 2.3 units for a clinically relevant difference (ΔE).
Fig. 5 Scatterplot of CIE L* and C*ab values for 2D shades (blue) and3D shades (orange)
Methods of the studyIn this study, we preferred electronical measurementsinstead of visual measurements for several reasons. First,it was assumed that problems due to the regression tothe mean [30] which is “one of the most important of allphenomena regarding data and estimation” [31] couldnot have been substantially reduced by repeated visualmeasurements; the judger will be biased after the firstmeasurement. Second, we aimed to use measurementsof two systems (2D and 3D) for which judgers wouldhave introduced bias regarding the second measurement.Third, four measurements as used internally by the elec-tronic device to compute the overall value increased thereliability according to the Spearman-Brown formula.Fourth, by using quarter points, electronic 2D measure-ments could have been more accurate than visual 2Dmeasurements. Finally, it could be expected that ouradolescent patient group (11–18 years) was homoge-neous concerning tooth colors, especially in terms of Bcolor shades of the 2D system. Therefore, it could be as-sumed that a systematic measurement error will be sub-stantially the same in this highly homogeneous group –an assumption which would not be justified in a samplewith a wide age range (and more frequent color shadesdifferent from B of the 2D system). This is a crucialpoint because in presence of a constant systematic meas-urement error the validity of the measurement of changewill not be threatened. In short, we looked for atrade-off between reliability and validity issues, includingregression to the mean.

Table 2 Treatment effects in terms of the difference in change using linear multilevel models to account for 15 subjects and 120teeth, and relative treatment effects of the change in terms of the odds ratio of the body segment referred to the gingival segmentusing ordinal multilevel models
Linear multilevel model (mixed model) Ordinal multilevel model
Change withingingival segment (S1)
Change withinbody segment (S2)
Treatment effect(difference in change)
Relative treatment effect
Time points (95% CI) Change (95% CI) Coefficient (95% CI) P value Odds ratio (95% CI) P value
3D system
Lightness T0 – T1 0.09 (−0.10–0.28) 0.12 (− 0.07–0.31) 0.025 (− 0.11–0.16) 0.716 1.08 (0.62–1.90) 0.780
Lightness T1 – T2 0.04 (− 0.15–0.23) 0.02 (− 0.17–0.22) − 0.017 (− 0.15–0.12) 0.807 0.95 (0.54–1.66) 0.860
Lightness T0 – T2 0.13 (0.02–0.25) 0.14 (0.02–0.26) 0.008 (− 0.11–0.12) 0.885 1.05 (0.57–1.94) 0.870
Chroma T0 – T1 0.03 (−0.05–0.11) 0.01 (− 0.07–0.09) − 0.017 (− 0.09–0.06) 0.668 0.87 (0.51–1.49) 0.608
Chroma T1 – T2 0.07 (−0.01–0.15) 0.08 (0.004–0.16) 0.017 (− 0.06–0.09) 0.648 1.16 (0.68–1.98) 0.587
Chroma T0 – T2 0.10 (0.01–0.19) 0.10 (0.01–0.19) 0.000 (−0.7–0.07) 1.000 0.97 (0.56–1.69) 0.911
L* T0 – T1 0.34 (− 0.27–0.94) 0.40 (− 0.20–1.00) 0.066 (−0.41–0.54) 0.786 1.04 (0.65–1.66) 0.879
L* T1 – T2 0.03 (− 0.65–0.70) −0.004 (− 0.68–0.67) −0.033 (− 0.51–0.44) 0.889 0.83 (0.52–1.33) 0.436
L* T0 – T2 0.37 (− 0.001–0.73) 0.40 (0.03–0.77) 0.032 (−0.37–0.43) 0.873 0.92 (0.57–1.47) 0.726
C*ab T0 – T1 0.19 (− 0.43–0.81) 0.18 (− 0.44–0.80) −0.008 (− 0.48–0.47) 0.972 1.06 (0.66–1.69) 0.809
C*ab T1 – T2 0.42 (− 0.13–0.96) 0.29 (− 0.26–0.83) −0.129 (− 0.55–0.29) 0.543 0.85 (0.53–1.36) 0.498
C*ab T0 – T2 0.61 (0.19–1.03) 0.47 (0.05–0.89) −0.138 (− 0.51–0.23) 0.464 0.78 (0.49–1.25) 0.302
ΔE T0 – T1 2.10 (1.50–2.69) 2.46 (1.86–3.05) 0.360 (− 0.16–0.89) 0.176 1.43 (0.88–2.33) 0.154
ΔE T1 – T2 2.15 (1.64–2.66) 2.35 (1.84–2.86) 0.197 (−0.33–0.72) 0.460 1.23 (0.77–1.97) 0.392
ΔE T0 – T2 1.80 (1.39–2.22) 1.86 (1.45–2.28) 0.062 (− 0.37–0.49) 0.777 1.11 (0.68–1.81) 0.688
d(OM1) T0 – T1 0.38 (− 0.46–1.22) 0.42 (−0.41–1.26) 0.043 (− 0.56–0.65) 0.889 1.01 (0.63–1.61) 0.979
d(OM1) T1 – T2 0.32 (− 0.48–1.12) 0.21 (−0.59–1.01) −0.11 (− 0.66–0.44) 0.691 0.92 (0.58–1.47) 0.739
d(OM1) T0 – T2 0.70 (0.22–1.18) 0.63 (0.15–1.11) −0.068 (− 0.55–0.41) 0.781 0.96 (0.60–1.54) 0.882
2D system
L* T0 – T1 0.31 (− 0.17–0.80) 0.30 (− 0.19–0.78) −0.016 (− 0.35–0.32) 0.926 1.01 (0.63–1.60) 0.975
L* T1 – T2 0.06 (− 0.37–0.50) 0.05 (− 0.39–0.49) −0.012 (− 0.31–0.29) 0.936 0.91 (0.57–1.46) 0.704
L* T0 – T2 0.38 (− 0.03–0.78) 0.33 (− 0.06–0.75) −0.028 (− 0.31–0.26) 0.847 0.93 (0.58–1.48) 0.748
C*ab T0 – T1 0.23 (− 0.29–0.75) 0.17 (− 0.35–0.69) −0.053 (− 0.36–0.26) 0.738 0.84 (0.53–1.33) 0.449
C*ab T1 – T2 0.20 (− 0.25–0.66) 0.17 (− 0.28–0.62) −0.034 (− 0.31–0.24) 0.805 0.90 (0.56–1.44) 0.668
C*ab T0 – T2 0.43 (0.05–0.82) 0.34 (− 0.04–0.73) −0.087 (− 0.33–0.15) 0.471 0.77 (0.49–1.23) 0.279
ΔE T0 – T1 1.63 (1.17–2.10) 1.74 (1.28–2.21) 0.111 (− 0.26–0.48) 0.552 1.33 (0.83–2.14) 0.239
ΔE T1 – T2 1.45 (1.03–1.87) 1.65 (1.22–2.07) 0.199 (−0.16–0.56) 0.271 1.32 (0.82–2.13) 0.260
ΔE T0 – T2 1.61 (1.24–1.97) 1.39 (1.03–1.76) −0.214 (− 0.51–0.08) 0.155 0.80 (0.49–1.28) 0.346
Ratzmann et al. Head & Face Medicine (2018) 14:22 Page 7 of 11
Nevertheless, there are some limitations concern-ing the electronical measurement methods, includinglight condition, calibration of the measurement de-vice, reproducibility of the measurements, and visualthreshold discussed in the literature [32]. The spec-trophotometer Shade Inspector™ was used in ourstudy, because of its good results regarding reprodu-cibility of lightness and chroma found in pilot stud-ies [15, 33]. Other studies, investigating dental colormeasuring devices did show reliable results as well[34–38].
The Shade Inspector™ is calibrated with afactory-provided selection of industrially fabricated colorreference scale (VITAPAN® Classical and VITA3D-Master®). These color scales originating of differentbatches were read in and the measurements averaged.Therefore, variations in measurements due to the cali-bration process are conceivably [39]. The study of Kohl-meyer and Scheller evaluating VITAPAN® Classical colorscale samples, revealed that the individual color scalesamples failed to invariably correspond to the respectiveprimary color [40]. In addition, unequivocal findings

Fig. 6 a, b Box plots showing the distribution of ΔE for the 2D-system (a; left) and the 3D-system (b; right) on tooth level. Orange circle: mean;bold line: median; box: interquartile range (between 25 and 75%); whiskers: range between 12.5 and 87.5%; grey dots figure the 120 observations;red line: clinically important difference at 3.7 units or 2.7 units
Ratzmann et al. Head & Face Medicine (2018) 14:22 Page 8 of 11
were reported on color consistency alongst shade guidesfrom the same manufacturer [41, 42]. One in vitro studyfound that repeatability and accuracy of a dental colormeasuring instrument (ShadeScan) was influenced byshade guide systems used for testing [43]. In our study,the complete clinical procedure was performed by an ex-perienced orthodontist under standardized conditions(color neutral such as same room, same dental unit andsame light conditions by dental unit lamp, patient wascovered by a drape, tooth surfaces were alwayssaliva-wet). The electronical measurements were per-formed by a calibrated examiner [15] in a pilot study.The tooth color measuring device itself operates inde-pendently of light on the principle of spectral photom-etry. However, in a study, evaluating the effect ofdifferent illuminants (natural daylight, dental unit lamp,and daylight lamp), the matching repeatability of 2intraoral spectrophotometers was not completely satis-factory for clinical practice [44]. Therefore, our measure-ments were taken under standardized conditions asdescribed before. Thus, we do not assume relevant ef-fects by the surrounding light conditions.Our study has methodological strengths. Notably, two
measurements (2D, 3D) at each time point were used,thereby reducing problems due to regression to themean, which is here the tendency of tooth segment’scolors at the extremes to have less extreme values onsubsequent measurements [30]. To reduce the influenceof extreme values at the first measurement, it is com-mon to discard the first of three blood pressure mea-surements of the same examination [45] or to measurethe periodontium by the Florida probe thrice given dis-agreement in first two measurements. Importantly forinterpreting of the analysis of change as done herein, thesecond measurement was performed by the 3D-system,
which was considered as the primary outcome. More-over, we used mixed models as a shrinkage approachand “a way of discounting observed variation that ac-counts for regression to the mean” [31]. Second, the2D-system measured at quarter points for the secondshade designation number. As the 3D-system did notcover the space of the most frequent 2D shades, the2D-system added essential information, although limitedby the regression to the mean. Third, tooth type as a po-tentially substantial confounder can only be consideredin multilevel analysis. Further, it is not possible to ad-dress confounding due to tooth type by the study design.Thus, tooth type cannot be subject of randomizing in aMB study; analysis restricted to the subject level can bemisleading. Fourth, we presented not only the originalcodes of the 2D- and 3D-system but also the trans-formed values based on the CIE system. As B2 > B1 >B4 > B3 on the L* scale [16]. the shade designation num-bers of the original 2D codes cannot be well interpreted.Finally, we used not only ΔE to estimate the treatmenteffect but also the measure d(0 M1) to allow for pureror lighter changes. In terms of L*, ΔE does not differen-tiate a lighter change from a darker change given thesame ΔE; in terms of C*ab, ΔE does not differentiate apurer change from a stronger change. The 3D shade0 M1 as the new origin of the coordinate system enablesus to differentiate lighter/purer changes from darker/stronger changes. 0 M1 as the new origin of the3D-system is justified for its lightest lightness and itspurest chroma, including the purest red (a*) and thepurest yellow (b*). For the 2D- system, no shade hasthese properties [16].Unfortunately, there was no sample size calculation
for this study. However, we accounted for subject andtooth level to increase statistical power. Moreover, other

Fig. 7 Box plots showing the distribution of the change in distance from 0 M1 for the 3D system on tooth level. Orange circle: mean; bold line:median; box: interquartile range (between 25 and 75 - 50% of the values); whiskers: range between the 12.5 and 87.5% (75% of the values); greydots figure the 120 observations; change > 0 indicates darker or stronger colors; change <0 indicates lighter or purer colors; red line: clinicallyimportant difference at 3.7 units or 2.7 units
Ratzmann et al. Head & Face Medicine (2018) 14:22 Page 9 of 11
studies included similar numbers of participants [10, 46].Besides this limitation, it was not sensitive to adjust forbaseline values [47–49], because segments could not berandomized to treatment groups. Therefore, we com-pared the difference in change from baseline betweensegments [28, 50, 51].
Discussion of resultsConfidence intervals for the treatment effect for bothcolor systems indicated no clinically important differ-ences between body and gingival segments. Further,changes from baseline to 3 months after MBA treatment(T0 – T2) were at worst 2.3 units for 3D- system and2.0 units for 2D-system, respectively, which are less thanthe threshold of 2.7 units for a clinical meaningfuldifference.Previous studies [4, 14] have shown that the enamel
color variables are affected by orthodontic bonding anddebonding procedures due to tooth cleaning [52], en-amel conditioning procedures (etching) [53], and enamelscratches [54]. Other effects, such as staining of enameland resin material used for the bonding brackets, may
also induce color change of teeth during orthodontictreatment. These color change may be the result ofdemineralization [55], or direct food dye [12, 56]. Thestaining of the resin material is associated with the colorinstability of the polymer [57].Several experimental studies [3, 4, 12–14, 58] investi-
gated the impact of the bonding process on tooth color.Three studies [3, 12, 14] investigating color change afterbonding of extracted teeth have not found any indicationof a significant influence of the bonding process ontooth color. In another experimental study [13] assessingcolor changes in bracket areas, significant differences inΔE were found. Despite the significance of the results,the authors did not consider the color changes visuallyperceivable for the majority of examiners. Eliades et al.[4] reached similar conclusions when examining the in-fluence of different bonding materials. Furthermore, en-amel color alterations might also derive from theirreversible penetration of resin into the enamel surface[4]. Moderate evidence exits that shorter resin tags pene-tration produces less change in enamel color followingclean-up procedure and polishing [58]. Self-etching

Ratzmann et al. Head & Face Medicine (2018) 14:22 Page 10 of 11
primers produce less resin penetration and these systemsproduce less iatrogenic color change in enamel followingorthodontic treatment [58]. In our study 35%-phosphoricacid was used.The results of a prospective clinical trial conducted by
Karamouzos et al. [10] showed significant changes oftooth color (2.1 to 3.6 ΔE units) after orthodontic treat-ment. The value for the parameter lightness (L*) de-creased, whereas the values for the parameters a* (valuefor green-red) and b* (value for blue-yellow) increased.These changes indicated a decrease in tooth lightness aswell as a change in hue, which may be perceptible if athreshold of 1.2 is assumed [26]. In our study, however,we did not find ΔE values greater than 2.7 units, whichare considered clinically relevant [26]. Nevertheless, ourresults are in accordance to a recently published reviewby Chen that there is no strong evidence that orthodon-tic treatment with fixed appliances alters the originalcolor of enamel [8].
ConclusionWithin the limitation of this study the MBA treatmentcan be seen as a safe method with respect to tooth color.
FundingThe study was not funded.
Availability of data and materialsAll data are available on request at Department of Orthodontics. Dentalschool, University Medicine, Walther-Rathenau Straße 42a, 17,475 Greifswald,Germany.
Informed consentInformed consent was obtained from all individual participants and parentsincluded in the study.
Explanation of any issues relating to journal policiesNo issues.
Authors’ contributionsAR Contributed to data acquisition, design, analysis and interpretation,writing of manuscript. CS Contributed to statistical analysis andinterpretation, writing statistical part of manuscript. AT Contributed to dataacquisition. AF Critically revised the manuscript. AW Contributed to design,analysis and interpretation, writing of manuscript. All authors gave finalapproval and agree to be accountable for all aspects of the work. All authorshave read and approved the manuscript.
Ethics approval and consent to participateAll procedures performed in this study involving human participants were inaccordance with the ethical standards of the institutional researchcommittee Ärztekammer Mecklenburg-Vorpommern (Reg. Nr.III UV 15/08)and with the 1964 Helsinki declaration and its later amendments or compar-able ethical standards.
Consent for publicationThe authors confirm that the content of the manuscript has not beenpublished or submitted for publication elsewhere.
Competing interestsThe authors declare that they have no competing interests.
Publisher’s NoteSpringer Nature remains neutral with regard to jurisdictional claims inpublished maps and institutional affiliations.
Author details1Department of Orthodontics and Department of Dental Propaedeutics/Community Dentistry, Dental School, University Medicine, Walther-RathenauStraße 42a, 17475 Greifswald, Germany. 2Department of Prosthetic Dentistry,Gerodontology and Biomaterials, University of Greifswald, Fleischmannstraße42, 17475 Greifswald, Germany. 3Private Dental Office, Bahnhofstraße 4,18581 Putbus, Germany. 4Department of Orthodontics, Dental School,University Medicine, Franz-Josef-Strauß-Allee 11, 93053 Regensburg,Germany. 5Department of Restorative Dentistry, Periodontology,Endodontology, Preventive and Pediatric Dentistry, Dental School, UniversityMedicine, Walther-Rathenau Straße 42a, 17475 Greifswald, Germany.
Received: 11 December 2017 Accepted: 17 September 2018
References1. Watts A, Addy M. Tooth discolouration and staining: a review of the
literature. Br Dent J. 2001;190:309–16. https://doi.org/10.1038/sj.bdj.4800959a.
2. Burrows S. A review of the safety of tooth bleaching. SADJ. 2010;65(6):8–13.3. Wriedt S, Keller S, Wehrbein H. The effect of debonding and/or bleaching
on enamel color - an in-vitro study. J Orofac Orthop. 2008;69:169–76.https://doi.org/10.1007/s00056-008-0737-2.
4. Eliades T, Kakaboura A, Eliades G, Bradley TG. Comparison of enamel colourchanges associated with orthodontic bonding using two differentadhesives. Eur J Orthod. 2001;23:85–90.
5. Silverstone LM, Saxton CA, Dogon IL, Fejerskov O. Variation in the pattern ofacid etching of human dental enamel examined by scanning electronmicroscopy. Caries Res. 1975;9:373–87.
6. Baumann DF, Brauchli L, van Waes H. The influence of dental loupes on thequality of adhesive removal in orthodontic debonding. J Orofac Orthop.2011;72:125–32. https://doi.org/10.1007/s00056-011-0010-y.
7. Ogaard B, Fjeld M. The enamel surface and bonding in orthodontics. SeminOrthod. 2010;16:37–48.
8. Chen Q, Zheng X, Chen W, Ni Z, Zhou Y. Influence of orthodontic treatmentwith fixed appliances on enamel color: a systematic review. BMC OralHealth. 2015;15:31. https://doi.org/10.1186/s12903-015-0014-x.
9. Janiszewska-Olszowska J, Szatkiewicz T, Tomkowski R, Tandecka K,Grocholewicz K. Effect of orthodontic debonding and adhesive removal onthe enamel - current knowledge and future perspectives - a systematicreview. Med Sci Monit. 2014;20:1991–2001. https://doi.org/10.12659/MSM.890912.
10. Karamouzos A, Athanasiou AE, Papadopoulos MA, Kolokithas G. Tooth-colorassessment after orthodontic treatment: a prospective clinical trial. Am JOrthod Dentofac Orthop. 2010;138(537):e531–8; discussion 537–539. https://doi.org/10.1016/j.ajodo.2010.03.026.
11. Boncuk Y, Cehreli ZC, Polat-Ozsoy O. Effects of different orthodonticadhesives and resin removal techniques on enamel color alteration. AngleOrthod. 2014;84:634–41. https://doi.org/10.2319/060613-433.1.
12. Trakyali G, Ozdemir FI, Arun T. Enamel colour changes at debonding andafter finishing procedures using five different adhesives. Eur J Orthod. 2009;31:397–401. https://doi.org/10.1093/ejo/cjp023.
13. Jahanbin A, Ameri H, Khaleghimoghaddam R. Effect of adhesive typeson enamel discolouration around orthodontic brackets. Aust Orthod J.2009;25:19–23.
14. Hintz JK, Bradley TG, Eliades T. Enamel colour changes following whiteningwith 10 per cent carbamide peroxide: a comparison of orthodontically-bonded/debonded and untreated teeth. Eur J Orthod. 2001;23:411–5.
15. Ratzmann A, Klinke T, Schwahn C, Treichel A, Gedrange T. Reproducibility ofelectronic tooth colour measurements. Biomed Tech (Berl). 2008;53:259–63.https://doi.org/10.1515/BMT.2008.036.
16. Park JH, Lee YK, Lim BS. Influence of illuminants on the color distribution ofshade guides. J Prosthet Dent. 2006;96:402–11. https://doi.org/10.1016/j.prosdent.2006.10.007.
17. Paravina RD. Performance assessment of dental shade guides. J Dent. 2009;37(Suppl 1):e15–20. https://doi.org/10.1016/j.jdent.2009.02.005.
18. Vita Z. Dental Shade Guides. In J Am Dent Assc. 2002;133:366–7.
Ratzmann et al. Head & Face Medicine (2018) 14:22 Page 11 of 11
19. Cook RJ, Farewell VT. Multiplicity considerations in the design and analysisof clinical trials. J R Stat Soc Ser. 1996;159:93–110. https://doi.org/10.2307/2983471.
20. ICH E9 Expert Working Group. Statistical principles for clinical trials: ICHharmonized tripartite guideline. Stat Med. 1999;18:1905–42.
21. Ahn JS, Lee YK. Color distribution of a shade guide in the value, chroma,and hue scale. J Prosthet Dent. 2008;100:18–28. https://doi.org/10.1016/S0022-3913(08)60129-8.
22. Paravina RD, Powers JM, Fay RM. Color comparison of two shadeguides. Int J Prosthodont. 2002;15:73–8.
23. Wasserstein RL, Assoc AS. ASA statement on statistical significance andP-values. Am Stat. 2016;70:131–3. https://doi.org/10.1080/00031305.2016.1154108.
24. Greenland S, Senn SJ, Rothman KJ, Carlin JB, Poole C, Goodman SN,Altman DG. Statistical tests, P values, confidence intervals, and power: aguide to misinterpretations. Eur J Epidemiol. 2016;31:337–50. https://doi.org/10.1007/s10654-016-0149-3.
25. Rabe-Hesketh S, Skrondal A. Multilevel and longitudinal modeling usingStata. 3rd ed. College Station: Stata Press; 2012.
26. Paravina RD, Ghinea R, Herrera LJ, Bona AD, Igiel C, Linninger M, Sakai M,Takahashi H, Tashkandi E, Perez MM. Color difference thresholds in dentistry.J Esthet Restor Dent. 2015;27(Suppl 1):S1–9. https://doi.org/10.1111/jerd.12149.
27. Kenward MG, Roger JH. Small sample inference for fixed effects fromrestricted maximum likelihood. Biometrics. 1997;53:983–97.
28. Harrell FE Jr. With applications to linear models, logistic and ordinalregression, and survival analysis. In: Regression modeling strategies.2nd ed. Heidelberg: Springer; 2015. https://doi.org/10.1007/978-3-319-19425-7.
29. Wickham H. Elegant graphics for data analysis. New York: Springer; 2009.30. Fletcher RH, Fletcher SW, Fletcher GS. Clinical epidemiology: the
essentials. 5th ed. Philadelphia: Lippincott Williams & Wilkins; 2014.31. Harrell FE, Jr., Slaughter JE. Biostatistics for biomedical research. Harell FE ed.
pp. 1- 11-22-11: biostat.mc.vanderbilt.edu; 2017. http://www.fharrell.com/.Accessed 25 May 2018.
32. Chu SJ, Trushkowsky RD, Paravina RD. Dental color matching instrumentsand systems. Review of clinical and research aspects. J Dent 2010;38 Suppl2:e2–16; doi: https://doi.org/10.1016/j.jdent.2010.07.001.
33. Ratzmann A, Treichel A, Langforth G, Gedrange T, Welk A. Experimentalinvestigations into visual and electronic tooth color measurement. BiomedTech (Berl). 2011;56:115–22. https://doi.org/10.1515/BMT.2011.008.
34. Ishikawa-Nagai S, Ishibashi K, Tsuruta O, Weber HP. Reproducibility of toothcolor gradation using a computer color-matching technique applied toceramic restorations. J Prosthet Dent. 2005;93:129–37.
35. Da Silva JD, Park SE, Weber HP, Ishikawa-Nagai S. Clinical performanceof a newly developed spectrophotometric system on tooth colorreproduction. J Prosthet Dent. 2008;99:361–8. https://doi.org/10.1016/S0022-3913(08)60083-9.
36. Dozic A, Kleverlaan CJ, El-Zohairy A, Feilzer AJ, Khashayar G. Performance offive commercially available tooth color-measuring devices. J Prosthodont.2007;16:93–100. https://doi.org/10.1111/j.1532-849X.2007.00163.x.
37. Kim-Pusateri S, Brewer JD, Davis EL, Wee AG. Reliability and accuracy of fourdental shade-matching devices. J Prosthet Dent. 2009;101:193–9. https://doi.org/10.1016/S0022-3913(09)60028-7.
38. Olms C, Setz JM. The repeatability of digital shade measurement--aclinical study. Clin Oral Investig. 2013;17:1161–6. https://doi.org/10.1007/s00784-012-0796-z.
39. Hugo B, Witzel T, Klaiber B. Comparison of in vivo visual and computer-aided tooth shade determination. Clin Oral Investig. 2005;9:244–50. https://doi.org/10.1007/s00784-005-0014-3.
40. Kohlmeyer B, Scheller H. Computerised tooth color determination withmeasuring device “digital shade guide”. Dtsch Zahnarztl Z. 2002;57:172–5.
41. Cal E, Sonugelen M, Guneri P, Kesercioglu A, Kose T. Application of a digitaltechnique in evaluating the reliability of shade guides. J Oral Rehabil. 2004;31:483–91.
42. Tashkandi E. Consistency in color parameters of a commonly usedshade guide. Saudi Dent J. 2010;22:7–11. https://doi.org/10.1016/j.sdentj.2009.12.002.
43. Kim-Pusateri S, Brewer JD, Dunford RG, Wee AG. In vitro model to evaluatereliability and accuracy of a dental shade-matching instrument. J ProsthetDent. 2007;98:353–8. https://doi.org/10.1016/S0022-3913(07)60119-X.
44. Sarafianou A, Kamposiora P, Papavasiliou G, Goula H. Matching repeatabilityand interdevice agreement of 2 intraoral spectrophotometers. J ProsthetDent. 2012;107:178–85. https://doi.org/10.1016/S0022-3913(12)60053-5.
45. Friedman LM, Furberg CD, DL DM, Reboussin DM, granger CB.Fundamentals of Clinical Trials. 5th ed. Heidelberg: Springer; 2015.
46. Hammad SM, El Banna M, El Zayat I, Mohsen MA. Effect of resin infiltrationon white spot lesions after debonding orthodontic brackets. Am J Dent.2012;25:3–8.
47. Cologne JB. Re: “when is baseline adjustment useful in analyses of change?An example with education and cognitive change”. Am J Epidemiol. 2006;164:1138–9. https://doi.org/10.1093/aje/kwj359.
48. Chen JT, Weuve J, Glymour M, Rehkopf D. Quantifying survivor bias inlifecourse epidemiologic studies. Am J Epidemiol. 2006;163:S69.
49. Glymour MM, Weuve J, Berkman LF, Kawachi I, Robins JM. When isbaseline adjustment useful in analyses of change? An example witheducation and cognitive change. Am J Epidemiol. 2005;162:267–78.https://doi.org/10.1093/Aje/Kwi187.
50. Senn S. Change from baseline and analysis of covariance revisited. Stat Med.2006;25:4334–44. https://doi.org/10.1002/sim.2682.
51. Harrell FE, Jr.: Statistical Errors in the Medical Literature. 2017; http://www.fharrell.com/post/errmed/#change. Accessed 16 April 2018.
52. Thompson RE, Way DC. Enamel loss due to prophylaxis and multiplebonding/debonding of orthodontic attachments. Am J Orthod. 1981;79:282–95.
53. van Waes H, Matter T, Krejci I. Three-dimensional measurement of enamelloss caused by bonding and debonding of orthodontic brackets. Am JOrthod Dentofac Orthop. 1997;112:666–9.
54. Sandison RM. Tooth surface appearance after debonding. Br J Orthod. 1981;8:199–201.
55. Ogaard B, Rolla G, Arends J. Orthodontic appliances and enameldemineralization. Part 1. Lesion development. Am J Orthod DentofacOrthop. 1988;94:68–73.
56. Eliades T, Gioka C, Heim M, Eliades G, Makou M. Color stability oforthodontic adhesive resins. Angle Orthod. 2004;74:391–3. https://doi.org/10.1043/0003-3219(2004)074<0391:CSOOAR>2.0.CO;2.
57. Faltermeier A, Rosentritt M, Reicheneder C, Behr M. Discolouration oforthodontic adhesives caused by food dyes and ultraviolet light. Eur JOrthod. 2008;30:89–93. https://doi.org/10.1093/ejo/cjm058.
58. Zaher AR, Abdalla EM, Abdel Motie MA, Rehman NA, Kassem H, AthanasiouAE. Enamel colour changes after debonding using various bonding systems.J Orthod. 2012;39:82–8. https://doi.org/10.1179/1465312512Z.0000000009.