assessing the economic benefits of public housing final reporteconsult corporation january 2007 ....
TRANSCRIPT
Assessing the Economic Benefits of Public Housing Final Report Submitted To: The Council of Large Public Housing Authorities 1250 Eye Street, N.W. Suite 901 Washington, DC 20005-3922 Submitted By: Econsult Corporation 3600 Market St., 6th Floor Philadelphia, PA 19104
Econsult Corporation January 2007

Assessing the Economic Benefits of Public Housing
2
CONTENTS Executive Summary 3 1.0 Introduction 5 1.1 A Brief History of Public Housing 5 1.2 Changes in Federal Policy 6 1.3 Public Housing Funding 6 1.4 Study Objectives 7 2.0 Economic Benefits of Public Housing 10 2.1 Rental Subsidies—Impacts on Households 10 2.2 Rental Subsidies—Impacts on Employers 14 2.3 Economic Impacts of PHA Spending 16 3.0 The Economic Value of the Public Housing Stock 22 3.1 Replacement Value of Public Housing 22 3.2 The Investment Value of Public Housing if Maintained as Affordable Housing for Low-Income Households 26 3.3 The Value of Public Housing Property,
with No Use Restrictions 28 3.4 Summary 29 4.0 Discussion and Conclusions 30 4.1 Impacts on Capital Needs 30 4.2 Summary and Conclusion 30 Appendix I RIMS Models 32 Appendix II Housing Authorities in Study 34 Appendix III Metropolitan Statistical Areas 35

Assessing the Economic Benefits of Public Housing
3
EXECUTIVE SUMMARY As one of the nation’s largest sources of affordable housing, public housing represents a significant investment on the part of the federal government: over $6 billion in federal appropriations in Fiscal Year 2006. The program plays a central role in the country’s approach to addressing affordable housing needs. Today, public housing is home to 2.6 million people, including seniors, people with disabilities and low-wage earners. Federal monies spent on the operation and maintenance of public housing clearly impact both public housing residents and local communities surrounding public housing sites. These impacts have rarely been studied and have never been comprehensively quantified. This study is the first to develop a framework for making quantitative estimates of the economic benefit of public housing investment and is intended to inform the wide-ranging debate about the role of the federal government funding in providing affordable housing. Our study finds—as detailed below—that public housing generates a wide range of tangible economic benefits within local communities—in addition to its role as an affordable housing provider. Continued and enhanced investment to maintain this affordable housing resource will therefore directly support local economies as well as public housing residents. Summary of Findings
Public housing sustains low-wage workers and supports local industry. • Average wages in some high-growth industries, such as accommodation and food service, are too low for workers to afford market rate housing costs. • Public housing provides an annual effective rent subsidy of $5,964 (relative to the bottom quartile market rents) to each of more than 1.2 million households. • Since wages comprise the main source of income for almost half of the non-elderly, non-disabled households in public housing, this rent subsidy provides indirect support to high-growth industries.

Assessing the Economic Benefits of Public Housing
4
Public housing expenditures contribute to local economies. • Direct spending by public housing authorities on capital improvements, maintenance and operations is approximately $8.1 billion a year. • This spending generates another $8.2 billion in indirect and induced economic activity in the PHAs’ regional economies. • The public housing rent subsidies help low-income workers obtain jobs and stay in otherwise unaffordable markets, thereby providing an indirect subsidy to local employers. Public housing constitutes an economic and social asset that cannot be created or sustained by the private market. • Replacing a typical public housing unit would cost $134,858. • Factoring in related land costs, it would take approximately $162 billion to replace the existing 1.2 million units of existing public housing. • Excluding land costs, it would take approximately $145 billion to replace the existing stock of public housing. • The value of the existing public housing stock—maintained as affordable housing—to a private investor is considerably less than the aggregate replacement cost of the units; this difference indicates that the private market could not provide such housing services without significant subsidy. • The annual capital investment necessary to maintain the existing public housing stock is $4.8 billion.
Our study concludes with these general points: First, public housing property has intrinsic economic value which will depreciate over time without capital investment. Second, capital and operating expenditures associated with public housing spillover into regional economies, driving indirect and induced economic activity that nearly equals the effects of direct spending. Third, the level of subsidy that would be necessary for the private market to provide equivalent housing is demonstrated by the difference between the current investment value of public housing and its replacement value. Without significant subsidy, the private market could not provide and maintain these housing services.
Assessing the Economic Benefits of Public Housing
5
1.0 INTRODUCTION More than 2.6 million seniors, people with disabilities, and low-wage individuals live in public housing. There are public housing units in every state and metropolitan area: 21 percent in rural and non-metropolitan areas, 19 percent in suburban areas, and 60 percent in central cities. Operated by more than 3,100 public housing authorities (PHAs), the public housing program is one of the oldest subsidized housing programs in the country. In FY06, the federal government dedicated $6 billion in appropriations to public housing operations and capital improvements—funding which impacts both residents and local economies. However, the extent of these benefits and their relationship to the quantity of investment are not well documented. This study is the first attempt at quantifying those benefits, as well as the underlying value of the existing public housing stock. It is intended to inform the wide-ranging debate about the role of the federal government in providing affordable housing. 1.1 A BRIEF HISTORY OF PUBLIC HOUSING The federal public housing program was created in the U.S. Housing Act of 1937 as a public works program during the Great Depression. In the first decades of the program, public housing was intended as a way to house temporary and low-wage workers, and the program was self-sustaining. As a result of changing economics, demographics, and government policies, public housing is no longer self-sustaining and relies on federal operating subsidy. Today households residing in public housing have incomes far below the poverty level.1 In 2005, for example, the median income of public housing households was $10,738, equal to only 23.2% of the national median income, $46,326. Half of all public housing is home to seniors and people with disabilities, who tend to have fixed income streams; nearly 49 percent of the remaining low-income households receive their primary income from wages. Most households remain in public housing for less than 10 years, and 40 percent remain for no more than three years.2
1 Poverty thresholds are established by household size. In 2005, the poverty threshold for a family of 2 was $12,755. Median income levels for public housing households in this study are for all households, regardless of size. 2 Michael A. Stegman, “The Fall and Rise of Public Housing,” Regulation, Summer 2002.

Assessing the Economic Benefits of Public Housing
6
1.2 CHANGES IN FEDERAL POLICY By the early 1990s, there was universal recognition by PHAs, Congress, HUD, and affordable housing advocates that existing public housing policies were not resulting in the provision of quality housing for very low-income households. Many cities experienced concentrations of the very poorest families in increasingly unsafe neighborhoods. PHAs had little money available to meet the properties’ capital investment needs, and assorted federal regulations effectively precluded innovative attempts at change. Congress began to address these problems in 1992 when it enacted legislation creating the Housing Opportunities for People Everywhere Program (HOPE VI). The program represented a fundamentally different approach to public housing, providing seed money to replace physically deteriorated, high-density developments with lower-density, mixed-income developments that frequently combined owner-occupied and renter-occupied units. The National Commission on Severely Distressed Public Housing originally recommended that such a program be funded at $750 million per year for 10 years. The HOPE VI program was funded at that level for its first year. The Bush administration subsequently proposed eliminating HOPE VI in budget proposals for fiscal years 2004, 2005, and 2006. Congress has kept the program in place, but funding has been cut to $149 million in 2004, $143 million in 2005, and $99 million in 2006. 1.3 PUBLIC HOUSING FUNDING The cutbacks in HOPE VI serve as one example of an overall decrease in public housing funding in recent years. Since rent levels for public housing are limited by statute, and rents collected by PHAs are not enough to cover the costs of operating public housing units, the federal Department of Housing and Urban Development is expected to provide PHAs with an annual subsidy to make up the difference. PHAs use these monies to cover items ranging from utility and maintenance costs to management and administrative salaries. Based on federal appropriations for public housing capital and operating subsidies for federal fiscal years 2000 to 2006, PHAs have been under-funded by $6.7 billion relative to estimates of their actual need.3 In recent months inadequate funds have forced PHAs to shift assistance away from the most needy families, pass utility costs on to residents, and reduce maintenance and security in public housing developments. Deferred maintenance has resulted in new
3 The amount of under-funding for operating monies was calculated by comparing the actual Congressional appropriation with HUD’s estimate of need as determined by the annual pro-ration of operating costs. For capital monies, the under-funding is the difference between the annual appropriation and $3.5 billion, the the industry estimate of need taking into account annual accrual needs and the substantial backlog of capital needs in the public housing stock.

Assessing the Economic Benefits of Public Housing
7
capital needs for which there are no funds, resulting in units lost to deterioration. Some PHAs have been forced to sell off portions of their housing stock. Despite funding shortfalls, there have been significant innovations in the provision of public housing in recent years—concurrent with economic revivals in some of the nation’s major cities. These changes present both opportunities and obstacles for public housing residents: stronger city economies bring better economic opportunities for tenants, but rising real estate prices reduce the overall affordability of housing. These changes have renewed the national conversation over the future of federally assisted housing efforts. This is therefore an appropriate time to take stock of the full impact of public housing in local communities, both to understand better the impact of federal spending and to provide a context for policy debate. 1.4 STUDY OBJECTIVES In this study we address three overarching questions with respect to the economic benefits of public housing:
• What benefits do the residents of public housing derive from the program?
• What economic benefits accrue to local communities through maintenance and enhancement of the existing stock of public housing?
• What financial resources are necessary to maintain public housing’s current
value, and can the private market realistically provide those resources? As part of this analysis we:
• Provide quantitative estimates of the current economic value of public housing programs to public housing residents;
• Examine the potential impact of public housing on the local labor supply;
• Estimate the impact of public housing on local economic activity, employment,
and earnings; and
• Examine the economic value of the current stock of public housing infrastructure and evaluate the need for government subsidy.
This study examines these issues using data from 10 separate markets. These markets differ in scale, economic health, and geographic location. In addition to considering differences in conditions across cities, we have examined, to a lesser extent, differing market conditions within cities. The local context captures complexities in the economic conditions of the different markets and may, in turn, affect the benefits of public housing.

Assessing the Economic Benefits of Public Housing
8
The extent of both housing affordability and economic opportunity varies widely across cities and even within cities. The 10 markets were selected based on geographic and market diversity, as well as the willingness of local PHAs to spend the time and effort to collect the data and share it with the research team. It is worth noting that Boston and New Bedford are geographically close, but also represent very different scales of operations, providing us with a comparison of public housing benefits in both large and small markets. The 10 cities of analysis are displayed on the map in Figure 1. Figure 1: Cities of Analysis
Source: Econsult Corporation (2006) While this sample of markets is not statistically representative of all public housing markets, the aggregate results do provide a useful frame of reference from which to draw inferences about public housing nationally. Examining these cities allows us to capture markets with diverse and vibrant economies as well as markets that offer fewer opportunities for their residents. We consider differences in market conditions which could influence the size and nature of the estimated benefits of public housing within each of these cities. Section 2.1 quantifies the effective rental subsidy implicit in public housing. We consider the impact of this subsidy on the disposable income of residents.4
4 Disposable income—an individual's total income after taxes, plus any transfer payments (grants) received from the government—is not to be confused with discretionary income—income that remains after paying for necessities such as food and shelter.

Assessing the Economic Benefits of Public Housing
9
Section 2.2 investigates the impact of public housing on the labor supply in low-wage industry sectors. Section 2.3 evaluates the regional economic impacts attributable to direct public housing investment and expenditures. Through the use of regional input-output models, we quantify the indirect and induced economic contributions to the local economy stemming from PHA spending—such as payroll, maintenance budget, and capital expenditures. Section 3 addresses the cost of replacing public housing stock as well as the ability of the private market to develop and maintain similar affordable housing. Section 4 discusses our findings and considers the costs of maintaining current public housing assets.
Assessing the Economic Benefits of Public Housing
10
2.0 ECONOMIC BENEFITS OF PUBLIC HOUSING Because rents are priced below the prevailing market rents in the area, public housing effectively increases residents’ net disposable incomes. At the same time, the construction, maintenance, and upgrading of the affordable housing stock generate spillover benefits for the regional economy. This section addresses and quantifies these economic benefits. 2.1 RENTAL SUBSIDIES – IMPACTS ON HOUSEHOLDS The rents paid by public housing residents are limited to 30 percent of income; therefore, public housing rents are significantly lower than prevailing market rents. The difference between market rents and public housing rents can be viewed as the effective subsidy to the residents. Comparing the level of the subsidy to the reported income of public housing residents quantifies the magnitude of that impact, since subsidized housing helps residents redirect their spending toward other basic necessities. 2.1.1 METHODOLOGY AND DATA SOURCES In this study, we focus on rents associated with two-bedroom rental units as a proxy for all rents, comparing market rents in each city with median rents paid by public housing households (using data obtained from each participating PHA). Recognizing that public housing residents necessarily would be searching for lower-cost units in the marketplace, we focus on both the Fair Market Rents (FMRs) and the bottom quartile rents in each of the sampled markets. FMRs are established by HUD for every housing market in the country. They are set at the 40th percentile of all rents in a market and establish the ceiling rents for Section 8 vouchers. We used multiple sources to create an accurate estimate of market rents. We used the American Housing Survey as a starting point since the AHS has the largest sample size for market rents. Since AHS information tends to lag behind current market trends, we used information from other real estate appraisers as well as HUD-set FMRs to update the AHS data and develop the most realistic market rent estimate for each city.5 To determine the 25th percentile rents in each of these markets, we used rental data from
5 For example, we used information from ApartmentRatings.com wherever possible. For Boston, Miami, New Bedford, and Oakland, we obtained data on all of the multi-family properties currently for sale and their current asking rents for two-bedroom units. Miami had 42 buildings containing 807 two-bedroom apartments, New Bedford had 87 buildings with 253 units, and Oakland had 43 properties with 249 units. Boston had the smallest number of units—only 97 in an unknown number of buildings—and therefore generated the least reliable figures. The Boston data, as well as that for Charlotte, Dallas, Miami, Oakland, San Diego, and Seattle, have been adjusted using figures from Marcus & Millichap, a nationwide real estate investment brokerage firm.

Assessing the Economic Benefits of Public Housing
11
the 2000 U.S. Census and assumed that the ratio between the 25th percentile rent and the average market rent has remained constant since 2000. In calculating housing affordability, we use the industry-accepted standard that devoting more than 30 percent of income toward housing constitutes an undue rent burden. HUD uses this standard when calculating a household’s payment for both public housing and the Section 8 Housing Choice Voucher Program. Eight of the 10 participating PHAs provided information on the total household income and the total wage-generated income for each of their residents.6 2.1.2 FINDINGS Monthly Fair Market Rents for two-bedroom apartments range from a low of $681 in Akron to a high of $1,342 in Oakland. The 25th percentile rents show similar variation, from $422 in Kansas City to $1,214 in Boston. A household in Kansas City would therefore need an annual income of $27,640 to live in an FMR unit and $16,880 to live in a unit renting at the 25th percentile. In Boston, the comparable figures would be $50,640 and $48,560. In many cities, even households with average incomes are unable to afford the FMR. For example, in Boston the median household income in 2000 was $39,629, well below the amount needed to afford housing at the FMR. Public housing residents face an even greater obstacle in finding affordable housing in many markets. The average annual income for all public housing residents in the sampled cities is only $10,357. For public housing households that include a wage earner, the average annual income is only slightly higher - $14,938.7 In none of the sample cities can a typical public housing household—with or without a wage earner—afford the 25th percentile rent, let alone the fair market rent, without subsidy. Figures 2 and 3 show the rent burden faced by public housing residents in the ten study cities. Figure 2 shows the FMR and the 25th percentile rent as they relate to the rent that the average public housing household in each city can afford. For example, in Charlotte the 25th percentile rent is three times greater than the amount that the average public housing household in that city can afford. Figure 3 shows the percentage of income that the average public housing household would have to pay in order to rent a unit at the 25th percentile. For example, in Akron, the average public household would have to spend nearly 90 percent of its income to rent an apartment at the 25th percentile.
6 The Charlotte and Kansas City PHAs did not have the information in an accessible format and therefore were excluded from the affordability analysis. 7 Nationally, approximately 49 percent of non-elderly, non-disabled households have at least one wage earner according to HUD’s Multifamily Tenant Characteristics System.

Assessing the Economic Benefits of Public Housing
12
Figure 2: Selected Market Rents Compared to Rent Affordable to Average PHA Household
Akron
Boston
Charlotte
Dallas
Kansa
s City
Miami
New B
edford
Oaklan
d
San D
iego
Seattle
Fair Market Rent (40th Percentile) 25th Percentile Affordable Rent
5 x Affordable Rent
4 x Affordable Rent
3 x Affordable Rent
2 x Affordable Rent
Affordable Rent(according tofederal standard)
Figure 3: 25th Percentile Market Rents as a Percent of Average PHA Household Income
0%
20%
40%
60%
80%
100%
120%
140%
160%
Akron
Boston
Charlotte
Dallas
Kansa
s City
Miami
New B
edford
Oaklan
d
San D
iego
Seattle
Federal affordability standard
Data Sources: Rent: Econsult Corporation estimates; Resident Wages: Participating PHAs

Assessing the Economic Benefits of Public Housing
13
In effect, households living in 2-bedroom public housing units in the sampled cities receive an average $497 monthly housing subsidy relative to the 25th percentile rent. The result is that public housing households in these cities effectively save an average of $5,964 in housing costs each year (57 percent of their annual incomes), monies that can be used for other basic necessities. Because the market rents vary widely across the sampled cities, the effective subsidy amounts show considerable variation (see Table 1).8 The effective subsidy in a high-cost market such as Boston, for example, is over four times higher than that for New Bedford, a low-cost market fewer than 60 miles to the south. Extrapolating across all 1.2 million public housing households, the total value of the effective housing subsidy is nearly $7.2 billion annually.9 Table 1: Estimated Monthly Housing Subsidies for PHA 2 Bedroom Households
City Median Public Housing Rent
Fair Market Rent
25th Percentile
Market Rent
Required Monthly Subsidy for 25th Percentile Unit
Akron $128 $681 $510 $382Boston $236 $1,266 $1,214 $977Charlotte $158 $719 $533 $375Dallas $157 $868 $691 $533Kansas City $127 $691 $422 $295Miami $197 $929 $766 $569New Bedford $292 $677 $513 $221Oakland $265 $1,342 $882 $617San Diego $341 $1,183 $825 $484Seattle $168 $834 $689 $521Average $207 $919 $705 $497
Sources: Market Rent: Econsult estimates; Public Housing Rents: Participating PHAs 2.1.3 SUMMARY Given their low incomes (an average of $10,357 for all PHA households in the selected cities, and $14,938 for households with at least one wage earner), PHA households cannot afford apartments renting at the 25th percentile level, much less Fair Market Rent. The rent burden is especially severe in high-cost markets such as Boston. The estimated annual value of the effective public housing subsidy (the difference between 30 percent of the PHA household’s income and the 25th percentile rent in the area) is nearly $6,000 per PHA household in the sampled cities and about $7.2 billion nationally. Based on our sampled markets, the subsidy effectively increases the PHA households’ disposable income by 57 percent, helping them better afford food and other necessities. 8 We have also examined the level of public housing rents and household incomes based on the reported sizes of the households. The findings are similar to those presented here. 9 Given that the sampled cities over-represent the country’s higher cost markets, this estimate is likely somewhat higher than the actual level of the total subsidy.

Assessing the Economic Benefits of Public Housing
14
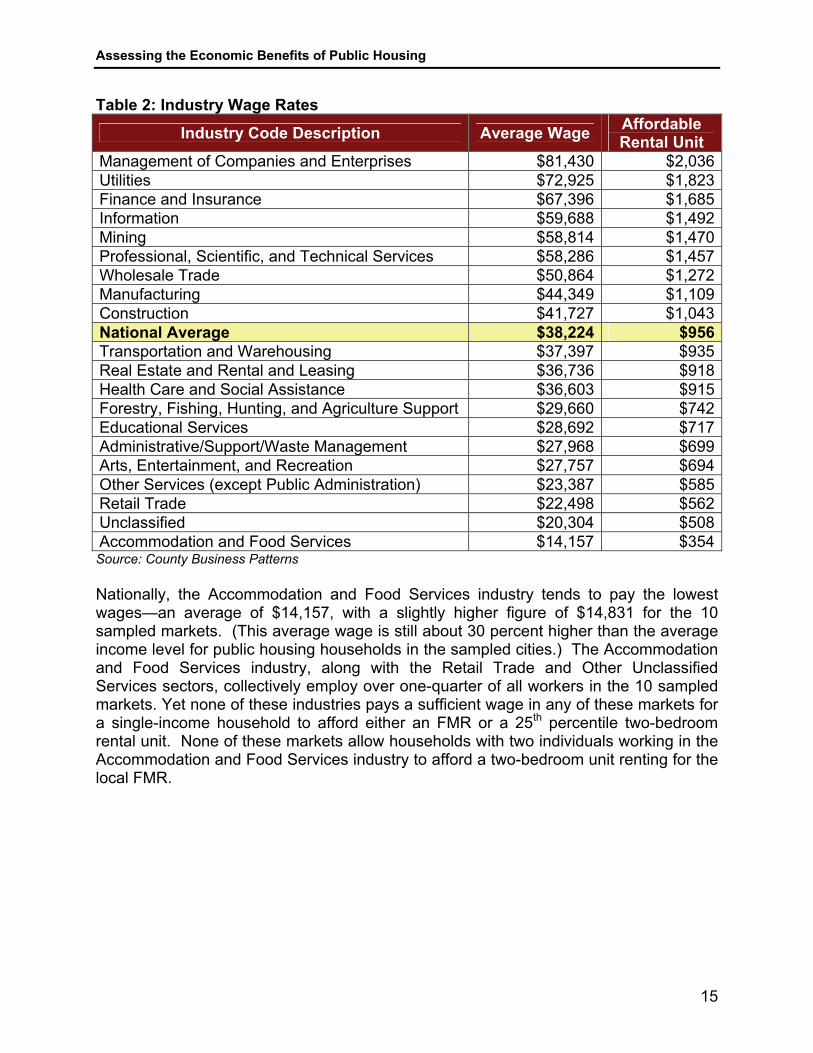
2.2 RENTAL SUBSIDIES – IMPACT ON EMPLOYERS A number of industries, particularly service-related industries such as retail, food processing, and tourism, provide compensation levels below the threshold required to live in market rate housing. Public housing allows workers in these industries to live in high-cost areas while essentially providing a modest indirect subsidy to low-wage industries by reducing the housing costs of potential workers. 2.2.1 METHODOLOGY AND DATA SOURCES The analysis of public housing’s potential labor market implications is based on a comparison of wages in selected low-wage industries as well as an analysis of rents in the 10 cities in the sample. We use industry information and County Business Patterns for industry employment and wage data. 2.2.2 FINDINGS As evidenced by the discussion in section 2.1.2, Fair Market Rents and 25th percentile rents in the 10 sampled cities lie beyond what public housing residents can afford. These rents also prove burdensome for other lower-income households. In Charlotte, one of the lower cost markets in the sample, a household needs to make $28,760 per year to afford a two-bedroom apartment leasing for the fair market rent. Yet 24 percent of Charlotte’s workforce is employed in industries where the average annual wage is less than $28,000: Retail Trade, Accommodation and Food Services, and Other Unclassified services. A dual income household working in Accommodation and Food Services—an industry employing more than 57,000 people in the Charlotte area—cannot afford a fair market rate apartment. Similar discrepancies affect virtually every market across the country. Table 2 provides the national average wage for 20 major industries along with the monthly rent that such wages can afford.
Assessing the Economic Benefits of Public Housing
15
Table 2: Industry Wage Rates
Industry Code Description Average Wage Affordable Rental Unit
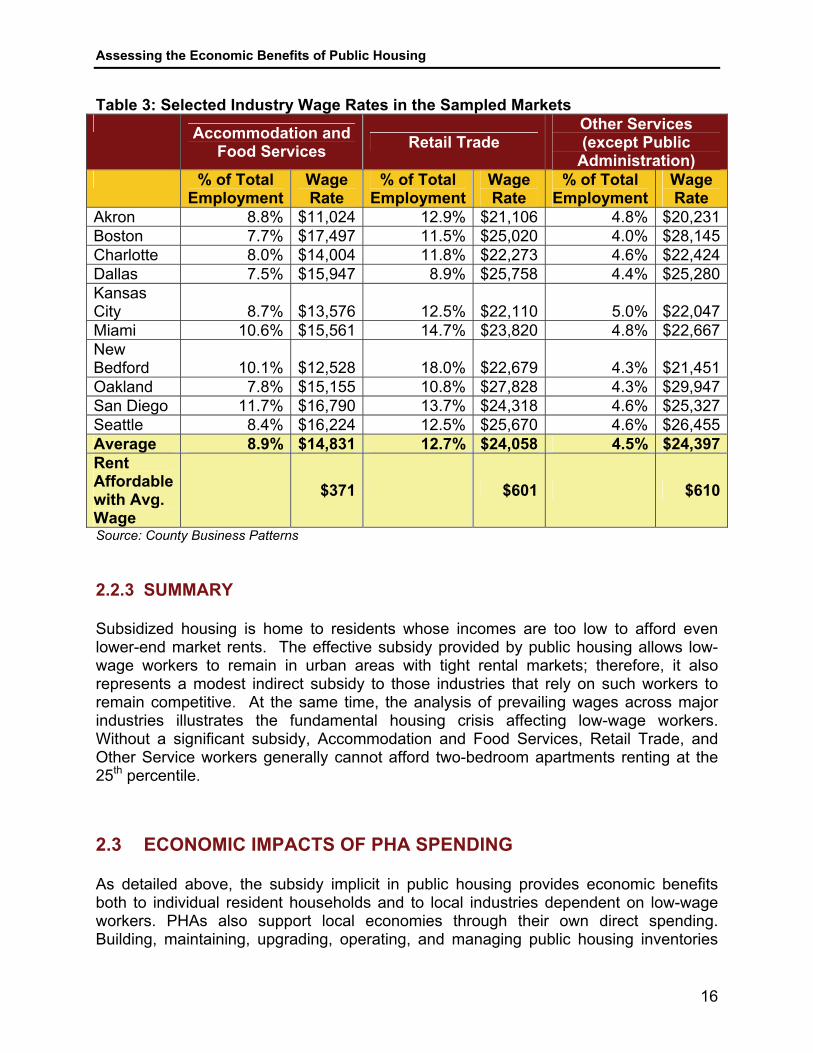
Management of Companies and Enterprises $81,430 $2,036Utilities $72,925 $1,823Finance and Insurance $67,396 $1,685Information $59,688 $1,492Mining $58,814 $1,470Professional, Scientific, and Technical Services $58,286 $1,457Wholesale Trade $50,864 $1,272Manufacturing $44,349 $1,109Construction $41,727 $1,043National Average $38,224 $956Transportation and Warehousing $37,397 $935Real Estate and Rental and Leasing $36,736 $918Health Care and Social Assistance $36,603 $915Forestry, Fishing, Hunting, and Agriculture Support $29,660 $742Educational Services $28,692 $717Administrative/Support/Waste Management $27,968 $699Arts, Entertainment, and Recreation $27,757 $694Other Services (except Public Administration) $23,387 $585Retail Trade $22,498 $562Unclassified $20,304 $508Accommodation and Food Services $14,157 $354Source: County Business Patterns Nationally, the Accommodation and Food Services industry tends to pay the lowest wages—an average of $14,157, with a slightly higher figure of $14,831 for the 10 sampled markets. (This average wage is still about 30 percent higher than the average income level for public housing households in the sampled cities.) The Accommodation and Food Services industry, along with the Retail Trade and Other Unclassified Services sectors, collectively employ over one-quarter of all workers in the 10 sampled markets. Yet none of these industries pays a sufficient wage in any of these markets for a single-income household to afford either an FMR or a 25th percentile two-bedroom rental unit. None of these markets allow households with two individuals working in the Accommodation and Food Services industry to afford a two-bedroom unit renting for the local FMR.
Assessing the Economic Benefits of Public Housing
16
Table 3: Selected Industry Wage Rates in the Sampled Markets Accommodation and
Food Services Retail Trade Other Services (except Public
Administration) % of Total
Employment Wage Rate
% of Total Employment
Wage Rate
% of Total Employment
Wage Rate
Akron 8.8% $11,024 12.9% $21,106 4.8% $20,231Boston 7.7% $17,497 11.5% $25,020 4.0% $28,145Charlotte 8.0% $14,004 11.8% $22,273 4.6% $22,424Dallas 7.5% $15,947 8.9% $25,758 4.4% $25,280Kansas City 8.7% $13,576 12.5% $22,110 5.0% $22,047Miami 10.6% $15,561 14.7% $23,820 4.8% $22,667New Bedford 10.1% $12,528 18.0% $22,679 4.3% $21,451Oakland 7.8% $15,155 10.8% $27,828 4.3% $29,947San Diego 11.7% $16,790 13.7% $24,318 4.6% $25,327Seattle 8.4% $16,224 12.5% $25,670 4.6% $26,455Average 8.9% $14,831 12.7% $24,058 4.5% $24,397Rent Affordable with Avg. Wage
$371 $601 $610
Source: County Business Patterns 2.2.3 SUMMARY Subsidized housing is home to residents whose incomes are too low to afford even lower-end market rents. The effective subsidy provided by public housing allows low-wage workers to remain in urban areas with tight rental markets; therefore, it also represents a modest indirect subsidy to those industries that rely on such workers to remain competitive. At the same time, the analysis of prevailing wages across major industries illustrates the fundamental housing crisis affecting low-wage workers. Without a significant subsidy, Accommodation and Food Services, Retail Trade, and Other Service workers generally cannot afford two-bedroom apartments renting at the 25th percentile. 2.3 ECONOMIC IMPACTS OF PHA SPENDING As detailed above, the subsidy implicit in public housing provides economic benefits both to individual resident households and to local industries dependent on low-wage workers. PHAs also support local economies through their own direct spending. Building, maintaining, upgrading, operating, and managing public housing inventories

Assessing the Economic Benefits of Public Housing
17
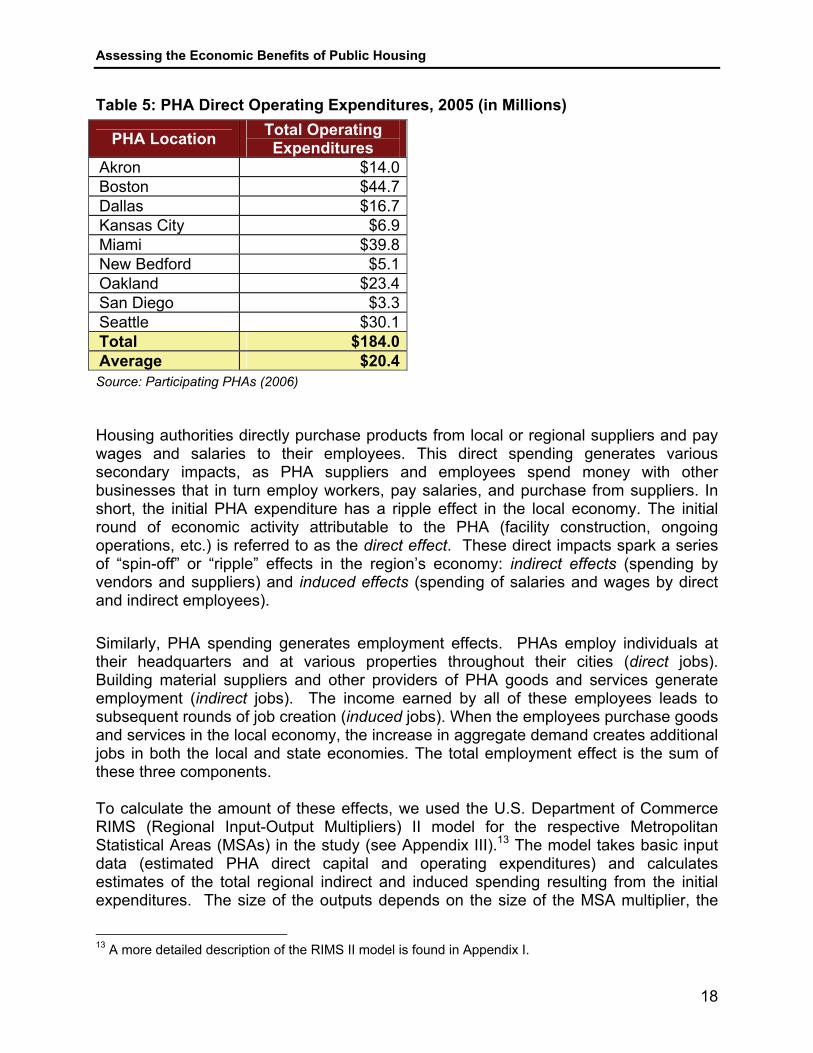
require significant spending on labor, materials, and other goods and services. These resources percolate through the local economy, generating total financial benefits well in excess of the initial expenditure amount.10 This section quantifies both the direct and indirect local economic impact of PHA spending. 2.3.1 METHODOLOGY AND DATA SOURCES PHA spending falls into two categories: operating expenditures (including property management and program administration) and capital and maintenance expenditures (monies used to refurbish and/or develop the public housing stock).11 The PHAs in the sample provided their total costs in each category for 2005, as well as projected total capital and maintenance expenditures from 2006 through 2010.12 Table 4 shows the actual capital and maintenance expenses for eight PHAs in 2005, along with projected expenses from 2006-2010. Table 5 breaks out direct operating expenditures (wages, legal/accounting fees, and insurance costs) for 2005 for nine of the PHAs. The costs in both categories vary considerably across the different authorities. Table 4: PHA Direct Capital & Maintenance Expenditures (in Millions)
PHA Location 2005 Projected 2006-2010
Annual Average 2005-2010
Akron $6.7 $69.5 $12.7 Boston $25.4 $118.4 $24.0 Dallas $18.8 $83.9 $17.1 Kansas City $2.1 $14.5 $2.8 Miami $17.9 $165.0 $30.5 Oakland $20.5 $121.5 $23.7 San Diego $3.3 $67.7 $11.8 Seattle $21.5 $52.0 $12.3 Total $116.2 $692.5 $134.9 Average $14.5 $86.6 $16.9
Source: Participating PHAs (2006)
10 Because public housing funding comes to the PHA from the federal government, PHA activities can be thought of as representing new expenditures in the local economy. These calculations are based on the assumption that, if not used toward public housing, federal tax revenue would otherwise be directed to an alternative purpose which would not primarily be directed toward the given region. 11 The HOPE VI program also provides significant grants to PHAs for capital improvements. Since these grants are provided erratically across cities, we have not included them in this analysis. The economic impact of public housing may therefore be substantially underestimated for cities that are recipients of HOPE VI funding. 12 Charlotte was unable to provide any of this data because of the way the information is tracked internally, and New Bedford could only provide operating cost data.
Assessing the Economic Benefits of Public Housing
18
Table 5: PHA Direct Operating Expenditures, 2005 (in Millions)
Source: Participating PHAs (2006) Housing authorities directly purchase products from local or regional suppliers and pay wages and salaries to their employees. This direct spending generates various secondary impacts, as PHA suppliers and employees spend money with other businesses that in turn employ workers, pay salaries, and purchase from suppliers. In short, the initial PHA expenditure has a ripple effect in the local economy. The initial round of economic activity attributable to the PHA (facility construction, ongoing operations, etc.) is referred to as the direct effect. These direct impacts spark a series of “spin-off” or “ripple” effects in the region’s economy: indirect effects (spending by vendors and suppliers) and induced effects (spending of salaries and wages by direct and indirect employees). Similarly, PHA spending generates employment effects. PHAs employ individuals at their headquarters and at various properties throughout their cities (direct jobs). Building material suppliers and other providers of PHA goods and services generate employment (indirect jobs). The income earned by all of these employees leads to subsequent rounds of job creation (induced jobs). When the employees purchase goods and services in the local economy, the increase in aggregate demand creates additional jobs in both the local and state economies. The total employment effect is the sum of these three components. To calculate the amount of these effects, we used the U.S. Department of Commerce RIMS (Regional Input-Output Multipliers) II model for the respective Metropolitan Statistical Areas (MSAs) in the study (see Appendix III).13 The model takes basic input data (estimated PHA direct capital and operating expenditures) and calculates estimates of the total regional indirect and induced spending resulting from the initial expenditures. The size of the outputs depends on the size of the MSA multiplier, the
13 A more detailed description of the RIMS II model is found in Appendix I.
PHA Location Total Operating Expenditures
Akron $14.0Boston $44.7Dallas $16.7Kansas City $6.9Miami $39.8New Bedford $5.1Oakland $23.4San Diego $3.3Seattle $30.1Total $184.0Average $20.4

Assessing the Economic Benefits of Public Housing
19
estimated total amount of economic activity resulting from one dollar of spending in a particular sector. (A multiplier of 2.34 implies that for every $1 in direct spending, the region benefits from an additional $1.34 in indirect and induced expenditures). The size of the multiplier varies by market, with more geographically concentrated areas generally having lower economic multipliers than more sprawling, rapidly growing regions. The RIMS II model also generates estimates of total employment resulting from the direct and indirect spending, based on aggregates of the labor components associated with the interaction between the initial source of spending and each associated/affected industry. 2.3.2 FINDINGS Table 7 shows the total economic impacts attributable to current average annual PHA capital and maintenance expenditures in eight of the sampled cities. The impacts vary by market, a result of differences in both the amount of initial spending and the size of the regional multiplier. The Housing Authority of Kansas City generates a total estimated economic impact in its region of $6.5 million annually, which supports 56 jobs. By comparison, the Miami-Dade Housing Agency triggers $65.2 million in regional spending annually, supporting a total of 536 jobs. Table 7: Estimated Regional Economic Impacts from PHA Annual Capital & Maintenance Expenditures (in Millions)
PHA Location
Annual Average PHA Capital & Maintenance
Expenditures, 2005-2010
Regional Multiplier
Indirect & Induced
Expenditures
Total Economic
Impact
Total Related
Jobs
Akron $12.7 1.81 $10.3 $23.0 120Boston $24.0 1.99 $23.6 $47.6 314Dallas $17.1 2.42 $24.3 $41.4 312Kansas City $2.8 2.34 $3.7 $6.5 56Miami $30.5 2.14 $34.7 $65.2 536Oakland $23.7 2.00 $23.7 $47.3 256San Diego $11.8 2.05 $12.4 $24.2 161Seattle $12.3 2.18 $14.5 $26.7 195Total $134.8 $147.1 $281.9 1,950Average $16.9 2.12 $18.4 $35.2 244
Source: Econsult Corporation (2006); Data from the Charlotte & New Bedford PHAs were unavailable *Results may not add due to rounding Table 8 (on the next page) shows the total economic impacts attributable to the sampled PHAs’ annual operating expenditures. Again, the extent of the impact varies

Assessing the Economic Benefits of Public Housing
20
by both the initial level of spending and the size of the regional multiplier.14 The San Diego Housing Commission’s operating expenditures generate an estimated $6.9 million of total spending in the region and support 186 jobs. By comparison, the Boston Housing Authority’s operating expenses generate an estimated total regional economic impact of $86.2 million, including 2,173 jobs. Table 8: Estimated Regional Economic Impacts from 2005 PHA Operating Expenditures (in Millions)
PHA Location
PHA Operating Expenditures,
2005 Regional Multiplier
Indirect & Induced
Expenditures
Total Economic
Impact
Total Related
Jobs Akron $14.0 1.66 $9.3 $23.3 788Boston $44.7 1.93 $41.6 $86.2 2,173Dallas $16.7 2.22 $20.3 $37.0 1,055Kansas City $6.9 2.11 $7.7 $14.6 502Miami $39.7 1.99 $39.4 $79.1 2,676New Bedford $5.1 1.44 $2.2 $7.3 196Oakland $23.4 1.89 $20.8 $44.2 1,181San Diego $3.4 2.04 $3.5 $6.9 186Seattle $30.1 2.08 $32.5 $62.7 1,930Total $183.9 $177.3 $361.3 10,686Average $20.4 1.93 $19.7 $40.1 1,187
Source: Econsult Corporation (2006); Data for the Charlotte PHA were unavailable *Results may not add due to rounding
2.3.3 SUMMARY On average in the sampled markets, every dollar of PHA spending on capital and maintenance projects generates $2.12 in total regional spending. Each dollar a PHA spends for operations generates a total of $1.93 worth of spending in its region. In the sampled markets, these multiplier effects result in over $643 million in total average annual economic activity resulting from public housing. This activity supports an average of over 12,600 jobs annually in the nine cities studied; the average PHA in our study sparks over $75 million in local spending and supports over 1,400 local jobs directly or indirectly. The figures consider only regional impacts; they do not capture the PHAs’ full economic impacts, as the goods and services they purchase may be produced outside of their regions.
14 The multipliers for operating expenditures differ from those for capital expenditures because the two types of spending occur in different sectors of the economy.

Assessing the Economic Benefits of Public Housing
21
Assuming $8.1 billion15 in total annual PHA direct capital and operating expenditures throughout the country (based on total appropriated funds plus rent receipts), the associated indirect and induced economic activity would equal an additional $8.2 billion per year (the estimated sum of various local/regional impacts).16
15 This figure is based on expenditures of the study PHAs, extrapolated to the national level. While actual appropriations and rent receipts are known for PHAs nationwide, these figures vary from year to year. The extrapolated figure of $8.1 billion closely matches the total of actual appropriations and rent receipts for 2006, which was $8.4 billion. 16 A key assumption underlying the region-specific calculations is that the PHA monies represent external federal funds: new dollars coming into the region. From a national perspective, the funds spent on housing programs must be collected through taxes. These taxes have a corresponding negative impact on overall expenditures, therefore reducing the net economic impact of the spending. (Whether the ultimate net outcome is positive or negative depends on whether such spending generates greater spillover benefits than other uses of the funds.) Thus the aggregate $8.2 billion estimate of indirect and induced economic activity attributable to PHAs must be viewed in terms of its individual regional components, not as national indirect and induced effects.

Assessing the Economic Benefits of Public Housing
22
3.0 THE ECONOMIC VALUE OF PUBLIC HOUSING STOCK In addition to the derived benefits considered in Section 2, public housing has value in and of itself as a real estate asset. While it is clear that the value of public housing is quite high, there is no clear estimate of the actual value of the existing stock. Unlike private developments, public housing properties do not have arms-length market transactions to provide direct measures of value; they cannot easily be compared to private market properties because of their government subsidy. Despite inherent difficulties, assessing the value of public housing would be undeniably informative. Value estimates can determine the level of capital investment necessary to maintain the physical housing stock as it ages. In addition, by comparing the value of the public housing asset to that of private market affordable housing, we can evaluate the ability of the private market to provide equivalent affordable housing. This section will therefore use several proxies to estimate the value of the public housing asset. 3.1 REPLACEMENT VALUE OF PUBLIC HOUSING One widely accepted method of assessing value is to determine replacement cost. Although the wholesale replacement of the current public housing stock is clearly impractical, such an analysis offers a way of understanding its underlying worth as a real estate asset. Overtime, replacement value reflects the level of investment necessary to maintain the housing asset in its current condition. All physical facilities, including public housing, depreciate as they age; the greater the replacement value of the asset, the more depreciation it will incur.17 In calculating replacement values, we consider both the costs of (re)building the housing units and the costs of acquiring the land on which those units will sit. 3.1.1 METHODOLOGY AND DATA SOURCES Estimating Construction Costs We use the R. S. Means construction cost data, the most respected unit price guide available to the construction industry, for our estimates. The Means data contain annually updated unit costs for over 20,000 building components, based upon the experience of thousands of contractors and suppliers. Means adjusts the data to reflect variations in construction costs for more than 900 regional U.S. markets.18
17 It is sometimes possible that economic value of assets can appreciate through time. The physical infrastructure will still depreciate but, if located in an increasingly desirable area, some of this depreciation may be offset by the increasing value of the location. Likewise, if assets are located in increasingly undesirable areas, their depreciation may be amplified. 18 The Means unit cost data presented are based on a specification of a 1-3 story multifamily building with a brick façade containing ten units of 700 square feet each. Although the Means data all focus on private sector properties and costs, an Abt Associates study prepared for HUD in 1998 suggested that the

Assessing the Economic Benefits of Public Housing
23
Estimating Land Costs There is no single authoritative source for data on the cost of land in urbanized areas. We therefore adapt a set of estimates developed by Federal Reserve economists Morris Davis and Michael Palumbo.19 The authors’ primary interests are in the value of land for single-family residential lots and how changes in land values affect the prices of single-family homes. However, they also estimate land share of total home value during the last 20 years for different markets across the country. We use their derived ratio of land-to-home-value for 2004 and apply it to the 2005 median value of existing homes (as reported by the National Association of Realtors) to estimate unit land costs in the sampled markets. We assume that 5 units of high-density affordable housing could be constructed on a typical single-family lot. 3.1.2 FINDINGS Based on the Means data, the average cost of building a new housing unit ranges from a low of $98,000 in Charlotte to a high of $148,661 in Oakland (see Figure 4). The average per unit cost for the 10 sampled cities is $125,081, about 3.4 percent higher than the average for the nation as a whole ($120,833).20 The variances across markets largely reflect the different costs of labor and supplies. For example, the average construction wage in Charlotte and Dallas is approximately $40,000 per year and the respective per unit construction costs are $98,000 and $103,000. Average construction wages in Boston and Oakland exceed $55,000, contributing to total per unit construction costs of over $140,000. Land costs also vary across regions, reflecting the demand for development and the availability of additional developable property. Akron, a comparatively weak real estate market with ample property to develop, has low land costs: 10 percent of total development costs. Conversely, San Diego is a densely developed, strong real estate market with relatively little additional developable property. As a result, its land costs comprise nearly 50 percent of total development costs. Figure 5 (on the next page) shows the total per unit development costs in the sampled cities, with the construction cost in red and the land acquisition cost in blue. The varying number of units in the sample cities likewise affects their aggregate replacement cost. San Diego, for example, has just over 1,300 units of public housing; at $130,500 per unit, the total replacement cost is slightly above $170 million. In
development costs of public housing were similar to those of the private market. This study is available at www.abtassoc.com/reports/ES-D19980856.pdf. 19 “The Price of Residential Land in Large U.S. Cities.” May 2006. Available at www.federalreserve.gov/PUBS/FEDS/2006/200625/200625pap.pdf 20 These averages would be slightly higher if they were weighted by the number of units in the various markets, but the relationship between construction costs and site acquisition costs would remain largely unchanged.

Assessing the Economic Benefits of Public Housing
24
contrast, replacement costs in Boston, which has more than 11,000 units of public housing, exceed $1.5 billion ($144,348 per unit). Figure 4: New Housing Construction Costs (Per Unit)
$0
$20
$40
$60
$80
$100
$120
$140
$160
Akron
Boston
Charlotte
Dallas
Kansa
s City
Miami
New B
edford
Oaklan
d
San D
iego
Seattle
National
Avg
Thou
sand
s
Source: R.S. Means Data
Figure 5: Per Unit Replacement Cost (Construction and Land)
$0
$50
$100
$150
$200
$250
$300
Akron
Boston
Charlotte
Dallas
Kansa
s City
Miami
New B
edford
Oaklan
d
San D
iego
Seattle
Thou
sand
s
Construction Land
Source: Land cost based on Davis & Palumbo, The Price of Residential Land in Large U.S. Cities.

Assessing the Economic Benefits of Public Housing
25
To extrapolate these construction costs to the national level, the Means national average per unit construction cost of $121,000 was used. For 1.2 million public housing units, total construction costs would approach $145 billion. Extrapolating per unit land acquisition costs to the national level presents a greater challenge. Although we sought to achieve a geographic distribution of PHAs for this study, six of the ten participating authorities are located in cities along either the east or west coast (see Figure 1 in section 1.4). Real estate values in these markets tend to be higher than elsewhere in the country due to natural restraints on development. To adjust for a possible bias, we obtained a listing of the geographic location of all public housing units from HUD (see Figure 6 below). We use Davis and Palumbo’s regional land cost estimates to determine per-state ratios of land costs to total development costs. We then calculate a national average by weighting the state averages by the proportion of total public housing units in each state. This approach led us to lower our national land acquisition cost estimate to 10.4 percent of total development costs instead of the 27 percent average for our 10 sampled markets. Including average land acquisition costs, the total cost of replacing the country’s existing public housing units with similar residential units would be approximately $162 billion. Figure 6: National Distribution of Public Housing Units
Source: HUD and Econsult Corporation (2006)
Assessing the Economic Benefits of Public Housing
26
3.2 THE INVESTMENT VALUE OF PUBLIC HOUSING IF MAINTAINED
AS AFFORDABLE HOUSING FOR LOW-INCOME HOUSEHOLDS A second way of estimating the value of the existing public housing stock is to consider what a private investor would pay to own and operate the properties. In this section, we assume that the private sector owner(s) would be required to maintain the units as affordable housing to low-income individuals. For the purposes of this section, we will utilize the federal affordability standard of the 40th percentile of all rents in the market.21 A discounted cash flow model, used regularly by property appraisers, examines the value of a given property to a potential private investor. The discounted cash flow model assesses a rental property’s net operating income (NOI): the amount of rental income generated less the costs of operation and maintenance. The appraiser calculates the stream of NOI expected to be generated over the property’s useful life (30 years represents an accepted standard), and then takes the net present value of that expected future stream as well as the value of the property at the end of its useful life. The net present value estimate discounts future revenues for inflation and for the opportunity costs of alternative investments (usually the prevailing interest rate) to determine what an investor would pay for that income stream, as a lump sum, now. We use a common shortcut in this discounted cash flow approach. It precludes the need to determine future cash inflows and/or the likely future value of a property, instead dividing the current net operating income by the market capitalization rate (the current rent-to-value ratio). These ratios are specific to location and property type, and they are determined by averaging the results of surveys sent to a range of different property owners in each particular market. Capitalization rates are a basic component of all income-based appraisals, as they implicitly account for expectations about the future appreciation of the market; markets with growing economies and strong real estate appreciation tend to have lower capitalization rates, and vice-versa. For any given rental stream, investors are willing to pay more in growing markets than weaker ones, as the denominator value is lower. For example, if annual rents generated in a particular building totaled $150,000 while annual expenses totaled $50,000, the building’s NOI would be $100,000 per year. If the capitalization rate was 8 percent, then the value of the building would be $1.25 million ($100,000/.08). Were the capitalization rate 10 percent, the building’s value would be only $1 million ($100,000/.1).
21 This standard represents the Fair Market Rent—a federal rent cap applied Section 8 properties—which we assume to be a reasonable benchmark for a federal affordability standard. This selection is reinforced considering that, if rented in the private market as affordable housing, these properties are likely to be rented as Section 8 properties.
Assessing the Economic Benefits of Public Housing
27
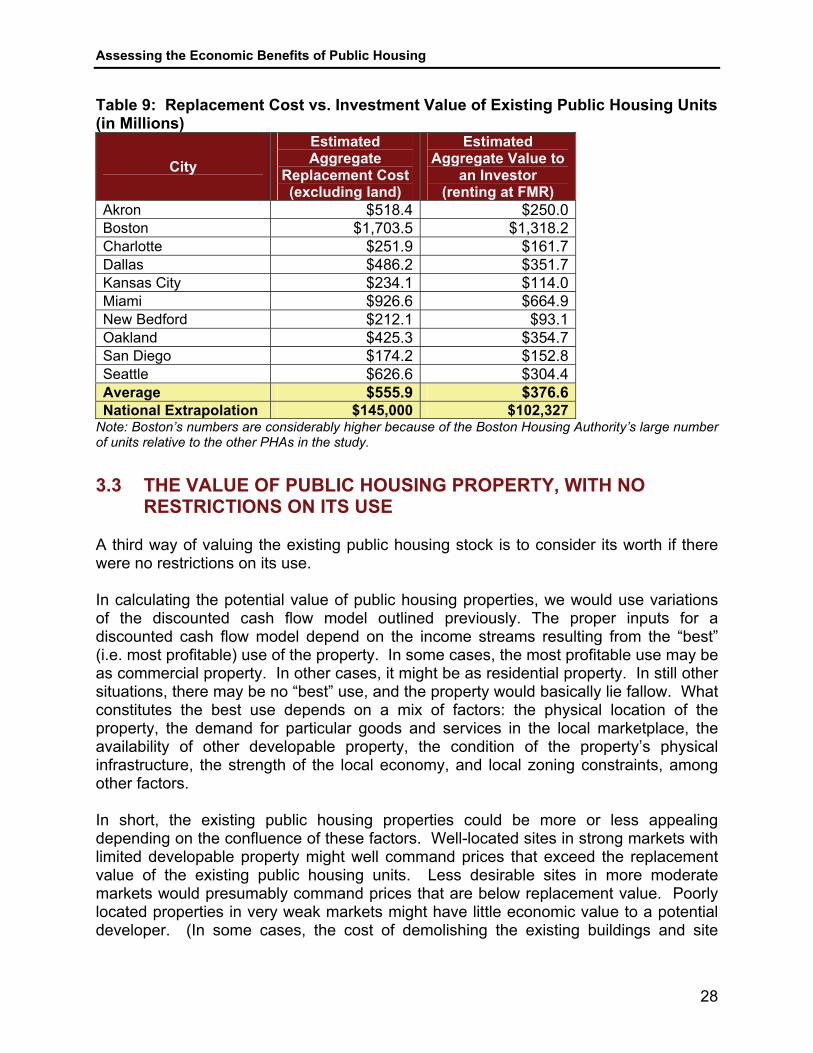
3.2.1 METHODOLOGY AND DATA SOURCES Estimating Operating Costs and Market Capitalization Rates In our discounted cash flow analysis of public housing values, we use region-specific capitalization rates for apartment buildings as well as regional estimates of operating costs as a proportion of gross rents. We use the federally set Fair Market Rents as the source of property income potential in the private marketplace (as in Section 2.1.1).22 We obtained data on multi-family property operating costs and capitalization rates from RealtyRates.com, the trade name and trademark of R.G. Watts & Co. (RGW). RGW produces an annual Market Survey by polling commercial appraisers, lenders, investors, and brokers with representation in all 312 MSAs and a majority of the non-metro counties in the country. The Market Survey tracks sales, income, occupancy, and expense data, as well as operating rates and ratios, for 12 regional areas encompassing the 48 continental states and the District of Columbia, as well as 3 or 4 selected metro market areas within each region. For our cities, the ratio of operating costs to gross rent ranges from a low of 32.3 percent in San Diego to a high of 42.7 percent in Seattle. Capitalization rates range from a low of 8.4 percent in San Diego to a high of 9.1 percent in Seattle. 3.2.2 FINDINGS Using the discounted cash flow model, we estimate that the public housing properties in the 10 sampled markets would be worth $85,273 per unit to an investor if rented at the Fair Market Rent. Aggregated to a national level, the investment value would be roughly $102.3 billion. Table 9 offers a comparison of the replacement costs and discounted cash flow values for each of the sampled markets. Regardless of what rent level is used, there is a significant gap between the replacement cost of the existing public housing units and the value of those units to a private market investor for use as affordable housing. The difference illustrates a fundamental economic reality of housing made affordable to low- or very low-income people: without substantial subsidy, such developments do not make economic sense to a private developer/investor. The costs of acquiring land and building residential units usually far exceed the investment value of the resulting affordable housing property.
22 Because rents paid by public housing residents are artificially restrained, using these rents would have resulted in a negative NOI and thus an overall negative value of the housing assets, which is clearly not the case.
Assessing the Economic Benefits of Public Housing
28
Table 9: Replacement Cost vs. Investment Value of Existing Public Housing Units (in Millions)
City Estimated Aggregate
Replacement Cost (excluding land)
Estimated Aggregate Value to
an Investor (renting at FMR)
Akron $518.4 $250.0Boston $1,703.5 $1,318.2Charlotte $251.9 $161.7Dallas $486.2 $351.7Kansas City $234.1 $114.0Miami $926.6 $664.9New Bedford $212.1 $93.1Oakland $425.3 $354.7San Diego $174.2 $152.8Seattle $626.6 $304.4Average $555.9 $376.6National Extrapolation $145,000 $102,327
Note: Boston’s numbers are considerably higher because of the Boston Housing Authority’s large number of units relative to the other PHAs in the study. 3.3 THE VALUE OF PUBLIC HOUSING PROPERTY, WITH NO
RESTRICTIONS ON ITS USE A third way of valuing the existing public housing stock is to consider its worth if there were no restrictions on its use. In calculating the potential value of public housing properties, we would use variations of the discounted cash flow model outlined previously. The proper inputs for a discounted cash flow model depend on the income streams resulting from the “best” (i.e. most profitable) use of the property. In some cases, the most profitable use may be as commercial property. In other cases, it might be as residential property. In still other situations, there may be no “best” use, and the property would basically lie fallow. What constitutes the best use depends on a mix of factors: the physical location of the property, the demand for particular goods and services in the local marketplace, the availability of other developable property, the condition of the property’s physical infrastructure, the strength of the local economy, and local zoning constraints, among other factors. In short, the existing public housing properties could be more or less appealing depending on the confluence of these factors. Well-located sites in strong markets with limited developable property might well command prices that exceed the replacement value of the existing public housing units. Less desirable sites in more moderate markets would presumably command prices that are below replacement value. Poorly located properties in very weak markets might have little economic value to a potential developer. (In some cases, the cost of demolishing the existing buildings and site

Assessing the Economic Benefits of Public Housing
29
revitalization might effectively give the properties negative value.) Only through a case-by-case analysis—one that is well beyond the scope of this study—could one determine the potential development value of public housing property. 3.4 SUMMARY As we have discussed, the public housing properties’ potential value is likely to vary widely depending on factors such as property location, local market strength and demand, and the quality of the local infrastructure. In some cases, the property may have greater economic value as a commercial center than as public housing, if the net present value of the future development’s net operating income exceeds the replacement cost of the existing public housing units. Likewise, property has the potential to lose economic value development value due to these same factors. In any case of redevelopment, conversion of a public housing property to alternative use creates a need to find (and subsidize) similarly affordable housing for the low-income households displaced in the process. The total cost of replacing the nation’s existing public housing stock would approach $162 billion, assuming per unit construction costs of $120,833 and per unit land costs of $14,225. (Or, assuming that no land would need to be acquired, total replacement costs would be $145 billion.) In either case, the replacement cost far exceeds the properties’ value to a hypothetical private investor who would maintain the units as affordable housing (using the discounted cash flow method of appraising the market worth of a multi-family property). The difference narrows depending on the amount of rent that could be charged residents in affordable housing properties; however, even using HUD-established Fair Market Rents, the investment value remains well below the replacement cost. This large discrepancy illustrates the size of the subsidy necessary for the private market to provide (or invest in) affordable housing. Simply put, in the absence of a subsidy, the gap between production cost and investment value makes it economically unfeasible for developers to create and maintain housing affordable to low-income households.
Assessing the Economic Benefits of Public Housing
30
4.0 DISCUSSION AND CONCLUSIONS 4.1 IMPACTS ON CAPITAL NEEDS Recognizing that existing public housing has significant economic value, we are left to consider the relative cost of maintaining and improving these units. The PHAs participating in this study have a total of 44,222 public housing units. They collectively spent $116 million on capital improvements in 2005 and anticipate spending an additional $700 million from 2006 to 2010. Nationwide, PHAs receive approximately $2.5 billion per year in capital funding. While the current use value of the nation’s public housing stock is estimated to be $102 billion, its replacement value approaches $145 billion (which factors in the costs of labor, building materials, etc. but excludes land costs). Over the useful life of the stock, PHAs need to make regular property improvements to maintain the stock’s value; over time, the cost of improvements equals the cost of replacement. Assuming that the public housing units have a useful life of 30 years, the amount of annual capital improvements required to offset depreciation is $4.8 billion. This is nearly double the amount of the current capital appropriations. Finally, systematic shortfalls of capital expenditures relative to depreciation have left many units lacking capital improvements over time. Because of this buildup of capital needs, funding in excess of $4.8 billion would likely be required to address a backlog of repairs and improvements. 4.2 SUMMARY AND CONCLUSION An average public housing household in the sampled cities has less than $10,400 in annual income. Public housing households in the study with at least one wage earner average less than $15,000 in annual income. Such incomes are insufficient to meet even the bottom-quartile two-bedroom apartment rents in these markets. The subsidy implicit in public housing rents effectively provides nearly $6,000 in additional annual disposable income to each of the more than 1.2 million public housing households, a total of nearly $7.2 billion when aggregated to the national level. In essence, public housing provides homes for low-income households who cannot afford market rents, and its effective subsidy enables these households to devote more of their limited incomes to other basic needs such as food and clothing. This effective subsidy also increases the potential labor force for low-wage industries. Public housing helps residents obtain housing in the locales where demand for workers is largest, thereby assisting both residents and industry. The effective housing subsidy makes it more economically feasible for residents to work in some of the country’s most rapidly growing—and lowest paying—industries, such as Retail Trade and Accommodation and Food Services, and enables them to devote more of their limited incomes to needs other than shelter.

Assessing the Economic Benefits of Public Housing
31
Local markets benefit from the significant spillover effects of public housing. Direct PHA spending on employee salaries, building materials and supplies, and various labor and services ripples through local economies, helping to support businesses and their employees. When aggregated nationally, spending by PHAs generates about $8.2 billion in indirect and induced economic activity in their respective regional markets. Aside from these benefits, we find that it is economically unfeasible for the private market to provide and maintain quality affordable housing for low-income people. The replacement value of the existing public housing units would be $145 billion excluding land cost. Yet to a private investor, the discounted cash flow valuation of the housing is significantly less: $102 billion for units renting at the relevant FMR. Because of this gap, significant subsidy is required to make affordable housing economically viable for the private sector. Our study represents the first systematic look at the quantifiable benefits of public housing. A cost-benefit analysis of public housing redevelopment would be a useful next step.

Assessing the Economic Benefits of Public Housing
32
APPENDIX I: RIMS MODELS Economic Impact Analysis The economic impact estimates presented in this report were derived from the regional Input-Output (I-O) model developed and maintained by the U. S. Department of Commerce, Bureau of Economic Analysis (BEA). This model, the Regional Input-Output Modeling System (RIMS II), is widely used to estimate the economic impacts of regional projects or programs. The results generated from the RIMS II model are widely recognized as plausible, and defensible, in cases where the input data to the model are accurate and based on reasonable assumptions. This section describes the basic concepts that underlie RIMS II. An I-O model provides a compact means of summarizing interindustry relationships within regions. The model itself is essentially an accounting framework, expressed as a matrix or array. For each industry in the region, the model shows the distribution of inputs purchased and outputs sold to all other regional industries. The RIMS II model is based on the BEA National I-O model, which shows the input and output structure for nearly 500 industries, and the BEA regional economic accounts, which are used to adjust the information in the national model to reflect a given region’s industrial structure and interindustry trading patterns.23 The data that drive the I-O model are the planned expenditures associated with the project or program being studied. In the jargon of I-O models, those expenses make up the “direct expenditures” that form one part of the program’s total economic impact on the region. Assuming that the planned project is a new store, the direct expenditures are the sum of all spending needed to construct, equip and operate that facility. Some of that spending will be used to purchase goods and services from other businesses in the region, causing those firms to increase production. In turn, the firms supplying the new store will need to increase purchases from their suppliers, to meet their new orders. The sum of all of this interindustry spending are the “indirect expenditures” associated with the new store. All of the economic activity resulting from the new store, whether direct or indirect, will require workers who must be paid. Some of their earnings will be spent at businesses within the region on various goods and services, creating another round of economic activity like that described above. These expenditures equal the “induced expenditures” associated with the new store. The sum of the direct, indirect and induced expenses represents the total economic impact of the new store on the region. In addition to measuring that impact in dollars as
23 “Regional Multipliers: A User Handbook for the Regional Input-Output Modeling System (RIMS II).” United States Department of Commerce, Bureau of Economic Analysis. Third Edition, March, 1997

Assessing the Economic Benefits of Public Housing
33
output or expenditures, the RIMS II model produces estimates of the proportion of that spending paid to regional households as wages and salaries. Finally, the RIMS II model generates estimates, by industry, of the number of full- and part-time jobs related to the new store. Both the earnings and employment estimates are useful alternative measures of the regional economic impact of the new project. The overall “success” of the economic impact analysis depends in large part on the initial design of the analysis. For example, if the project involves both construction and operation phases, it is important to separate the total expenditures between the two, and run the RIMS II model for each set of expenditures. The phases occur at different points in time, and have different impacts on the regional economy. Hence, the accuracy of the results depends on recognizing those differences, and treating them appropriately.

Assessing the Economic Benefits of Public Housing
34
APPENDIX II: HOUSING AUTHORITIES INCLUDED IN STUDY The following housing authorities were included in this study. Akron Metropolitan Housing Authority Boston Housing Authority Charlotte Housing Authority Dallas Housing Authority Housing Authority of Kansas City Miami-Dade Housing Agency New Bedford Housing Authority Oakland Housing Authority San Diego Housing Commission Seattle Housing Authority All analyses in this report are restricted to federal public housing units. The housing authorities in the study administer other housing programs as well. The impacts of these other programs are not considered here.

Assessing the Economic Benefits of Public Housing
35
APPENDIX III: Metropolitan Statistical Areas
PHA Markets & Corresponding Metropolitan Statistical Areas
Market Metropolitan Statistical Area (MSA) Akron Akron, OH Boston Boston-Cambridge-Quincy, MA-NH
Charlotte Charlotte-Gastonia-Concord, NC-SC Dallas Dallas-Fort Worth-Arlington, TX
Kansas City Kansas City, MO-KS Miami Miami-Fort Lauderdale-Miami Beach, FL
New Bedford New Bedford, MA - Bristol, MA Oakland Oakland-Fremont-Hayward, CA (PMSA)
San Diego San Diego-Carlsbad-San Marcos, CA Seattle Seattle-Tacoma-Bellevue, WA
Source: United States Department of Commerce, Bureau of Economic Analysis