assessing the cross-curricular skills -...
TRANSCRIPT

Expansion of the Levels of Progression in Using Mathematics across the Curriculum:Key Stage 3 (Levels 1–7) (Non-statutory guidance)
Assessing the Cross-Curricular Skills
1
ContentsExpansion of the Levels of Progression
Levels 1-7 2
Glossary of Terms and Illustrations 27
Purpose of this Document
The following guidance is intended to support teachers when:
planning and designing assessment opportunities;
observing pupil performance; and
making summative judgements.
The guidance gives more detailed support to explain aspects
of performance at each level within each requirement for
Using Mathematics. It also includes examples of how pupils
can use aspects of the ‘Knowledge and Understanding’ at each
level to demonstrate their Using Mathematics skills.
These examples are only illustrations and are not designed to
be a prescriptive or exhaustive list.
The guidance does not specify performance at each level in
the requirements ‘develop financial capability’ and ‘use ICT to
solve problems and/or present their work’.
Progression in financial capability is demonstrated within the
‘Knowledge and Understanding’. It can be found mainly within
the ‘Number and Algebra’ strand.
As pupils progress through the levels, the contexts within
which they demonstrate their financial capability should
increase in complexity and require a higher level of
independence and problem-solving ability.
Opportunities exist for pupils to integrate and demonstrate
their Using ICT skills within mathematical situations.

2
Across the curriculum, at a level appropriate to their ability, pupils should be enabled to:
Requirements for Using Mathematics Level 1
In structured activities, in familiar and accessible contexts, pupils can:
mathematics to use in a Pupils can, with teacher direction, use mathematical materials and equipment provided, for example:– make their own repeated pattern using sets of shapes or beads;– sort real objects for one criterion, for example colour, shape or size; and– use balance scales to find which object is heavier.
Pupils can:– match numerals to sets up to 10, including 0 to the empty set; and– record their work using numerals or words to 10.
Pupils can organise practical work, for example:– arrange objects into organised groupings; and– match objects to find which group has more/fewer.
In response to questions, pupils can talk about how an activity might be approached, for example:– suggest that they use a balance scale to compare the weights of two objects;– talk about different ways they could sort a group of objects, for example by colour, size
and texture; and– suggest how to find out if there is enough cutlery for four people.
Pupils can use teacher prompts in practical and mental mathematics activities, for example:– to count on/count back from different starting points, for example count forwards/
backwards from 7;– to order numbers within 10, for example know that 6 comes between 5 and 7; and– add and subtract within 10, for example count on when adding 5 and 4
Through discussion with the teacher, pupils are aware of and can talk about patterns; pupils are prompted to say what comes next and why, for example:– talk about patterns in their environment, for example bricks, leaves and floor tiles;– copy/continue/create a pattern, for example put out a blue cube, red cube, blue cube
and continue the pattern; and– explore patterns in number, for example set out objects in twos.
Pupils can collect identified information. They can interpret the information in response to prompts, for example:– work as a class to collect information, for example colour of hair, favourite food; and– answer questions about information, for example “Do more children take school
dinners than packed lunch?”
Pupils can represent identified information in practical activities. They represent their work in 3-D form (blocks, objects) or 2-D form (using stickers or drawings), for example:– use drawings or pictures to represent and sequence events and special times; and– make a variety of sets for a given number using a range of materials, for example make
sets of 8 using large/small objects and know they are equal sets.
Pupils can use everyday language, relevant to the mathematical activity, to respond to questions and talk about their work, for example:– “How have you sorted your shapes?” “I put this shape here because it looks the same
as the others but it is bigger.”; and– in practical situations, talk about what they are doing or have done using language such
as 'bigger than', ‘altogether’, ‘more’, ‘forwards’ and ‘empty’.

3
using their of:
Level 1
In structured activities, in familiar and accessible contexts, pupils can:
for example state if they think a set contains more than 5 or fewer than 5, add and subtract numbers practically and use appropriate language to record the results;
for example know that a set contains the same number without having to recount, even if the objects have been rearranged; recognise that zero represents the empty set;
for example red bead, blue bead, yellow bead, red bead, blue bead, …; 1, 2, 3, 1, 2, … and red square, blue triangle, red square, …;
for example engage in role play, showing recognition of coins and an understanding of the concept of exchanging goods for money.
for example is the longest, weighs the same as, holds less than;
for example wake up, wash and dress, eat breakfast;
for example know that Sunday comes after Saturday and before Monday;
for example recognise break time and lunch time on the clock;
for example sort for one criterion, such as red and not red, and give reasons for sorting; and talk about the shapes used to make a picture of a clown that has a triangle for the hat, circle for the face and rectangle for the body;
for example under, over, inside, outside, beside, backwards, forwards and whole turn.
for example sort a collection of farm animals by type and then re-sort by colour, and sort animals with two legs/not two legs;
for example use a photograph or drawing to self-register, and use cubes to record the number of people with blue/brown eyes.

4
Across the curriculum, at a level appropriate to their ability, pupils should be enabled to:
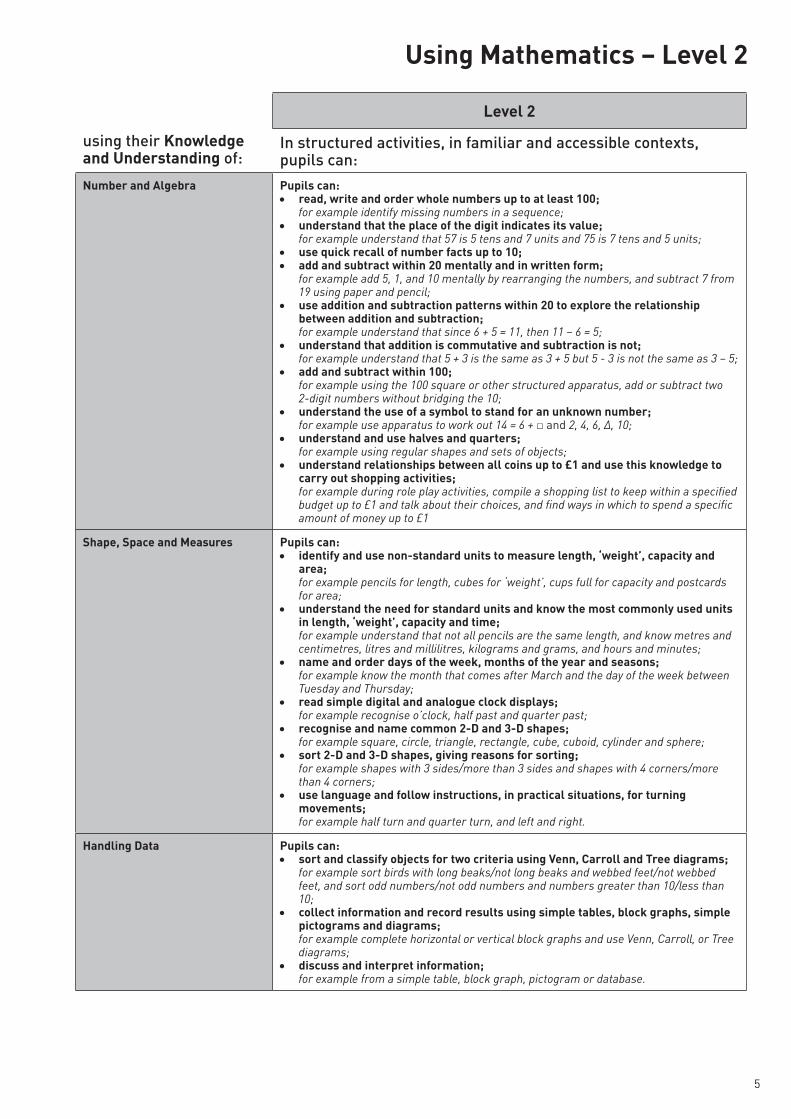
Requirements for Using Mathematics Level 2
In structured activities, in familiar and accessible contexts, pupils can:
mathematics to use in a Pupils can discuss possible approaches to solve a problem and can begin to respond to questions from the teacher, for example:– "What information do we need to collect?", "How will we record it?" and– "What equipment should we use?", "Is there anything else we could use?"
Pupils can talk about the information and/or possible approaches that are needed to complete the activity. Given a range of teacher-identified materials/equipment/strategies, they can select which ones to use in a given activity, for example:– choose counters or number line for a counting activity;– select materials for a weighing activity, for example balance scales, marbles and cubes; and– choose their own methods to find which set has more objects.
Pupils can record practical work using symbols such as +, –, =, and →.
Pupils can organise and check their work in collaboration with their teacher and peers, for example:– organise the equipment for the activity;– check by repeating the process; and– check that all information has been included and does not appear more than once.
Pupils can choose and use the appropriate number operations and mental strategies to solve problems in a wide variety of contexts, for example:– count on to give change within £1; and– use mental calculation strategies to add and subtract within 20, such as counting on,
doubling and adjusting (6 + 7 = 6 + 6 + 1).
Pupils can:– identify and explore patterns in the 100 square, for example patterns of fives and tens;– make predictions, such as 10 more than 27, and check using the 100 square; and– explore number sequences, including odd/even.
Pupils can collect information relevant to a topic, for example:– how they get to school and what pets they have;They can compare and talk about data that represents objects/people, for example:– in drawings, pictures, block graphs, simple pictograms and simple tables/databases.
Pupils can discuss and decide how they are going to record and present information collected from practical/mental activities, for example:– use a diagram to represent half or quarter of a pizza;– record addition and subtraction horizontally;– record weights of objects measured in non-standard units;– record information in labelled Venn, Carroll and Tree diagrams; and– label items in a shop to show and discuss their price (1p, 10p, £1 etc).
Pupils can use mathematical terms to, for example:– talk about ‘weight’, length, time and capacity, using ‘longest’, ‘shortest’, ‘heaviest’,
‘lightest’, ‘hold more/less’, ‘sooner/later’, etc;– talk about 2-D and 3-D shapes, for example the number of sides/corners; and– talk about the days of the week, months and seasons, including sequencing the
seasons and months of the year.Pupils can respond to questions, for example:“How can we find out about…?”, “What can you tell me about 25?”, “What should we use to measure/record…?”
5
using their of:
Level 2
In structured activities, in familiar and accessible contexts, pupils can:
for example identify missing numbers in a sequence;
for example understand that 57 is 5 tens and 7 units and 75 is 7 tens and 5 units;
for example add 5, 1, and 10 mentally by rearranging the numbers, and subtract 7 from 19 using paper and pencil;
for example understand that since 6 + 5 = 11, then 11 – 6 = 5;
for example understand that 5 + 3 is the same as 3 + 5 but 5 - 3 is not the same as 3 – 5;
for example using the 100 square or other structured apparatus, add or subtract two 2-digit numbers without bridging the 10;
for example use apparatus to work out 14 = 6 + and 2, 4, 6, Δ, 10;
for example using regular shapes and sets of objects;
for example during role play activities, compile a shopping list to keep within a specified budget up to £1 and talk about their choices, and find ways in which to spend a specific amount of money up to £1
for example pencils for length, cubes for ‘weight’, cups full for capacity and postcards for area;
for example understand that not all pencils are the same length, and know metres and centimetres, litres and millilitres, kilograms and grams, and hours and minutes;
for example know the month that comes after March and the day of the week between Tuesday and Thursday;
for example recognise o’clock, half past and quarter past;
for example square, circle, triangle, rectangle, cube, cuboid, cylinder and sphere;
for example shapes with 3 sides/more than 3 sides and shapes with 4 corners/more than 4 corners;
for example half turn and quarter turn, and left and right.
for example sort birds with long beaks/not long beaks and webbed feet/not webbed feet, and sort odd numbers/not odd numbers and numbers greater than 10/less than 10;
for example complete horizontal or vertical block graphs and use Venn, Carroll, or Tree diagrams;
for example from a simple table, block graph, pictogram or database.

6
In structured activities, in familiar and accessible contexts, pupils can:
mathematics to use in a In response to questions, such as “Why are we doing this?”, “What do we need for this?”, “What are the different ways we could do this?” pupils can for example:– obtain information from books, through observation, using the internet as an individual/
class/group, for example about road accidents/recycling; – use a writing frame to begin to plan how to solve the problem;– ask questions to solve problems and clarify information; – use structured apparatus and smaller numbers; and– suggest ways to record/present their findings, such as bar chart, pictogram, tally chart,
table and list.
Given a range of teacher-identified materials/equipment/strategies, pupils can, for example:– when measuring choose the most appropriate instrument by understanding its
special characteristics (for example ruler, metre stick, trundle wheel, measuring tape, stopwatch, thermometer, measuring jug and measuring scales);
– choose the correct operation to solve a problem, for example addition, subtraction and multiplication;
– choose and use accurately the most appropriate method of calculating (practical, mental, pencil and paper and calculator); and
– use measuring instruments with reasonable accuracy.
Pupils can record their own work using, for example: – symbols such as x (multiply);– units such as p, £, cm, m, g, kg; and
– fraction notation such as
Pupils can for example:– use simple guidelines and procedures, for example a writing frame to structure their
work; and– set out their work clearly and show their working out. Through discussion with the teacher and peers, pupils can use strategies to check their work, for example:– repeat the process;– use addition and subtraction as inverse operations for simple calculations;– work backwards; and– check that information hasn’t been omitted or repeated.
Pupils can solve problems where a final answer requires the use of an earlier answer, for example:– use addition, subtraction and multiplication in shopping activities, and calculate the
change required after buying a number of items; and– find the number of buses required for a particular number of pupils going on a school
trip.
Pupils can use a range of strategies when solving simple problems, for example:– count on/back in ones, twos, fives and tens to/from 100;– use their knowledge of number facts to 20 and multiplication facts (2, 3, 4, 5 &10);– round and adjust to make the calculation easier, for example when adding 19 + 7, round
19 up to 20, work out 20 + 7, then adjust by taking away 1; and– rearrange numbers to make calculations easier, for example when adding, group
numbers together that add up to 10, so 14 + 9 + 6 can be seen as 10 + 4 + 6 + 9, which is 10 + 10 + 9, which is 29
Across the curriculum, at a level appropriate to their ability, pupils should be enabled to:
Requirements for Using Mathematics
7
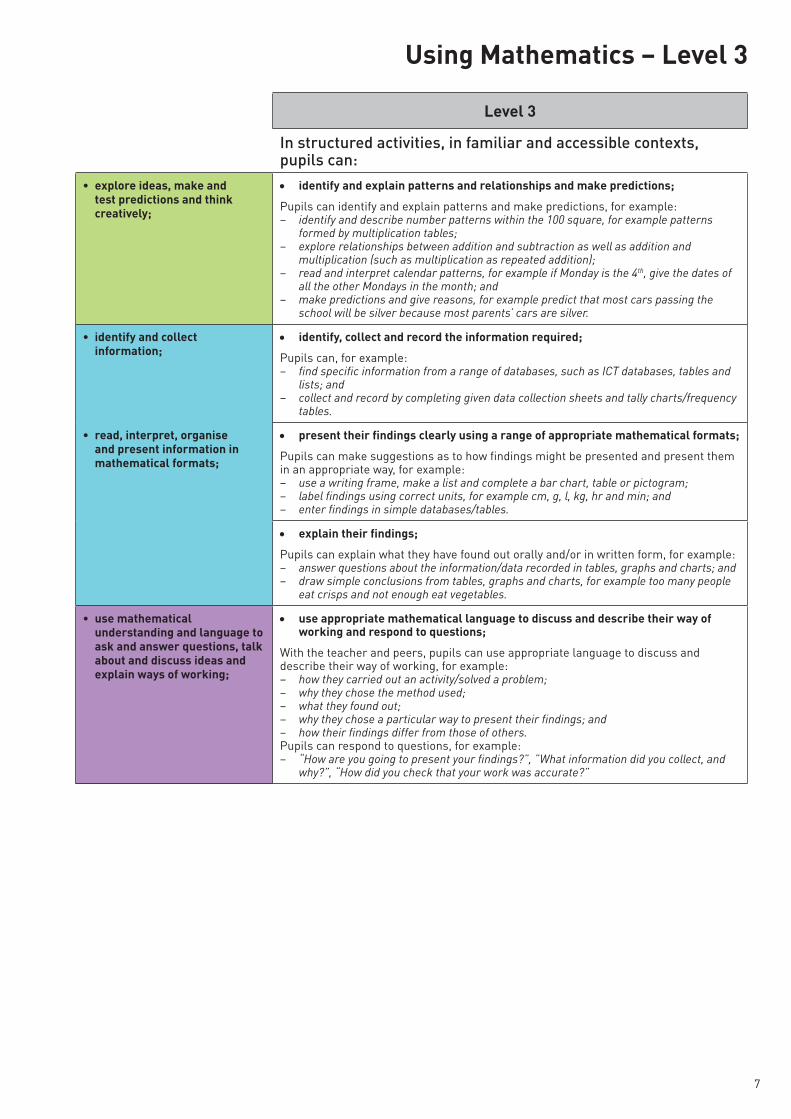
In structured activities, in familiar and accessible contexts, pupils can:
Pupils can identify and explain patterns and make predictions, for example:– identify and describe number patterns within the 100 square, for example patterns
formed by multiplication tables;– explore relationships between addition and subtraction as well as addition and
multiplication (such as multiplication as repeated addition);– read and interpret calendar patterns, for example if Monday is the 4th, give the dates of
all the other Mondays in the month; and– make predictions and give reasons, for example predict that most cars passing the
school will be silver because most parents’ cars are silver.
Pupils can, for example:– find specific information from a range of databases, such as ICT databases, tables and
lists; and– collect and record by completing given data collection sheets and tally charts/frequency
tables.
Pupils can make suggestions as to how findings might be presented and present them in an appropriate way, for example:– use a writing frame, make a list and complete a bar chart, table or pictogram;– label findings using correct units, for example cm, g, l, kg, hr and min; and– enter findings in simple databases/tables.
Pupils can explain what they have found out orally and/or in written form, for example:– answer questions about the information/data recorded in tables, graphs and charts; and– draw simple conclusions from tables, graphs and charts, for example too many people
eat crisps and not enough eat vegetables.
With the teacher and peers, pupils can use appropriate language to discuss and describe their way of working, for example:– how they carried out an activity/solved a problem;– why they chose the method used;– what they found out;– why they chose a particular way to present their findings; and– how their findings differ from those of others.Pupils can respond to questions, for example:– “How are you going to present your findings?”, ”What information did you collect, and
why?”, “How did you check that your work was accurate?”
8
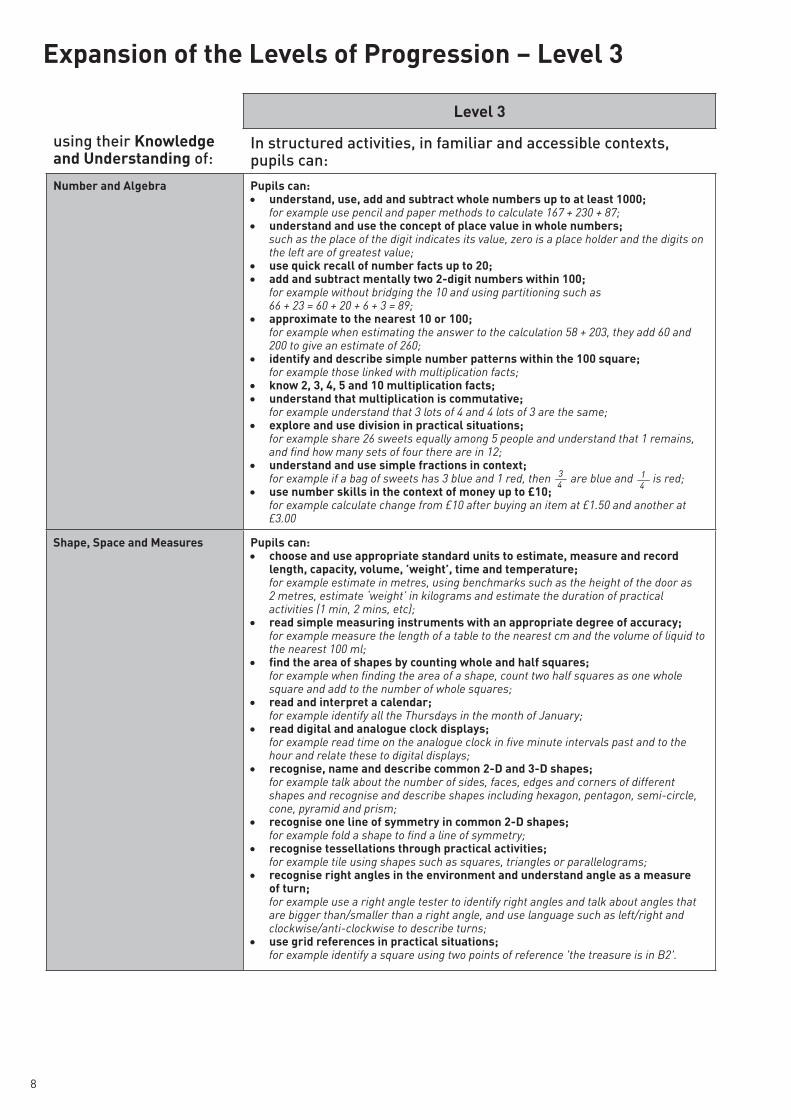
using their of:
In structured activities, in familiar and accessible contexts, pupils can:
for example use pencil and paper methods to calculate 167 + 230 + 87;
such as the place of the digit indicates its value, zero is a place holder and the digits on the left are of greatest value;
for example without bridging the 10 and using partitioning such as 66 + 23 = 60 + 20 + 6 + 3 = 89;
for example when estimating the answer to the calculation 58 + 203, they add 60 and 200 to give an estimate of 260;
for example those linked with multiplication facts;
for example understand that 3 lots of 4 and 4 lots of 3 are the same;
for example share 26 sweets equally among 5 people and understand that 1 remains, and find how many sets of four there are in 12;
for example if a bag of sweets has 3 blue and 1 red, then are blue and is red;
for example calculate change from £10 after buying an item at £1.50 and another at £3.00
for example estimate in metres, using benchmarks such as the height of the door as2 metres, estimate ‘weight’ in kilograms and estimate the duration of practical activities (1 min, 2 mins, etc);
for example measure the length of a table to the nearest cm and the volume of liquid to the nearest 100 ml;
for example when finding the area of a shape, count two half squares as one whole square and add to the number of whole squares;
for example identify all the Thursdays in the month of January;
for example read time on the analogue clock in five minute intervals past and to the hour and relate these to digital displays;
for example talk about the number of sides, faces, edges and corners of different shapes and recognise and describe shapes including hexagon, pentagon, semi-circle, cone, pyramid and prism;
for example fold a shape to find a line of symmetry;
for example tile using shapes such as squares, triangles or parallelograms;
for example use a right angle tester to identify right angles and talk about angles that are bigger than/smaller than a right angle, and use language such as left/right and clockwise/anti-clockwise to describe turns;
for example identify a square using two points of reference 'the treasure is in B2'.
3
41
4

9
In structured activities, in familiar and accessible contexts, pupils can:
for example complete a given observation sheet or tally chart;
for example complete and label pictograms where the symbol represents more than one object and complete and label bar charts (with axes given);
for example identify the most/least popular food from a simple pie chart and read frequencies from a bar chart.

10
In activities with some structure, in familiar and some unfamiliar contexts and situations, pupils can:
mathematics to use in a Through discussion with the teacher/peers, pupils can suggest and compare ways an activity might be approached by, for example:– simplifying the activity;– looking for a pattern; and– drawing a diagram;and can decide on which they consider is the most appropriate.
Through discussion with the teacher/peers, pupils can decide on the materials and equipment required to solve the problem/carry out the activity, for example:– choose the appropriate equipment, method and unit of measurement to measure the
perimeter of the playground; and– decide how they will collect and present the information.
Pupils can carry out their work using appropriate methods, for example:– use division to find out the number of buses required for a school trip;– graphically represent data from a table;– record to two decimal places; and– label coordinates, use ÷ and % symbols and include units such as cm2 and m2.
Pupils can, through discussion with their peers:– organise the equipment required; – outline the steps to be taken orally or by using bullet points or a writing frame; and– work in a logical manner, for example to find all possible combinations.
Pupils can use estimation to find the approximate solution to a problem. They can review the identified steps taken as they work. They can use their estimation to decide if their answers are reasonable. They can check the accuracy of their work by, for example:– repeating the calculation;– using the relationship between addition and subtraction to identify different methods of
calculation; and– using a calculator.
Pupils can choose and use practical, mental, paper and pencil and calculator methods as appropriate. They can discuss and compare ideas and methods with others. They can use a range of problem-solving strategies, persevering when difficulties are encountered by, for example:– making an organised list;– drawing a picture/diagram;– finding patterns; and– simplifying by using smaller numbers.
Pupils can use a range of strategies to estimate answers and find exact solutions, for example:– rounding numbers to estimate an answer, for example 118 + 463 = 120 + 460 = 580; and– adding two 2-digit numbers mentally, bridging the ten, for example 29 + 56 = 30 + 55 = 85 and 36 + 45 = 36 + 40 + 5 = 76 + 4 + 1 = 81
Across the curriculum, at a level appropriate to their ability, pupils should be enabled to:
Requirements for Using Mathematics

11
In activities with some structure, in familiar and some unfamiliar contexts and situations, pupils can:
Pupils can investigate patterns and relationships while carrying out activities. They can describe and explain patterns/relationships, using simple rules expressed in words where possible, for example:– identify a simple pattern and use this information to predict future answers, such as
the number of metre square tiles needed to cover areas (2 × 2, 2 × 3, 2 × 4, …, 2 × 15); – find the rule for a simple number sequence, for example 2, 5, 8, 11, …, and find the next two
terms; and– find the area of squares and rectangles by drawing on cm squared paper, leading to the
rule length times breadth.
Pupils can discuss a general statement with the teacher/peers and can check whether particular cases match it, for example:– any even number can be written as the sum of two odd numbers;– some numbers can only be divided by themselves and 1; and– hot liquid cools more quickly in a plastic cup than a polystyrene cup.
Pupils can use given resources to find, organise and manipulate a wider range of information, for example:– interrogate a database in response to a range of questions;– use an observation sheet to record data using given class intervals; – use a Decision Tree diagram to organise information; and– read and interpret information from a range of graphical/pictorial representations.
Pupils can decide on an appropriate method of presentation and present their findings using a range of graphs, tables, diagrams, prose, numbers and symbols (including the use of ICT). They can present their work clearly, for example:– setting out calculations and showing their working out step-by-step;– using appropriate scale/units;– drawing shapes/diagrams accurately;– labelling diagrams; and– using appropriate mathematical language.
Pupils can give reasons for their choice of presentation. They can compare their method of presentation with others and discuss which presentation shows the information most clearly, for example:– compare results given in a table or in a bar chart; and– compare results given in a pie chart and a bar chart.
Pupils can discuss their work with others. They can explain their approaches/choices and can compare their thinking with others, for example:– how to approach a problem/which strategy to use;– what equipment is needed;– how to present findings;– how they checked their work;– why they chose to present the results/information in a particular way; and– what they found out, drawing relevant conclusions.

12
using their of:
In activities with some structure, in familiar and some unfamiliar contexts and situations, pupils can:
for example 30 x 100; 4200 ÷ 10;
for example understand that for the number 0.56, 5 represents five tenths and 6 is six hundredths;
for example round 6473 to either 6470, 6500 or 6000 depending on expectations;
for example estimate the answer to 21 × 19 using 20 × 20, or 327 + 879 using 300 + 900;
for example add and subtract mentally any two 2-digit numbers within 100 (without any apparatus), show working out for multiplying two whole numbers up to 100 and use a calculator to divide a whole number within 10 000 by another whole number within 10 000;
for example add 5.4 m and 1.76 m;
for example understand that to find how much money is left from £100 after spending £50 and then £30, it can be worked out by subtracting £50 from £100 and then subtracting a further £30 and checking this by adding £50 and £30 and subtracting the total from £100;
×for example understand that as 6 × 7 = 42, then 42 ÷ 7 = 6;
for example work out how many different equal teams can be made from a class of 30 pupils;
for example if of a class are girls, what fraction of the class are boys;
for example understand that 25% of a pizza is the same as a quarter;
for example use a function machine where the rule is ‘double the previous number and add 1’ to generate a sequence;
for example understand that 5.4 represents £5.40;
for example decide whether it is better value to buy 3 cans of cola or a litre bottle, and consider other factors that need to be taken into consideration when deciding on best value;
for example understand that goods and services can be paid for with cash, cheques, store cards, credit and debit cards and understand that payments for goods and services can be made electronically, such as, through the internet and by setting up a direct debit or standing order with banks and building societies.
for example understand that
for example from pictures/diagrams understand that

13
In activities with some structure, in familiar and some unfamiliar contexts and situations, pupils can:
for example estimate the width of a room to the nearest metre; measure and record the length of an envelope in millimetres; and measure the temperature of water to the nearest degree Celsius;
for example understand that 1 m 25 cm is the same length as 125 cm;
for example subtract 1.76 m from 3.3 m;
for example estimate area by counting more than half a square as a whole square and count rows and columns of cubes that fill/almost fill a container to estimate its volume;
for example add the given lengths of a rectangle, square, triangle; and use squared paper to count the distance around a simple shape;
for example 16:20 is the same as 4:20 pm;
for example count edges, faces and vertices of cubes, cuboids, pyramids; and identify regular and irregular shapes by finding shapes that have equal internal angles;
for example open 3-D shapes to find which 2-D shapes they consist of, and recognise nets of common 3-D shapes;
for example draw lines of symmetry on squares, rectangles, equilateral triangles and hexagons;
which are North (N), North East (NE), East (E), South East (SE), South (S), South West (SW), West (W), North West (NW);
for example perpendicular, horizontal, vertical; acute, obtuse, reflex angles; and south west of the lighthouse;
for example plot and label coordinates such as (3, 4) and (6, 0).
for example use the class intervals 1 – 5, 6 – 10, 11 – 15, etc, to record ages of patients waiting in A&E;
for example use bar charts with given class intervals and pictograms where the key contains more than one symbol;
for example might, certain, likely, unlikely, could happen, impossible, definitely, definitely not, and fair.
14
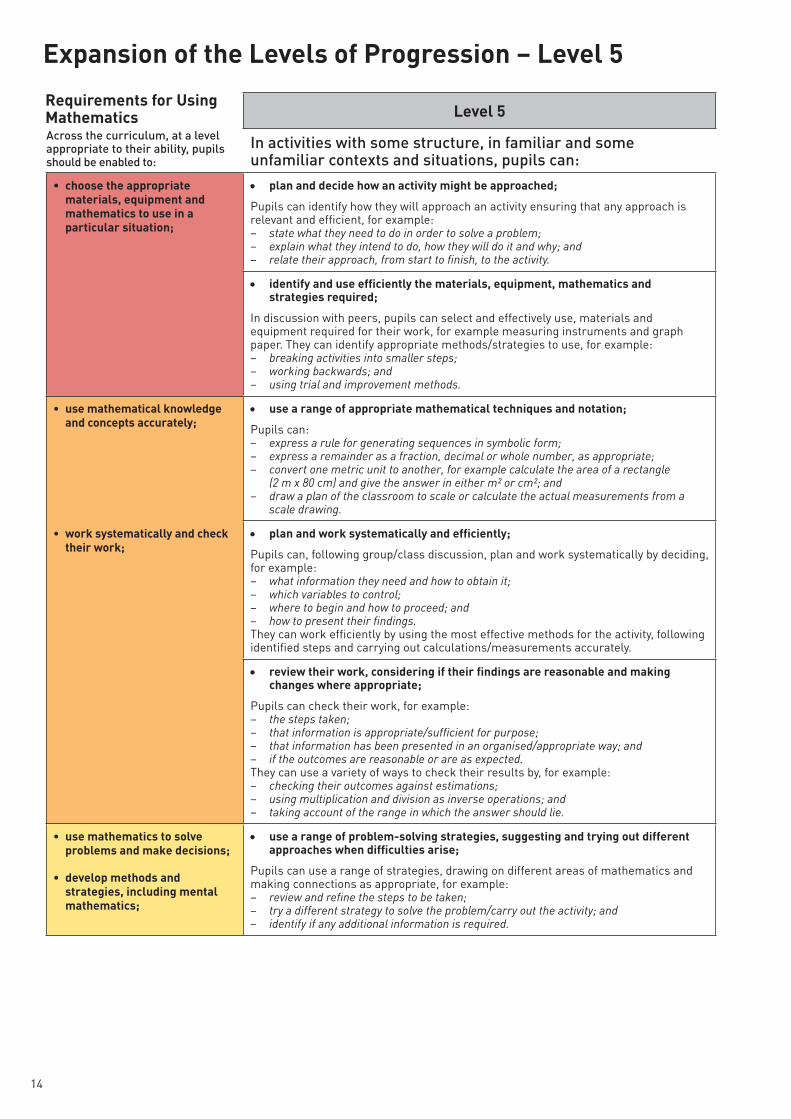
In activities with some structure, in familiar and some unfamiliar contexts and situations, pupils can:
mathematics to use in a Pupils can identify how they will approach an activity ensuring that any approach is relevant and efficient, for example:– state what they need to do in order to solve a problem;– explain what they intend to do, how they will do it and why; and– relate their approach, from start to finish, to the activity.
In discussion with peers, pupils can select and effectively use, materials and equipment required for their work, for example measuring instruments and graph paper. They can identify appropriate methods/strategies to use, for example:– breaking activities into smaller steps;– working backwards; and– using trial and improvement methods.
Pupils can:– express a rule for generating sequences in symbolic form; – express a remainder as a fraction, decimal or whole number, as appropriate; – convert one metric unit to another, for example calculate the area of a rectangle
(2 m x 80 cm) and give the answer in either m² or cm²; and– draw a plan of the classroom to scale or calculate the actual measurements from a
scale drawing.
Pupils can, following group/class discussion, plan and work systematically by deciding, for example: – what information they need and how to obtain it;– which variables to control; – where to begin and how to proceed; and– how to present their findings.They can work efficiently by using the most effective methods for the activity, following identified steps and carrying out calculations/measurements accurately.
Pupils can check their work, for example:– the steps taken;– that information is appropriate/sufficient for purpose;– that information has been presented in an organised/appropriate way; and– if the outcomes are reasonable or are as expected.They can use a variety of ways to check their results by, for example:– checking their outcomes against estimations;– using multiplication and division as inverse operations; and– taking account of the range in which the answer should lie.
Pupils can use a range of strategies, drawing on different areas of mathematics and making connections as appropriate, for example:– review and refine the steps to be taken;– try a different strategy to solve the problem/carry out the activity; and– identify if any additional information is required.
Across the curriculum, at a level appropriate to their ability, pupils should be enabled to:
Requirements for Using Mathematics

15
In activities with some structure, in familiar and some unfamiliar contexts and situations, pupils can:
Pupils can look for patterns and make predictions, for example:
– predict the number of m² tiles needed to cover any size of square by finding and using the pattern; and
– test their prediction using another square.
Pupils can make general statements based on their findings, for example:– square numbers always have an odd number of factors; and– every even number from 8 to 100 can be made by adding together two different prime
numbers.
Pupils summarise their findings orally or in written form, for example:– from a pie chart, rank order the popularity of holiday destinations;– from a table, identify the years with the greatest/least rainfall;– generate a formula in words or symbolic form; and– draw conclusions based on their findings.
Pupils can decide the information required for a particular activity and how to obtain it, for example:– identify sources for information, such as the internet, books, public records and the
census;– design and use a data collection sheet to collect information;– insert data into a database or spreadsheet and interrogate;– decide on appropriate intervals and group the data; and– record each measurement three times and calculate the mean.They can decide if the information gathered is appropriate and sufficient, for example:– whether enough data has been collected to provide accurate results/valid conclusions;
and– interpret the information and decide what is relevant.
Pupils can decide how to present information/findings, for example using symbols, tables, diagrams, graphs and prose. They can give reasons for their chosen method of presentation and compare them with others. They can record and present information accurately, for example:– present calculations, showing working out and checking strategies;– choose and use appropriate scales, labels and titles; and– use graph paper/squared paper to draw line graphs.
Pupils can express ideas precisely, orally or in written form, for example:– use mathematical language to create formulae, for example ‘the volume of a cuboid is
length times breadth times height’;– use the language of shape to describe properties of triangles and quadrilaterals, for
example angles of a triangle add up to 180º; and– use the language of probability to make comparisons, for example more/less likely,
’evens’, fifty-fifty, improbable and possible.

16
using their of:
In activities with some structure, in familiar and some unfamiliar contexts and situations, pupils can:
for example 0.325 x 1000; 6 ÷100;
for example understand that for the number 0.562, 2 represents two thousandths;
for example round 28.37 to 28 or 4216.5 to 4217;
for example work out 16.75 x 14; 1.65 m ÷ 5;
for example calculate the total cost of dinners for four weeks and check by dividing the answer by 4;
for example know that when the temperature rises from -6° C to -1° C, it has risen by 5° C and understand height above and below sea level;
for example work out the volume of a cube if its length is 4 cm and recognise that a class of 17 pupils cannot be divided into equal groups;
for example find the next term in a sequence given the rule “4 × n - 1”;
for example find the volume of a cuboid using the formula V = l × b × h;
for example plan a week of leisure activities for a family of four with a budget of £500, taking into consideration their collective and varied interests and requirements.
for example convert 1245 ml to 1.245 l; 14 mm to 1.4 cm; 1260 g to 1.26 kg;
for example find how many 120 ml glasses can be filled from a 1 litre bottle of cola;
for example find a way to calculate the area of a right-angled triangle;
for example regular and irregular shapes with some missing, but attainable measurements;
for example calculate the actual distance between two places on a map and draw a plan of the classroom to scale;
for example plan a journey using public transport;
for example use properties to classify different types of triangles;
for example use squared paper to reflect shapes and check using a mirror;
for example describe the properties of a triangular prism;
for example use cm squared paper to draw how a 3-D shape will look when opened out flat;
for example use a 360° angle measurer to compare angles, and estimate the size of an angle as between 90° and 135°.
for example know that
for example find
for example understand that

17
In activities with some structure, in familiar and some unfamiliar contexts and situations, pupils can:
for example decide on appropriate class intervals to organise data and represent the data graphically;
for example ask appropriate questions to obtain and record information;
for example understand when it is appropriate to use a line graph and understand that intermediate values may or may not have a meaning; draw and interpret a dual bar chart; complete and interpret given pie charts with divisions marked;
for example find the mean and range of the heights of 20 girls;
for example use language such as impossible, unlikely, even chance, likely and certain to order everyday events.
18
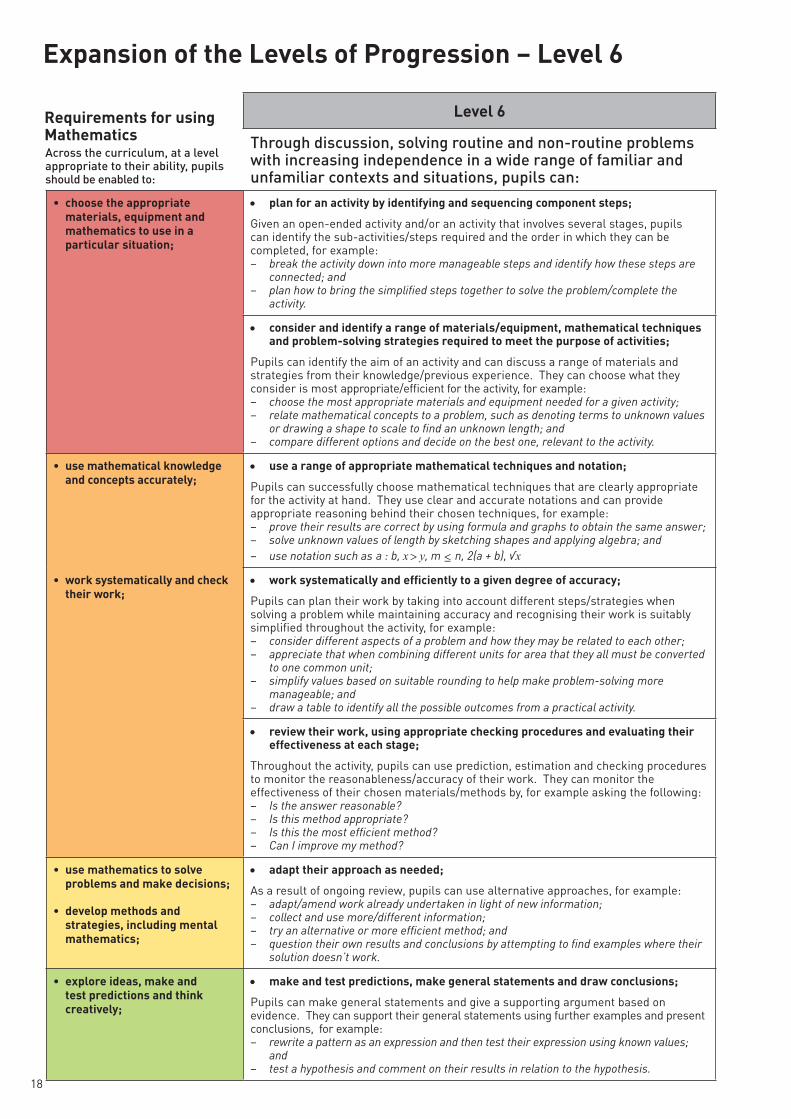
Through discussion, solving routine and non-routine problems with increasing independence in a wide range of familiar and unfamiliar contexts and situations, pupils can:
mathematics to use in a Given an open-ended activity and/or an activity that involves several stages, pupils can identify the sub-activities/steps required and the order in which they can be completed, for example:– break the activity down into more manageable steps and identify how these steps are
connected; and– plan how to bring the simplified steps together to solve the problem/complete the
activity.
Pupils can identify the aim of an activity and can discuss a range of materials and strategies from their knowledge/previous experience. They can choose what they consider is most appropriate/efficient for the activity, for example:– choose the most appropriate materials and equipment needed for a given activity;– relate mathematical concepts to a problem, such as denoting terms to unknown values
or drawing a shape to scale to find an unknown length; and– compare different options and decide on the best one, relevant to the activity.
Pupils can successfully choose mathematical techniques that are clearly appropriate for the activity at hand. They use clear and accurate notations and can provide appropriate reasoning behind their chosen techniques, for example:– prove their results are correct by using formula and graphs to obtain the same answer;– solve unknown values of length by sketching shapes and applying algebra; and
– use notation such as
Pupils can plan their work by taking into account different steps/strategies when solving a problem while maintaining accuracy and recognising their work is suitably simplified throughout the activity, for example:– consider different aspects of a problem and how they may be related to each other;– appreciate that when combining different units for area that they all must be converted
to one common unit;– simplify values based on suitable rounding to help make problem-solving more
manageable; and– draw a table to identify all the possible outcomes from a practical activity.
Throughout the activity, pupils can use prediction, estimation and checking procedures to monitor the reasonableness/accuracy of their work. They can monitor the effectiveness of their chosen materials/methods by, for example asking the following:– Is the answer reasonable?– Is this method appropriate?– Is this the most efficient method?– Can I improve my method?
As a result of ongoing review, pupils can use alternative approaches, for example:– adapt/amend work already undertaken in light of new information;– collect and use more/different information;– try an alternative or more efficient method; and– question their own results and conclusions by attempting to find examples where their
solution doesn’t work.
Pupils can make general statements and give a supporting argument based on evidence. They can support their general statements using further examples and present conclusions, for example:– rewrite a pattern as an expression and then test their expression using known values;
and– test a hypothesis and comment on their results in relation to the hypothesis.
Across the curriculum, at a level appropriate to their ability, pupils should be enabled to:
Requirements for using Mathematics
a : b, x y, m n, 2(a + b), √x
19
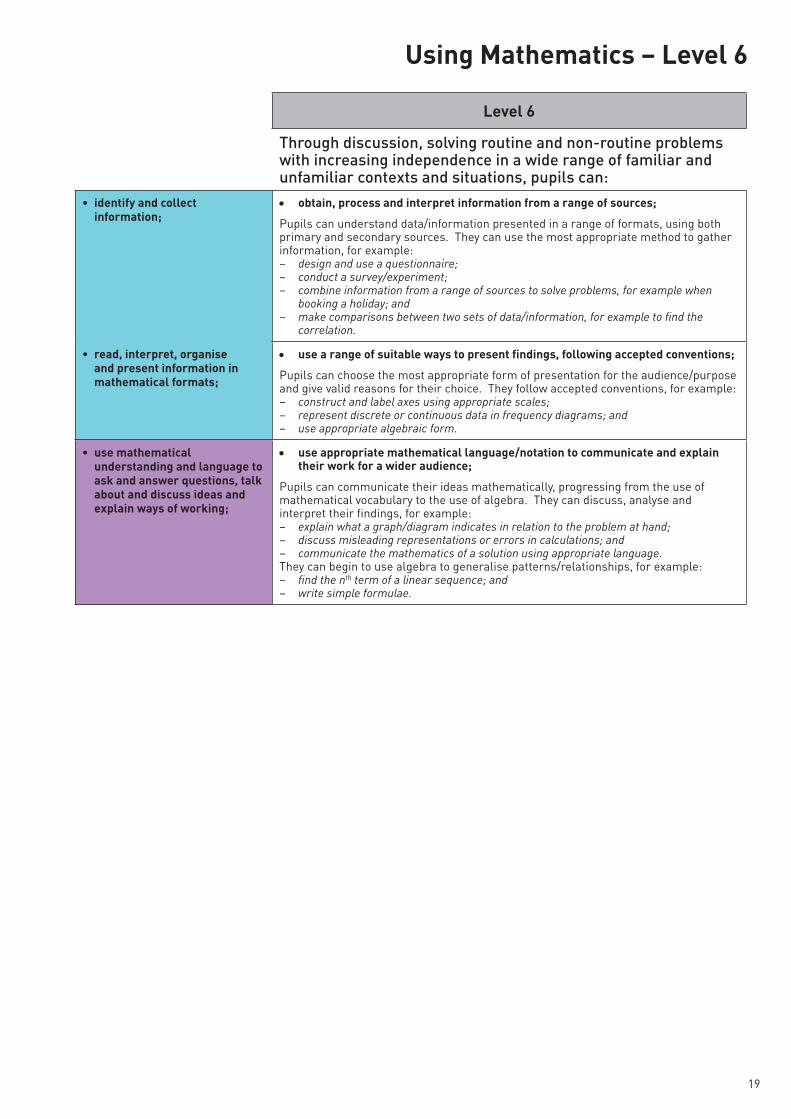
Through discussion, solving routine and non-routine problems with increasing independence in a wide range of familiar and unfamiliar contexts and situations, pupils can:
Pupils can understand data/information presented in a range of formats, using both primary and secondary sources. They can use the most appropriate method to gather information, for example:– design and use a questionnaire;– conduct a survey/experiment;– combine information from a range of sources to solve problems, for example when
booking a holiday; and – make comparisons between two sets of data/information, for example to find the
correlation.
Pupils can choose the most appropriate form of presentation for the audience/purpose and give valid reasons for their choice. They follow accepted conventions, for example:– construct and label axes using appropriate scales;– represent discrete or continuous data in frequency diagrams; and– use appropriate algebraic form.
Pupils can communicate their ideas mathematically, progressing from the use of mathematical vocabulary to the use of algebra. They can discuss, analyse and interpret their findings, for example:– explain what a graph/diagram indicates in relation to the problem at hand;– discuss misleading representations or errors in calculations; and– communicate the mathematics of a solution using appropriate language.They can begin to use algebra to generalise patterns/relationships, for example:– find the nth term of a linear sequence; and– write simple formulae.
20
using their of:
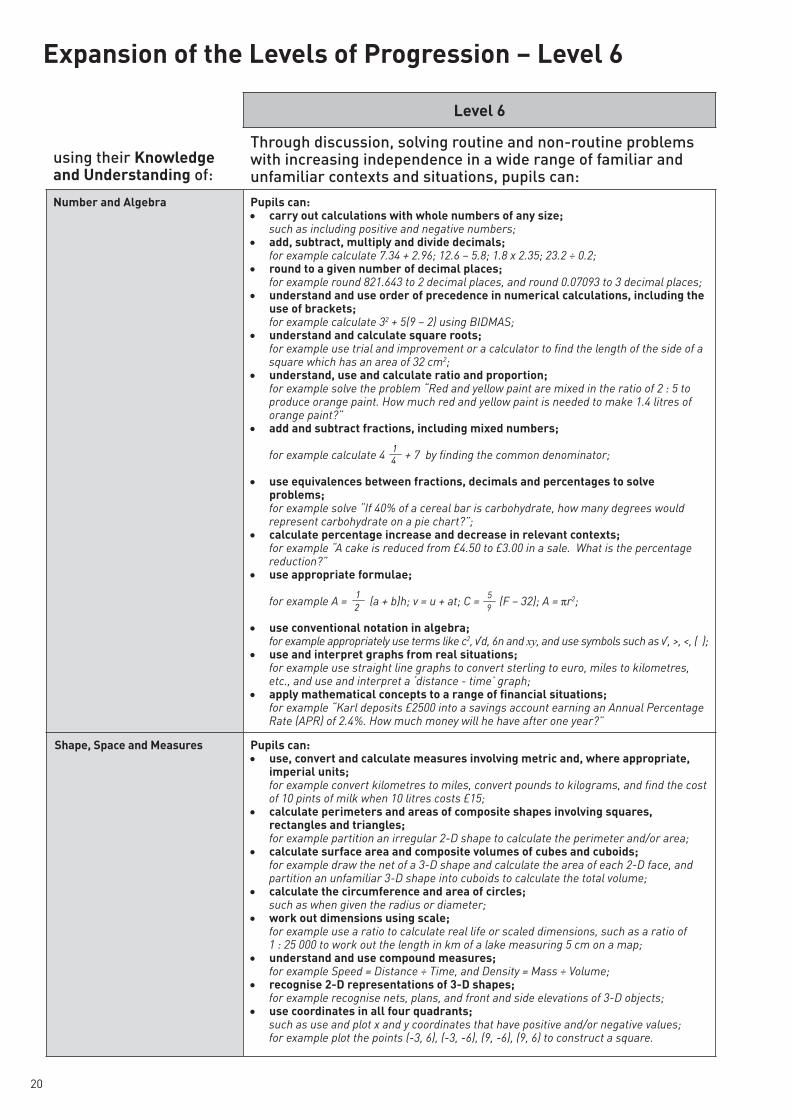
Through discussion, solving routine and non-routine problems with increasing independence in a wide range of familiar and unfamiliar contexts and situations, pupils can:
such as including positive and negative numbers;
for example calculate 7.34 + 2.96; 12.6 – 5.8; 1.8 x 2.35; 23.2 ÷ 0.2;
for example round 821.643 to 2 decimal places, and round 0.07093 to 3 decimal places;
for example calculate 32 + 5(9 – 2) using BIDMAS;
for example use trial and improvement or a calculator to find the length of the side of a square which has an area of 32 cm2;
for example solve the problem “Red and yellow paint are mixed in the ratio of 2 : 5 to produce orange paint. How much red and yellow paint is needed to make 1.4 litres of orange paint?”
for example calculate 4 + 7 by finding the common denominator;
for example solve “If 40% of a cereal bar is carbohydrate, how many degrees would represent carbohydrate on a pie chart?”;
for example “A cake is reduced from £4.50 to £3.00 in a sale. What is the percentage reduction?”
for example A = (a + b)h; v = u + at; C = (F – 32); A = r2;
for example appropriately use terms like c2, √d, 6n and xy, and use symbols such as √, >, <, ( );
for example use straight line graphs to convert sterling to euro, miles to kilometres, etc., and use and interpret a ‘distance - time’ graph;
for example “Karl deposits £2500 into a savings account earning an Annual Percentage Rate (APR) of 2.4%. How much money will he have after one year?”
for example convert kilometres to miles, convert pounds to kilograms, and find the cost of 10 pints of milk when 10 litres costs £15;
for example partition an irregular 2-D shape to calculate the perimeter and/or area;
for example draw the net of a 3-D shape and calculate the area of each 2-D face, and partition an unfamiliar 3-D shape into cuboids to calculate the total volume;
such as when given the radius or diameter;
for example use a ratio to calculate real life or scaled dimensions, such as a ratio of 1 : 25 000 to work out the length in km of a lake measuring 5 cm on a map;
for example Speed = Distance ÷ Time, and Density = Mass ÷ Volume;
for example recognise nets, plans, and front and side elevations of 3-D objects;
such as use and plot x and y coordinates that have positive and/or negative values;for example plot the points (-3, 6), (-3, -6), (9, -6), (9, 6) to construct a square.
1
4
5
9

21
Through discussion, solving routine and non-routine problems with increasing independence in a wide range of familiar and unfamiliar contexts and situations, pupils can:
for example record quantitative data separately, record discrete data in groups using discrete class intervals, and record continuous data in groups using continuous class intervals, such as, 1 ≤ n < 5, 5 ≤ n < 10, 10 ≤ n < 15, etc;
for example produce pie charts, stem and leaf diagrams, and scatter diagrams;
for example know that the median is the value in the middle of a numerically ordered set of data, while the mode is the most frequently occurring value;
for example use a frequency table to calculate the mean for a set of discrete data by using the appropriate method;
for example work out either the mean, mode or median for two sets of data and discuss the average used in relation to the data;
for example express the probability of getting a tail when a coin is tossed or the probability of selecting a red ball from a bag containing 3 red balls and 5 blue balls.

22
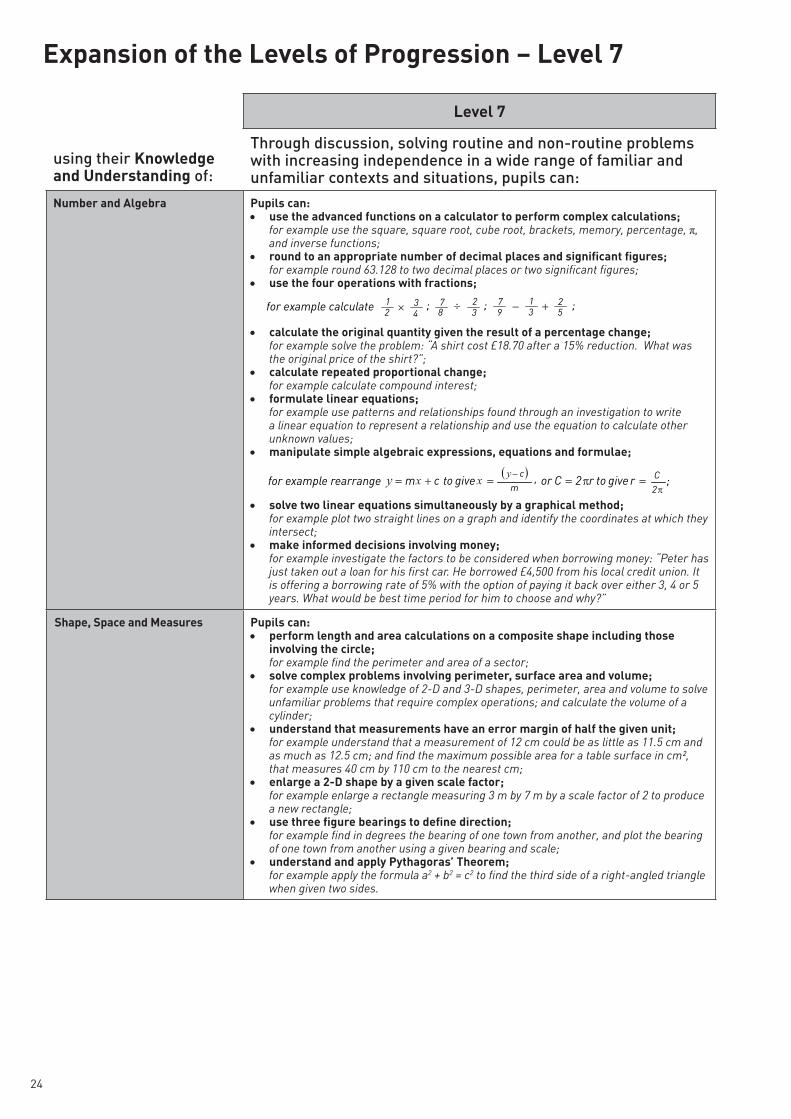
Level 7
Through discussion, solving routine and non-routine problems with increasing independence in a wide range of familiar and unfamiliar contexts and situations, pupils can:
mathematics to use in a Pupils can plan and outline their approach to an open-ended activity effectively, giving concise reasons for their choice of strategies at each stage, for example:– decide on the best way of approaching an activity;– clearly explain their approach using concise language and relevant examples; and– show a clear understanding of relationships and connections.
Pupils can discuss the suitability of a range of materials and strategies, choosing the one that is most appropriate/efficient and justifying this choice, for example:– fully and clearly relate mathematical concepts to a problem; and– explain with reasoning why their method is the most appropriate.
Pupils can choose the most appropriate mathematical techniques and justify their reasoning as to why they chose those techniques. They can also use the most appropriate notations with no errors, for example:– manipulate algebraic expressions, equations and formulae to investigate different variables;– use three figure bearings when working out the distance and direction one object is
from another; and– solve two unknowns using the most appropriate method.
Pupils can:– interpret and evaluate their findings, focusing on their completeness and appropriateness;– consider the importance and possible limitations of any conclusions/assumptions
made; and– discuss and evaluate the effectiveness of the strategies used.
Pupils can use and analyse alternative approaches, giving reasons, for example:– suggest ways in which the activity could be further explored; and– use the handling data cycle to further investigate a hypothesis.
Pupils can use mathematical concepts to explain and justify their generalisations and conclusions. They can explain the difference between a mathematical model and experimental evidence, for example:– understand that in probability, the relative frequency of getting ‘heads’ when a coin is tossed
becomes closer to its theoretical probability of 0.5 as you increase the number of trials; and– fully interpret information provided in a variety of forms (for example algebra, graphs,
tables) and cross-reference each to reach a reasonable conclusion.
Pupils can consider data/information from a range of sources and evaluate its appropriateness, relevance and reliability. They can use a range of (statistical) methods to process, analyse and make comparisons, for example:– compare the estimated mean and range for two sets of grouped data; and– analyse a range of information from different sources to make informed decisions
involving money.
Having pursued their own line of enquiry, pupils can choose the most effective/appropriate method to present their findings to a wider audience. They can evaluate their findings and justify their choice of presentation.
Across the curriculum, at a level appropriate to their ability, pupils should be enabled to:
Requirements for Using Mathematics

23
Level 7
Through discussion, solving routine and non-routine problems with increasing independence in a wide range of familiar and unfamiliar contexts and situations, pupils can:
Pupils can communicate their ideas and findings mathematically in a consistent and accurate way through the use of vocabulary, symbols, algebra and graphical representations (as appropriate) to justify their conclusions.
24
Level 7
using their of:
Through discussion, solving routine and non-routine problems with increasing independence in a wide range of familiar and unfamiliar contexts and situations, pupils can:
for example use the square, square root, cube root, brackets, memory, percentage, , and inverse functions;
for example round 63.128 to two decimal places or two significant figures;
for example solve the problem: “A shirt cost £18.70 after a 15% reduction. What was the original price of the shirt?”;
for example calculate compound interest;
for example use patterns and relationships found through an investigation to write a linear equation to represent a relationship and use the equation to calculate other unknown values;
for example plot two straight lines on a graph and identify the coordinates at which they intersect;
for example investigate the factors to be considered when borrowing money: “Peter has just taken out a loan for his first car. He borrowed £4,500 from his local credit union. It is offering a borrowing rate of 5% with the option of paying it back over either 3, 4 or 5 years. What would be best time period for him to choose and why?”
for example find the perimeter and area of a sector;
for example use knowledge of 2-D and 3-D shapes, perimeter, area and volume to solve unfamiliar problems that require complex operations; and calculate the volume of a cylinder;
for example understand that a measurement of 12 cm could be as little as 11.5 cm and as much as 12.5 cm; and find the maximum possible area for a table surface in cm², that measures 40 cm by 110 cm to the nearest cm;
for example enlarge a rectangle measuring 3 m by 7 m by a scale factor of 2 to produce a new rectangle;
for example find in degrees the bearing of one town from another, and plot the bearing of one town from another using a given bearing and scale;
for example apply the formula a2 + b2 = c2 to find the third side of a right-angled triangle when given two sides.
for example calculate
for example rearrange y y

25
Level 7
Through discussion, solving routine and non-routine problems with increasing independence in a wide range of familiar and unfamiliar contexts and situations, pupils can:
for example choose a hypothesis, collect the relevant data, test data using appropriate methods, evaluate results and present work clearly and efficiently;
for example draw cumulative frequency tables and graphs to help estimate the median and interquartiles and draw box plots, and draw lines of best fit on scatter diagrams;
for example calculate an estimate for the mean using mid-values to represent each class, and comment on the median and modal group(s) from a grouped frequency table;
for example use provided data and consider the range and any anomalies to identify which average to use;
for example understand that when a dice is rolled there is a chance that a multiple of
three will come up, and if the dice is rolled 12 times then a multiple of 3 should come up
for example calculate the probability of two events happening at the same time by multiplying the probability of each event together, and calculate the probability of one or the other event happening by adding the probability of each event together.
;


27
GlossaryThe guidance booklet "Expansion of the Levels of
Progression in Using Mathematics" also contains a
'Glossary of Terms' and accompanying 'Illustrations'.
Glossary of TermsThis provides an explanation of some of the
mathematical words and terms used within the
guidance.
IllustrationsThis provides pictorial representations of the
mathematics expected at the various levels as
detailed in the guidance. The accompanying
illustrations are not designed as an exhaustive list,
nor as a set of prescribed examples.
They also support definitions that are provided within
the ‘Glossary of Terms’.
27

28
The use of symbols or letters to represent variables combined with the use
of values and operations to devise and create an expression, equation or
formula.
Any occurrence or object that is out of place, unusual, or unique. It can also
mean a discrepancy or deviation from an established rule or trend.
Bar Chart
A frequency diagram using bars of equal width. The heights or lengths of
the bars are proportional to the frequency. Bars can be drawn vertically or
horizontally and there are gaps between the bars.
(See the Illustrations for an example)
A bar chart where the bars are divided to mark off each piece of data into
blocks that represent unit frequencies or multiples of frequencies.
(See the llustrations for an example)
Carroll DiagramA diagram used to sort objects and numbers in a yes/no fashion, based on
certain properties.
(See the llustrations for an example)
Circumference The distance/perimeter around the edge of a circle.
Class Intervals
The width of a group when numerical data is collected in groups is called
the class interval. When grouping data, the class intervals can be either all
the same size or they can differ in size depending on the type of data being
collected. Class intervals can also be open-ended.
Common MeasuresMeasurements that are given or recorded using the same units,
for example weights given in grams, lengths given in metres, and volume
given in litres.
CommutativeOperations like addition and multiplication are commutative because it does
not matter in which order you perform the operation, for example
6 + 2 = 2 + 6 = 8 or 6 × 2 = 2 × 6 = 12
Measures which should be recorded or given using more than one unit.
For example speed recorded as miles per hour (mph), density recorded as
grams per cubic centimetre (g/cm3).
Continuous Class IntervalsThe upper and lower limits for which continuous data is recorded.
For example 50 < t ≤ 55, 55 < t ≤ 60, 60 < t ≤ 65, etc., where t represents the
time taken, in seconds, to run 400 metres.
Continuous Data Numerical data that can take any value within certain restrictions.
Continuous data is used to record quantitative data such as height, weight,
time and temperature.
The position of a point on a graph, using x and y axes, is given by its
coordinates. They are a set of values that describe an exact position.
Correlation An assessment of how two separate sets of data appear to be connected to
one another and how strong the connection is.
Cube NumbersIf a given number is multiplied by itself and that result is multiplied further
by the given number then the answer you get is a cube number.
For example 27 is a cube number because 3 × 3 × 3 = 27
Database A collection of information organised into distinct headings/fields so that it
can easily be accessed, managed and interrogated.
Diameter A straight line which passes through the centre of a circle, effectively cutting
it in half. Each end of the line will touch the circumference of the circle.

29
Discrete Class Intervals The upper and lower limits for which discrete data is recorded,
for example 1 – 5, 6 – 10, 11 – 15, etc.
Discrete Data Data which can only be of certain definite whole values, for example shoe
sizes or number of people with brown hair.
A straight line formed when two surfaces (faces) of a 3-D shape meet.
EquivalenceWhen two or more numbers have exactly the same value while taking a
different form, for example
Data
The mean can only be estimated when data is provided in a grouped
frequency table. To calculate the estimated mean, the mid-point of each
class interval is multiplied by the frequency for that class interval. A
summation of all these values is performed and the total is divided by the
sum of the frequencies.
(See the llustrations for an example)
The range can only be estimated when data is provided in a grouped
frequency table. To find the estimated range, the mid-point of the smallest
class interval is subtracted from the mid-point for the largest class interval.
A theoretical predicted frequency obtained from an experiment presumed
to be true until statistical evidence in the form of a hypothesis test indicates
otherwise.
For example the probability of getting a four when a die is rolled is .
The expected frequency of getting a four when a die is rolled 30 times is
x 30 = 5 times.
A plane surface enclosed by an edge or edges of a 3-D shape.
A number that divides exactly into another number, leaving no remainder.
For example 4 and 5 are factors of 20 because 20 ÷ 4 = 5
The x and y axes divide a graph into four separate quadrants. The first
quadrant is where all the x and y values are positive, for example
Operations are rules for processing numbers, expressions and formulae.
The four operations referred to here are the basic arithmetic operations,
which are addition, subtraction, multiplication and division. Each of these
operations also has an associated operator, for example +, –, ×, ÷
The x and y axes divide a graph into four separate quadrants.
For example
In the first quadrant all the x and y values are positive.
In the second quadrant all the x values are negative and all the y values
are positive. In the third quadrant all the x values are negative and all the y values are negative. In the fourth quadrant all the x values are positive and
all the y values are negative.
1st
1st2nd
4th3rd
2
10
1
5= = 0.2 = 20%
1
6
1
6

30
A graphical representation of the amount of data found in each of the
categories or types being counted.
The number of observations falling into each of several ranges of values.
Frequency distributions are portrayed using frequency diagrams, such as
pictograms, bar charts or histograms.
A table which displays collected qualitative and quantitative data with their
corresponding frequencies. Grouped frequency tables are used to record
quantitative data (discrete and continuous) in class intervals.
(See the llustrations for an example)
A diagram which is used to show the order in which operations should be
carried out to produce a result, much like a flow diagram. They are used to
solve functions and formulae.
(See the llustrations for an example)
Used on maps as a coordinate system.
(See the llustrations for an example)
A statement which is considered true and used as a starting point when
looking for evidence to support or challenge it.
Interquartile RangeThe range between the lower and upper quartiles for a set of data. It is used
as a measure of dispersion.
For example upper quartile – lower quartile = interquartile range.
Interrogate To obtain information from a source, for example a database, when given
certain criteria.
A shape that is not regular. Not all sides/edges are equal and not all angles
are equal.
(See the llustrations for an example)
angle is greater than 0° and less than 90°
Right angle is one quarter of a full turn: 90°
angle is greater than 90° and less than 180°
Straight angle (same as a straight line) is half of one full turn: 180°
angle is greater than 180° and less than 360°
is the size of an angle that is made by a line which has moved right
around to its starting position: 360°
Language of Line
Vertical lines run from up to down and are straight. They are perpendicular
to horizontal lines.
lines run from left to right and are straight. They are
perpendicular to vertical lines.
lines are straight lines which meet at right angles.
lines remain the same distance apart no matter how far they are
extended.
Language of LocationThe compass points, relative to north, when dividing a circle into eight equal
parts. North (N), South (S), East (E), West (W), North East (NE), South East
(SE), South West (SW) and North West (NW).
The possibility/chance of an event happening. It is measured using the terms
‘impossible’, ‘unlikely’, ‘even chance’, ‘likely’, ‘certain’.
(See the llustrations for an example)
Linear EquationsAn equation which can be represented as a straight line. It does not contain a
squared term or a term with any power greater than one.
For example y = 5x + 2, or y = 1, or 4y – 3x = 7
31
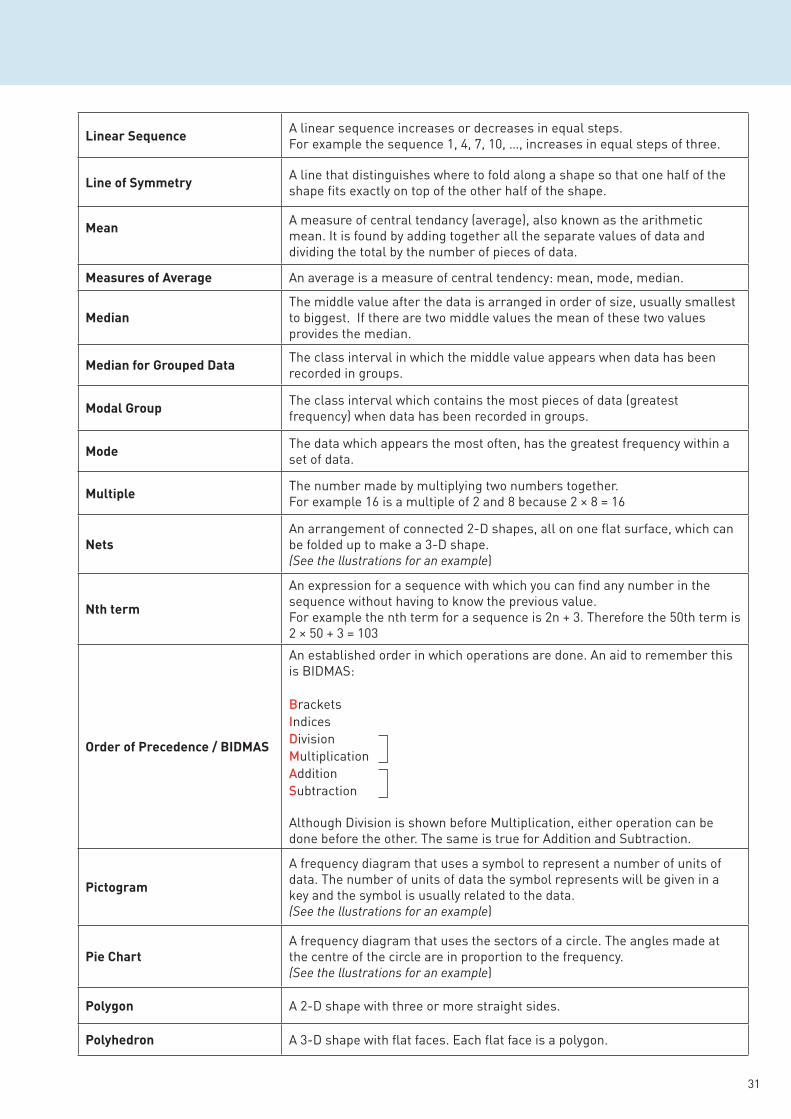
Linear Sequence A linear sequence increases or decreases in equal steps.
For example the sequence 1, 4, 7, 10, …, increases in equal steps of three.
A line that distinguishes where to fold along a shape so that one half of the
shape fits exactly on top of the other half of the shape.
Mean A measure of central tendancy (average), also known as the arithmetic
mean. It is found by adding together all the separate values of data and
dividing the total by the number of pieces of data.
An average is a measure of central tendency: mean, mode, median.
The middle value after the data is arranged in order of size, usually smallest
to biggest. If there are two middle values the mean of these two values
provides the median.
The class interval in which the middle value appears when data has been
recorded in groups.
The class interval which contains the most pieces of data (greatest
frequency) when data has been recorded in groups.
The data which appears the most often, has the greatest frequency within a
set of data.
The number made by multiplying two numbers together.
For example 16 is a multiple of 2 and 8 because 2 × 8 = 16
NetsAn arrangement of connected 2-D shapes, all on one flat surface, which can
be folded up to make a 3-D shape.
(See the llustrations for an example)
Nth term
An expression for a sequence with which you can find any number in the
sequence without having to know the previous value.
For example the nth term for a sequence is 2n + 3. Therefore the 50th term is
2 × 50 + 3 = 103
An established order in which operations are done. An aid to remember this
is BIDMAS:
Brackets
Indices
Division
Multiplication
Addition
Subtraction
Although Division is shown before Multiplication, either operation can be
done before the other. The same is true for Addition and Subtraction.
A frequency diagram that uses a symbol to represent a number of units of
data. The number of units of data the symbol represents will be given in a
key and the symbol is usually related to the data.
(See the llustrations for an example)
A frequency diagram that uses the sectors of a circle. The angles made at
the centre of the circle are in proportion to the frequency.
(See the llustrations for an example)
A 2-D shape with three or more straight sides.
A 3-D shape with flat faces. Each flat face is a polygon.

32
A number with only two factors, itself and one.
For example 17 is a prime number because the only factors of 17 are 17 and 1
A polyhedron with two identical faces, that are parallel to one another and
found at each end. Prisms are named after the polygon that makes up the
face at each end, for example triangular prism and pentagonal prism.
2-D shapes that have four straight sides. All four internal angles add up to
360°
(See the llustrations for an example)
2-D shapes that have three straight sides. All three internal angles add up to
180°
(See the llustrations for an example)
The comparative relationship between elements with respect to size. If
two variables are in proportion, then as one variable gets larger the other
variable will also get larger and vice versa.
The median is considered to be the middle quartile as it is the 50th percentile
for a set of data.
The 25th percentile for a set of data is called the lower quartile.
The 75th percentile for a set of data is called the upper quartile.
A collection of questions used to gather information from a group or
population.
A straight line drawn from the centre of a circle to the circumference of the
circle.
Range The difference between the largest value and the smallest value from a set of
data. For example the range for the data 6, 2, 9 and 4 is 7 because 9 – 2 = 7
Putting a set of data into ascending or descending order.
RatioUsed to compare the sizes of two or more quantities.
For example to make orange juice you mix 1 part cordial with 20 parts water.
It can be said that the ratio of cordial to water is 1: 20
A shape that has all sides/edges of equal length and all the internal angles
are of equal size.
(See the llustrations for an example)
The relative frequency (also known as experimental probability) of an
outcome is the value found after an activity has taken place and is given by:
Increases or decreases an amount by a percentage more than once. Any
further change takes account of the previous calculated change, such as
compound interest.
Scale When drawing a map or a diagram, the scale is the representation of 1 cm on
the map or diagram to the actual length/height.
The value by which a shape or object has been, or is to be, enlarged or
reduced by.
For example a scale factor of 3 will make a shape or object three times bigger.
A scale factor of will make a shape or object three times smaller.
number of times the outcome occurred
number of times the activity was done
1
3
33
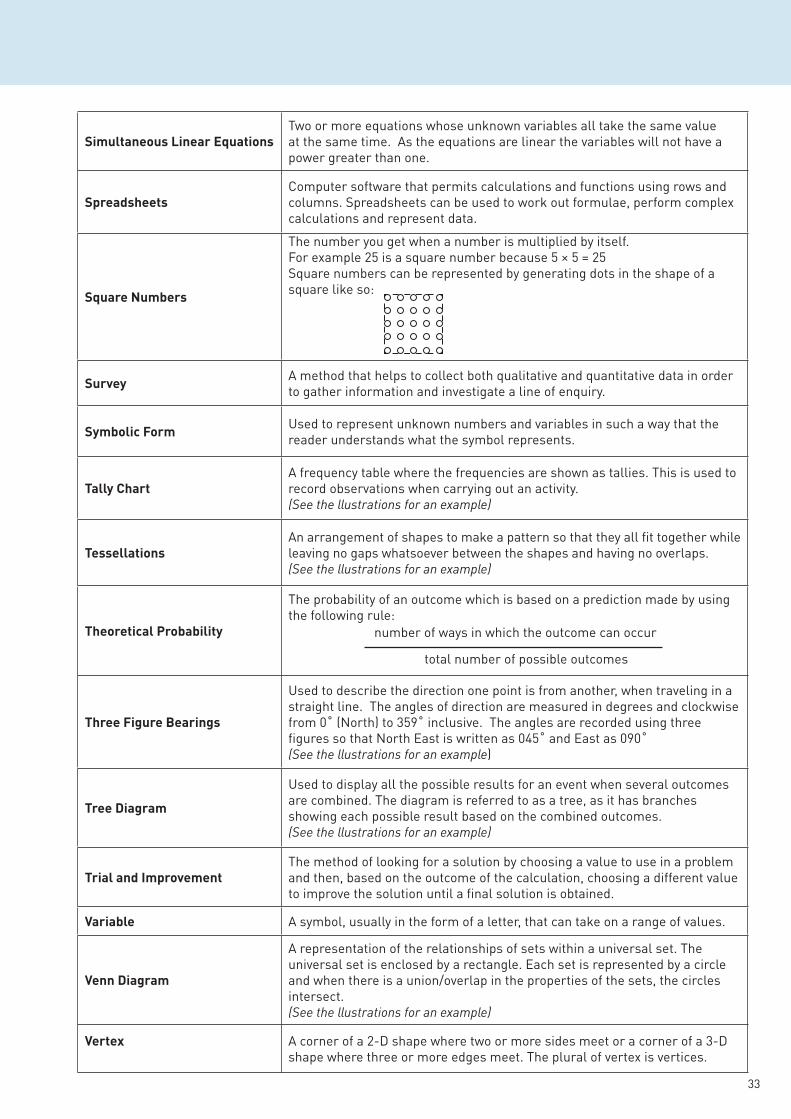
Simultaneous Linear EquationsTwo or more equations whose unknown variables all take the same value
at the same time. As the equations are linear the variables will not have a
power greater than one.
Computer software that permits calculations and functions using rows and
columns. Spreadsheets can be used to work out formulae, perform complex
calculations and represent data.
Square Numbers
The number you get when a number is multiplied by itself.
For example 25 is a square number because 5 × 5 = 25
Square numbers can be represented by generating dots in the shape of a
square like so:
A method that helps to collect both qualitative and quantitative data in order
to gather information and investigate a line of enquiry.
Used to represent unknown numbers and variables in such a way that the
reader understands what the symbol represents.
A frequency table where the frequencies are shown as tallies. This is used to
record observations when carrying out an activity.
(See the llustrations for an example)
An arrangement of shapes to make a pattern so that they all fit together while
leaving no gaps whatsoever between the shapes and having no overlaps.
(See the llustrations for an example)
The probability of an outcome which is based on a prediction made by using
the following rule:
Used to describe the direction one point is from another, when traveling in a
straight line. The angles of direction are measured in degrees and clockwise
from 0˚ (North) to 359˚ inclusive. The angles are recorded using three
figures so that North East is written as 045˚ and East as 090˚
(See the llustrations for an example)
Used to display all the possible results for an event when several outcomes
are combined. The diagram is referred to as a tree, as it has branches
showing each possible result based on the combined outcomes.
(See the llustrations for an example)
The method of looking for a solution by choosing a value to use in a problem
and then, based on the outcome of the calculation, choosing a different value
to improve the solution until a final solution is obtained.
Variable A symbol, usually in the form of a letter, that can take on a range of values.
Venn Diagram
A representation of the relationships of sets within a universal set. The
universal set is enclosed by a rectangle. Each set is represented by a circle
and when there is a union/overlap in the properties of the sets, the circles
intersect.
(See the llustrations for an example)
A corner of a 2-D shape where two or more sides meet or a corner of a 3-D
shape where three or more edges meet. The plural of vertex is vertices.
number of ways in which the outcome can occur
total number of possible outcomes

34
Illustrations Level 1
Carroll DiagramPupils sort and classify cars and not cars using a Carroll diagram.
Pupils map their favourite park activity to their name.
Kim
Anna
Seamus
Nadeem
David
Ciara
Climbing

Level 1
35
Venn DiagramPupils sort and classify cars and not cars using a Venn diagram.
Pupils sort and classify cars and not cars using a Tree diagram.

36
Illustrations Level 2
Pupils complete a block graph showing the favourite colour for each pupil in their class.
Colour
Blue
Yellow
Green
Red
1 2 3 4
Number of Pupils
Level 2
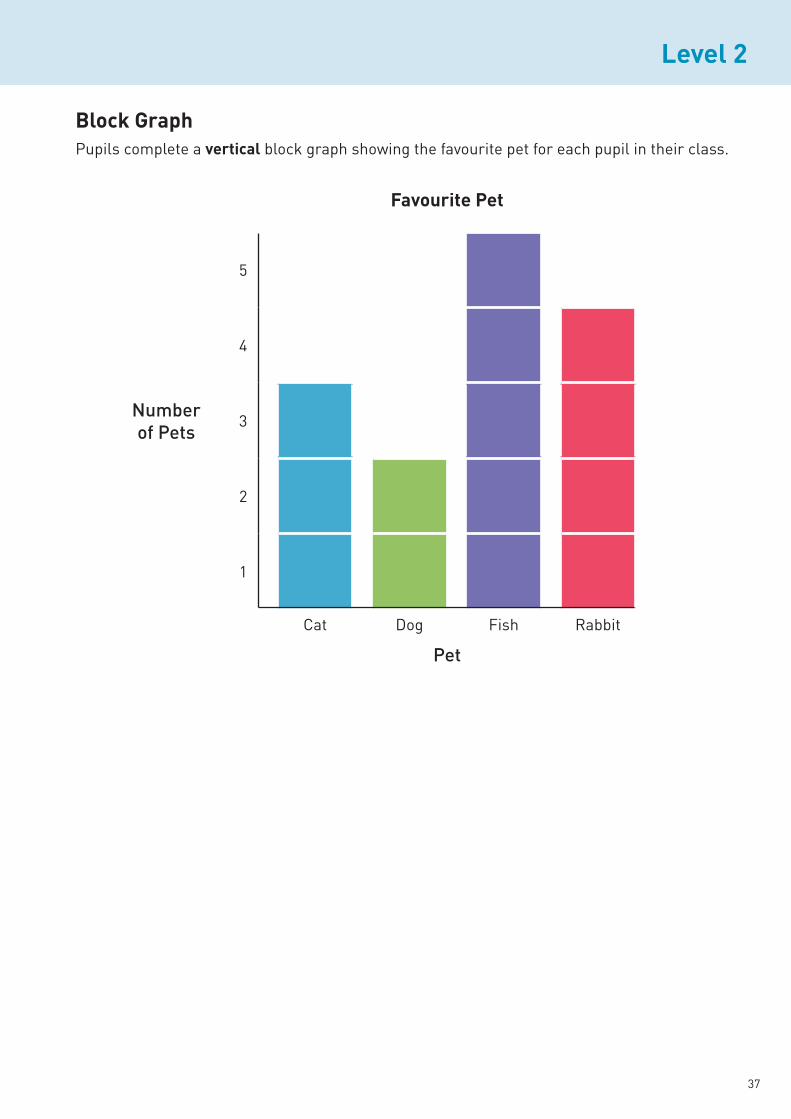
37
Pupils complete a vertical block graph showing the favourite pet for each pupil in their class.
Number
of Pets
5
4
3
2
1
Cat Dog Fish Rabbit
Pet

38
Level 2
Pupils sort and classify squares and not squares, and yellow and not yellow using a Carroll diagram.
Square
Square
Pupils colour one half or one quarter of a shape.
Pupils select a diagram where one half or one quarter of the shape is shaded.
Carroll Diagram

Level 2
39
Pupils complete a pictogram with a key, where the symbol represents one object, and discuss
information from the pictogram.
= 1 girl
Pupils read information from simple tables.
B
C
Girls Using the Breakfast Club
Number of Girls

40
Level 2
Pupils sort and classify children who walk to school or don’t walk and who are late or not late
using a Tree diagram.
Alan,Zoe
CallumAoife,Matt
Lily-Rose,Paddy
Walk Not Walk
Late LateNot Late Not Late
Venn DiagramPupils sort and classify for children who play football, play tennis and play football and tennis
using a Venn diagram.
Niamh
Ellie
Connor
Steve
Kate Mark
41
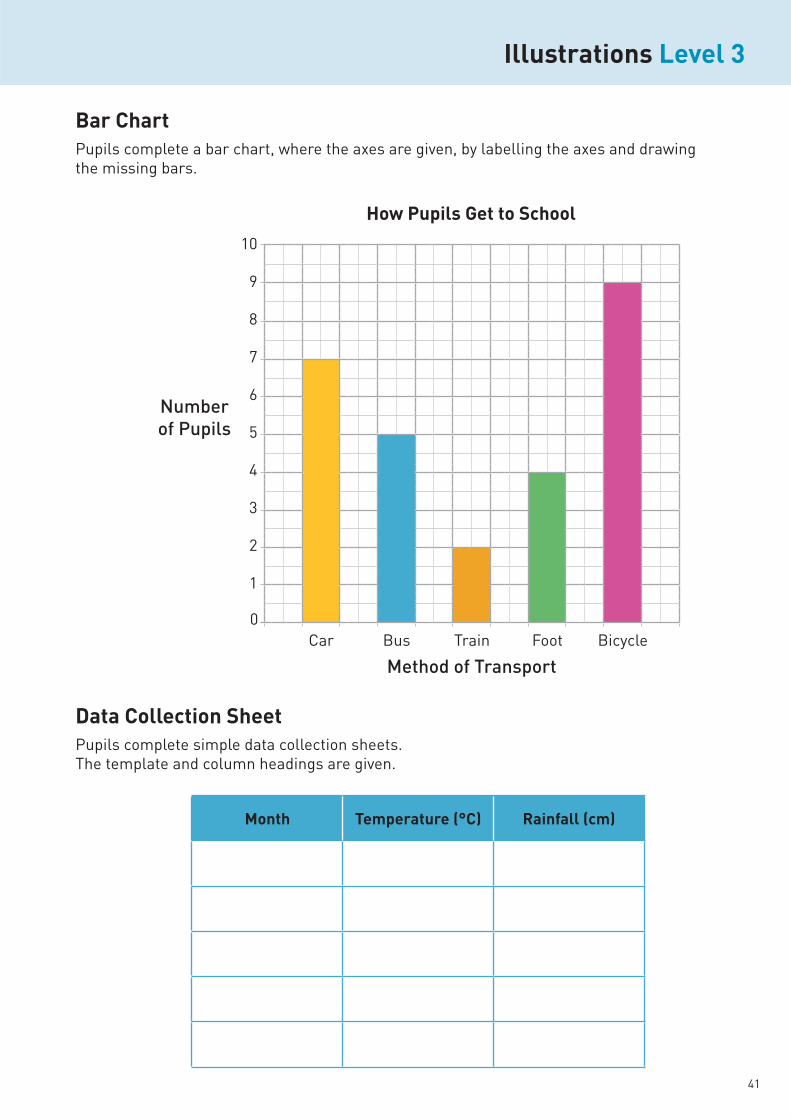
Bar ChartPupils complete a bar chart, where the axes are given, by labelling the axes and drawing
the missing bars.
Data Collection SheetPupils complete simple data collection sheets.
The template and column headings are given.
Month
10
9
8
7
6
5
4
3
2
1
Method of Transport
Car Bus Train Foot Bicycle
Number
of Pupils
Illustrations
0
Illustrations

42
Pupils use a tally chart and complete a further column to show the frequencies.
Column headings are given.
14
1 5
2 8
3
Pupils can locate points of interest on a map using a grid, where the grid is provided and labelled.
5
4
3
2
1
A B C D E
43
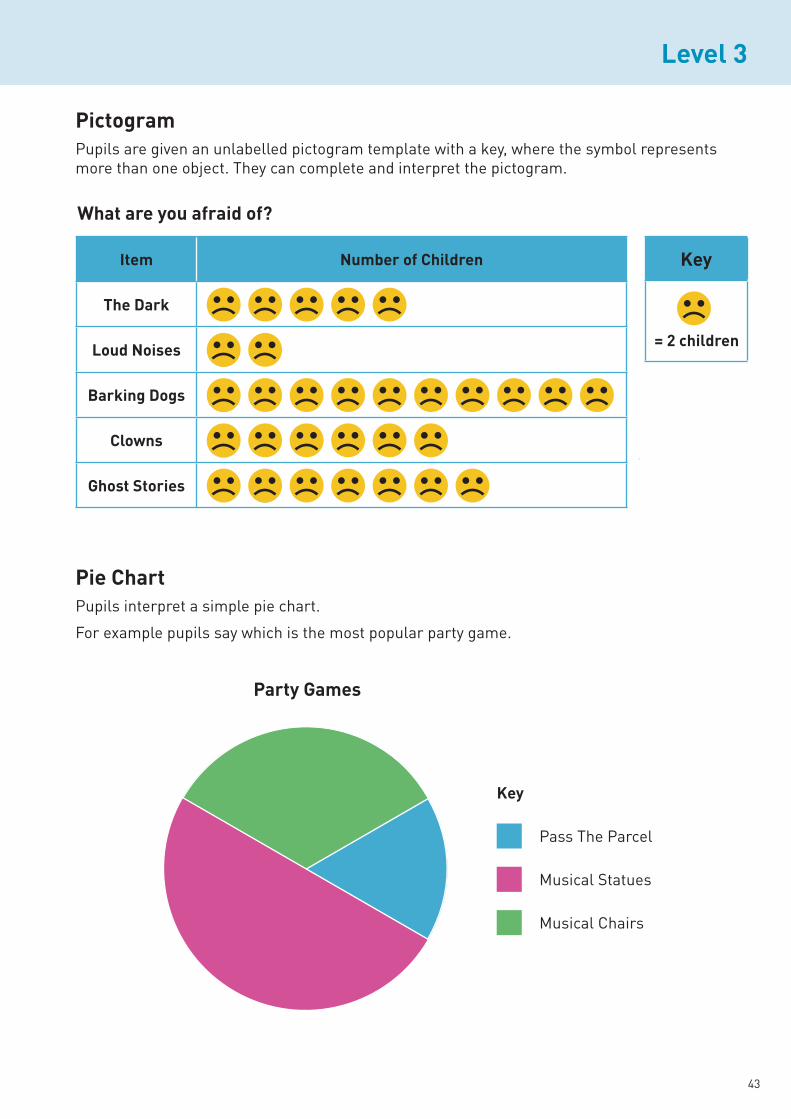
Pupils are given an unlabelled pictogram template with a key, where the symbol represents
more than one object. They can complete and interpret the pictogram.
Pupils interpret a simple pie chart.
For example pupils say which is the most popular party game.
Pass The Parcel
Musical Statues
Musical Chairs
Item
Barking Dogs
Ghost Stories

44
Pupils interpret a simple database/table.
For example pupils list the animals that are mammals.
Lives
Grizzly Bear Mammal North America
Fruit Bat Mammal Asia
Green Lizard Reptile Europe
Alligator Reptile North America
Pupils recognise one line of symmetry on common 2-D shapes.
No Symmetry
No Symmetry
45
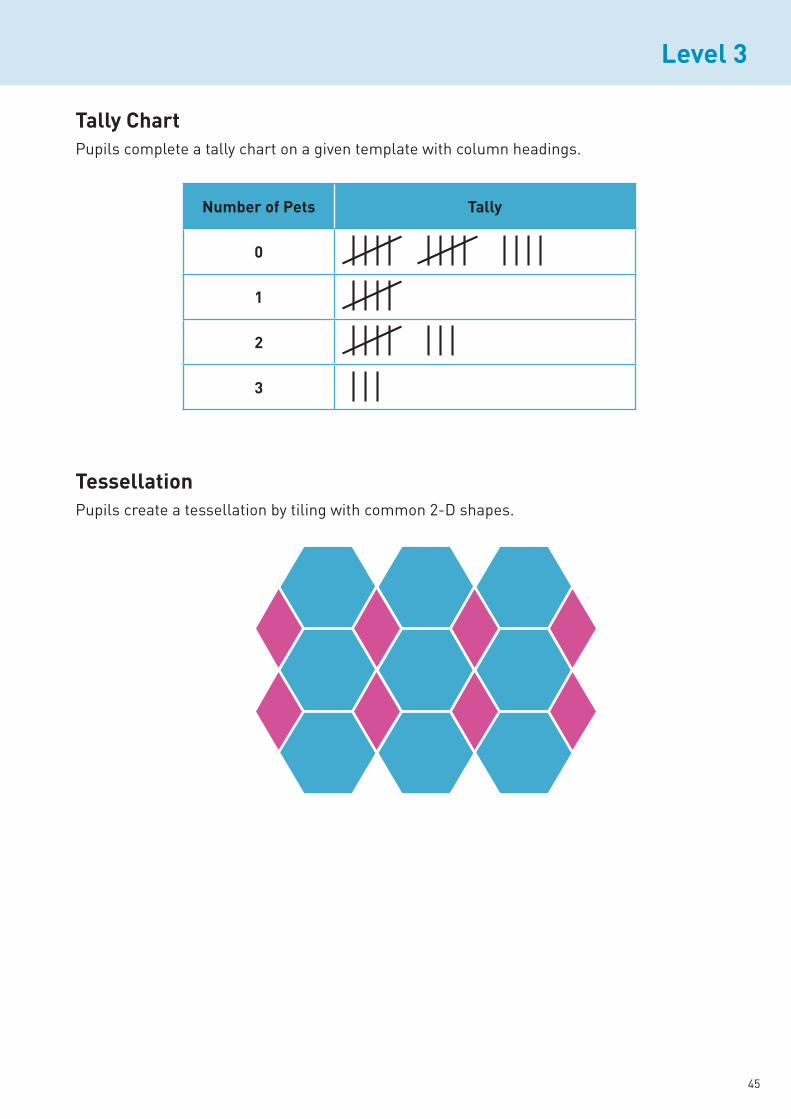
Pupils complete a tally chart on a given template with column headings.
1
2
Pupils create a tessellation by tiling with common 2-D shapes.

46
Illustrations
Bar Chart
Pupils present their own bar chart by drawing and labelling their own axes and drawing the bars.
(Axes are not given).
Small Medium Large Extra Large
90
80
70
60
50
40
30
20
10
0
Fre
qu
en
cy
T-Shirt Size

47
Bar Chart
Pupils are given the class intervals. Pupils then draw and label their own axes and draw the bars.
(Axes are not given).
51 – 60 61 – 70 71 – 80 81 – 90 91 – 100
25
20
15
10
5
0
Fre
qu
en
cy
Heart Rate (beats per minute)
48
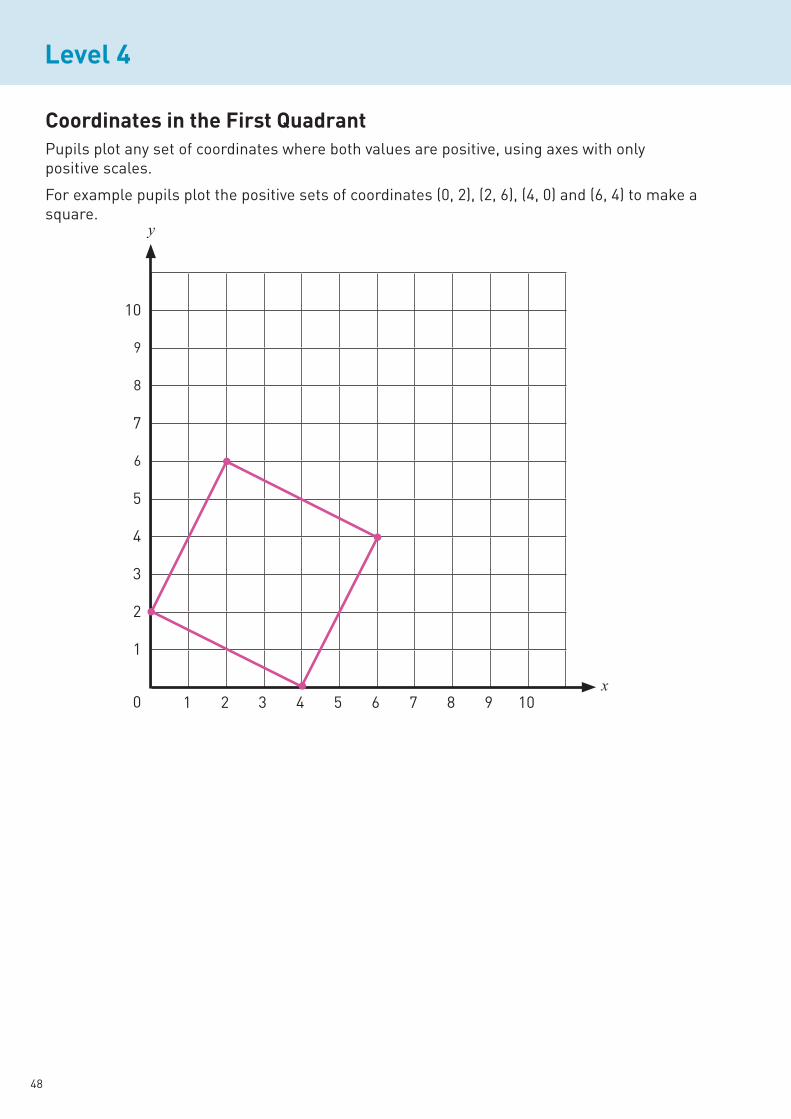
Pupils plot any set of coordinates where both values are positive, using axes with only
positive scales.
For example pupils plot the positive sets of coordinates (0, 2), (2, 6), (4, 0) and (6, 4) to make a
square.
x
y
10
9
8
7
6
5
4
3
2
1
0 1 2 3 4 5 6 7 8 9 10
49
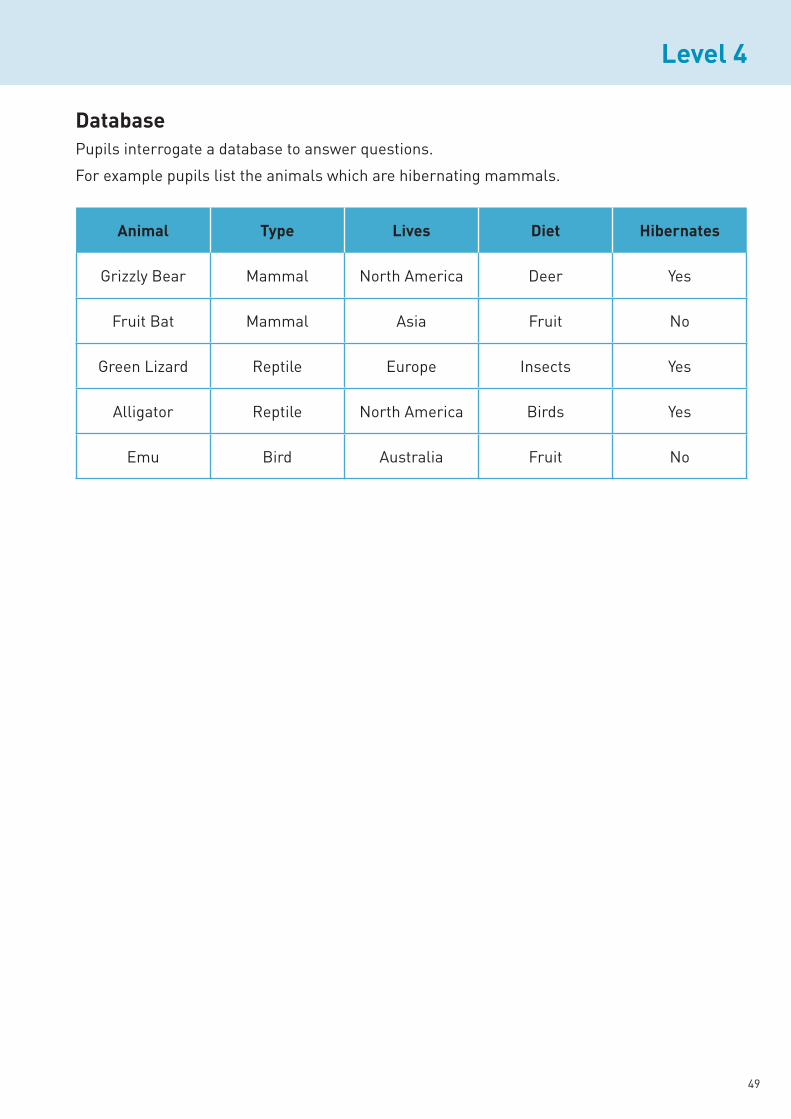
DatabasePupils interrogate a database to answer questions.
For example pupils list the animals which are hibernating mammals.
Lives Diet Hibernates
Grizzly Bear Mammal North America Deer Yes
Fruit Bat Mammal Asia Fruit No
Green Lizard Reptile Europe Insects Yes
Alligator Reptile North America Birds Yes
Emu Bird Australia Fruit No

50
Pupils sort using a Decision Tree diagram.
For example pupils decide which of the following numbers are a factor of 60 and/or a
multiple of 4.
10 16 20 25
Start
Is the
number a
multiple
of 4?
Is the
number a
factor
of 60?
Is the
number a
factor
of 60?
20
16
25
10
Yes
No
No
Yes
No
Yes
NB: Although the second question (Is the number a factor of 60?) is the same on each branch of
this Decision Tree diagram, these questions do not have to be the same.

51
Pupils use a function machine to apply rules in order to find solutions.
36
60
Multiply by 15
Input
Output
Divideby 9
52
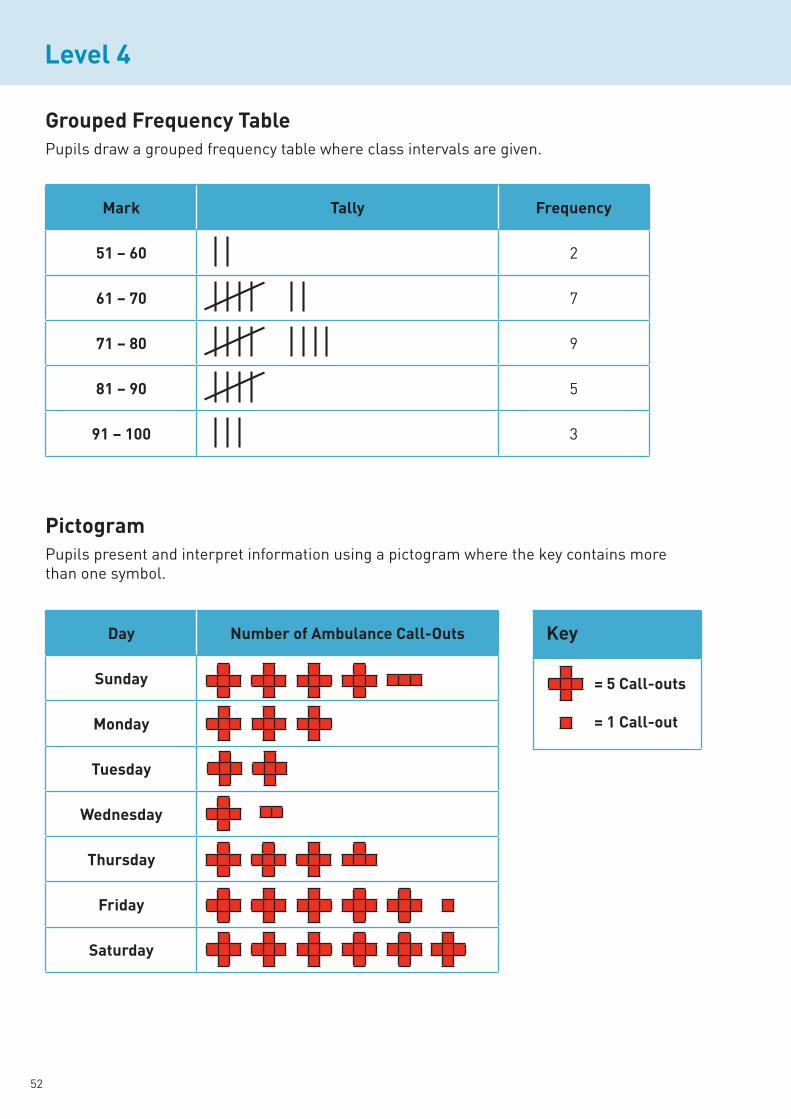
Pupils draw a grouped frequency table where class intervals are given.
Mark
2
7
9
5
3
Pupils present and interpret information using a pictogram where the key contains more
than one symbol.
= 1 Call-out
53
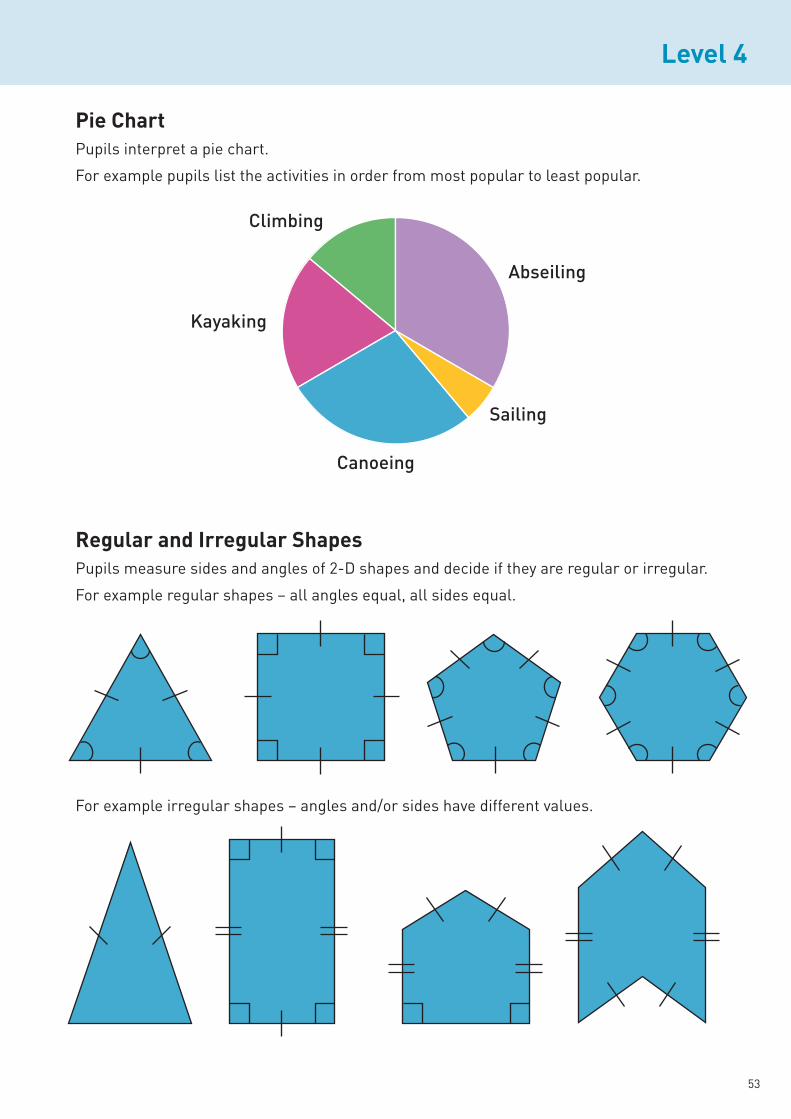
Pupils measure sides and angles of 2-D shapes and decide if they are regular or irregular.
For example regular shapes – all angles equal, all sides equal.
For example irregular shapes – angles and/or sides have different values.
Pupils interpret a pie chart.
For example pupils list the activities in order from most popular to least popular.
Abseiling
Climbing
Kayaking
Canoeing
Sailing

54
Pupils draw more than one line of symmetry on a variety of 2-D shapes.
No symmetry
55
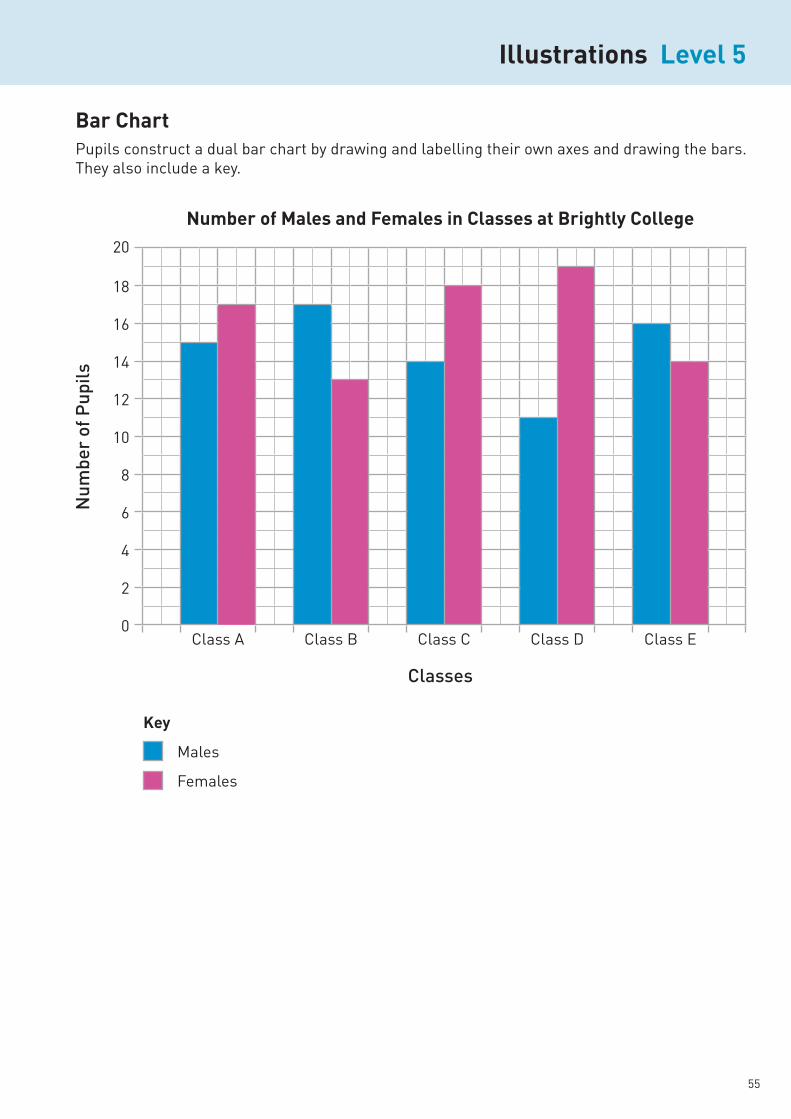
Bar ChartPupils construct a dual bar chart by drawing and labelling their own axes and drawing the bars.
They also include a key.
Illustrations
Class A Class B Class C Class D Class E
Classes
20
18
16
14
12
10
8
6
4
2
0
Nu
mb
er
of
Pu
pil
s
Males
Females
Illustrations

56
Data Collection SheetPupils design and use their own data collection sheet.
DateCurrent
High
Direction
57
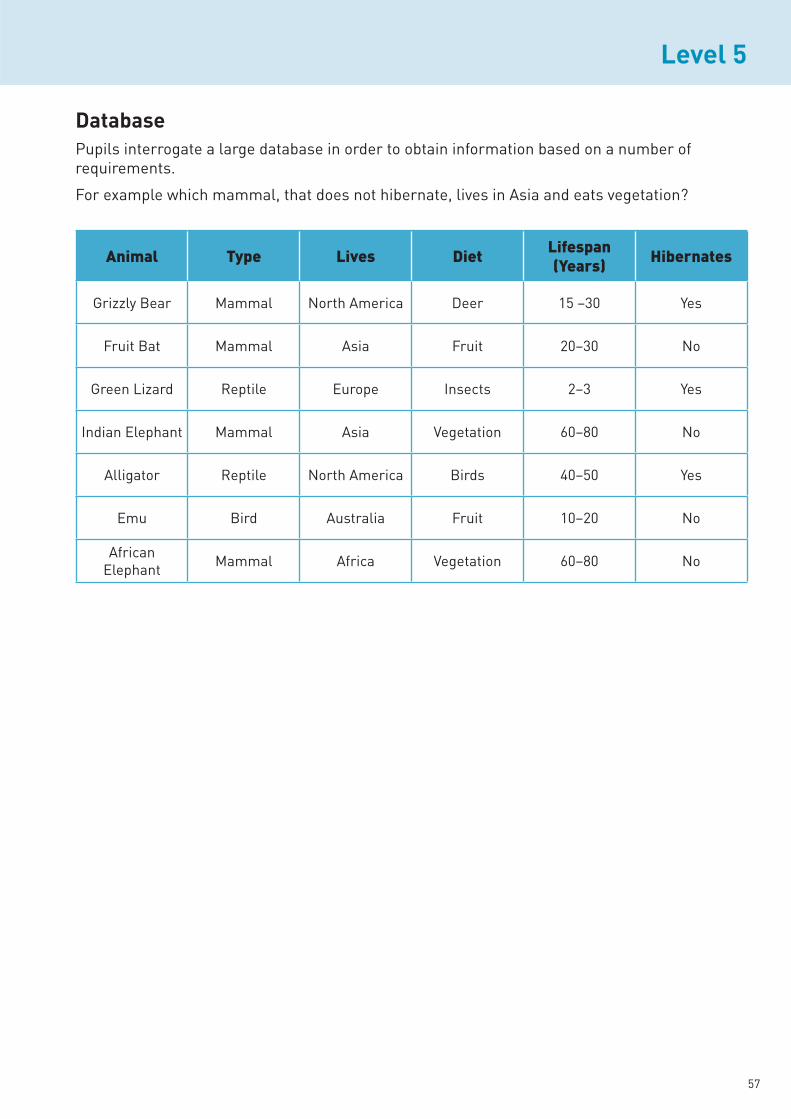
DatabasePupils interrogate a large database in order to obtain information based on a number of
requirements.
For example which mammal, that does not hibernate, lives in Asia and eats vegetation?
Animal Type Lives Diet Lifespan (Years) Hibernates
Grizzly Bear Mammal North America Deer 15 –30 Yes
Fruit Bat Mammal Asia Fruit 20–30 No
Green Lizard Reptile Europe Insects 2–3 Yes
Indian Elephant Mammal Asia Vegetation 60–80 No
Alligator Reptile North America Birds 40–50 Yes
Emu Bird Australia Fruit 10–20 No
African
ElephantMammal Africa Vegetation 60–80 No
58
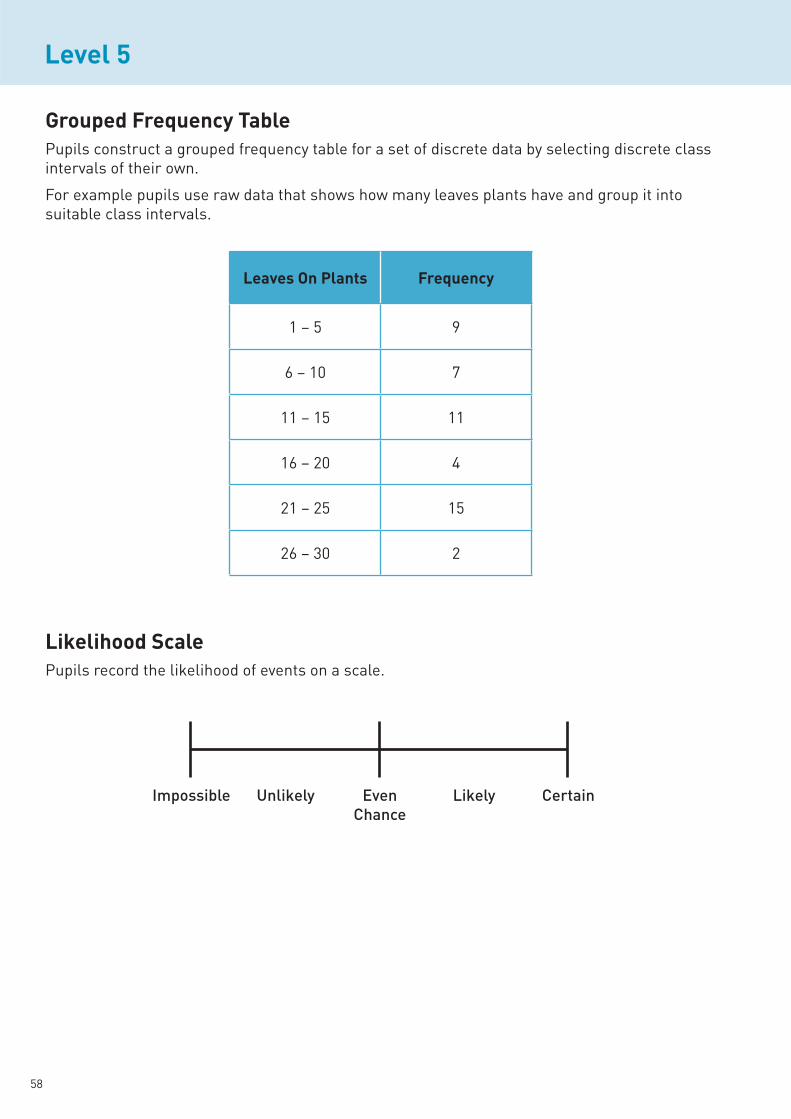
Pupils construct a grouped frequency table for a set of discrete data by selecting discrete class
intervals of their own.
For example pupils use raw data that shows how many leaves plants have and group it into
suitable class intervals.
1 – 5 9
6 – 10 7
11 – 15 11
16 – 20 4
21 – 25 15
26 – 30 2
Pupils record the likelihood of events on a scale.
Impossible Unlikely Even
Chance
Likely Certain

59
Pupils draw a line graph to present information. They draw their own axes using their own
scale and include their own title and labels.
50
45
40
35
30
25
20
15
10
5
02001 2002 2003 2004 2005 2006 2007 2008 2009 2010
Year
Nu
mb
er
of
Ap
pli
ca
nts
(in
th
ou
sa
nd
s)
Pe
r Ye
ar
x
y
60
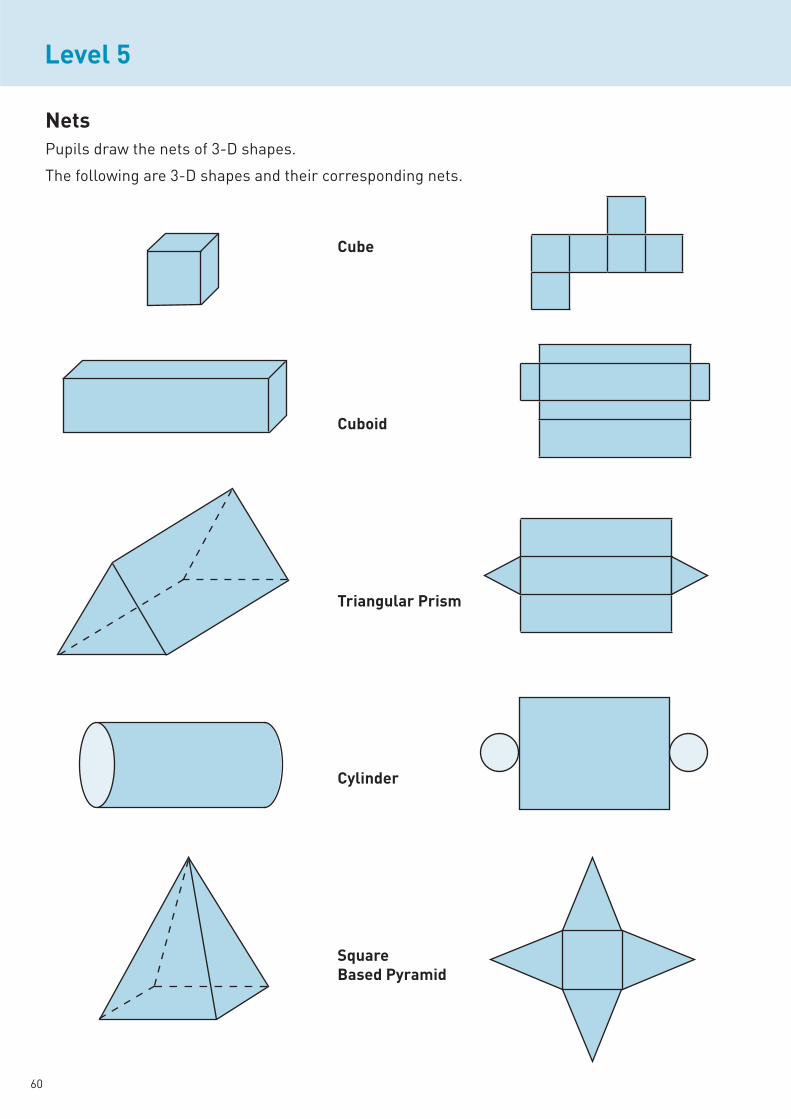
NetsPupils draw the nets of 3-D shapes.
The following are 3-D shapes and their corresponding nets.
Cube
Square

61
Pupils complete a pie chart with sectors given to present and interpret data.
Cabbage
Sweetcorn
Peas
Leeks
Pupils describe the properties of 3-D shapes in terms of faces, edges and vertices.
Vertices
6 12 8
5 9 6
5 8 5
4 6 4

62
Pupils describe the properties of different quadrilaterals using appropriate terminology.
▲ ▲
▲ ▲▲ ▲
▲ ▲
▲ ▲▲ ▲
▲▲
Square
Rectangle
Rhombus
▲
▲ ▲
▲ ▲
▲
▲
▲ ▲
▲ ▲
▲
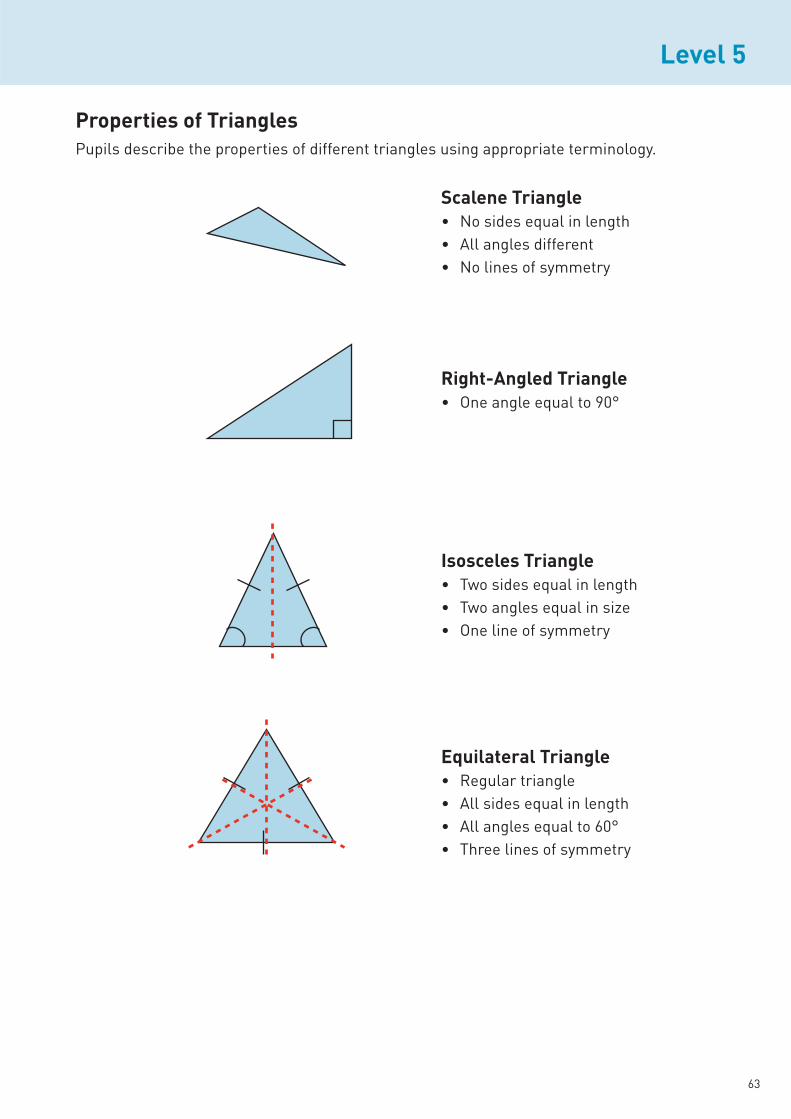
63
Pupils describe the properties of different triangles using appropriate terminology.

64
Pupils reflect shapes in a vertical, horizontal or diagonal line.
For example the blue object shapes are reflected to give the green image shapes.

65
Pupils input data into a spreadsheet. They input simple formulae to calculate results.
For example pupils input formula into a spreadsheet to calculate babysitting wages over a four
week period, where the rate is £5 an hour.
(the above formula will generate the following results)
B C D E G H I K L
1 Week Mon Tues Wed Thur Fri Sat Sun Total Hours Pay
2 1 0 4 1 2 6 6 0 =SUM(B2:H2) =J2*5
2 1 2 4 1 5.5 7 0 =SUM(B3:H3) =J3*5
3 0 2.5 1 1 4 5 0 =SUM(B4:H4) =J4*5
4 3 1 2 4 3.5 6 0 =SUM(B5:H5) =J5*5
7 Total Pay =SUM(L2:L5)
B C D E G H I K L
1 Week Mon Tues Wed Thur Fri Sat Sun Total Hours Pay
2 1 0 4 1 2 6 6 0 19 £95.00
2 1 2 4 1 5.5 7 0 20.5 £102.50
3 0 2.5 1 1 4 5 0 13.5 £67.50
4 3 1 2 4 3.5 6 0 19.5 £97.50
7 Total Pay £362.50
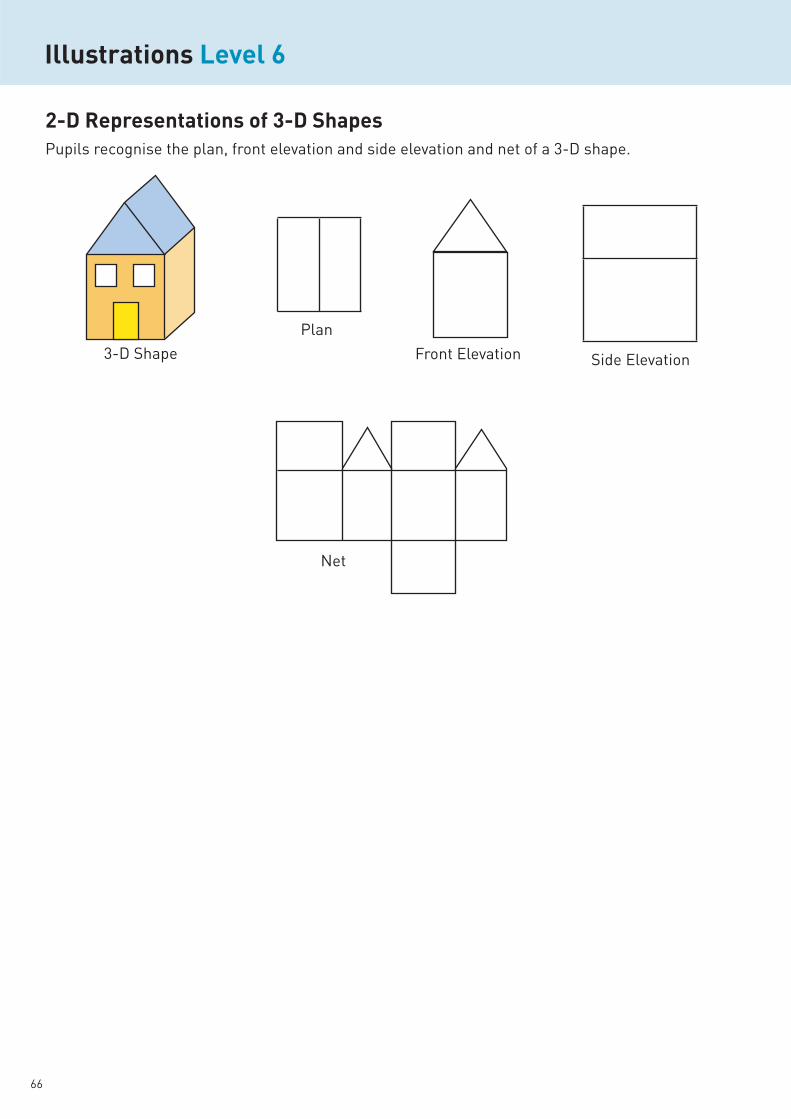
66
Illustrations
Pupils recognise the plan, front elevation and side elevation and net of a 3-D shape.
3-D Shape
Plan
Front Elevation Side Elevation
Net

67
Pupils calculate the mean for quantitative data recorded in a frequency table.
For example pupils calculate the mean number of goals scored by a football team over 38 matches.
To calculate the mean the total for the column the total for the column
mean = 76 ÷ 38 = 2 goals
0 5 0 × 5 = 0
1 9 1 × 9 = 9
2 8 2 × 8 = 16
3 13 3 × 13 = 39
4 3 4 × 3 = 12
Total 38 76

68
Pupils calculate the area of composite 2-D shapes by splitting the shape into two or
more common 2-D shapes.
For example pupils calculate the area and perimeter of this patio.
Pupils calculate the volume of composite 3-D shapes by splitting the shape into two or
more cubes/cuboids.
For example pupils calculate the volume of this steel container.
11 m
2.8 m
4.5 m
3.2 m
45 cm
1.3 m
64 cm
37 cm
52 cm
52 cm
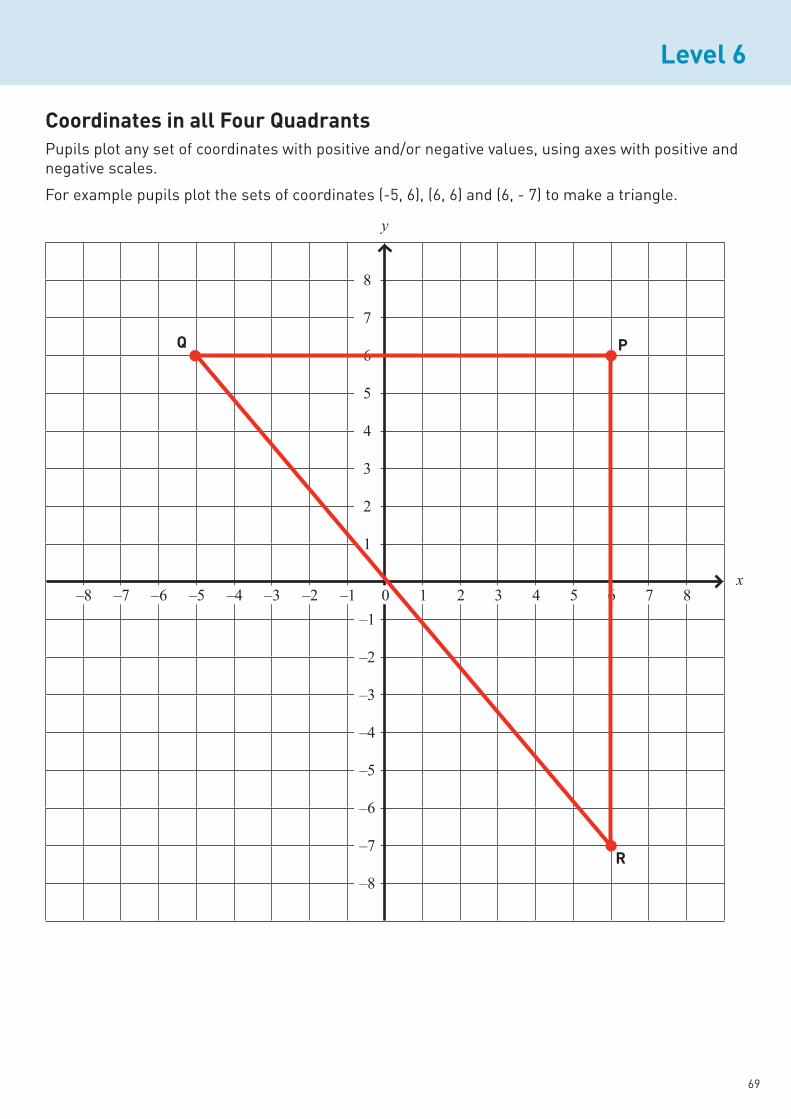
69
Pupils plot any set of coordinates with positive and/or negative values, using axes with positive and
negative scales.
For example pupils plot the sets of coordinates (-5, 6), (6, 6) and (6, - 7) to make a triangle.
–5–6–7–8 –4 –3 –2 –1 0 1 2 3 4 5 6 7 8
5
6
7
8
4
3
2
1
–1
–2
–3
–4
–5
–6
–7
–8
y
x
R
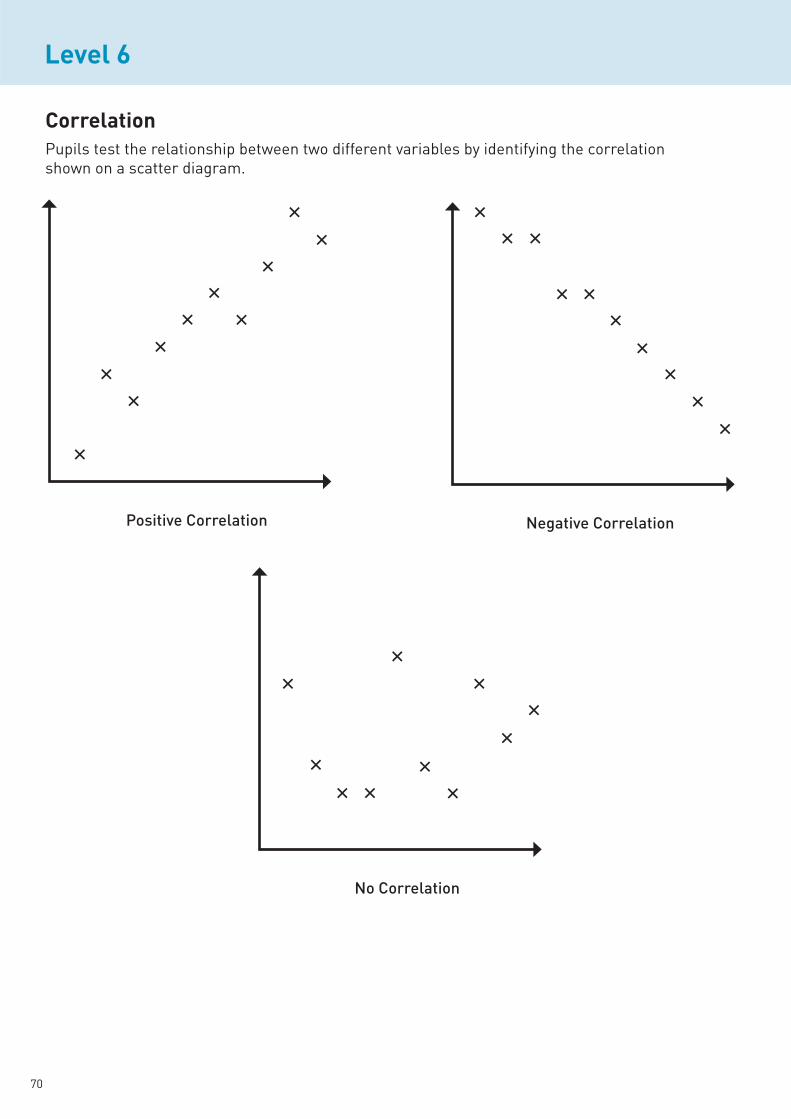
70
CorrelationPupils test the relationship between two different variables by identifying the correlation
shown on a scatter diagram.
×
××
××
××
××
×
Positive Correlation
× ×× ×
×
××
××
×
No Correlation
×
××
×
×××
×××
Negative Correlation
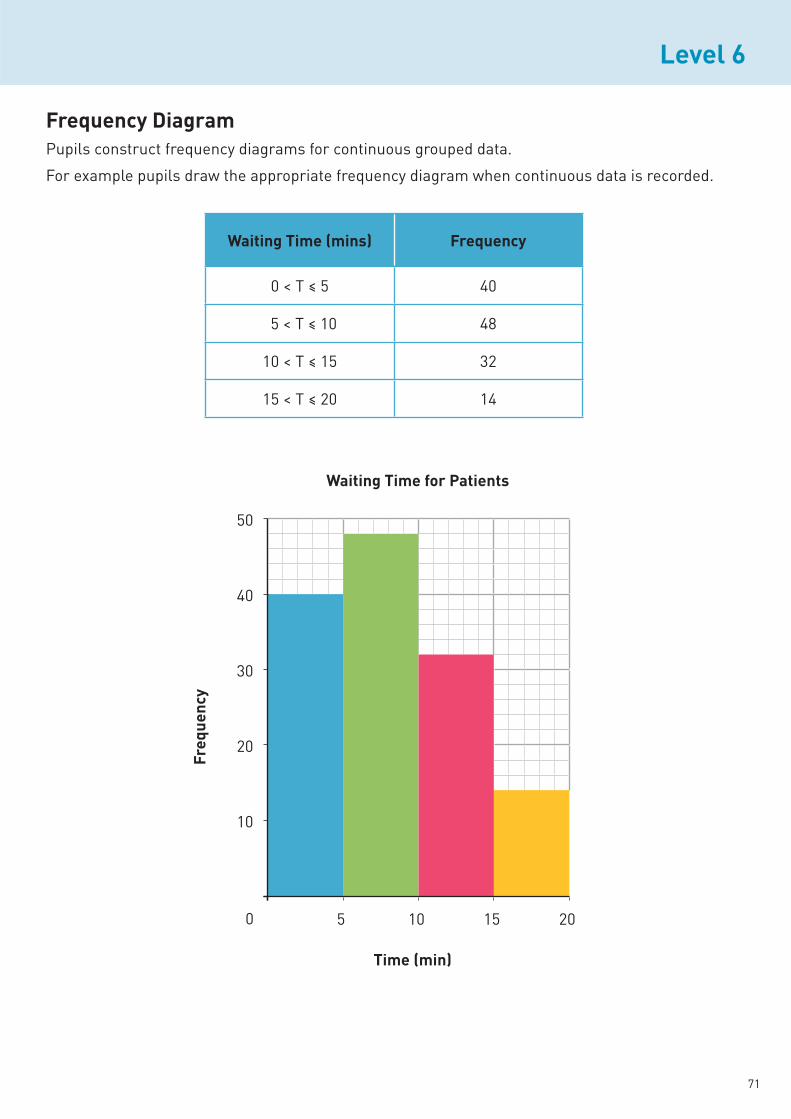
71
Pupils construct frequency diagrams for continuous grouped data.
For example pupils draw the appropriate frequency diagram when continuous data is recorded.
0 < T ≤ 5 40
5 < T ≤ 10 48
10 < T ≤ 15 32
15 < T ≤ 20 14
40
50
30
20
10
5 10 15 200

72
Pupils draw and interpret line graphs from real situations.
240
220
200
180
160
140
120
100
80
60
40
20
07 am 8 am 9 am 10 am 11 am 12 pm 1 pm 2 pm 3 pm 4 pm
Time (hr)
Dis
tan
ce (
km
)
5 pm
x
y

73
Pupils draw a pie chart by working out the size of the angle for each sector that
represents the associated frequency.
Under 12 80 40°
12 – 18 160 80°
19 – 65 400 200°
Over 65 80 40°
Under 12
12 – 18
19 – 65
Over 65
40°40°
80°200°
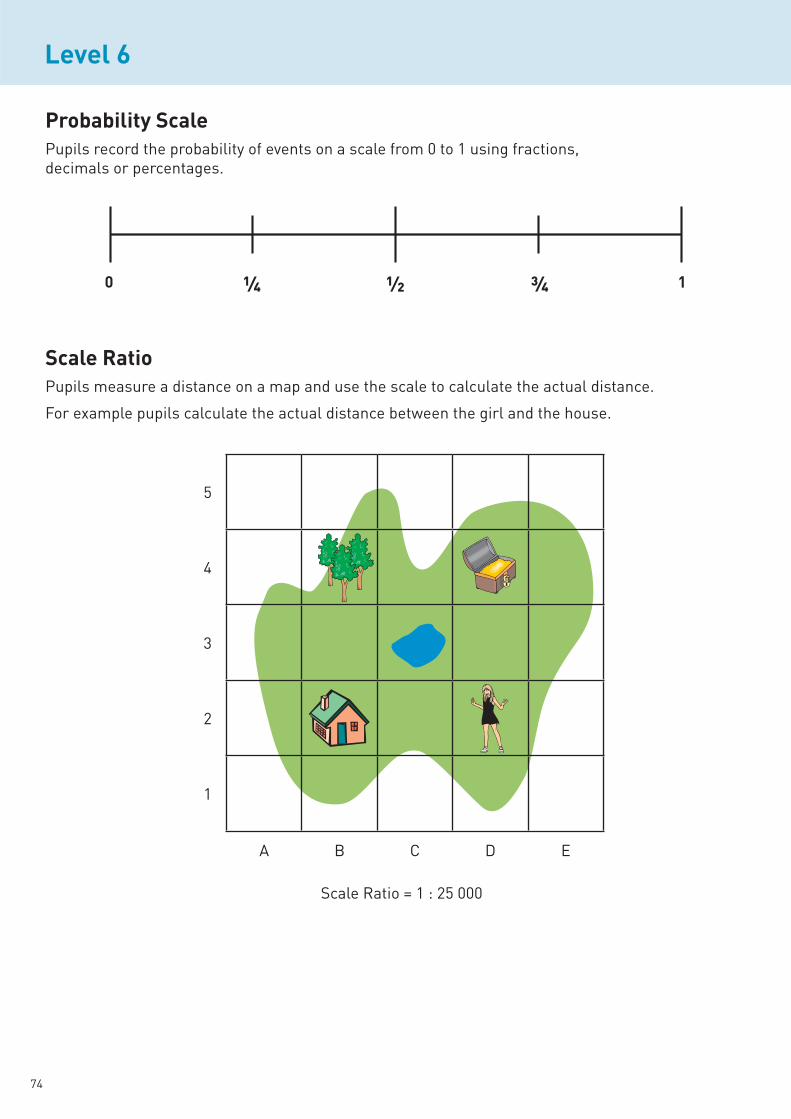
74
¼ ½ ¾ 1
Pupils record the probability of events on a scale from 0 to 1 using fractions,
decimals or percentages.
Scale RatioPupils measure a distance on a map and use the scale to calculate the actual distance.
For example pupils calculate the actual distance between the girl and the house.
Scale Ratio = 1 : 25 000
5
4
3
2
1
A B C D E
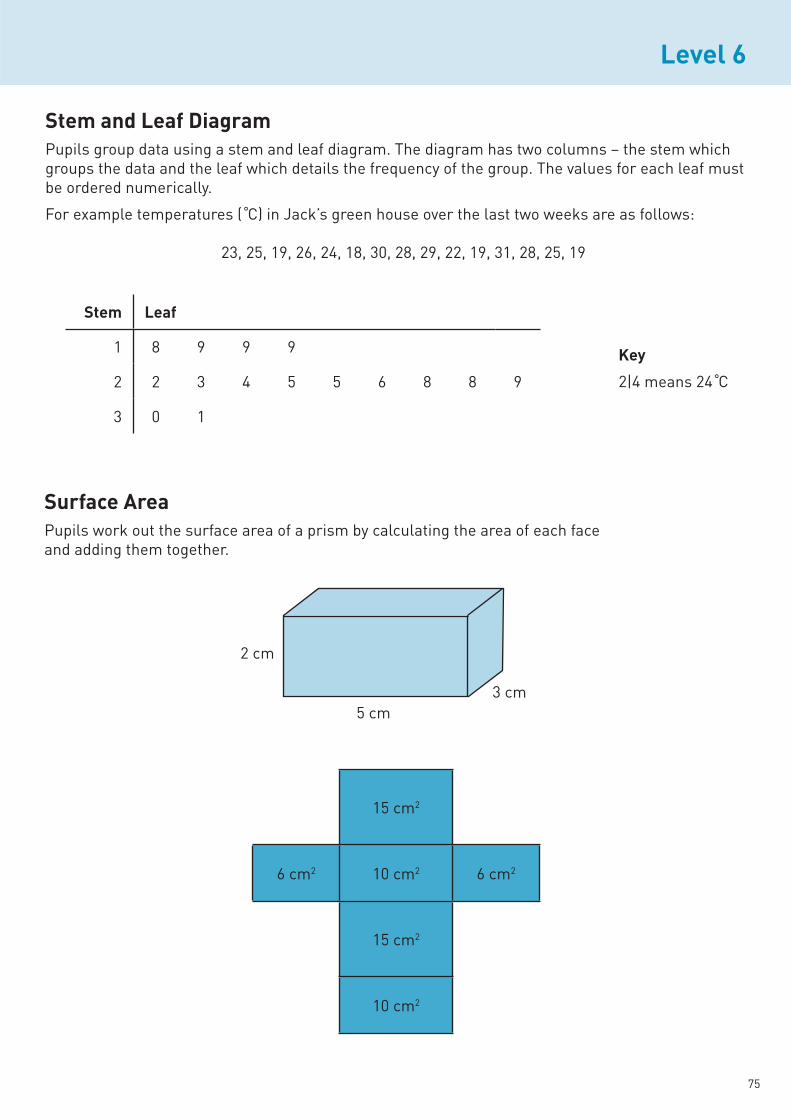
75
Pupils group data using a stem and leaf diagram. The diagram has two columns – the stem which
groups the data and the leaf which details the frequency of the group. The values for each leaf must
be ordered numerically.
For example temperatures ( C̊) in Jack’s green house over the last two weeks are as follows:
23, 25, 19, 26, 24, 18, 30, 28, 29, 22, 19, 31, 28, 25, 19
Stem Leaf
1 8 9 9 9
2 2 3 4 5 5 6 8 8 9
3 0 1
Pupils work out the surface area of a prism by calculating the area of each face
and adding them together.
5 cm
3 cm
2 cm
15 cm2
6 cm2 10 cm2 6 cm2
15 cm2
10 cm2
2|4 means 24 C̊

76
Illustrations Level 7
Pupils use the data from a cumulative frequency table and construct a cumulative
frequency graph. Using the graph they can estimate the quartiles and draw a box plot.
20
18
16
14
12
10
8
6
4
2
Cu
mu
lati
ve F
req
ue
nc
y
5 10 15 20 25 30 35 40 45 50
Distance (m)
10 m 22 m 27 m 32.5 m 50 m
Lower Quartile is 22 m
Middle Quartile (median) is 27 m
Upper Quartile is 32.5 m
Interquartile range = Upper Quartile – Lower Quartile = 32.5 m – 22 m = 10.5 m
x
y
0
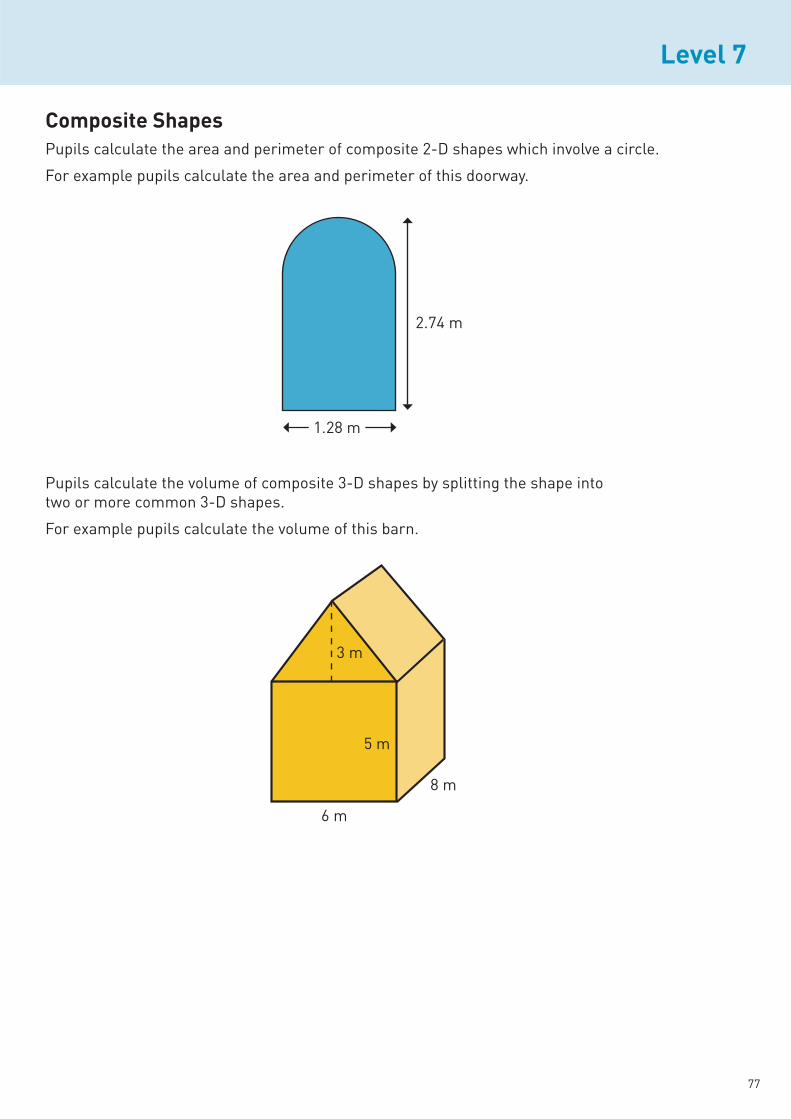
Level 7
77
Level 7
Pupils calculate the area and perimeter of composite 2-D shapes which involve a circle.
For example pupils calculate the area and perimeter of this doorway.
1.28 m
2.74 m
Pupils calculate the volume of composite 3-D shapes by splitting the shape into
two or more common 3-D shapes.
For example pupils calculate the volume of this barn.
3 m
5 m
8 m
6 m
Level 7

78
Level 7
Pupils use the data from a cumulative frequency table and construct a cumulative
frequency graph.
20
18
16
14
12
10
8
6
4
2
Cu
mu
lati
ve F
req
ue
nc
y
5 10 15 20 25 30 35 40 45 50
Distance (m)
x
y
0

Level 7
79
Level 7
Pupils estimate the mean for a set of grouped data from a grouped frequency table.
They identify the mid-point of each class interval and multiply each mid-point by the
corresponding frequency.
For example pupils estimate the mean height for pupils in a Year 10 class.
×
130 < h ≤ 140 3 135 405
140 < h ≤ 150 7 145 1015
150 < h ≤ 160 9 155 1395
160 < h ≤ 170 5 165 825
170 < h ≤ 180 4 175 700
Total 28 – 4340
To estimate the mean the total for the
column by the total for the column
= 4340 ÷ 28 =
Level 7
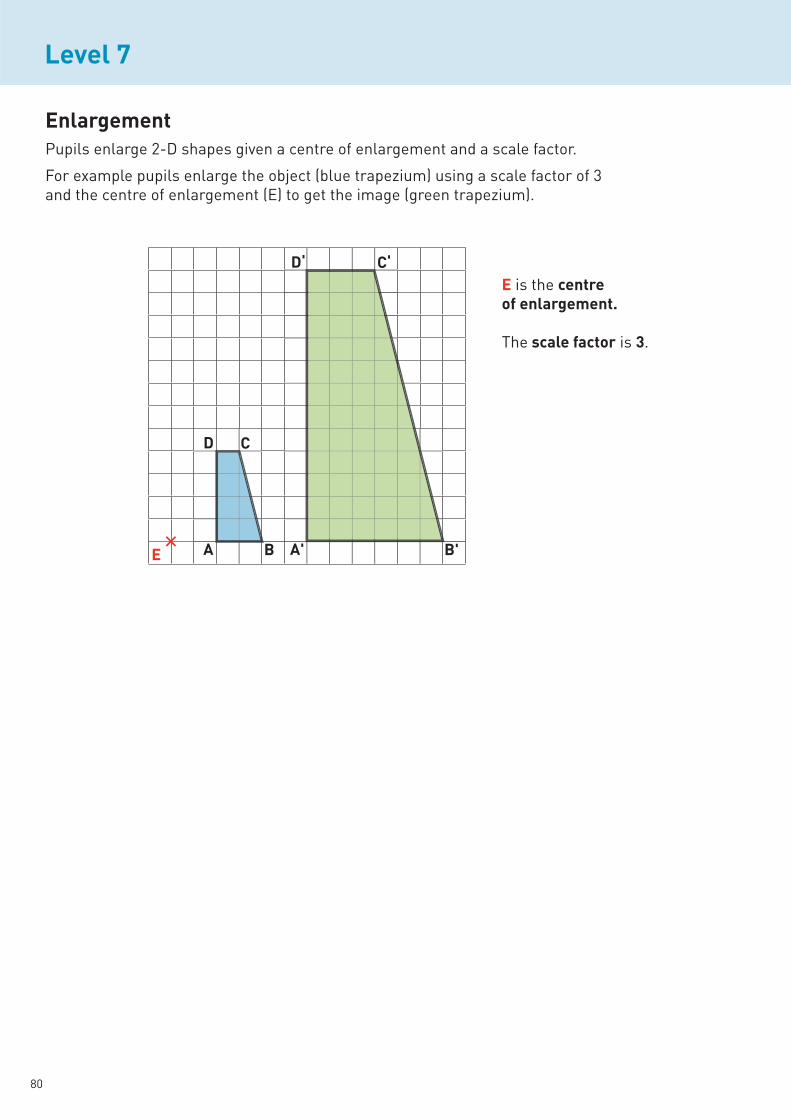
80
Level 7
EnlargementPupils enlarge 2-D shapes given a centre of enlargement and a scale factor.
For example pupils enlarge the object (blue trapezium) using a scale factor of 3
and the centre of enlargement (E) to get the image (green trapezium).
E is the centre
The scale factor is .
D C
B
D' C'
B'×E

Level 7
81
Level 7
Pupils use the handling data cycle when investigating a line of enquiry.
Evaluate
Results
Level 7

82
Level 7
Pupils draw an appropriate line of best fit on a scatter diagram and use their line to
identify intermediate values.
For example pupils use a line of best fit to estimate the height of a plant in the fifth
week.
He
igh
t (c
m)
Week
× ××
×
×
×× ×
14
12
10
8
6
4
2
0 1 2 3 4 5 6 7 8 9 10
x
y
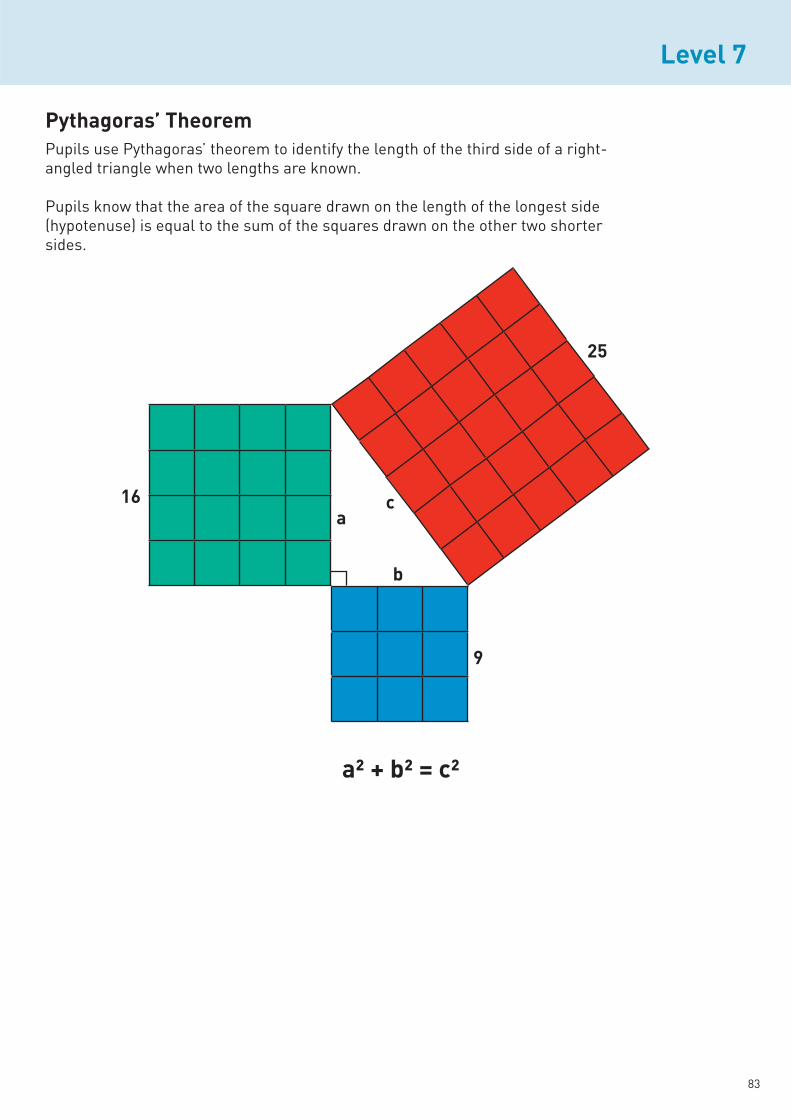
Level 7
83
Level 7
Pupils use Pythagoras’ theorem to identify the length of the third side of a right-
angled triangle when two lengths are known.
Pupils know that the area of the square drawn on the length of the longest side
(hypotenuse) is equal to the sum of the squares drawn on the other two shorter
sides.
a
b
c
a² + b² = c²
Level 7
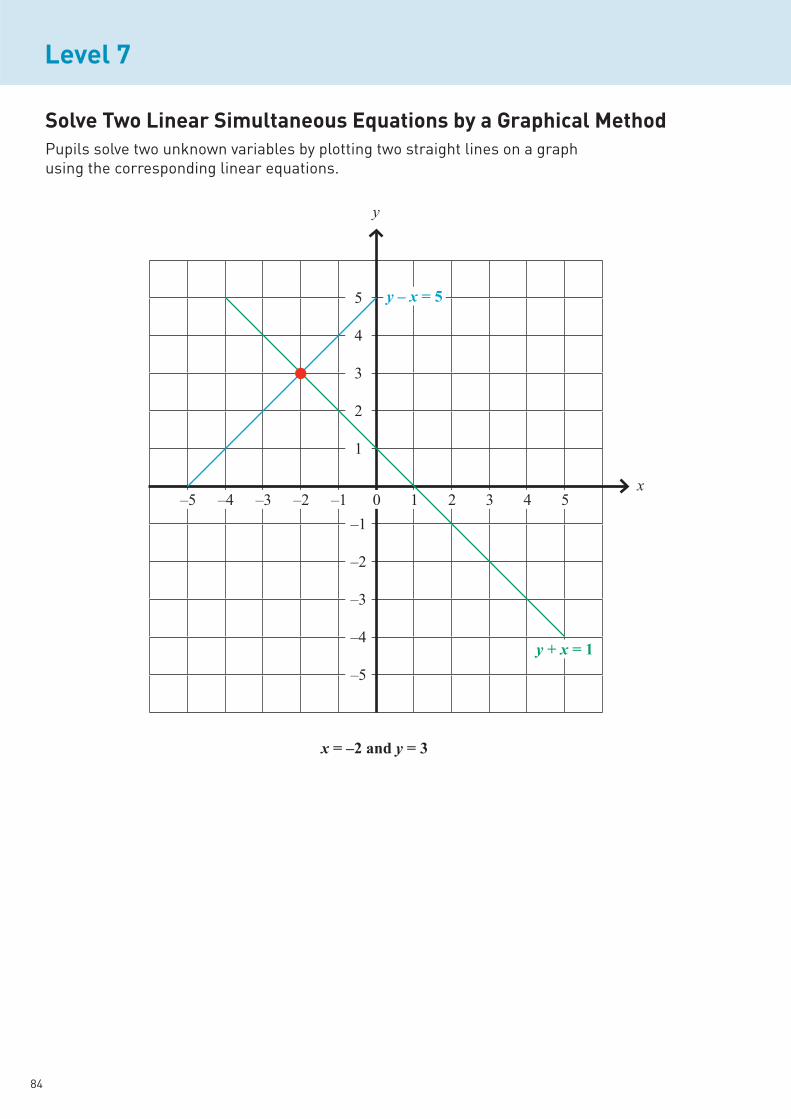
84
Level 7
Pupils solve two unknown variables by plotting two straight lines on a graph
using the corresponding linear equations.
–5 –4 –3 –2 –1 0 1 2 3 4 5
5
4
3
2
1
–1
–2
–3
–4
–5
y
x
y – x = 5
y + x = 1
x = –2 and y = 3
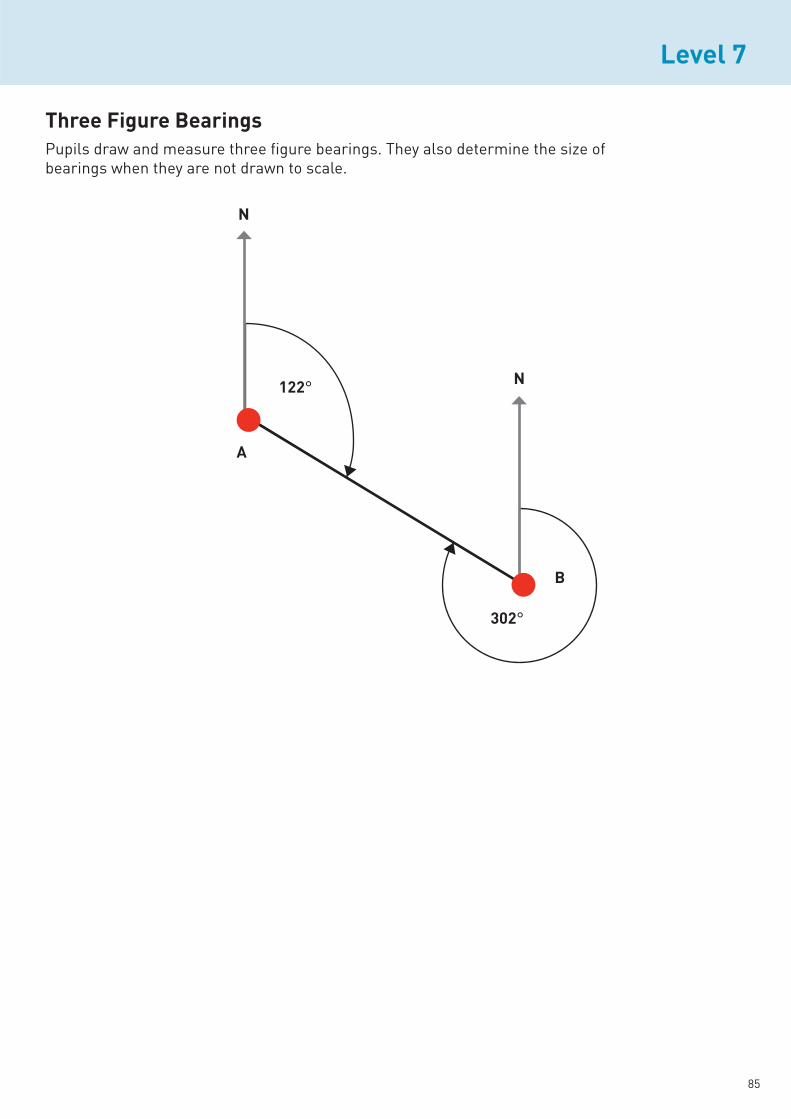
Level 7
85
Level 7
Pupils draw and measure three figure bearings. They also determine the size of
bearings when they are not drawn to scale.
Level 7
N
N
B
122°
°

A CCEA Publication © 2011