assessing the credibility of volunteered … · represent the trustworthiness of the osm ......
TRANSCRIPT

ASSESSING THE CREDIBILITY OF
VOLUNTEERED GEOGRAPHIC
INFORMATION: THE CASE OF
OPENSTREETMAP
BANI IDHAM MUTTAQIEN
February, 2017
SUPERVISORS:
Dr. F.O. Ostermann
Dr. ir. R.L.G. Lemmens

Thesis submitted to the Faculty of Geo-Information Science and Earth
Observation of the University of Twente in partial fulfillment of the
requirements for the degree of Master of Science in Geo-information Science
and Earth Observation.
Specialization: Geoinformatics
SUPERVISORS:
Dr. F.O. Ostermann
Dr.ir. R.L.G. Lemmens
THESIS ASSESSMENT BOARD:
Prof. Dr. M.J. Kraak (Chair)
Dr. S. Jirka (External Examiner, 52°North Initiative for Geospatial Open
Source Software GmbH)
ASSESSING THE CREDIBILITY OF
VOLUNTEERED GEOGRAPHIC
INFORMATION: THE CASE OF
OPENSTREETMAP
BANI IDHAM MUTTAQIEN
Enschede, The Netherlands, February, 2017

DISCLAIMER
This document describes work undertaken as part of a program of study at the Faculty of Geo-Information Science and Earth
Observation of the University of Twente. All views and opinions expressed therein remain the sole responsibility of the
author, and do not necessarily represent those of the Faculty.

i
ABSTRACT
The emerging paradigm of Volunteered Geographic Information (VGI) in the geospatial domain is
interesting research since the use of this type of information in a wide range of applications domain has
grown extensively. It is important to identify the quality and fitness-of-use of VGI because of non-
standardized and crowdsourced data collection process as well as the unknown skill and motivation of the
contributors. Assessing the VGI quality against external data source is still debatable due to lack of
availability of external data or even uncomparable. Hence, this study proposes the intrinsic measure of
quality through the notion of credibility.
Trustworthiness and expertise as two components of credibility were adopted for the baseline study in
developing the proposed measure. The history of changes in the geographic feature revealed the features’
evolution to judge the informational trust. Thus, number of versions, number of users and different
modifications were selected as trust parameters of a VGI. Additionally, contributor identification provided
the estimation of their expertise in contributing to the VGI platform. Motivation, skill, experience and local
knowledge were selected as parameters to estimate the expertise of VGI contributors. Using OpenStreetMap
as a case study, the count for the various parameters were obtained and analyzed against field-checked data
to see how those correlate with the actual feature quality. Later, the notion of “aggregated expertise” was
introduced incorporating parameters of trust on the data and the expertise of the contributors.
On the basis of the results of this research, it can be concluded that number of versions are sufficient to
represent the trustworthiness of the OSM features. Additionally, looking at the feature type and how long
ago the last edit was done, can help in assessing the informational trust aside from who the contributors are.
By applying weighted sum model, aggregated expertise scores per feature were calculated and analyzed that
results in the better estimation of the feature quality rather than the trust based solely on the version number.
The more advanced statistical test was then carried out to understand the causation of one variable by
another. The aggregated expertise is used as the independent variable to predict the feature quality using
regression analysis. Even though the built model has met the assumption, the linear regression did not
produce good results for this case. However, one still can predict whether a VGI feature is credible based
on the feature aggregated expertise.
Keywords: Credibility, Trustworthiness, Expertise, Aggregated Expertise, Quality, Volunteered
Geographic Information, OpenStreetMap, Contributor
ii
ACKNOWLEDGEMENTS
Alhamdulillahhirabbil’alamin… All praise to Allah SWT who granted me the courage, capability, and
opportunity of pursuing a Master of Science degree.
First and foremost, I offer my sincerest gratitude to my supervisors, Dr. F.O. Ostermann and Dr.ir. R.L.G.
Lemmens, for the countless time of supervision, advice and reliable guidance.
I would also like to thank Indonesia Endowment Fund for Education (LPDP) for taking part in providing
me the financial support to complete my master study.
Finally, I would like to express my very profound gratitude to my parents, family and friends for providing
me with unfailing support and continuous encouragement throughout my years of study. This
accomplishment would not have been possible without them.

iii
TABLE OF CONTENTS
1.1. Motivation.....................................................................................................................................................................7 1.2. Research Objectives ....................................................................................................................................................8 1.3. Approach and Thesis Structure ................................................................................................................................8
2.1. Volunteered Geographic Information .................................................................................................................. 11 2.2. Spatial Data Quality Measures and VGI .............................................................................................................. 12 2.3. Credibility of VGI .................................................................................................................................................... 13 2.4. Characteristics of OpenStreetMap ........................................................................................................................ 15
3.1. Credibility Measures ................................................................................................................................................. 21 3.2. Experimental Setup .................................................................................................................................................. 25 3.3. Data Analysis ............................................................................................................................................................. 30 3.4. Kendall’s Tau Correlation Analysis ....................................................................................................................... 41 3.5. Predictive Model ....................................................................................................................................................... 44
4.1. Correlation Analysis Results ................................................................................................................................... 45 4.2. Predictive Model Results ......................................................................................................................................... 47 4.3. Visualization of Implementation Results ............................................................................................................. 50 4.4. Discussion .................................................................................................................................................................. 53
5.1. Conclusions ............................................................................................................................................................... 55 5.2. Recommendations for Future Work ..................................................................................................................... 57

iv
LIST OF FIGURES
Figure 1. Schematic diagram of the research approach ........................................................................................... 9
Figure 2. iD editor ....................................................................................................................................................... 16
Figure 3. Potlatch 2 ..................................................................................................................................................... 16
Figure 4. JOSM ............................................................................................................................................................ 16
Figure 5. Geographic distribution of all HOT contribution (source: Dittus, Quattrone, & Capra (2016)) . 18
Figure 6. The HOT Tasking manager, showing a project description on the left-hand side, and map with a
task grid on the right.2 ................................................................................................................................................ 18
Figure 7. Feature-evolution showing type of edits done by the users ................................................................ 20
Figure 8. Conceptual relation model to assessing the credibility of VGI. Based largely on concepts
proposed by Flanagin & Metzger (2008), Bishr & Janowicz (2010), Idris et al. (2014) ................................... 22
Figure 9. Aggregated expertise to assess the credibility of VGI .......................................................................... 24
Figure 10. The extent of the study area (Basemap Data © OpenStreetMap Contributors) ........................... 25
Figure 11. Screenshot of OSM XML file. Only last version and last user of each feature is recorded ......... 27
Figure 12. Workflow to obtain historical data and contributors' profile information ..................................... 28
Figure 13. Historical view of one particular feature in JOSM .............................................................................. 29
Figure 14. Number of users involved creating the new version of OSM features ........................................... 32
Figure 15. Screenshot from JOSM showing the 2nd user create the new version of the feature by only
slightly moving the point 0.28 m from the previous position.............................................................................. 33
Figure 16. General editing activity of the contributors in the study area ........................................................... 35
Figure 17. Distribution of origin of contributors (left) and distribution of contributors located in close
proximity to study area (right) ................................................................................................................................... 36
Figure 18. Histogram showing data distributions. The green and the red lines indicate median and mean of
the data respectively .................................................................................................................................................... 37
Figure 19. Skill of overall contributors based on the main software used ......................................................... 38
Figure 20. Negative screenshot from JOSM showing overlapped building (left) and point fell outside the
polygon (right) ............................................................................................................................................................. 39
Figure 21. Histogram of feature’s quality score. The green and the red lines indicate median and mean of
the data respectively .................................................................................................................................................... 40
Figure 22. Histogram of combined feature’s quality. The green and the red lines indicate median and mean
of the data respectively ............................................................................................................................................... 40
Figure 23. Correlation analysis workflow for individual trust parameters ......................................................... 41
Figure 24. Correlation analysis workflow for individual aggregated expertise parameters.............................. 42
Figure 25. Correlation analysis workflow for aggregated expertise ..................................................................... 43
Figure 26. QQ plot of aggregated expertise score ................................................................................................. 47
Figure 27. Plot of quality against aggregated expertise and the outliers ............................................................. 48
Figure 28. Plot of quality against aggregated expertise (ln) .................................................................................. 48
Figure 29. Plot of residual against fitted value to check the linearity .................................................................. 50
Figure 30. Normal Q-Q plot showing the normality of residuals ....................................................................... 50
Figure 31. Spread-location plot showing the variance of the residual ................................................................ 50
Figure 32. User interface of OSM credibility assessment tool ............................................................................. 51
Figure 33. OSM metadata .......................................................................................................................................... 51
Figure 34. Time slider widget .................................................................................................................................... 52
Figure 35. Filtering tool .............................................................................................................................................. 52

v
Figure 36. Individual contributor's search widget ................................................................................................. 52
Figure 37. Profile metadata of OSM contributors ................................................................................................ 53

vi
LIST OF TABLES
Table 1. Note. Typology of VGI. Reprinted from "Digital Earth from vision to practice: making sense of
citizen-generated content," by Craglia, Ostermann, & Spinsanti (2012), International Journal of Digital
Earth, 5, p. 405. Copyright (2012) by Taylor & Francis ....................................................................................... 11
Table 2. Reviewed papers according to the ISO quality measures ...................................................................... 12
Table 3. Basic terms for assessing the credibility of computer products (Fogg et al., 1999) .......................... 13
Table 4. Mean Scores of Motivation for Contributing to OSM (Summarized from Budhathoki &
Haythornthwaite, 2013) .............................................................................................................................................. 16
Table 5. Distribution of absolute version numbers for all features of the OSM dataset for study area ....... 26
Table 6. Tag key and Tag value differentiating feature type ................................................................................. 30
Table 7. Distribution of real version number for all features of the OSM dataset for study area ................. 31
Table 8. Counts of specific edits summarized by number of versions ............................................................... 32
Table 9. Feature type generalization based on the longevity characteristics ...................................................... 34
Table 10. Descriptive statistics .................................................................................................................................. 35
Table 11. Local knowledge classification ................................................................................................................. 37
Table 12. Software Scores .......................................................................................................................................... 38
Table 13. Correlation test result for individual parameter of trustworthiness against feature quality ........... 45
Table 14. Correlation test result for time effect parameter of trustworthiness against feature quality ......... 46
Table 15. Correlation test results for individual aggregated expertise parameters against feature quality .... 46
Table 16. Correlation test result for total aggregated expertise against feature quality .................................... 47
Table 17. Details of model parameters .................................................................................................................... 49
Table 18. Overall fit of the predictive model .......................................................................................................... 49

ASSESSING THE CREDIBILITY OF VOLUNTEERED GEOGRAPHIC INFORMATION: THE CASE OF OPENSTREETMAP
7
INTRODUCTION
1.1. Motivation
During the past decade, the role of a typical internet user has expanded from only consuming information
to also contributing content. This development is driven by user preferences and interests and is enabled by
new technologies that are commonly referred to as Web 2.0. Much of this user-generated content includes
or refers to geographic information commonly known as Volunteered Geographic Information (VGI)
(Goodchild, 2007). The emergence of VGI allows for collaborative spatial data collection by professionals,
volunteers or even amateurs to offer an alternative creation of spatial data in contrast to conventional
methods conducted by mapping agencies or other traditional geospatial data providers. Parker, May, &
Mitchell (2012) argue that one important advantage of VGI over authoritative geographic information is its
often higher currency, which makes it especially suited for dynamic or unstable geographic features.
Presently, VGI is being extensively used as a data source for a broad range of applications, such as
environmental monitoring, disaster management, urban planning, etc. This increased multitude of usage
makes it important to identify quality indicators for this type of geospatial information as there are no
standards and specifications for such a crowdsourced and volunteered data creation process. Several studies
have evaluated different quality elements of VGI. In most cases, data is assessed by taking into account
direct data quality metrics that follow the principle of ISO standardized measures. Haklay (2010) calculated
the overlap of motorway features between OpenStreetMap (OSM) and Ordnance Survey to assess positional
accuracy of OSM as well as analyze the level of completeness through a statistical analysis for the length of
the roads. Further, Neis, Zielstra, & Zipf (2011) examined the completeness and topological error of OSM
street network by comparing it with the commercial datasets. Those methods actually require reference
datasets for comparison purposes that should ideally have the same geographical coverage, data model, and
attribute structure. However, those extrinsic comparisons have a constraint due to limited data availability,
high procurement cost, and licensing restrictions of authoritative datasets (Barron, Neis, & Zipf, 2014).
Further, Antoniou & Skopeliti (2015) have argued that VGI and authoritative data are not comparable due
to different data acquisition processes. Additionally, an authoritative dataset does not necessarily indicate
better data. In fact, for some areas, VGI is now more complete than the authoritative dataset (Vandecasteele
& Devillers, 2015).
Considering the abovementioned limitations, a few studies have focused on addressing the data quality issue
by solely exploring the VGI without comparing it with the reference data, called ‘intrinsic quality analysis’.
Barron et al. (2014) examined fitness-for-purpose of VGI quality by developing a framework that integrates
the measures and indicators based on the data history. However, they found that more comprehensive
analyses concerning the experience, reputation, and quality of contributions should be another concern for
intrinsic VGI quality assessment. Assessing the credibility based on a source where the information comes
from could be a different way of evaluating the quality of VGI, since the contributor’s local knowledge,
behavior, and motivation also influence the quality of data.
In this way, current methods for assessing the quality of VGI are insufficient to identify and combine the
parameters from VGI metadata and its contributor which have an impact on the credibility of VGI. Thus,
developing and evaluating credibility measures of VGI would give a different approach to assess its quality.
It could be useful for various organizations and people who need geographical information by harnessing

ASSESSING THE CREDIBILITY OF VOLUNTEERED GEOGRAPHIC INFORMATION: THE CASE OF OPENSTREETMAP
8
VGI which is freely available but need to ensure the credibility of this information beforehand. Credibility
will help to assess quality when the other measures are not available.
OpenStreetMap (OSM) is used as a use case in this study because it is the most utilized, analyzed and cited
VGI platform (Neis & Zielstra, 2014). This study focuses on the credibility-as-accuracy aspect with regard
to trustworthiness and expertise as Flanagin & Metzger (2008) argued that this is an appropriate concept for
those who use VGI for scientific application. This research is intended to analyze environment and activities
of VGI contributors as well as the contributed data to have a better insight into its implications for
information and source credibility of VGI.
1.2. Research Objectives
The main purpose of this research is to develop and implement a model to assess the credibility of OSM
features based on characteristics of contributors’ profile and feature history. The contributor profile
characteristics will provide evidence on their expertise. The historical information will reveal the features’
evolution as a baseline to judge its trustworthiness.
The main objective can be divided into the following sub-objectives:
1. To develop criteria to describe online and crowdsourcing communities, and apply them to OSM
community.
2. To develop and evaluate parameters for VGI credibility measures.
3. To develop a model for credibility assessment of OSM data.
4. To implement the model and evaluate the results on OSM data.
Questions related to sub-objective 1:
1.1. Which existing criteria or measures are used to describe online communities?
1.2. What are the motivations and characteristics of OSM contributors, and what is the process of
mapping?
Questions related to sub-objective 2:
2.1. What are the quality elements that are relevant to assess the credibility of VGI?
2.2. Which parameters can be used to develop the credibility measures for assessing VGI?
Questions related to sub-objective 3:
3.1. Which of the developed parameters are useful to model OSM credibility?
3.2. Which modeling technique are useful for assessing OSM credibility?
Questions related to sub-objective 4:
4.1. How can the developed credibility model be implemented?
4.2. How well does the implemented model perform?
1.3. Approach and Thesis Structure
For more clarity, the research approach is represented as a schematic diagram in figure 1. Literature with
regard to the characteristics of online and crowdsourcing community focusing on the contribution issues
was reviewed. This is the baseline to reveal the motivation(s) and characteristics of VGI contributors and
the mapping process followed by them. Besides, analyzing data editing patterns and interviewing the

ASSESSING THE CREDIBILITY OF VOLUNTEERED GEOGRAPHIC INFORMATION: THE CASE OF OPENSTREETMAP
9
community on the case study as well as collecting statistical information relevant to OSM are taken into
account to provide the general profiles of community contributors.
The next activity was to determine the parameters derived from the feature’s editing history as well as the
behavior of contributors to develop credibility measures for geographic information. Two key criteria to
develop credibility measures are the expertise and the trustworthiness of the information provider.
Accordingly, claims and ideas about possible indicative information regarding those two credibility
dimensions are also collected and studied to determine their role in measuring VGI credibility. OSM
metadata and the profiles of their contributors were obtained, processed and analyzed to find out which
direct and indirect information with regard to trustworthiness and expertise can be extracted. One can then
decide what parameters can contribute to a model for credibility assessment. Literature research on VGI,
spatial data quality, and credibility concepts revealed which indicators can also be taken into account. For
comparison, a case study on a neighborhood in Jakarta, Indonesia, collected ground truth data on OSM
features to assess the OSM feature quality following ISO standardized measures. Hence, the credibility
assessment model was conceptualized by developing a conceptual relation model to associate the elements
influencing the credibility assessment of OSM.
Furthermore, the developed conceptual model was examined by correlating the training dataset that contains
the information about credibility parameters, with the reference dataset derived from the case study field
check and cross-referencing the contributors on other online platforms. Statistical analysis was carried out
to determine the degree of relationship between credibility assessment based on the OSM metadata and its
contributors with the feature’s quality compared with reference dataset. Additionally, regression analysis
tried to predict feature credibility. In the final phase of this research, the overall fit of the credibility model
was evaluated to conclude how well the proposed credibility assessment performs.
Figure 1. Schematic diagram of the research approach

ASSESSING THE CREDIBILITY OF VOLUNTEERED GEOGRAPHIC INFORMATION: THE CASE OF OPENSTREETMAP
10
This thesis adopts the following structure:
Chapter 1: provides a general introduction to this thesis through a motivation and stating the research
objectives and research approach.
Chapter 2: gives a general introduction to VGI, more specific information on OSM and summarizes related
scientific studies on the credibility concept and OSM data quality. Research questions 1.1, 1.2, and 2.1 are
addressed in this chapter.
Chapter 3: presents the developed framework model for assessing the credibility of VGI. The chapter
discusses several parameters that can be used in implementing the model. The experimental setup is further
discussed for this study, and the extraction and compilation of parameters from OSM features and
contributors are also described. Statistical analysis was carried out to determine the correlation between
credibility assessment based on the contributors’ expertise and trustworthiness with the feature’s quality
checked in the field. Additionally, a predictive model was built using linear regression to provide evidence
of a causative relation. This chapter presents work related to research questions 2.2 and 3.1.
Chapter 4: discusses the results and reflects on the limitations of model implementation in the study area
that help to address the research questions 3.2, 4.1, and 4.2. This chapter also provides the visualization of
credibility assessment result as the web mapping application.
Chapter 5: summarize the key outcomes of the thesis, answers research questions, and provides
recommendations for future work.

ASSESSING THE CREDIBILITY OF VOLUNTEERED GEOGRAPHIC INFORMATION: THE CASE OF OPENSTREETMAP
11
LITERATURE REVIEW
2.1. Volunteered Geographic Information
The emerging paradigm of Volunteered Geographic Information (VGI) was first introduced in 2007
(Goodchild, 2007). This paradigm provides an alternative to a traditional top-down process of geographic
data collection, done by professionals in the government or related agencies to a bottom-up process where
an individual can contribute his/her knowledge to produce geographic information. The awareness of
limitations in geospatial data availability is the major motivation of an individual to contribute (Budhathoki
& Haythornthwaite, 2013).
VGI is characterized by abundant up-to-date information for a particular area in contrast to authoritative
data. However, the end user often hesitates to use this information due to the unknown data quality. Craglia,
Ostermann, & Spinsanti (2012) proposed a perspective for understanding basic typology of VGI by
considering the type of geographic information being captured and the kind of volunteering that can be
explicit or implicit as shown in table 1. Explicit geographic information includes all kinds of information in
the form of a geometric object or identifiable place. Implicit geographic information is not about a place
but can still be referred to a specific geographic location. Further, explicit/implicit volunteering can be
distinguished by whether the user has a specific purpose or not in providing the information. They argued
that this perspective leads to a different methodological approach to assess the quality of the VGI provided.
Table 1. Note. Typology of VGI. Reprinted from "Digital Earth from vision to practice: making sense of citizen-generated content," by Craglia, Ostermann, & Spinsanti (2012), International Journal of Digital Earth, 5, p. 405.
Copyright (2012) by Taylor & Francis
Geographic
Explicit Implicit
Explicitly
volunteered
This is ‘True’ VGI in the strictest
sense. Examples include
OpenStreetMap.
Volunteered (geo)spatial information
(VSI). Examples would include
Wikipedia articles about non-
geographic topics, which contain place
names.
Implicitly
volunteered
Citizen-generated geographic content
(CGGC). Examples would include
any public Tweet referring to the
properties of an identifiable place.
Citizen-generated (geo)spatial content
(CGSC) such as a Tweet simply
mentioning a place in the context of
another (non-geographic) context.
This thesis is focused on studying the VGI that has the characteristics of both explicit geographic context
and explicit volunteering. In this way, specific characteristics of voluntary data help in revealing the
motivations and characteristics VGI contributors and mapping process followed by them. Besides, the
common geographic element gives the advantage to come up with the traditional metrics that are useful in
validating the proposed credibility measure. In explicit-VGI, the volunteers mainly focus on mapping
activities on VGI platforms such as OSM, Wikimapia, Google Map Maker, Ushahidi Crowdmapping
Platform, etc. However, for this research, OSM has been used as a case study since it is the most prominent
VGI platform over the past few years.

ASSESSING THE CREDIBILITY OF VOLUNTEERED GEOGRAPHIC INFORMATION: THE CASE OF OPENSTREETMAP
12
2.2. Spatial Data Quality Measures and VGI
It is necessary to understand the concept of quality before going into further details on credibility measures.
According to Goodchild (2006), quality could be viewed as a measure of the difference between the data and the
reality they present, and becomes poorer as the data and the reality diverge. To measure this difference, the ISO 19113
standard established the following measures:
Positional accuracy: evaluates how good is the coordinate value of the data when compared to the reality
on the ground.
Attribute accuracy: defines how correct is the attribute information.
Completeness: measures the lack of data (error of omission) and surplus of data (error of commission).
Logical consistency: addresses coherence of the data in term of logical and topological relationship.
Temporal quality: measures the validity of data evolution over time with regard to the real word changes.
van Oort (2006) also discussed the more comprehensive description of data quality standards. The author
synthesized various quality standards into eleven measures of spatial data quality: Lineage, Positional accuracy,
Attribute accuracy, Logical consistency, Completeness, Semantic accuracy, Usage/purpose/constraints, Temporal quality,
Variation in quality, Meta-quality, and Resolution. These measures are ideally used to evaluate the quality of
spatial data collected using a uniform method commonly adopted by mapping agencies and commercial
geospatial data providers because the quality standard mentioned above has been defined in the product
specifications (Haklay, 2010). However, the works shown in table 2 focused on evaluating the quality of
OSM based on the ISO standard.
Table 2. Reviewed papers according to the ISO quality measures
Papers
ISO standardized quality
measures
Po
siti
on
al a
ccura
cy
Att
rib
ute
acc
ura
cy
Co
mp
lete
nes
s
To
po
logi
cal ac
cura
cy
Tem
po
ral ac
cura
cy
(Haklay, 2010) ● ●
(Girres & Touya, 2010) ● ● ● ●
(Neis, Zielstra, & Zipf, 2011) ● ●
(Mooney & Corcoran, 2012b) ●
The comprehensive review of the development of quality measures and methods for VGI presented by
Senaratne, Mobasheri, Ali, Capineri, & Haklay (2016) was also taken into consideration. The authors
reviewed 7 quality measures and 10 quality indicators of VGI and classified the referenced papers according
to these measures and indicators in a summary matrix. In this way, the authors found that studies specifically
focusing on map-based VGI are using ISO standardized measures for the quality assessment. The text-
based VGI has been indicated mainly on the credibility and text content quality based on the information
provided by the contributors, whereas image-based VGI has been assessed on the positional and thematic

ASSESSING THE CREDIBILITY OF VOLUNTEERED GEOGRAPHIC INFORMATION: THE CASE OF OPENSTREETMAP
13
accuracy as well as the credibility and reputation. In this way, map-based VGI encompasses all explicit VGI
sources annotated by points, lines, and polygons whereas image-based VGI is implicitly generated by the
user producing geotagged pictures within the social network platform such as Instagram, Flicker, etc. Text-
based VGI can be exemplified as microblogs containing textual geographic information generated by the
user such as Twitter. After all, because the comparative analysis using ISO standardized measures is not
always possible, developing and evaluating credibility measures of map-based VGI would give the different
approach to reveal its quality.
Quality is an objective property of information, while credibility is the subjective perception of the
characteristics of information and its producers (Flanagin & Metzger, 2008). Since different individuals with
different methods and motivations act as the users (information producers) in VGI, it should be considered
to assess the quality. This study tries to prove the hypothesis that VGI quality can be estimated based on a
developed credibility model. To do so, attribute accuracy, completeness, and topological consistency were selected
from aforementioned spatial data quality measures, as the relevant traditional geo-data quality measures for
credibility as prompted in the research question 2.1.
It is importance to consider which of those quality measures should be measured in the field given the time
limitation and a high number of features to be checked. It needs considerable effort to measure the
positional accuracy of OSM data on the field. Besides, the feature with low positional accuracy doesn’t make
the object itself less credible. It was not practical to measure temporal accuracy since it is hard to quantify.
One needs to trace each feature created in OSM depending on when the editor did the feature collections.
The remaining three quality measures are rather suitable and relatively easy to measure on the field. The
method of building a quality score based on those three selected measures has been discussed further in the
later section.
2.3. Credibility of VGI
Credibility has been studied in various disciplines such as communication, social and computer sciences.
The definition of credibility also varies by the field in which it is being researched. However, credibility can
be understood in general as a perceived quality made up of multiple dimensions such as trustworthiness and expertise
(Fogg, Tseng, Hall, & Drive, 1999). The authors suggested the key terminology for investigating credibility
as well as two dimensions of credibility as described in table 3.
Table 3. Basic terms for assessing the credibility of computer products (Fogg et al., 1999)
Terms for assessing
credibility
Terms for assessing
trustworthiness
Terms for assessing expertise
Credible
Believable
Reputable
“trust the information”
“accept the advice”
“believe the output”
Trustworthy
Good
Truthful
Well-intentioned
Unbiased
Honest
Knowledgeable
Competent
Intelligent
Capable
Experienced
Powerful
The same concept of credibility, specific to the VGI field, as proposed by Flanagin & Metzger (2008) clarifies
that credibility can be defined in general as the believability of the source or message. In the absence of

ASSESSING THE CREDIBILITY OF VOLUNTEERED GEOGRAPHIC INFORMATION: THE CASE OF OPENSTREETMAP
14
direct measures, the authors argued that determining the credibility of information becomes critical as people
involved in mapping process have different knowledge, motivations, and behaviors. They mentioned that
credibility in terms of VGI comprises of two primary dimensions-contributors’ expertise on the information
content that makes people believe or trust him/her and trustworthiness of the source of information itself.
So, credibility is usually considered to hold at least some degree of both expertise and trustworthiness in
combination. Consequently, to assess the credibility of VGI, factors that attribute to the trustworthiness
and expertise should be taken into account. However, these two elements have both objective component
(information quality) and subjective components (perception of information recipient) that need to be taken
into consideration.
2.3.1. Trustworthiness
A study by Fogg et al. (1999) about the credibility in computer science underlined that trust and credibility
are not the same concepts. The authors clarified that trust in social network indicates the dependability in a
person, object or process while the credibility shows the believability of source of information. In this way,
trust holds only between people and it has a transitive characteristic: if A trusts B, and B trusts C, then A
trusts C. Bishr & Kuhn (2007) argued that interpersonal trust is a subjective measure but cannot directly be
adopted in geospatial context since trust in social networks could not say more about spatial and temporal
dimension of trust. Later, in the extension of their work, informational trust was introduced as a derivative of
interpersonal trust that has a more objective sense to judge the trustworthiness of geospatial information. In
terms of VGI, informational trust can be related to the concept of people-object transitivity where the trust between
VGI consumer and VGI creator is mediated by the produced information (Bishr & Janowicz, 2010).
Therefore, trust in the context of this study can be perceived as the indicator that VGI producer provides
high-quality geographical information by evaluating the informational trust contained in the VGI itself.
Artz & Gil (2007) mentioned that provenance information is a key factor to measure trust on the web.
Provenance is a term that refers to the attributes of the source of information that can be used for the
assessment of the information content (Harvey, 2013). Model to assess the quality of VGI based on its
provenance has been proposed by Keßler, Trame, & Kauppinen (2011) where historical data were analyzed
to reveal its quality. They made a specific vocabulary of provenance information of OSM and used it to
evaluate a trust dimension of VGI. With same research motivation, Mooney & Corcoran (2012a) focused
their analyses on “heavily edited” OSM features which have been edited over 15 times and argued that
evolutionary history of OSM data is the baseline for evaluating its quality. As a continuation of the previous
study, Keßler & de Groot (2013) investigated indicators from inherent properties influencing the trust
derived from data provenance. They used five intuitive parameters proposed from the previous study for
trustworthiness evaluation - number of versions, number of users, number of confirmations, tag corrections,
and rollback. However, this approach could not tell the trustworthiness of features with less than 6 versions
after editing. Further, the authors mentioned that the implemented approach on provenance is data-oriented
and they introduced the user reputation issue for the future work. In summary, the existing methods of VGI
quality assessment cannot evaluate VGI features with a low number of versions. Thus, this study proposes
to analyze the OSM features with any number of versions. Additionally, the user properties were taken into
account to adjust the measure.
2.3.2. Expertise
Another dimension of credibility is defined by perceived knowledge and skill of the information provider,
i.e. the expertise (Fogg et al., 1999). Expertise also implies that information provider will produce at least
fair information. It is defined by a term such as knowledgeable, experienced, competent, and so on.

ASSESSING THE CREDIBILITY OF VOLUNTEERED GEOGRAPHIC INFORMATION: THE CASE OF OPENSTREETMAP
15
With regard to studying expertise of contributors of VGI, Bégin, Devillers, & Roche (2013) studied
contributors’ mapping behavior to assess the completeness of VGI. In their study, they concluded that
analyzing mapping processes of only a few contributors could represent most dataset. Budhathoki &
Haythornthwaite (2013) introduced - number of features edited, and contributing days and longevity of
contributions as the indicators of contributors’ expertise. They used the questionnaire-based method to
investigate the motivations and characteristics of OSM Contributions. Another study about user quality by
van Exel, Dias, & Fruijtier (2010) discusses that local knowledge can be used to determine the user quality
where familiarity to an area is correlated to the quality of contribution. Local knowledge also helps the user
to identify the incorrect information. Hereinafter, Yang, Fan, & Jing (2016) identified evidence for expertise
using behavior-based approach. They used three indicators to assess the expertise of major contributors:
practice, skill, and motivations. Practice represents the amount of the efforts of the user to dedicate their
time for OSM project. Skill indicates how well a user is making his/her contribution. Motivation shows the
willingness and persistence of the contributor. However, they only distinguished two classes of expertise:
professional and amateur and then implemented them to assess only the major contributors using
descriptive statistics.
To summarize, the existing accounts have not treated the verification of the proposed indicators with the
direct information about the credibility in much detail. Thus, this study suggests a more systematic approach
as the extension of existing research on VGI contributors by understanding the contributing behaviors with
regard to the quality of information being produced.
2.4. Characteristics of OpenStreetMap
2.4.1. OpenStreetMap and the Community Contributions
The following reviewed literature helps to describe the research question 1.1 and 1.2 with regard to
crowdsourcing communities, particularly for OSM. This extensive review also supports this study to
understand the different potential motivators for contribution to VGI.
During the last decade, OSM has become the most popular example of VGI project (Haklay & Weber,
2008). Started in London in 2004, OSM had more than 3 million registered users and 700 thousand
contributors as of 31 July 2016 (OpenStreetMap Wiki, 2016c). A key motivation of this project is to provide
the free access to current world map data (Ramm, Topf, & Chilton, 2010) as cited in Barron et al. (2014).
Everybody can contribute to this database. There are several tools available to contribute data to OSM
platform. People can edit geographic data on the web through a simple iD editor (figure 2). With the iD
editor, a user (the words users and contributors are used interchangeably) can only perform basic edit such as
creating OSM feature by tracing satellite images as well as adding and editing tags. It has an intuitive interface
and is easy to operate. There is another tool available online namely Potlatch 2 (figure 3). Potlatch 2 is a
web-based (flash) OSM editor that has more complete functionalities as compared to the iD editor.
However, it requires a flash plugin in the browser which is not supported by all browsers. The application
platform has a limitation that does not support batch uploading. JOSM (Java OpenStreetMap Editor) is a
desktop application that has a relatively steep learning curve. However, it has a rich set of features and
support capabilities to load offline data (figure 4). It is also popular among experienced OSM editors. Some
other mobile applications can also be used to contribute to OSM data: OsmAnd, Vespucci, Maps.me, etc.
are few of them. Usually, these mobile editors are used by people editing on the field. These various types
of editors are used further to explain the expertise of the contributor in terms of skill in using the collection

ASSESSING THE CREDIBILITY OF VOLUNTEERED GEOGRAPHIC INFORMATION: THE CASE OF OPENSTREETMAP
16
tools with different levels of complexity. A more detailed comparison of the editing tools can be found on
the wiki page (http://wiki.openstreetmap.org/wiki/Editors).
Figure 2. iD editor
Figure 3. Potlatch 2
Figure 4. JOSM
The motivation to contribute to OSM varies from a personal need to project goals (Budhathoki &
Haythornthwaite, 2013). The authors reviewed both intrinsic and extrinsic potential motivations for
contribution to VGI then carried out a questionnaire based research to 444 OSM contributors. The study
resulted in seven main motivations, from higher to lower importance, for contributing to OSM project.
These are - (1) Project goal, (2) Altruism, (3) Self-efficacy regarding local knowledge, (4) Learning, (5) Personal need, (6)
Personal promotion, and (7) Monetary reward. Based on the published data, Table 4 summarized the mean scores
for each abovementioned motivational factors as well as the measurement items. The mean scores indicate
the relative importance of the seven motivations as a result of the survey using a 7-point Likert scale. The
higher the score, the more important is the motivation to contribute to OSM.
Table 4. Mean Scores of Motivation for Contributing to OSM (Summarized from Budhathoki & Haythornthwaite, 2013)
Motivations Measurement item Mean
Score
Standard
Deviation
Monetary reward - I use OSM data in making profit in my business.
- I have benefited financially from my involvement in OSM.
- I am planning a commercial business in future using OSM
data.
- I use OSM to display my skills to potential employers.
2.14 1.06

ASSESSING THE CREDIBILITY OF VOLUNTEERED GEOGRAPHIC INFORMATION: THE CASE OF OPENSTREETMAP
17
Learning - Contributing to OSM helps me to develop a new
perspective about the geography of the world.
- Contributing to OSM lets me develop my mapping skills.
- OSM allows me to gain a new perspective about the area I
live in.
- I find maps fascinating.
5.29 0.95
Self-efficacy
regarding local
knowledge
- When I see information about the places I know missing
from OSM, I map them.
- When I see errors on the map for the area in which I live, I
correct them.
- I enjoy contributing to OSM.
I think that my contributions are as good as that of other
users.
5.58 0.81
Project goal - I believe that “Free Wiki World Map,” which is the goal of
OSM, is achievable.
- I believe in “Free Wiki World Map,” which is the goal of
the OSM project.
- Digital map data should be available for free.
6.14 0.77
Altruism - I contribute to OSM because those who are in need of
digital map data will use my contribution.
- It is important to help others by providing digital maps
that are available for free.
- I expect OSM users to actively contribute geographic data
to the project.
5.73 0.83
Personal
promotion
- OSM experience will look good in my resume.
- My friends and family value my contribution to OSM.
- Contributing to OSM lets me develop my technical skills
through direct, hands-on experience.
4.04 1.00
Personal need - I contribute to OSM because the map data I am looking
for does not exist elsewhere.
- I contribute to OSM to create map data that meet my
need.
5.20 1.19
The authors also classified OSM contributors into two categories: “serious” and “casual” mappers. These
categories were built based on three criteria: (1) number of edits, (2) longevity and (3) number of mapping
days. By overlapping those two categories with the motivational information, the authors found the
difference in motivation between “serious” and “casual” mappers. The “serious” mappers were motivated
by the community, learning, local knowledge and career, while “casual” mappers were more motivated by
their belief that digital map data should be freely available. This study of motivation(s) behind OSM
contribution is further used to come up with several potential indicative parameters to assess expertise of
OSM contributor.
Some organizations and projects are leveraging OSM platforms. Humanitarian OpenStreetMap (HOT) is
one of the global volunteer organizations that applies OSM platform to intensively improve OSM data for
humanitarian aid and development issues. HOT was started in 2009 with the objective to organize

ASSESSING THE CREDIBILITY OF VOLUNTEERED GEOGRAPHIC INFORMATION: THE CASE OF OPENSTREETMAP
18
worldwide volunteers to collaborate using OSM platform for disaster response such as recent Hurricane
Matthew Haiti in 2016, Nepal earthquake in 2015, West African Ebola crisis in 2014, typhoon Haiyan in
2013 and many other coordinated mapping activations. (OpenStreetMap, 2016). Figure 5 visualize the global
distribution of all HOT edits.
Figure 5. Geographic distribution of all HOT contribution (source: Dittus, Quattrone, & Capra (2016))
The HOT Tasking Manager is the enabling technology that allows the volunteers to contribute in tracing
the maps from satellite imagery. This tool helps to divide up a mapping job into the smaller tasks (grid cells)
where the contributors can freely choose in which grid they want to begin their work. This functionality
somehow can also reduce edit conflict. It also shows which areas need to be mapped and which areas need
the mapping validation. It also publishes a list of all remote mapping projects and some contextual
information related to particular mapping projects such as task descriptions, detailed instructions about how
to contribute, recent mapping activity, and some statistics e.g. contributors’ list as well as mapping and
validation progress.1 Figure 6 shows a screenshot of a project and its description.
Figure 6. The HOT Tasking manager, showing a project description on the left-hand side, and map with a task grid on the right.2

ASSESSING THE CREDIBILITY OF VOLUNTEERED GEOGRAPHIC INFORMATION: THE CASE OF OPENSTREETMAP
19
Normally, remote mapping activities follow a contribution pattern. First, remote volunteers trace satellite
imagery in OSM, and then the local mappers with their local knowledge of the respective area add local
details such as neighborhoods, street names, building levels and other details.
However, a specific coordinated mapping project (mapping party / mapathon) can give the sense of
trustworthiness in general because we know who are the overall producers, are they members of mapping
party or not because volunteers who are mapping also have some assistance walking around during the
mapathon. Thus, identifying the community mapping project in the study area is useful as additional
information to justify the contributors’ credibility.
1 http://tasks.hotosm.org/about 2 http://tasks.hotosm.org/project/9
2.4.2. Feature Elements and Versioning
The feature versioning of OSM captures the different types of edits and the user editing. This provides
valuable historical information for evaluating a feature’s trustworthiness, addressing research question 2.2.
Therefore, we discuss OSM versioning in more detail below.
OSM data consists of spatial and attribute elements. It has three data primitives used to represent geographic
information - nodes, ways, and relations. A node accounts for a specific point as a generalization of the real
world feature e.g. museum, cafe, etc., while ways are used to represent lines (e.g. rivers and roads) or polygons
(e.g. buildings or forests). Ways consist of ordered list of nodes. However, relations record the relationship
between two or more spatial data elements such as turn restrictions and multi-polygon. OSM data also
contains attribute elements named tags. All of above spatial elements can have one or more associated tags.
A tag consists of a tag key and a tag value, e.g. highway=secondary, road_name=sjahrirstraat, etc. In addition,
common attributes are also stored including id (osm feature id), user (name of the contributor), uid (user id),
timestamp (time of last modification), version (version number), changeset (changeset id). A more detailed
description of the OSM data elements can be found on the wiki page (OpenStreetMap Wiki, 2016a).
In contrast with traditional geospatial data collection, the crowdsourced platform allows anyone to come
along and add, modify or delete the features. In the case of OSM, only the last version of a feature is exposed
in the live map. The database uses optimistic locking allowing conflict to be identified quickly with regard
to version numbers (the newest version is the winner). The version number always starts at 1 and increases
by 1 every time an element is modified (OpenStreetMap Wiki, 2016d). All versions of the OSM features are
recorded in the database as ‘changeset’ (historical information) that tells who the user was and what elements
have been changed. In other words, a changeset is the collection of edits done by a single user over a short
period of time.
Furthermore, derivative information regarding the editing types can be obtained from above-mentioned
feature’s history of changes. It was built based on the work introduced by (Keßler et al., 2011). In general,
those editing types can be categorized as creation, modification, and deletion. For more clarity, specific
editing types that could be done by OSM users are illustrated in Figure 7.

ASSESSING THE CREDIBILITY OF VOLUNTEERED GEOGRAPHIC INFORMATION: THE CASE OF OPENSTREETMAP
20
Figure 7. Feature-evolution showing type of edits done by the users
Let’s suppose User A creates a polygon of OSM feature at version 1. User B then edits this polygon by
modifying the vertex, thereby creating version 2. This edit type can be indicated as a geometric correction.
User C then edits the polygon by correcting the tag value from “cafe” to “restaurant” as version 3. Later,
user A re-edits the feature by attaching additional attribute information resulting in version 4. This case
shows that user can edit the same feature several times resulting in different versions. At version 5, User D
changes the tag value for tag key “house number” from 21 to 20. Another possible action could be reversing
the information to the previous state as showed by User E by changing back the “house number” from 20
to 21. However, User F makes the version 7 which contains exactly the same information with the previous
one. This action can be categorized as confirmation. In the most current version of the feature, version 8,
User G removes one of the tags due to some reasons.
ASSESSING THE CREDIBILITY OF VOLUNTEERED GEOGRAPHIC INFORMATION: THE CASE OF OPENSTREETMAP
21
METHODOLOGY
3.1. Credibility Measures
In relating VGI and credibility, issues of contribution matter because all of the information comes from the
actor who creates/edits the VGI and that is the primary basis on which the credibility of VGI can be judged.
To assess the credibility, first we must have the overall opinion about the general source, OSM metadata
and its contributors in this case, with the certain restrictions. Then, one can use the ancillary data to validate
it. Credibility, as an attribute of a person, depends on how trustworthy the person is and how much he/she
knows about the related subject. Credibility also has the subjective measure where everyone might have
different criteria for trustworthiness and expertise of the information producers. However, considering
those criteria is out of the scope of this study.
Let us describe the general idea of how ‘credibility’ and ‘quality’ are related. The contributor provides
geographical feature(s), and the end user decides whether or not to use this information based on the
credibility (he/she trusts the information and expertise of the contributor) to fit the purpose. As a note,
there is a distinction between the ‘‘accuracy’’ of information and its ‘‘credibility.’’ The accurate information
in most cases is likely also credible, but technically inaccurate information can also be identified as credible
provided that the consumer of that information trusts it (Flanagin & Metzger, 2008).
In term of VGI, assessing the trust of individual contributor could follow the concept of “people-object
transitivity” proposed by Bishr & Janowicz (2010). It differs from the trust that exists only between people.
Every contributor has a certain level of trustworthiness, and it could be more than one level and depends
on whom they are talking to. In this way, the direct indicators from contributors to measure their
trustworthiness and how it can be reviewed from the consumer’s perspective are beyond the scope of this
study. Hence, the trust is mediated by the data created by VGI contributor that makes the VGI consumer
trust that particular contributor and also the other way around. Consequently, the metadata could be used
as an indirect indicator telling the trustworthiness of particular feature as the result of collective editing by
many contributors.
The figure 8 shows high level abstraction to understand the characteristics of credibility of VGI. In
simplified terms, VGI has a certain degree of credibility based on the trustworthiness expressed through the
metadata and the different level of expertise of its contributors. To quantify expertise and trustworthiness,
some parameters derived from metadata and contributor’s properties are proposed showing the influence
to estimate the expertise and trustworthiness. At this moment, the validation process by visual assessment
done by highly trustworthy and expert person is not within the scope of this study since it is hard to capture.
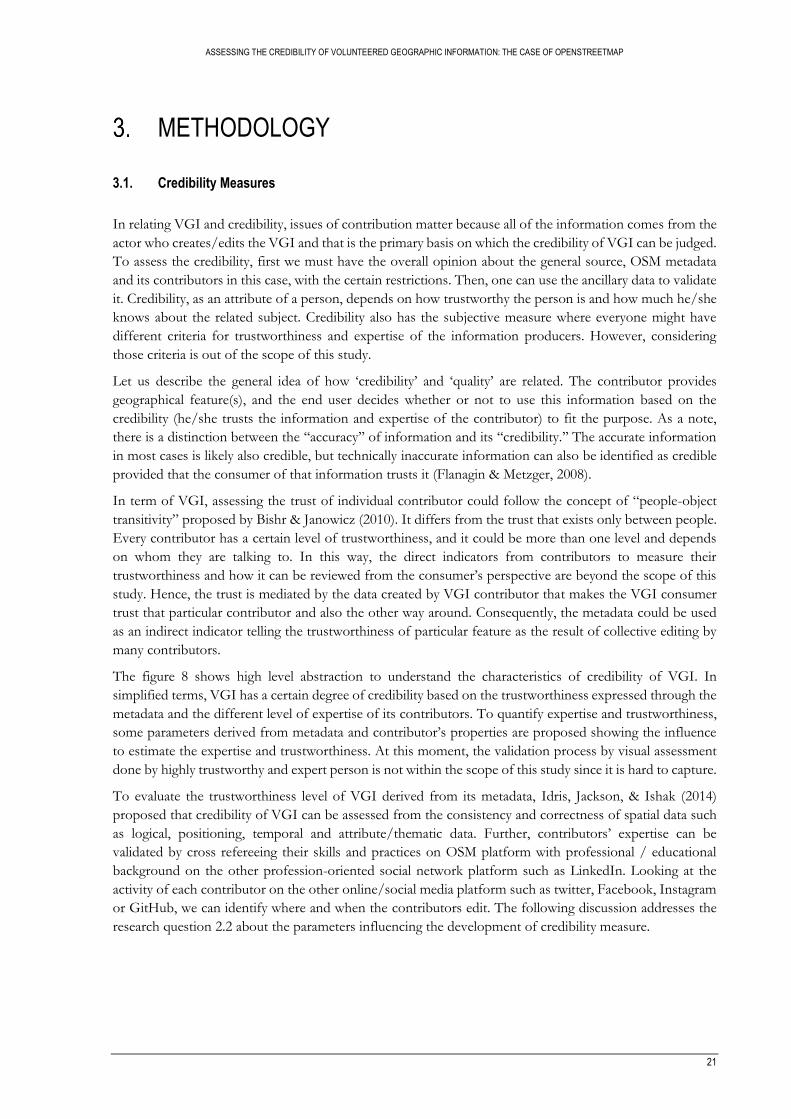
To evaluate the trustworthiness level of VGI derived from its metadata, Idris, Jackson, & Ishak (2014)
proposed that credibility of VGI can be assessed from the consistency and correctness of spatial data such
as logical, positioning, temporal and attribute/thematic data. Further, contributors’ expertise can be
validated by cross refereeing their skills and practices on OSM platform with professional / educational
background on the other profession-oriented social network platform such as LinkedIn. Looking at the
activity of each contributor on the other online/social media platform such as twitter, Facebook, Instagram
or GitHub, we can identify where and when the contributors edit. The following discussion addresses the
research question 2.2 about the parameters influencing the development of credibility measure.

ASSESSING THE CREDIBILITY OF VOLUNTEERED GEOGRAPHIC INFORMATION: THE CASE OF OPENSTREETMAP
22
Figure 8. Conceptual relation model to assessing the credibility of VGI. Based largely on concepts proposed by
Flanagin & Metzger (2008), Bishr & Janowicz (2010), Idris et al. (2014)
3.1.1. Parameters for Trustworthiness
Feature versioning in OSM previously discussed gave several numbers of indicators as the result of the
interaction between the contributors. Thus, the following basic parameters might have an influence on
trustworthiness:
Number of versions: It shows how many direct interactions occurred between users.
Number of users: It indicates the different users involved. Higher number of people getting involved
and agreeing over the information indicates feature improvement.
Information about number of versions provides the derivative information regarding the editing types.
These editing types could also useful to justify the trust on data. Following parameters are highly intuitive
as derivative information from collaborative editing process, and all of them have been mentioned as
potential parameters in previous research (Keßler & de Groot, 2013). However, these parameters are only
available for a feature which has more than one version.
Number of confirmations: It represents the sequential version created by different users but contains
exactly the same information.
ASSESSING THE CREDIBILITY OF VOLUNTEERED GEOGRAPHIC INFORMATION: THE CASE OF OPENSTREETMAP
23
Number of geometric corrections: It tells how many times the geometric information of the feature has
been revised and improved, e.g. adding or removing nodes.
Number of tag corrections: It shows an attributive change of the feature that indicates the feature
correction that also leads to feature improvement.
Number of main tag corrections: It shows the value change of the main tag. This could be more
important because it totally changes the map feature type.
Number of rollbacks: It tells the complete change to the previous version.
Number of tag additions: It shows the addition of tag that changes the information’s completeness.
Number of tag removals: It shows the deletion of tag(s) that also changes the information’s
completeness.
In addition, other general parameters can be obtained from the data as follows:
Number of days since the recent edit: The longer the feature has been present over time, the higher the
probability that particular feature corresponds to the reality. Thus, when the feature has not been edited
since a long time, its trustworthiness increases. This information might also correspond to the feature
type that could further affect the trustworthiness of its feature. For example, old features such as church,
mosque, or historical buildings should have a higher score on this parameter as compared to informal
buildings.
3.1.2. Parameters for Expertise
The following parameters are proposed after user behavior-based approach studied by Yang et al., (2016)
indicating the practice and skill of every contributor:
Number of mapping days: A high number of mapping day shows that a user dedicates more of his/her
time for OSM project and that implies that they have a good practice in project contribution.
Longevity: Time range between first and last contribution indicates if the user is aware and up-to-date
about the development of OSM.
Main software used: Software used to contribute to OSM determines the skill level of the user. Generally,
JOSM, Potlatch, iD editor require a different level of skill.
Besides, additional parameters that intuitively indicate the motivation of the users to contribute to OSM
project could also be suitable to assess the expertise of every contributor:
Number of changesets: A changeset can be roughly viewed as a unit of work of the user that results in a
version increment. The higher the number of changesets created, the higher the motivation of the user.
Number of map changes: Map changes can be interpreted as a number of edits made by the user. In line
with number of changesets, this parameter also indicates the motivation.
Further, local knowledge is also proposed as another parameter that influences the expertise of a contributor
as suggested by van Exel, Dias, & Fruijtier (2010). To quantify the local knowledge of each contributor, the
distance between the first node created by a user and centroid of the study area was calculated.
Distance to study area: The location of the first node created by contributors was extracted. The study
by Neis & Zipf (2012) suggests that first node created by a contributor is located close to his/her
residence or the place that they are very familiar with. From that node, the distance to study area was
calculated. Based on this distance, one can say if the contributor is a local from study area or not.

ASSESSING THE CREDIBILITY OF VOLUNTEERED GEOGRAPHIC INFORMATION: THE CASE OF OPENSTREETMAP
24
3.1.3. Aggregated Expertise
Moving forwards from the credibility concept described at the beginning of this section, it was found that
incorporating both expertise and trustworthiness elements provides a robust form of evaluation since
expertise is only a factor that creates trust in contributors. One can call this concept “aggregated expertise”.
It simply means that the more expert contributors acknowledge a certain piece of geographic information,
the more trustworthy is it perceived.
Figure 9. Aggregated expertise to assess the credibility of VGI
Figure 9 illustrates the way to aggregate the expertise level of each contributor with regard to the versioning
system in VGI platform. Since the VGI is a result of collective edits from its contributors, it should be the
aggregation of expertise of the contributors involved. This expertise aggregation concept is actually the
advancement of basic parameters influencing trustworthiness, i.e.- number of versions created and number
of users involved. Instead of only counting how many versions were created and how many different
contributors were involved, this proposed concept adjusts those parameters using the properties of the user
telling their skill, motivation, and experience to contribute to OSM platform as well as their local knowledge.
The idea on how to combine the expertise level of each user contributing to the same OSM feature is
described as follows: Contributor 𝑢 has different level of expertise 𝐸(𝑢). Each contributor makes edit(s) to
a feature resulting the version of that feature 𝑓(𝑣). Editing type done by contributor 𝑢 can be creation,
confirmation, geometric correction, tag correction, main tag correction, rollback, tag addition, tag removals
or the combination of them. These editing types are indicated by 𝑒𝑡(𝑢). Consequently, the aggregation of
different expertise level with editing pattern done by the contributor actually reveals the credibility of the
feature since it bonds the trust and expertise parameters. This aggregated expertise was denoted by 𝐴𝐸 and
defined as the weighted sum of such value:

ASSESSING THE CREDIBILITY OF VOLUNTEERED GEOGRAPHIC INFORMATION: THE CASE OF OPENSTREETMAP
25
𝐴𝐸 (𝑓𝑖) = ∑ 𝑒𝑡(𝑢)
𝑣
𝑖=1
𝐸(𝑢) (1)
Where 𝑒𝑡(𝑢) here is the weight for what editing type was done by user 𝑢, and 𝑣 is number of versions for
feature 𝑓𝑖. The intended ‘aggregated expertise’ scores attached to the individual OSM features are then
evaluated using the traditional data quality measures obtained from the field.
3.2. Experimental Setup
This section describes the experimental setup for performing the analysis. It is necessary to provide an
overview of how OSM historical data, including all contributors involved, is obtained, processed, and
prepared for the analysis. It is also required to select a subset of OSM data for the experiment as the OSM
global database comprises of a million features.
3.2.1. Study Area
The city of Jakarta is the study area for this research. The author has general knowledge about the area and
OSM local community in this region. It was also feasible to practically collect the primary data in the field
considering the permissions, language, and security. However, the approach presented in this study is
adequately generic and flexible such that it could be implemented in any region.
Figure 10. The extent of the study area (Basemap Data © OpenStreetMap Contributors)
Jakarta Old Town (Figure 10) was selected as a small region in Jakarta for the OSM data experiment.
Officially known as Kota Tua, it is a touristic place where people go for sightseeing, historical tours and the
other forms of leisure. This area has a high density of POIs, roads, and buildings. Based on the preliminary
analysis, this area has been mapped since 2007 till 2016 resulting in 398 features (as downloaded on 3rd
October 2016) in the form of points, lines, and polygons. This area also has a rich input in terms of feature
history (number of versions) as shown in table 5. In short, the area chosen has the right characteristics for
addressing the research questions about model implementation.

ASSESSING THE CREDIBILITY OF VOLUNTEERED GEOGRAPHIC INFORMATION: THE CASE OF OPENSTREETMAP
26
Table 5. Distribution of absolute version numbers for all features of the OSM dataset for study area
Version Number of features Total %
1 270 67.84
2 43 10.80
3 25 6.28
4 20 5.03
5 9 2.26
6 11 2.76
7 7 1.76
8 3 0.75
9 3 0.75
10 1 0.25
15 1 0.25
19 2 0.50
30 1 0.25
31 1 0.25
45 1 0.25
Total 398 100%
It is evident from the table 5 that features with low version numbers occur more frequently. About 68% of
all features in the study area have only single version as the current version number. It was decided to analyze
all the features in the study area with their varying number of versions. However, the distribution of version
numbers mentioned above is actually the absolute version as recorded in the OSM database. It could be
including error as a result of bug on Potlatch 1 OSM editor (up to 2011) that led to an invalid increase of
feature’s version number (Barron et al., 2014). Thus, to calculate the version number of OSM features, it
should be based on the real changes and not based on the absolute number of version as suggested by Neis
& Zipf (2012). An automatic process to derive a real number of version avoiding this error is presented in
the next section.
Development of Local OSM Community by Humanitarian OpenStreetMap Team Indonesia
An interview was conducted with a key leader of local OSM community in Indonesia to get information
about profiles of community contributors in general and the existing approach to build volunteer capacity.
Humanitarian OpenStreetMap Team Indonesia was founded in 2011 as there was a need to evaluate the
OSM utilization and development in Indonesia (Chapman, 2012). The activity was started by first 10
workshops hosted at universities, and as a result, 163,912 buildings were mapped during the pilot study
(June 2011 to March 2012). Since then, HOT Indonesia has held 117 pieces of training with more than
2,809 participants, and 4,255,230 buildings were mapped in contrast to only 34,960 buildings mapped before
this community existed.
Indonesia contains both cities and rural areas. HOT Indonesia implemented two community approaches
for these different area characteristics. For a rural area, HOT worked with the local community in the
particular area, and for urban areas, it gives training to the universities. The training is more about how to
use JOSM as a tool to contribute to OSM platform. They argued that iD editor has a limitation as it
completely depends on the internet connection. By contrast, JOSM supports offline editing mode, and
several tools and plugins allow the user to create or edit feature(s) easily. JOSM was also translated into

ASSESSING THE CREDIBILITY OF VOLUNTEERED GEOGRAPHIC INFORMATION: THE CASE OF OPENSTREETMAP
27
Indonesian. By translating JOSM, it allows Indonesian users to become more familiar with the tool. The
symbols and presets based on traditional British national maps were not very culturally relevant to Indonesia.
For example, there are many fuel stations for motorcycles in Indonesia which are small kiosks where one
can buy a liter of fuel. Such custom presets were created and translated to assist in data collection. In every
coordinated mapping activity, HOT Indonesia always held quality controls using JOSM validator. JOSM
validation tool is also useful for finding topological errors but may not be as helpful in finding incorrect
tags. During the training session, they also always endorse the standardization of roads and naming the
features.
There are also other the digital communities of OSM contributors in Indonesia (web portal, Facebook, and
twitter) that aim to engage people who do not already know about OSM and provide community support
to those who are already using it. Major OSM contributors in Indonesia are the students as they understand
the local context of their areas. To ensure the continued growth of OSM in Indonesia, the main strategy of
this organization is to create a robust team of trainers to assist the implementation of OSM project in
Indonesia. Considering this information, HOT contribution was used further as an additional expertise
parameter. A user from HOT is expected to have enough capacity to volunteer to the OSM platform.
3.2.2. Acquisition of OSM Historical Data and Contributors’ Profile
A weekly updated OSM data is available on the website of Planet OSM (https://planet.openstreetmap.org/)
for the entire world with a current compressed size of 55 GB and uncompressed size 740 GB under a
Creative Commons Attribution-ShareAlike 2.0 license. It contains not only up-to-date data but also an older
version of data as well as deleted features. Nevertheless, none of the current OSM data processing tools are
fit to process this file due to its enormous size. Limited disk space and memory usage are also hardware
issues in processing this large data. The smaller extract of the specific region is offered by a third party
(http://download.geofabrik.de/) in the form of OSM XML and shapefile format. Another alternative to
downloading OSM data only for the particular area of interest is to use JOSM that results in the same OSM
XML file. Unfortunately, these OSM XML files contain none of the historical data. It rather contains the
absolute version number, and only last user is listed as shown in figure 11 below.
Figure 11. Screenshot of OSM XML file. Only last version and last user of each feature is recorded
ASSESSING THE CREDIBILITY OF VOLUNTEERED GEOGRAPHIC INFORMATION: THE CASE OF OPENSTREETMAP
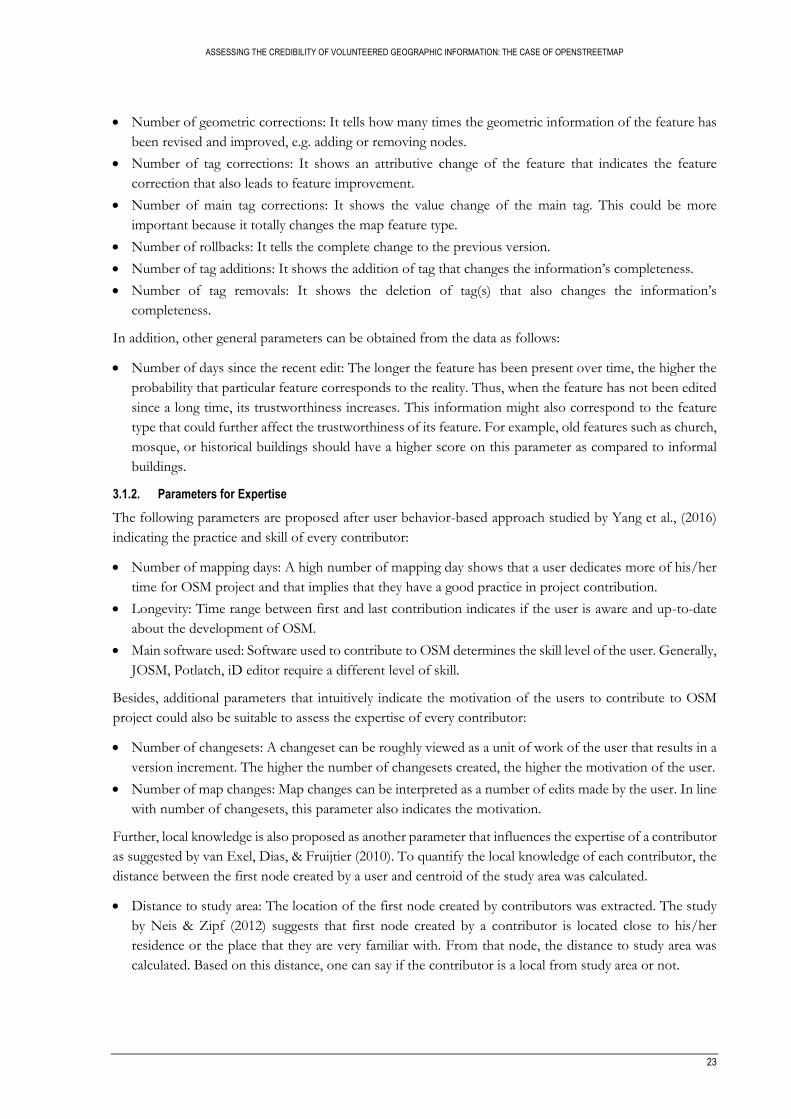
28
To address these issues, semi-automated data acquisition workflow was developed to derive all information
needed. Figure 12 shows the workflow in obtaining all OSM historical data and the contributors involved
as well as their profiles that are required for further analyses.
Figure 12. Workflow to obtain historical data and contributors' profile information
Firstly, OSM XML data for the study area was obtained on 3rd October 2016 in *.osm XML formats using
JOSM. The complete OSM XML file contains an extensive collection of nodes, ways, relations as well as
their associated tags. Common attributes are also included in the file, but user, version, timestamp, and
changeset listed are only for the last version of the feature. However, id and uid will remain unchanged.
A list of OSM feature id found in the OSM XML file is used as an input to extract the historical data. Python
code history.py has been developed to download all versions that ever existed for all input feature id directly.
It built on OSM history API v0.6 (OpenStreetMap Wiki, 2016b):
http://api.openstreetmap.org/api/0.6/<objtype>/<id>/history
where <objtype> could be “node” or “way” and <id> is the feature id of particular object. The developed
codes applied the conditional statement to check the recurring changeset id indicating the error as a result
of editor tool’s bug. Thus the real number of versions can be derived using this function. In addition, a list
of contributors, timestamp, and changeset for all versions is included in the output file in the form of
comma-separated value. The source code for this history.py can be found in Appendix A.
A number of information about the profile of OSM contributors can be derived from OSM platform using
3rd party tools provided by Neis (2012) called “How did you contribute to OpenStreetMap.” This web-
based tool can show in detail when, where, and how long did the OSM contributors work in the project as
well as the tools they used, for instance:
http://hdyc.neis-one.org/?Steve
Normally, it needs a manual operation to get that information by searching each OSM username as an input.
Thus, to extract this data automatically for the given list of contributors, python code contributors.py has
also been developed using provided API:
http://hdyc.neis-one.org/search/<user>

ASSESSING THE CREDIBILITY OF VOLUNTEERED GEOGRAPHIC INFORMATION: THE CASE OF OPENSTREETMAP
29
where <user> is OSM username. The created output file contains all essential information indicating the
profile for all input users. The source code for this contributors.py can be found in Appendix A.
Further, by inspecting the same OSM XML using JOSM historical view (Figure 13), one can manually
identify and compare two consecutive versions for each feature to come up with the idea of what kind of
specific edit was made to create the new version of the feature and then count those specific edits.
Figure 13. Historical view of one particular feature in JOSM
3.2.3. Assessing Quality Score on the Field
A field check was carried out to determine whether the information provided in OSM matches with the
reality in term of completeness, attribute accuracy and topological consistency. This activity utilized
university GIS enterprise portal (https://utwente.maps.arcgis.com/) where the author used mobile Collector
for ArcGIS to gather the information in the field including the photographs. For the effectiveness, map
features and the new attribute schema were designed and deployed into the cloud beforehand for this
activity. All map features have different schema and attribute to be evaluated in the field due to varying
number of tags provided. Overall, it took 3 days to assess the quality score for 398 OSM features in the
field.
Attribute Accuracy
Mainly, the field assessment was carried out to check the correctness of the main tag value for each defined
tag key, for example, is this place café or pub? Is this primary or secondary road? The additional tag values
were also checked such as the name of the road, the name of buildings, building levels, etc. During the field
check, the author also used his in-field local knowledge to assess these data. Consequently, the attributes’
correctness indexes were assigned (0-1) as a ratio of the correct information to the total information
provided where the feature type and feature name have 70% weight as these are the main attribute
information.
Completeness
To calculate the data absent from a dataset (error of omission), attribute completeness index was calculated as
the ratio of number of tags provided to the total available attributes for each map features type. In addition,
excess data present in a dataset (error of commission) was checked in the field i.e. the informal buildings that

ASSESSING THE CREDIBILITY OF VOLUNTEERED GEOGRAPHIC INFORMATION: THE CASE OF OPENSTREETMAP
30
have been demolished due to building infraction. In this way, the same scores range (0-1) were assigned as
the completeness index.
Topological consistency
As discussed in the previous section, the positional accuracy of the OSM feature is not really important, but
at least the topological relationship between data must be correct. It also depends on the geometry type of
the data. Point features should be related to the building or other features explained by them because it used
as a label in OSM map representation. The topological inconsistency of polyline feature such as roads can
be seen at the road junctions. For polygon features, such as buildings, one can be categorized topologically
inconsistent when there is an overlap between the features. All this analysis was done by visually interpreting
the data, and then field check was executed for assessment validation. Topological consistency scores (0-1)
were given based on those criteria.
As a result, the data produced from this field-checked activity is expected to be of high quality and can,
therefore, be used as the reference data set to conduct the credibility validation.
3.3. Data Analysis
The overview of derived information is presented as the result of the acquisition of OSM historical data,
contributors’ profile as well as feature quality in the field for the study area using aforementioned methods.
Table 6 summarized whole OSM feature in the study area based on the tag key provided and geometry type.
The tag key and tag value elements are then used to divide up the feature in study area into several map features
prescribed by the community (OpenStreetMap Wiki, 2016a).
Table 6. Tag key and Tag value differentiating feature type
No Tag key Tag value Geometry Number of
features
1 amenity café, marketplace, night club, place of worship, post
office, restaurant, school
point 9
2 amenity café, fire station, kindergarten, museum, place of
worship, post office, police, public building, school
polygon 18
3 building commercial, house, residential, school, general
building
polygon 202
4 highway bus stop point 4
5 highway primary, secondary, tertiary, residential, service,
pedestrian, road (general), footway, path
line 87
6 historic building polygon 23
7 landuse commercial, forest, grass, industrial, park, residential polygon 15
8 railway station point 3
9 railway rail, platform line 21
10 shop convenience point 2
11 tourism attraction, museum point 7
12 waterway river, riverbank line 7
Total 398

ASSESSING THE CREDIBILITY OF VOLUNTEERED GEOGRAPHIC INFORMATION: THE CASE OF OPENSTREETMAP
31
3.3.1. Data History
Versions
As discussed earlier, the absolute version recorded in the OSM database includes an error due to software
bugs. After running the developed script, the duplications are identified, and error can be avoided resulting
in the real version number as illustrated in table 7. For example, as presented in table 5 the highest number
of version was 45, yet actually this feature has been edited only 24 times as shown in table 7 below. To
conclude, it is crucial to avoid this error considering number of versions is the baseline to judge the collective
edits that indicate feature’s trustworthiness.
Table 7. Distribution of real version number for all features of the OSM dataset for study area
Version Number of features Total % Number of feature
version created
1 277 69.60 277
2 45 11.31 90
3 33 8.29 99
4 15 3.77 60
5 11 2.76 55
6 6 1.51 36
7 3 0.75 21
8 3 0.75 24
10 1 0.25 10
11 1 0.25 11
14 1 0.25 14
16 1 0.25 16
24 1 0.25 24
Total 398 100 737
In total, the collaborative edits on OSM platform in this study area resulted in 737 unique versions for 398
OSM features. This number of different versions is further analyzed to reveal the information about who
are the respective users, what kind of edits were done and other historical characteristics.
Users
Features with only one version have clear information about who is the contributor. Those objects only
have one user involved without further editing process. For features with more than one version, the number
of users participating in the editing process is not always the same as number of versions created.

ASSESSING THE CREDIBILITY OF VOLUNTEERED GEOGRAPHIC INFORMATION: THE CASE OF OPENSTREETMAP
32
Figure 14. Number of users involved creating the new version of OSM features
Figure 14 above illustrates the comparison between number of versions and number of users for the OSM
features that have more than one version. The 121 OSM features are plotted horizontally in order of
ascending number of versions shown as blue dots while the red dots indicate number of contributing users.
Some OSM features have the same number of both version and users shown as overlapped dots. However,
there are some gaps between a number of versions and number of users. For example, the right-hand side
of the figure shows 24 unique versions of a particular feature that is actually edited by only 9 users. This
difference indicates that the same user could edit the same feature several times for different versions. This
case indicates that specific user could give a concern in the development of the particular OSM feature.
Editing Types
As the result of manual identification comparing two consecutive versions, various types of numbers with
regard to specific editing types can be extracted. These numbers express the interaction among the
contributors that could help to assess the trustworthiness of the OSM features. Table 8 provides the
summary of the count for each specific edits.
Table 8. Counts of specific edits summarized by number of versions
Number of
versions
Number of
features
Types of edit
Confirm. Geometric
corr.
Tag
corr.
Main
tag corr.
Tag
add.
Tag
rem. Rollbacks
1 277 0 0 0 0 0 0 0
2 45 6 29 3 6 11 4 0
3 33 2 38 7 8 14 1 1
4 15 2 31 3 7 10 0 0
5 10 0 22 5 3 14 0 0
6 7 1 29 4 2 4 2 0
0
2
4
6
8
10
12
14
16
18
20
22
24
nu
mb
er o
f ve
rsio
ns/
use
rs
OSM features arranged horizontally in order of ascending number of versions
versions users

ASSESSING THE CREDIBILITY OF VOLUNTEERED GEOGRAPHIC INFORMATION: THE CASE OF OPENSTREETMAP
33
7 4 3 18 2 2 2 1 1
8 2 0 9 0 0 1 1 1
10 1 1 4 1 1 3 1 0
11 1 0 9 1 1 1 0 0
14 1 0 9 1 0 1 0 1
16 1 0 13 0 0 0 0 2
24 1 2 16 1 0 2 0 1
Total 398 17 227 28 30 63 10 7
Geometric corrections and rollbacks are respectively the most and the least frequently occurring edits. The
geometrical changes involve additions and deletions of nodes within a way affecting the shape of a line or
polygon feature. In the case of point feature, it shows the changes of its coordinate. However, based on the
observations during the manual comparison of the feature versions, there is an indication that several users
tried to make themselves as the last editor by slightly moving or adding the nodes without significantly
changing the shape of the OSM features as illustrated in figure 15 below.
Figure 15. Screenshot from JOSM showing the 2nd user create the new version of the feature by only slightly moving the point 0.28 m from the previous position.
This finding also indicates that the user tried to improve their number of edits in OSM platform to gain
their reputation. By contrast, rollbacks were very rare among all feature changes, and that implies that there
are fewer edits wars within the users in the study area (7 times out of 737 edits). However, 277 features
which only have 1 version give no information about such interactions. This lack of object evolution means
limited information to judge its trustworthiness, but one can only simply rely on the properties of its
contributor.
Days since Last Edits
Instead of solely looking at the general type (tag key) as shown in table 6, one should consider the specific
type of the OSM features by examining the tag value. However, this specific type categorization has
limitations due to small sample size for each. Thus, the idea here is to combine them assuming similar
behavior regarding feature’s constancy over time as shown in table 9 below.

ASSESSING THE CREDIBILITY OF VOLUNTEERED GEOGRAPHIC INFORMATION: THE CASE OF OPENSTREETMAP
34
Table 9. Feature type generalization based on the longevity characteristics
Map features
category
Feature type Number of
features
Min of
days
Max of
days
Average
of days
Commercial
and informal
settlement
café, marketplace, restaurant, night club,
convenience, commercial building, an
informal settlement
130 55 1366 559
General
building and
Landuse
house, residential, general building,
landuse 93 55 2702 1034
Highway,
Railway,
Waterway
primary, secondary, tertiary, residential,
service, pedestrian, a general road,
footway, path, bus stop, rail, platform,
station, river, riverbank
122 10 2859 627
Long living
object
fire station, kindergarten, public
building, attraction, museum, place of
worship, post office, police, school,
historic building
50 21 2822 652
This categorized map feature type will be used for further statistical correlation analysis to expose the specific
behavior with regard to the feature type and the persistence conditions over time. It was built on the
assumption that the longer the feature has been present over time, the higher the probability that that
particular feature corresponds to the reality. For example, a long living object such as place of worship or
historical buildings should have a long number of days since the last edit as compared to informal buildings.
Simply put, the hypothesis (Ha) here is the chance of long-living objects being correct and duration since
last edits should correlate positively.
3.3.2. Characteristics of the Contributors
In total, there are 52 contributors involved in the editing process in the study area. The new user id was
assigned to each contributor considering privacy issue. Figure 16 summarizes the contribution of each user
to the study area. About 75% data creation processes of OSM features in the study area are done by only
8% of all contributors, while 77% data modifications are performed by only 21% of contributors. About
50% of all contributors are the creators of the first version of all features in the study area, while 88% of the
contributors are involved in modification processes resulting in the newer version.

ASSESSING THE CREDIBILITY OF VOLUNTEERED GEOGRAPHIC INFORMATION: THE CASE OF OPENSTREETMAP
35
Figure 16. General editing activity of the contributors in the study area
Detailed profile information about those OSM contributors regarding their activity and experience on the
OSM platform is outlined in Table 10. The table gives a review of the descriptive statistics for derived
expertise indicators in term of practice, skill, and local knowledge. All parameters have a difference between
the median and the mean values which suggests that the data is not normally distributed.
Table 10. Descriptive statistics
Parameters Min Q1 Median Mean Q3 Max
Number of mapping days 1 8 34.5 164.9 243 986
Longevity (days) 0 114.5 735.0 1059.0 1887 3113
Number of changesets 1 43.75 413 7660 2212 111166
Number of map changes 24 2836 13670 333600 276200 3205766
Distance to study area (km) 0.15 10.60 55.10 5384 9989 39330
0 20 40 60 80 100 120 140 160 180
U52U51U50U49U48U47U46U45U44U43U42U41U40U39U38U37U36U35U34U33U32U31U30U29U28U27U26U25U24U23U22U21U20U19U18U17U16U15U14U13U12U11U10U09U08U07U06U05U04U03U02U01
number of contributions
assi
gned
use
r id
Create
Edit

ASSESSING THE CREDIBILITY OF VOLUNTEERED GEOGRAPHIC INFORMATION: THE CASE OF OPENSTREETMAP
36
Number of mapping days
The number of contributing days of each contributor varies from only one day to 986 days. About 31% of
contributors spend less than 10 days in contributing to OSM, indicating less practice and motivation. By
contrast, 52% of contributors spend more than one month on OSM platform which means that these
contributors have an interest in the geospatial-related domain.
Longevity
A short time range between first contribution and the last one suggests that this user is a rather hit-and-run
user. About 11% of contributors could be categorized as this type of user. However, 73% of the contributors
have a long range which means they might have something to do with geospatial field generally and OSM
development specifically.
Number of changesets and number of map changes
These numbers actually tell the same indicator of user motivation to contribute to the platform. However,
Number of map changes, called as number of edits in later, will be used for further analysis instead of a number
of changesets. It is because the number of map changes gives more detailed information about edits done
by the user. A large number of edits can hardly happen for amateurs. About 17% of contributors have less
than a thousand edits.
Distance to study area
The first created node for each user is extracted and then used to calculate the distance to edited features.
Figure 17 below illustrates all the location of all the contributors and the line indicating the distance to study
area.
Figure 17. Distribution of origin of contributors (left) and distribution of contributors located in close proximity to study area (right)
The histogram for above expertise parameters was generated as illustrated in Figure 18 showing the type of
data distribution. From these plots, one could argue that the data is not normally distributed and shows a
positive skew as the mean value is higher than the median value.

ASSESSING THE CREDIBILITY OF VOLUNTEERED GEOGRAPHIC INFORMATION: THE CASE OF OPENSTREETMAP
37
Figure 18. Histogram showing data distributions. The green and the red lines indicate median and mean of the data respectively
The absolute distances were also converted into several classes to come up with local knowledge score. In this
case, one should be able to distinguish those contributors who have more familiarity with the study area.
Thus, the intervals were defined as follows: 0 – 100 km, 100 – 5000 km and > 5000 km that represent the
high, low and no local knowledge respectively. These intervals were opted considering the data distribution.
One could also argue that the classification based on the distance is better than the country of origin of the
contributors. Table 11 shows the result of the local knowledge classification.
Table 11. Local knowledge classification
Distance
(km)
Number of
contributors
%
contributors
Given
score
0-100 29 56% 1
100-5000 8 15% 0.5
>5000 15 29% 0
Main software used
The ability to use different OSM editor tools shows the skill level of the contributors. The software used
the most for contributing OSM data is the software used by them to generate most map changes. JOSM
and other powerful desktop applications require a high level of skill. However, Potlatch and iD were
categorized as those software that require moderate and low skill levels respectively. Mobile editors such as
OsmAnd, Maps.me, Vespucci, etc. require intermediate skill levels where the user should also navigate
through the field to collect the information.
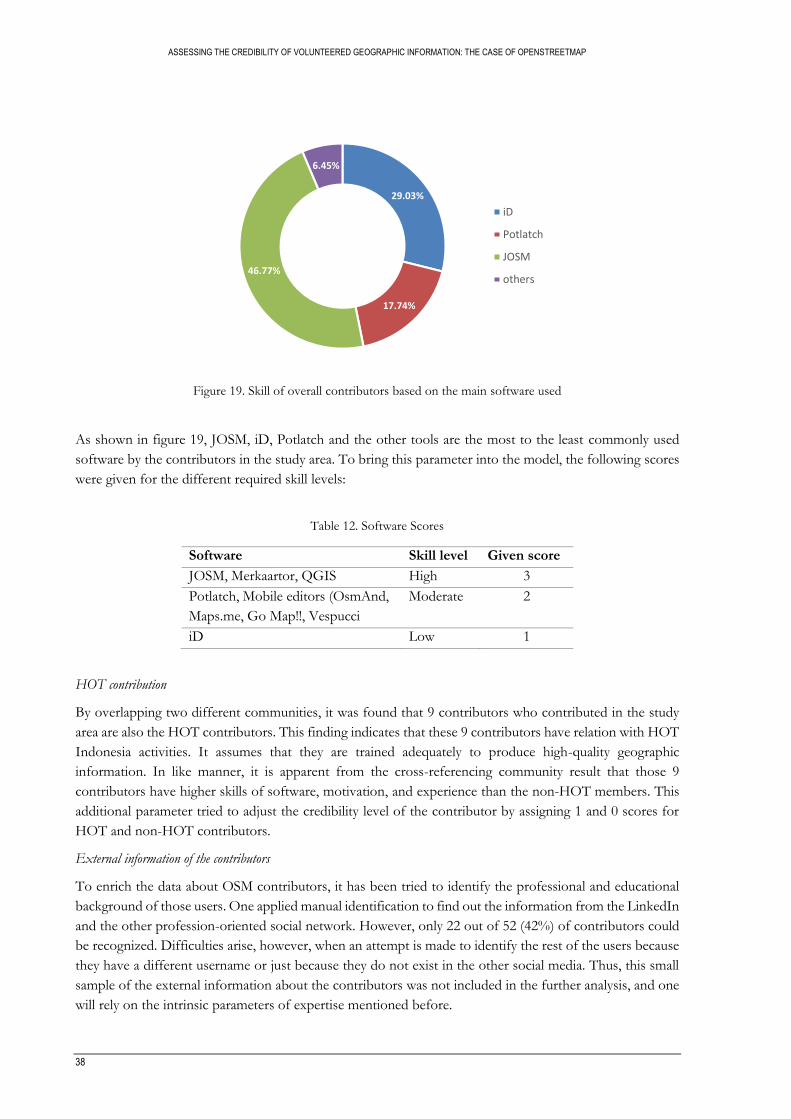
ASSESSING THE CREDIBILITY OF VOLUNTEERED GEOGRAPHIC INFORMATION: THE CASE OF OPENSTREETMAP
38
Figure 19. Skill of overall contributors based on the main software used
As shown in figure 19, JOSM, iD, Potlatch and the other tools are the most to the least commonly used
software by the contributors in the study area. To bring this parameter into the model, the following scores
were given for the different required skill levels:
Table 12. Software Scores
Software Skill level Given score
JOSM, Merkaartor, QGIS High 3
Potlatch, Mobile editors (OsmAnd,
Maps.me, Go Map!!, Vespucci
Moderate 2
iD Low 1
HOT contribution
By overlapping two different communities, it was found that 9 contributors who contributed in the study
area are also the HOT contributors. This finding indicates that these 9 contributors have relation with HOT
Indonesia activities. It assumes that they are trained adequately to produce high-quality geographic
information. In like manner, it is apparent from the cross-referencing community result that those 9
contributors have higher skills of software, motivation, and experience than the non-HOT members. This
additional parameter tried to adjust the credibility level of the contributor by assigning 1 and 0 scores for
HOT and non-HOT contributors.
External information of the contributors
To enrich the data about OSM contributors, it has been tried to identify the professional and educational
background of those users. One applied manual identification to find out the information from the LinkedIn
and the other profession-oriented social network. However, only 22 out of 52 (42%) of contributors could
be recognized. Difficulties arise, however, when an attempt is made to identify the rest of the users because
they have a different username or just because they do not exist in the other social media. Thus, this small
sample of the external information about the contributors was not included in the further analysis, and one
will rely on the intrinsic parameters of expertise mentioned before.
29.03%
17.74%
46.77%
6.45%
iD
Potlatch
JOSM
others
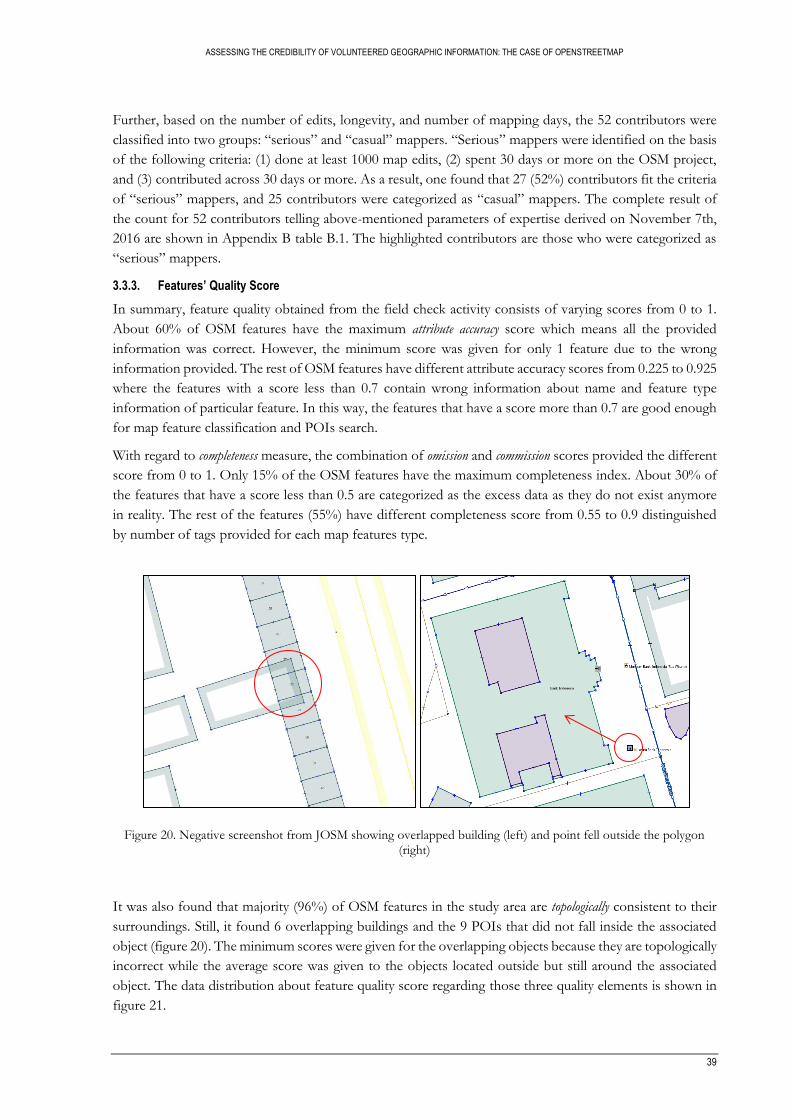
ASSESSING THE CREDIBILITY OF VOLUNTEERED GEOGRAPHIC INFORMATION: THE CASE OF OPENSTREETMAP
39
Further, based on the number of edits, longevity, and number of mapping days, the 52 contributors were
classified into two groups: “serious” and “casual” mappers. “Serious” mappers were identified on the basis
of the following criteria: (1) done at least 1000 map edits, (2) spent 30 days or more on the OSM project,
and (3) contributed across 30 days or more. As a result, one found that 27 (52%) contributors fit the criteria
of “serious” mappers, and 25 contributors were categorized as “casual” mappers. The complete result of
the count for 52 contributors telling above-mentioned parameters of expertise derived on November 7th,
2016 are shown in Appendix B table B.1. The highlighted contributors are those who were categorized as
“serious” mappers.
3.3.3. Features’ Quality Score
In summary, feature quality obtained from the field check activity consists of varying scores from 0 to 1.
About 60% of OSM features have the maximum attribute accuracy score which means all the provided
information was correct. However, the minimum score was given for only 1 feature due to the wrong
information provided. The rest of OSM features have different attribute accuracy scores from 0.225 to 0.925
where the features with a score less than 0.7 contain wrong information about name and feature type
information of particular feature. In this way, the features that have a score more than 0.7 are good enough
for map feature classification and POIs search.
With regard to completeness measure, the combination of omission and commission scores provided the different
score from 0 to 1. Only 15% of the OSM features have the maximum completeness index. About 30% of
the features that have a score less than 0.5 are categorized as the excess data as they do not exist anymore
in reality. The rest of the features (55%) have different completeness score from 0.55 to 0.9 distinguished
by number of tags provided for each map features type.
Figure 20. Negative screenshot from JOSM showing overlapped building (left) and point fell outside the polygon (right)
It was also found that majority (96%) of OSM features in the study area are topologically consistent to their
surroundings. Still, it found 6 overlapping buildings and the 9 POIs that did not fall inside the associated
object (figure 20). The minimum scores were given for the overlapping objects because they are topologically
incorrect while the average score was given to the objects located outside but still around the associated
object. The data distribution about feature quality score regarding those three quality elements is shown in
figure 21.

ASSESSING THE CREDIBILITY OF VOLUNTEERED GEOGRAPHIC INFORMATION: THE CASE OF OPENSTREETMAP
40
Figure 21. Histogram of feature’s quality score. The green and the red lines indicate median and mean of the data
respectively
After arranging the individual quality examination, the outcomes of three quality scores were summed up
with the same weight. The result of the combined quality score is presented. The field check scores as the
second variable for the statistical test are also not normally distributed as shown in figure 22 below.
Figure 22. Histogram of combined feature’s quality. The green and the red lines indicate median and mean of the
data respectively
All the data described above regarding OSM metadata, editing types, the properties of the contributors and
the quality score as the field check result were are used for further statistical analysis in the following sections.

ASSESSING THE CREDIBILITY OF VOLUNTEERED GEOGRAPHIC INFORMATION: THE CASE OF OPENSTREETMAP
41
3.4. Kendall’s Tau Correlation Analysis
A statistical test was also done to determine if there is an association between all derived parameters from
OSM metadata and its contributors with the OSM feature quality checked in the field. Based on the data
analysis discussed before, all the variables have violated parametric assumption with such non-normally
distributed data. Therefore the non-parametric test was done for statistical analysis and all the variables were
converted to ranks where high ranks mean high scores, and low ranks mean low scores. Kendall’s tau (τ)
correlation that measures the rank correlation (statistical dependence between the ranks of two variables)
was chosen in this case since the dataset has a large number of tied ranks and many scores have the same
rank (Kendall, 1938).
The basic definition of Kendall's tau is the notion of concordance. For any pair of observation, one says
that (𝑥𝑖, 𝑦𝑖) and (𝑥𝑗, 𝑦𝑗) are concordant if 𝑥𝑖>𝑥𝑗 and 𝑦𝑖>𝑦𝑗 OR 𝑥𝑖<𝑥𝑗 and 𝑦𝑖<𝑦𝑗 ; and discordant if 𝑥𝑖>𝑥𝑗
and 𝑦𝑖<𝑦𝑗 OR 𝑥𝑖<𝑥𝑗 and 𝑦𝑖>𝑦𝑗 . However, if 𝑥𝑖 = 𝑥𝑗 and 𝑦𝑖 = 𝑦𝑗 , a pair is tied. The Kendall τ coefficient
is then defined as follows (Nelsen, 2001):
τ =(𝑛𝑢𝑚𝑏𝑒𝑟 𝑜𝑓 𝑐𝑜𝑛𝑐𝑜𝑟𝑑𝑎𝑛𝑡 𝑝𝑎𝑖𝑟𝑠) − (𝑛𝑢𝑚𝑏𝑒𝑟 𝑜𝑓 𝑑𝑖𝑠𝑐𝑜𝑟𝑑𝑎𝑛𝑡 𝑝𝑎𝑖𝑟𝑠)
n(n − 1)/2
(1)
Where n is the sample size. If there is a perfect correlation between two ranks, the correlation coefficient is
1. For the opposite situation correlation coefficient is -1. If there is no correlation at all (two variables are
independent), the correlation coefficient is 0 or close to 0.
Figure 23. Correlation analysis workflow for individual trust parameters
The first test was executed to evaluate the individual trust parameters regarding feature quality. These
analyses were done by following the workflow as illustrated in figure 23 above. To operationalize the
workflow, the corresponding R script for this statistical computing was developed namely
trust_fieldcheck_correlation.R. The source code for this can be found in appendix A.

ASSESSING THE CREDIBILITY OF VOLUNTEERED GEOGRAPHIC INFORMATION: THE CASE OF OPENSTREETMAP
42
Specifically, the last parameter of trust stand on how long ago the last edit occurred to the feature was
examined for each map feature category to see the specific behavior of feature type. The assumption was
made that the longer the feature has been present over time, the higher the probability that that particular
feature corresponds to the reality. It was built on the feature type that could also affect the trustworthiness
of its feature. For example, a long living object such as place of worship or historical buildings should score
higher on this parameter as compared to informal buildings.
Another correlation analysis was also carried out to evaluate whether the expertise score derived from
practice, skill, motivation, and local knowledge, indicating what they are doing in OSM platform, is
correlated to the quality score of the features they edited. Figure 24 illustrates the workflow for assessing
the relationship between the aggregated score of individual expertise parameters bound on the OSM feature
with regard to the quality score. This was intended to see the strength of each proposed parameter as an
indicator of data quality.
Figure 24. Correlation analysis workflow for individual aggregated expertise parameters
Subsequently, a further analysis was also executed to determine the association between aggregated total
score of expertise with the feature quality. To do so, number of mapping days, longevity, number of edits
as well as software skill score that have a different scale of scores were normalized using simple
normalization formula (2) bellow, in order to reach the scale of 0 to 1 just like local knowledge and HOT
contribution parameters.
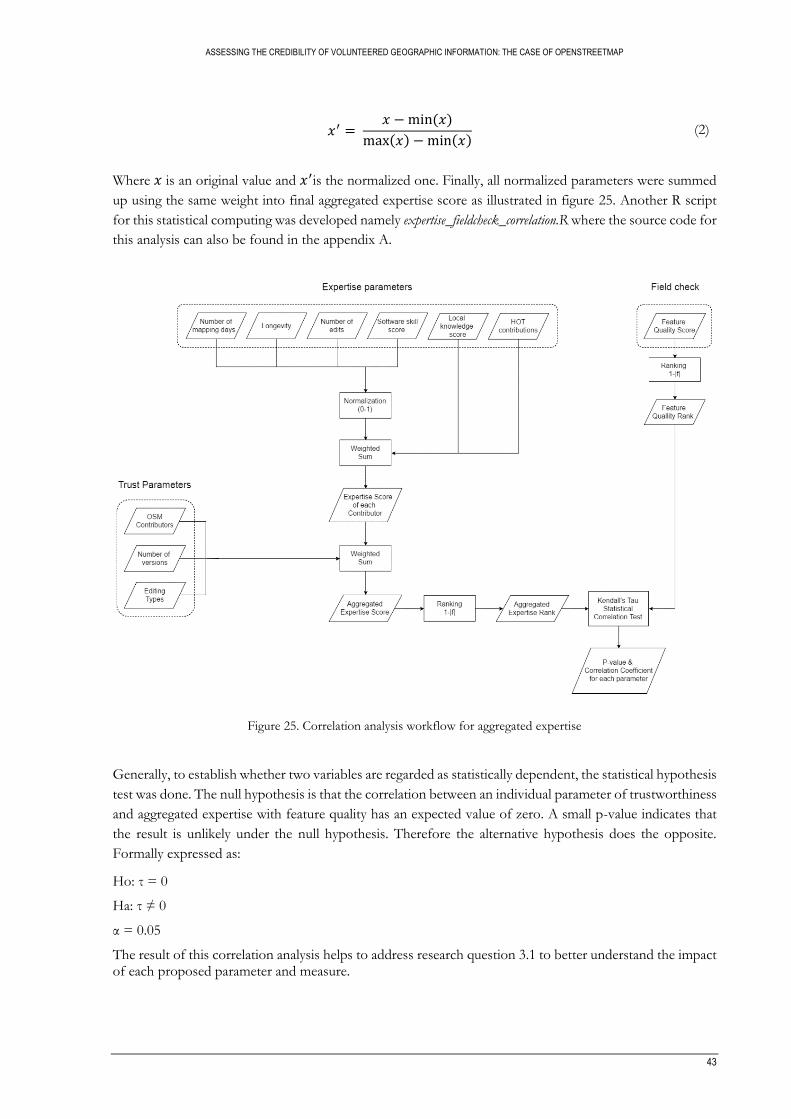
ASSESSING THE CREDIBILITY OF VOLUNTEERED GEOGRAPHIC INFORMATION: THE CASE OF OPENSTREETMAP
43
𝑥′ = 𝑥 − min (𝑥)
max(𝑥) − min(𝑥) (2)
Where 𝑥 is an original value and 𝑥′is the normalized one. Finally, all normalized parameters were summed
up using the same weight into final aggregated expertise score as illustrated in figure 25. Another R script
for this statistical computing was developed namely expertise_fieldcheck_correlation.R where the source code for
this analysis can also be found in the appendix A.
Figure 25. Correlation analysis workflow for aggregated expertise
Generally, to establish whether two variables are regarded as statistically dependent, the statistical hypothesis
test was done. The null hypothesis is that the correlation between an individual parameter of trustworthiness
and aggregated expertise with feature quality has an expected value of zero. A small p-value indicates that
the result is unlikely under the null hypothesis. Therefore the alternative hypothesis does the opposite.
Formally expressed as:
Ho: τ = 0
Ha: τ ≠ 0
α = 0.05
The result of this correlation analysis helps to address research question 3.1 to better understand the impact of each proposed parameter and measure.

ASSESSING THE CREDIBILITY OF VOLUNTEERED GEOGRAPHIC INFORMATION: THE CASE OF OPENSTREETMAP
44
3.5. Predictive Model
Another analysis was performed to go a step beyond the acquired data. A linear regression was used as a
predictive model for credibility assessment in this study. The quality score of OSM features taken in the
field is considered to give the highest quality of measurements. Unfortunately, this process is time and cost
consuming, so only a limited number of OSM dataset can be made. Besides, comparison with the
authoritative data is not always possible due to several reasons. Thus, the approach here is to use data from
trust-expertise parameters that have a strong correlation with the feature quality score. Statistical model was
developed to predict the OSM quality score as a response variable by integrating field check data and the
above examined intrinsic parameters.
To operationalize this regression analysis, the certain assumption for the parametric test must be made. The
test has four basic assumptions that should be true for the test to be accurate. These are (Field, 2013):
1. Normally distributed data: The rationale behind hypothesis testing depend on the data that is normally
distributed.
2. Homogeneity of variance: at each level of the predictor variable, the residual should have the same
variance (homoscedasticity)
3. Interval data. The data must be measured at least at the interval level.
4. Independence: the data about the study area derived from OSM platform are independent, which means
that behavior of one contributor does not influence the behavior of another. In regression, this relates
to the error in the regression model being uncorrelated.
For a trust-expertise parameter to be useful for predicting the response variable, there must be a significant
relationship between the two variables. In other words, as the aggregated expertise increases, the feature
quality as a response variable should increase or decrease replaced by defined line that fit the data expressed
as the following equation:
𝑌𝑖 = (𝑏0 + 𝑏1𝑋𝑖) + 𝜀𝑖 (3)
Where 𝑏0 is the intercept of the line and 𝑏1 is the gradient of the line. 𝑌𝑖 is the outcome of prediction and,
𝑋𝑖 is the predictor. 𝜀𝑖 is the residual that represents the difference between the predicted score and the
observation. In this way, the gradient must be different from zero. A hypothesis test can be used to evaluate
whether the gradient is significantly different from zero. A hypothesis test can be used to evaluate whether
the gradient is significantly different from zero. The null hypothesis is that the gradient is zero. A small p-
value indicates that the result is unlikely under the null hypothesis. Therefore the alternative hypothesis does
the opposite. Formally expressed as:
Ho: b1= 0
Ha: b1 ≠ 0
α = 0.05

ASSESSING THE CREDIBILITY OF VOLUNTEERED GEOGRAPHIC INFORMATION: THE CASE OF OPENSTREETMAP
45
RESULTS AND DISCUSSION
In the previous chapter, several variables and methods for statistical analysis to test the hypotheses were
discussed. This chapter focuses on explaining the results of correlation analysis for individual trust
parameters, expertise parameters as well as the aggregated expertise against the feature quality. The results
of predictive model are also interpreted. The results are followed by a discussion of reasons and opinions
on overall research. The last three research questions are addressed in this chapter.
4.1. Correlation Analysis Results
In order to assess the relationship between variables operationally described in section 3.4, repeated
measures of Kendall’s tau correlation were used. Upon running the first developed R script for the whole
dataset of 398 OSM features, the resulting correlation coefficients and the p-values of each individual testing
trust-quality, are summarized in table 13 below.
Table 13. Correlation test result for individual parameter of trustworthiness against feature quality
Trustworthiness Parameters p-value Kendall’s Tau
correlation coefficient (τ)
Number of Versions 2.2e-16 0.45069
Number of Users 2.2e-16 0.43129
Number of Confirmations 0.00026 0.15751
Number of Geometric corrections 2.2e-16 0.40219
Number of Tag corrections 1.5e-09 0.26096
Number of Main tag corrections 2.7e-07 0.22200
Number of Rollbacks 0.00263 0.13004
Number of Tag additions 3.3e-14 0.32489
Number of Tag removals 0.23850 0.05101
The resulting p-values for all trust parameters, except tag removals, are very small (<<0.05) indicating that
the outcome is very unlikely under the null hypothesis. Thus, one can be confident to say that the strength
of correlation between these trust parameters is significantly different from zero. Nevertheless, the
parameter based on the number of tag removals has a very low correlation coefficient, indicating that there
is no strong relationship between increasing number of tag removals and the feature quality. The statement
about statistical significance could not be made based on this. In summary, number of versions and number
of users as key parameters which are the results of versioning scheme, give strong correlation as compared
to the other parameters. Number of geometric corrections also shows the same strength of level of
association. However, this parameter could contain the random error since some users slightly move the
vertex of particular feature only to increase their edits number and put themselves as the last users as
described in the previous section. Strictly speaking, it implies that number of versions and number of users
are sufficient to represent the trustworthiness of the OSM features as well as cover the other parameters
derived from editing types.

ASSESSING THE CREDIBILITY OF VOLUNTEERED GEOGRAPHIC INFORMATION: THE CASE OF OPENSTREETMAP
46
Table 14. Correlation test result for time effect parameter of trustworthiness against feature quality
Map Feature Type Sample
size p-value
Kendall’s Tau correlation
coefficient (τ)
Highway, Railway, Waterway 122 0.04713 -0.13649
General building and Landuse 93 0.75360 0.02871
Commercial and informal settlement 130 2.7e-07 -0.38304
Long living object 53 0.09959 -0.16865
In addition, table 14 displays the result of a specific investigation in the days since last edit parameter for
each of generalized feature types. The correlation coefficient and the p-value for each category were
obtained. However, only commercial and informal settlement feature category has the high negative
correlation (-0.38304) with a very small p-value (<<0.005) indicating that shorter the time a feature has been
present over time, higher the probability that feature corresponds to the reality. It supports the assumption
that these kinds of features are the most unstable features.
However, the other three groups of map feature types have a weak association to support the assumption
regarding this parameter. A more detailed investigation with a larger dataset for each feature type (especially
long-living objects) would be useful to prove this assumption. As a consideration, one point of time used
for extracting the data could be not the time when all features have a stable version.
Furthermore, the second correlation test evaluating the expertise against feature quality has been performed.
The aggregated expertise for each parameter has been calculated by combining the expertise level of all users
contributing to the same OSM feature. These individual aggregated expertise parameters were ranked and
then correlated with feature quality ranks. The results are shown in table 15.
Table 15. Correlation test results for individual aggregated expertise parameters against feature quality
Expertise Parameters p-value Kendall’s Tau correlation
coefficient (τ)
Number of edits 2.2e-16 0.30423
Number of mapping days 8.9e-16 0.29928
Longevity 2.2e-16 0.33177
Local knowledge 0.00025 0.14538
Software skill 2.2e-16 0.53313
HOT contribution 2.2e-16 0.40779
The strength of correlation between those individual aggregated expertise parameters is significantly
different from zero as indicated by small p-value (<<0.005). The results apparently denote the aggregated
expertise as a better parameter to estimate the feature quality as compared to the previous trust measure.
Since the model implementation applied the same weight for editing types, the above-mentioned parameters
actually show the improvement of a version count moderated by different user properties which are the
trust parameters.
The total aggregated expertise scores attached in 398 OSM features have also been calculated, and the
distribution of the scores are illustrated as QQ plot in figure 26 below.

ASSESSING THE CREDIBILITY OF VOLUNTEERED GEOGRAPHIC INFORMATION: THE CASE OF OPENSTREETMAP
47
Figure 26. QQ plot of aggregated expertise score
Later, the scores were transformed into ranks and finally correlated with the quality ranks. The noticeable
strong correlation coefficient shown in the table 16 below verified the general hypothesis that the OSM
quality could be estimated based on the credibility measure represented by aggregated expertise as described
in the section 3.1.3.
Table 16. Correlation test result for total aggregated expertise against feature quality
Aggregated expertise Score p-value Kendall’s Tau correlation
coefficient (τ)
Combination of all expertise
score of users contributing to
the feature’s development
2.2e-16 0.51200
Subsequently, the more advanced statistical test was then implemented to understand the causation of one
variable by another. The combined expertise scores are proposed as the independent variable to predict the
feature quality using regression analysis as described in the following section.
4.2. Predictive Model Results
In the previous section, one confirmed the relationship between aggregated expertise and the feature quality.
These correlation tests can be very useful, but one can take this process a step further by predicting the
outcome variable (feature quality) from the independent one (aggregated expertise). As illustrated in figure
26 in the previous section, the independent variable is not normally distributed and rather shows the
exponential pattern.
Dealing with outliers
A scatter plot shown in figure 27 shows the detected outlier as they deviated from other sample points. The
top right outliers are the result of the positive skew of the data distribution. To address this issue, log
transformation opted to reduce the skewness of the data distribution. It also useful for correcting the
unequal variance as suggested by Field (2013).

ASSESSING THE CREDIBILITY OF VOLUNTEERED GEOGRAPHIC INFORMATION: THE CASE OF OPENSTREETMAP
48
Figure 27. Plot of quality against aggregated expertise and the outliers
Besides, the left down outliers are the unique case that entails deleting the data by the user who contributed
the outlier. It was identified that this random error was largely produced by only one particular contributor:
U39. Thus, 125 features that will affect the goodness of fit of the regression model were excluded from the
sample data.
After removing outliers to meet assumptions of linearity and homogeneity of variance, another scatter plot
was constructed using 273 sample OSM features as illustrated in figure 28. The straight green line was
created using a least square method that linearly fit the data. The plot shows a positive linear relationship
between quality score and aggregated expertise.
Figure 28. Plot of quality against aggregated expertise (ln)

ASSESSING THE CREDIBILITY OF VOLUNTEERED GEOGRAPHIC INFORMATION: THE CASE OF OPENSTREETMAP
49
Model Parameters
As shown in equation (3), 𝑏0 was the 𝑌 intercept of the line. So, from the table 17 one can say that 𝑏0 is
0.86938 that can be interpreted to mean that when the natural logarithm of aggregated expertise score is 0
(aggregated expertise score = 1) the model predicts that the feature will have quality score at least 0.86938
out of 1. Additionally, the value of 𝑏1 is 0.025205 that represents the gradient of regression line. This value
shows the change of feature quality score associated with the change in the aggregated expertise of their
contributors.
Table 17. Details of model parameters
Coefficients 𝒃 Std. Error (𝒔) 𝒕 Significance
Intercept
Aggregated expertise (ln)
0.86938
0.02520
0.00639
0.00407
136.1
6.2
.000
.000
If the predictor has a significant impact to predict the outcome, then 𝑏 should be different from 0 (relatively
bigger than its standard error 𝑠). The 𝑡-test tells whether 𝑏-values are different from 0. Since the observed
significance is .000, one can say that the probability of occurrence of above 𝑡-values or larger,if the value of
𝑏 in the population were 0, is less than .001. This indicates that the result is very unlikely under the null
hypothesis and one can conclude that the gradient 𝑏1 is significantly different from zero (p-value << 0.01).
In other words, the aggregated expertise makes significant contribution to predicting the quality score of
OSM features.
Model summary
The summary table 18 provides the value of R, R2 and adjusted R2 for the regression model. For these data,
R has a value of 0.35242 that represents the simple correlation between aggregated expertise on the feature
and its quality score derived from the field. The value of R2 is 0.12420 which tells that OSM feature quality
score can account for only 12.42% variation in the sample. There might be many factors that can influence
the variation of quality score, but this model which takes only the credibility of its contributors can explain
approximately 12.5% of this variation. This means that 87.5% of the variation in the quality score of OSM
feature cannot be explained solely by the credibility measure. Residual standard error (s) is a measure of the
spread of the residuals around the regression line. More details about model summary are shown in appendix
C.
Table 18. Overall fit of the predictive model
R R2 Adjusted R2 Residual standard error (s)
0.35242 0.12420 0.12100 0.06335
Checking assumptions
One still needs to check whether the regression assumptions are met or not. Figure 29 shows the relationship
between predictor and the outcome. The plot shows equally spread residuals around the line without distinct
patterns which is a good indication that predictor and the outcome do not have non-linear relationships.

ASSESSING THE CREDIBILITY OF VOLUNTEERED GEOGRAPHIC INFORMATION: THE CASE OF OPENSTREETMAP
50
Figure 29. Plot of residual against fitted value to
check the linearity
Figure 30. Normal Q-Q plot showing the normality
of residuals
To test the normality of residuals, one should look at the normal Q-Q plots. Figure 30 above indicates that
the residuals follow a straight line indicating that these residuals are normally distributed, although the
observations numbered as 1, 3, and 7 look a little off.
Figure 31. Spread-location plot showing the variance of the residual
The scale-location plot as illustrated in figure 31 above shows if the residuals are spread equally along the
range of predictors or not. The obtained plot specifies that at each level of the predictor variable, the variance
of residuals is constant as they are randomly and consistently spread along the line. Thus, the assumption
of homoscedasticity has been met.
4.3. Visualization of Implementation Results
A web mapping application was built to visualize the result of model implementation. It was developed also
leveraging university GIS enterprise portal. The web application is shared online
(http://utwente.maps.arcgis.com/apps/webappviewer/index.html?id=2391eb863d9047499fca548e4461c

ASSESSING THE CREDIBILITY OF VOLUNTEERED GEOGRAPHIC INFORMATION: THE CASE OF OPENSTREETMAP
51
d13). Figure 32 shows the user interface of the developed application. The OSM features in the study area
were overlaid on the current OSM map tiles.
Figure 32. User interface of OSM credibility assessment tool
The OSM features may be classified on the basis of the aggregated expertise score into three credibility
categories: high, moderate, and low. The high-credible feature was defined as the one which has aggregated
expertise score at least equal to the expertise score of “serious” mapper who has local knowledge of the
study area, uses high-level skill software and also actives as a HOT member. Moderate-credible features
mush have aggregated expertise score at least equal to the “serious” mapper who does not have the local
knowledge nor HOT contributor and only has the average skill level software. Consequently, the low-
credible features should have the lower score than that. Those two class boundaries were then calculated
and provided the result as 3.025 and 1.525 respectively.
Figure 33. OSM metadata

ASSESSING THE CREDIBILITY OF VOLUNTEERED GEOGRAPHIC INFORMATION: THE CASE OF OPENSTREETMAP
52
Clicking on of the OSM features gives the metadata with regard to the main attribute of the feature (name
and feature type), versioning information, lineage, date of the last edit as well as the feature aggregated
expertise score and the credibility level as shown in figure 33.
Figure 34. Time slider widget
This credibility assessment tool offers the time slider widget that allows the end user to explore the recency
of edit of a specific feature (figure 34). It can help the application user to assess the informational trust
according to the temporal effect. For further analysis, it also provides the filtering tool (figure 35). Querying
based on number of versions or number of users allow users to understand the collective edits on the study
area.
Figure 35. Filtering tool
To better identify the user(s) contributing to the particular features, this tool offers search widget to find
out the expertise information about the OSM contributors as illustrated in figure 36.
Figure 36. Individual contributor's search widget

ASSESSING THE CREDIBILITY OF VOLUNTEERED GEOGRAPHIC INFORMATION: THE CASE OF OPENSTREETMAP
53
By providing the user id, the more detailed information about a characteristic of the contributors is
presented along with the location of the first created node which estimates the residence or the place that
the OSM contributor is very familiar with (figure 37).
Figure 37. Profile metadata of OSM contributors
4.4. Discussion
Every VGI project has the community behind it. Implementing cross-community evaluation as a robust
method to find out the expertise element is not always possible. It is hard to search for and compare the
same contributor in different platforms because in some cases the particular user uses a different username
or even does not exist in the other social network platforms. Additionally, understanding the environment
and activity of the local community helped this study because it provided the general information about
overall contributors.
Through a set of experiments, the study aims to verify the different approaches of quality assessment by
looking at the properties of the VGI contributors. It identified the expertise of the contributors in donating
their knowledge, skill, and experience to the VGI platform. There is indeed the evolution of expertise level
over time that will introduce a lot of complexity in the model. Nevertheless, analyzing these variables are
beyond the scope of this study.
For the effectiveness, the semi-automated workflow to obtain the related information is needed as
comprehensively explained in the section 3.2.2. The experiment has not only demonstrated the development
of the credibility methods but also evaluated the proposed measure against the existing traditional spatial
data quality measure. This provided the evidence on how good the proposed credibility measure can help
to assess the quality when other measures are not presented. However, current model implementation was
limited by the process of manual inspection of specific edit for the new version done by the respective user.
Based on the data analysis discussed in section 3.3, the majority of data creation process of OSM features
in the study area was done by a small number of contributors. Further identification confirmed that those
contributors are the local users who are situated in close proximity to the study area. In contrast, the majority
of the data modification process was largely done by a small number of users who are both the local users
and also the remote contributors. It found that such contribution pattern is opposite to the pattern of
coordinated mapping initiatives held by the mapping party organizers where remote volunteers firstly trace

ASSESSING THE CREDIBILITY OF VOLUNTEERED GEOGRAPHIC INFORMATION: THE CASE OF OPENSTREETMAP
54
satellite imagery into OSM and then the local mappers of the respective area add local details. Altogether,
only 10% of contributors are mainly involved for the largest number of contributions to the projects. This
finding closely corresponds to the phenomenon of participation inequality in online and crowdsourcing
communities introduced by Nielsen (2006) where only small number of users account for most
contributions.
The fieldwork was done to obtain the external data quality metrics. However, the execution of the fieldwork
gave a good insight in the sense that using external data to validate the quality of OSM is effortful and time-
consuming.
The result of statistical correlation test in this study indicates that number of versions, as the baseline of
trustworthiness of VGI feature, gave the best correlation results as compared to other trust parameters. It
implied that the more VGI feature is improved and edited, the more trustworthy it is. Moreover, it
confirmed that the aggregated expertise measure is better in giving the estimation of feature quality than
trust measures based on the feature evolution and editing types. This proposed measure improved the
credibility of the VGI feature by introducing the properties of their contributors. This shows that the quality
is not solely determined by the number of versions created. However, quality definitely improves when the
number of contributors increases. In this way, there is perceived credibility as it holds some degree of both
expertise and trustworthiness in combination. However, the implemented model is coarse and simple,
because it has not yet taken the weight from the editing types done by the particular contributor that could
influence the calculation score and alter the edit wars if any. By leaving the edit type info in the model
implementation, one could argue this model is overestimating the credibility because it was not fit for a
highly contested feature where edits wars happen.
Another important finding was about the temporal effect. The statistical test confirmed that the strong
relation only exists for commercial and informal settlement feature category, but it is hard to say so for the
other feature type categories. However, one single point of time used to extract the data is not the same
time when all feature have stable version because essentially one could not find the perfect time to extract
the data for this case. A more detailed investigation with the larger dataset for each feature type (especially
long-living objects) would be useful to prove this assumption. Strictly speaking, looking at the feature type
and how long ago the last edit was, can additionally help to solely assess the informational trust.
The predictive model built for this case is the simple one where the predictor was transformed beforehand
to deal with the outliers that tend to skew the distribution. It is interesting to note that by implementing
linear regression, the aggregated expertise was found to cause the quality of information being produced.
Simply put, the predictor has a significant impact on predicting the outcome. Furthermore, the result of
diagnostic statistics inferred that the general assumptions of a parametric test such as linearity of relationship,
the normality of residuals as well as the homogeneity of variance seem to have been met. On the other hand,
the goodness of fit of the model is relatively very low which only explain about 12.5% of the variability of
the response data around its mean. To point out, as some research suggests, investigating the human
behavior typically results in R-squared values lower than 20% simply because human factors are harder to
model than physical processes. Regardless, one can predict whether a feature is credible according to the
feature aggregated expertise score.
In the end, returning to the hypothesis posed at the beginning of this study, it is now possible to state that
credibility measure in the form of aggregated expertise can help to assess the quality of VGI as the other
measures could be implemented.

ASSESSING THE CREDIBILITY OF VOLUNTEERED GEOGRAPHIC INFORMATION: THE CASE OF OPENSTREETMAP
55
CONCLUSIONS AND RECOMMENDATIONS
5.1. Conclusions
I have used concepts from ISO spatial data measures and the notion of information credibility to assess
OSM quality. Meta-data of OSM features was used to model the evolution of features over time and was
combined with information on the proficiency and experience of the contributors. Together, these form the
novel quality measure of aggregated expertise that contributes to overall information credibility. Although
it might be difficult to exactly predict the quality of every single feature based on the credibility of their
contributors, it might be promising to estimate the overall credibility of VGI features in a particular area. In
summary, this study provided the following answers to the research questions posed in section 1.2:
1.1. Which existing criteria or measures are used to describe online communities?
In the online community, members interact with each other virtually via the internet. Identifying the
number of OSM users that make most contributions could be useful to describe this online community
in the study area. About 10% of contributors made the largest number of contributions, indicating the
participation inequality phenomenon. Cross-referencing them to find and compare the same members
in the different online platforms can help to evaluate and describe the online volunteer communities.
This study also compared the general OSM community in the study area with the coordinated mapping
community of the Humanitarian OSM Team. The 9 HOT contributors have higher skills of software,
motivation, and experience than the non-HOT members. Information about this local community
helps to provide general information about overall contributors. However, finding out the direct
information of expertise regarding professional or educational background on other profession-
oriented social network platforms such as LinkedIn was not trivial. Thus, the intrinsic approach was
chosen to provide the behavior of OSM members to contribute to the platform.
1.2. What are the motivations and characteristics of OSM contributors and what is the process of mapping?
The potential reasons to contribute to OSM varies and can be considered as intrinsic and extrinsic
motivators as outlined in the literature review section. The heterogeneity of contributor experience and
skills in the study area leads to the conclusion that this area has been mapped by two classes of OSM
users; “serious” and “casual” mappers that have different motivations. All of the remote contributors
are indicated as “serious” mappers while the local contributors consist of both “serious” and “casual”
mappers. Furthermore, we also identified that the process of development of geographic features was
started by “serious” mappers situated around the study area. It was found to be opposite to the mapping
process done through coordinated mapping project called “mapping party” or “mapathon”.
2.1. What are the quality elements that are relevant to assess the credibility of VGI?
This study firstly outlined the concept of spatial data quality element then suggested the credibility
indicator to estimate the quality. Provided that map-based VGI was taken as a case study, it was decided
to use ISO standardized measure as the extrinsic component to evaluate the proposed credibility
measure. Main reason is that this type of VGI has explicit geographic component allowing to use
traditional metrics. Besides, map-based VGI is usually utilized for the feature search and navigation
that makes the semantic accuracy, topological consistency, and completeness the most important
elements for this case. In essence, the positional accuracy issue can be addressed as long as the feature
is topologically correct while the temporal accuracy was managed by the error of commission.

ASSESSING THE CREDIBILITY OF VOLUNTEERED GEOGRAPHIC INFORMATION: THE CASE OF OPENSTREETMAP
56
2.2. Which parameters can be used to develop the credibility measures for assessing VGI?
Two key criteria to develop parameters for credibility measure are the trustworthiness and the expertise of
the contributors. Those criteria were adopted from the previous research on credibility. Trust has a
subjective component that could not be adopted in a geospatial context. Therefore, the notion of
informational trust that has more objective sense was applied, and a data-oriented approach identifying
the history of changes on the geographic feature was implemented. In this way, number of versions,
number of users, and various editing types were chosen as trust parameters of OSM features. Time
effect was also used as an additional trust indicator. With regard to second criteria, a community-
oriented approach was selected to estimate the expertise of VGI contributor by looking at their skills,
motivation, experience and local knowledge. Thus, number of mapping days, longevity of contribution,
software used, number of edits and distance to the study area were used as preferred expertise
parameters. Later, a combination of all parameters mentioned before introduced the notion of
“aggregated expertise”. Generally speaking, the model discussed in this study can also work with any
VGI system that supports feature versioning and records user profile/reputation information.
3.1. Which of the developed parameters are useful to model OSM credibility?
The result of correlation analyses showed that the higher the number of versions created and users
involved, the higher the quality of geographic feature being produced. The other trust parameters,
however, have a relatively weak association with the feature quality. Additionally, the trustworthiness
of OSM feature can be perceived by looking at the recent edits to the feature types. The aggregated
expertise measure gave a better estimation of feature quality than trust measures based on the feature
evolution and editing types.
3.2. Which modeling technique are useful for assessing OSM credibility?
Correlation analysis could tell the strength of the relationship between individual trust and expertise
parameters and the overall feature quality. It was helpful to better understand the impact of each
proposed parameter. However, the regression could express the causation issue of two variables. It
allowed predicting the value of features’ quality based on the aggregated expertise of their contributors.
A weighted sum model (WSM) was applied to come up with the expertise score for each contributor
where all the parameters were expressed in exactly the same unit beforehand. The aggregated expertise
scores were likewise calculated using WSM by combining all the expertise scores for all versions created
including the editing types.
4.1. How can the developed credibility model be implemented?
The exact implementation depends on the available meta-data from the VGI versioning system and
the information about profile metadata of their contributors. Those are subject to the evaluation that
indicates the parameter of credibility. A case study of OSM proved the feasibility of operationalizing
this model. All the required information was extracted using semi-automated workflow. The expertise
level of every single contributor was determined and then used as the baseline to estimate the credibility
level of geographic features through the aggregated expertise.
4.2. How well does the implemented model perform?
This study has shown that a comparison between two correlation tests’ outcomes -trust and aggregated
expertise model, delivered a suggestion of how well the model’s performance is. From the test result,
it was shown that aggregated expertise provides an adequate explanation of VGI credibility in contrast
to version and user count only. Further, the investigation of the temporal effect on feature’s

ASSESSING THE CREDIBILITY OF VOLUNTEERED GEOGRAPHIC INFORMATION: THE CASE OF OPENSTREETMAP
57
trustworthiness could not say more since the commercial and informal settlements such as café,
commercial building, informal settlement, etc. are the most dynamic feature category that made them
correspond to the reality due to the higher currency of edit. Equally important to note is that regardless
of the R-squared value, the aggregated expertise model could be a significant predictor of a quality
score of the geographic feature.
5.2. Recommendations for Future Work
The developed semi-automated workflow will be more beneficial when one can fully automate all the data
processing that makes it possible to handle large datasets in a short period of time. With regard to OSM
feature elements, the current study has only examined the geographic features in the form of nodes and ways.
Future works might explore the relations element (e.g. turn restrictions, bus routes, multipolygon, etc.) as the
additional information to be evaluated since OSM has also been being utilized for routing and navigation
applications. Additionally, further research might include other data sets to verify the information in OSM
such as comments/feedbacks recorded in changesets, the personality of the contributors, or other external
data sets.
A small region was chosen as the OSM sampling design in order to find a balance between a number of
features to deal with for the field check and the time limitation. Some findings introduced in this study could
contain a local pattern. Therefore, it would be interesting to implement the developed method and model
to a different sample and see the similarity and differences in results. It would be worthwhile for model
improvement.
Trust assessment in this study relied upon the last version of VGI features because the field check could
only assess the quality of the final version. However, evaluating if every single version created as a
contribution to that particular version is trustworthy or not could be interesting for further investigation.
To do so, one needs reference data that has the same time frame with every feature version. In the same
manner, the information about number of days since the last edit could only reveal the trustworthiness of
the last feature version. More details about the number of days between two successive versions would help
in establishing a better analysis on this matter, as one could expect the number of days between edits to
increase over time, with the feature reaching a stable point. One should also consider the edit types. In this
way, tag correction should be a baseline to come up with the idea of time effect.
To keep it simple, the existing model implementation was only used for one point of time to extract the
expertise information. Thus, this research has thrown up the question of the dynamic transformation of
contributor expertise in need of further investigation. In some other VGI platforms, the contributors might
not have any metadata profile for direct cues on expertise. In this case, one has to rely on external
information about the contributors. Future research about expertise on VGI should, therefore, concentrate
on the development of cross-community evaluation that will provide a more robust assessment.
The aggregated expertise model has conceptually managed to incorporate the profile metadata and the
feature evolution information. Edit types evidence has been counted in an aggregated expertise model with
equal weights. More research is needed to better understand the impact of the different edits to adjust the
calculation of aggregated expertise of particular feature. Other implementation methods involving
multiplication or division of expertise score by edit type would generate different results.
The predictive model built using linear regression has met the assumption of linearity, the normality of
residual and homogeneity of variance, but the model fit for predicting a continuous outcome variable has
room for improvement. Implementing a binary logistic regression would generate a different form of the
ASSESSING THE CREDIBILITY OF VOLUNTEERED GEOGRAPHIC INFORMATION: THE CASE OF OPENSTREETMAP
58
model, that could be useful to predict which of two categories (credible vs. uncertain) a VGI feature is likely
to belong to, given the skills, motivation, experience and local knowledge parameters of their contributors.
This regression technique will allow us to predict whether a geographic feature is likely to be of low or high
credibility. Labeling credibility classes of the training dataset could use the threshold information from the
quality scores where the highly credible feature should at least have the attribute accuracy, completeness and
topological consistency score of 0.7, 0.5 and 1 respectively.
Regardless of the implementation result of OSM case study, it is necessary to state the recommendation
about some basic requirements for such a crowdsourcing or volunteered geographic information project
according to the developed conceptual model. Every version of feature changes should be recorded along
with at least the collection time, name of the contributor, as well as the software used (if vary). Those form
the baseline to reveal feature trustworthiness. The system should also have a good mechanism to record the
basic profile information of the contributors. Information about contributor’s reputation could also be
beneficial as key information about user expertise. Providing an option to register or connect with existing
social media could be useful for further user identification. Additionally, it is recommended that the VGI
system should also provide a scheme to comment and rate the contributors or even VGI features.

ASSESSING THE CREDIBILITY OF VOLUNTEERED GEOGRAPHIC INFORMATION: THE CASE OF OPENSTREETMAP
59
LIST OF REFERENCES
Antoniou, V., & Skopeliti, A. (2015). Measures and Indicators of Vgi Quality: an Overview. ISPRS Annals of Photogrammetry, Remote Sensing and Spatial Information Sciences, II-3/W5, 345–351. http://doi.org/10.5194/isprsannals-II-3-W5-345-2015
Artz, D., & Gil, Y. (2007). A survey of trust in computer science and the Semantic Web. Web Semantics: Science, Services and Agents on the World Wide Web, 5(2), 58–71. http://doi.org/10.1016/j.websem.2007.03.002
Barron, C., Neis, P., & Zipf, A. (2014). A Comprehensive Framework for Intrinsic OpenStreetMap Quality Analysis. Transactions in GIS, 18(6), 877–895. http://doi.org/10.1111/tgis.12073
Bégin, D., Devillers, R., & Roche, S. (2013). Assessing Volunteered Geographic Information (VGI) quality based on contributors’ mapping behaviours. ISPRS - International Archives of the Photogrammetry, Remote Sensing and Spatial Information Sciences, XL-2/W1(2), 149–154. http://doi.org/10.5194/isprsarchives-XL-2-W1-149-2013
Bishr, M., & Janowicz, K. (2010). Can we Trust Information? -The Case of Volunteered Geographic Information. In Towards Digital Earth: Search, Discover and Share Geospatial Data Workshop at Future Internet Symposium. Berlin.
Bishr, M., & Kuhn, W. (2007). Geospatial Information Bottom-Up: A Matter of Trust and Semantics. In The European Information Society (pp. 365–387). Springer Berlin Heidelberg. http://doi.org/10.1007/978-3-540-72385-1_22
Budhathoki, N. R., & Haythornthwaite, C. (2013). Motivation for Open Collaboration: Crowd and Community Models and the Case of OpenStreetMap. American Behavioral Scientist, 57(5), 548–575. http://doi.org/10.1177/0002764212469364
Chapman, K. (2012). Community Mapping for Exposure in Indonesia. Jakarta, Indonesia.
Craglia, M., Ostermann, F., & Spinsanti, L. (2012). Digital Earth from vision to practice: making sense of citizen-generated content. International Journal of Digital Earth, 5(5), 398–416. http://doi.org/10.1080/17538947.2012.712273
Dittus, M., Quattrone, G., & Capra, L. (2016). Analysing Volunteer Engagement in Humanitarian Mapping: Building Contributor Communities at Large Scale. In Proceedings of the 19th ACM Conference on Computer-Supported Cooperative Work & Social Computing - CSCW ’16 (pp. 108–118). New York, New York, USA: ACM Press. http://doi.org/10.1145/2818048.2819939
Field, A. (2013). Discovering Statistics using IBM SPSS Statistics. Sage Publications Ltd.
Flanagin, A. J., & Metzger, M. J. (2008). The credibility of volunteered geographic information. GeoJournal, 72(3), 137–148. http://doi.org/10.1007/s10708-008-9188-y
Fogg, B. J., Tseng, H., Hall, C., & Drive, H. (1999). Elements of computer credibility. Conference on Human Factors in Computing Systems - Proceedings, (May), 80–87. http://doi.org/10.1145/302979.303001
Girres, J. F., & Touya, G. (2010). Quality Assessment of the French OpenStreetMap Dataset. Transactions in GIS, 14(4), 435–459. http://doi.org/10.1111/j.1467-9671.2010.01203.x
Goodchild, M. F. (2006). Foreword. In R. Devillers & R. Jeansoulin (Eds.), Fundamentals of Statial Data Quality (p. 13).
Goodchild, M. F. (2007). Citizens as sensors: The world of volunteered geography. GeoJournal, 69(4), 211–221. http://doi.org/10.1007/s10708-007-9111-y
Haklay, M. (2010). How Good is Volunteered Geographical Information? A Comparative Study of OpenStreetMap and Ordnance Survey Datasets. Environment and Planning B: Planning and Design, 37(4), 682–703. http://doi.org/10.1068/b35097

ASSESSING THE CREDIBILITY OF VOLUNTEERED GEOGRAPHIC INFORMATION: THE CASE OF OPENSTREETMAP
60
Haklay, M., & Weber, P. (2008). OpenStreetMap: User-Generated Street Maps. IEEE Pervasive Computing, 7(4), 12–18. http://doi.org/10.1109/MPRV.2008.80
Harvey, F. (2013). To Volunteer or to Contribute Locational Information? Towards Truth in Labeling for Crowdsourced Geographic Information. In Crowdsourcing Geographic Knowledge (pp. 31–42). Dordrecht: Springer Netherlands. http://doi.org/10.1007/978-94-007-4587-2_3
Idris, N. H., Jackson, M. J., & Ishak, M. H. I. (2014). A conceptual model of the automated credibility assessment of the volunteered geographic information. IOP Conference Series: Earth and Environmental Science, 18(1), 12070. http://doi.org/10.1088/1755-1315/18/1/012070
Keßler, C., & de Groot, R. T. A. (2013). Trust as a Proxy Measure for the Quality of Volunteered Geographic Information in the Case of OpenStreetMap. In Geographic information science at the heart of Europe (pp. 21–37). Springer International Publishing. http://doi.org/10.1007/978-3-319-00615-4_2
Keßler, C., Trame, J., & Kauppinen, T. (2011). Tracking Editing Processes in Volunteered Geographic Information: The Case of OpenStreetMap. In Proceedings of Workshop on Identifying Objects, Processes and Events in Spatio-Temporally Distributed Data. Belfast, ME.
Mooney, P., & Corcoran, P. (2012a). Characteristics of Heavily Edited Objects in OpenStreetMap. Future Internet, 4(4), 285–305. http://doi.org/10.3390/fi4010285
Mooney, P., & Corcoran, P. (2012b). The Annotation Process in OpenStreetMap. Transactions in GIS, 16(4), 561–579. http://doi.org/10.1111/j.1467-9671.2012.01306.x
Neis, P. (2012). How did you contribute to OpenStreetMap? Retrieved November 7, 2016, from http://neis-one.org/2012/10/overhauling-hdyc/
Neis, P., & Zielstra, D. (2014). Recent Developments and Future Trends in Volunteered Geographic Information Research: The Case of OpenStreetMap. Future Internet, 6(1), 76–106. http://doi.org/10.3390/fi6010076
Neis, P., Zielstra, D., & Zipf, A. (2011). The Street Network Evolution of Crowdsourced Maps: OpenStreetMap in Germany 2007–2011. Future Internet, 4(4), 1–21. http://doi.org/10.3390/fi4010001
Neis, P., & Zipf, A. (2012). Analyzing the Contributor Activity of a Volunteered Geographic Information Project — The Case of OpenStreetMap. ISPRS International Journal of Geo-Information, 1(3), 146–165. http://doi.org/10.3390/ijgi1020146
Nelsen, R. B. (2001). Kendall tau metric. Retrieved January 19, 2017, from https://www.encyclopediaofmath.org/index.php/Kendall_tau_metric
Nielsen, J. (2006). Participation Inequality: The 90-9-1 Rule for Social Features. Retrieved February 1, 2017, from https://www.nngroup.com/articles/participation-inequality/
OpenStreetMap Wiki. (2016a). Elements. Retrieved January 7, 2017, from https://wiki.openstreetmap.org/wiki/Elements
OpenStreetMap Wiki. (2016b). History API. Retrieved October 1, 2017, from http://wiki.openstreetmap.org/wiki/Contributors#Finding_contributors
OpenStreetMap Wiki. (2016c). Stats. Retrieved November 15, 2016, from http://wiki.openstreetmap.org/wiki/Stats
OpenStreetMap Wiki. (2016d). Version numbers/optimistic locking. Retrieved January 7, 2017, from http://wiki.openstreetmap.org/wiki/API_v0.6#Version_numbers.2Foptimistic_locking
Parker, C. J., May, A., & Mitchell, V. (2012). Understanding Design with VGI Using an Information Relevance Framework. Transactions in GIS, 16(4), 545–560. http://doi.org/10.1111/j.1467-9671.2012.01302.x
Ramm, F., Topf, J., & Chilton, S. (2010). OpenStreetMap: Using and Enhancing the Free Map of the World. Cambridge, UK: UIT Cambridge.

ASSESSING THE CREDIBILITY OF VOLUNTEERED GEOGRAPHIC INFORMATION: THE CASE OF OPENSTREETMAP
61
Senaratne, H., Mobasheri, A., Ali, A. L., Capineri, C., & Haklay, M. (Muki). (2016). A review of volunteered geographic information quality assessment methods. International Journal of Geographical Information Science, 1–29. http://doi.org/10.1080/13658816.2016.1189556
van Exel, M., Dias, E., & Fruijtier, S. (2010). The impact of crowdsourcing on spatial data quality indicators. In Proceedings of the Sixth International Conference on Geographic Information Science (GIScience 2010). Zurich.
van Oort, P. A. J. (2006). Spatial data quality: from description to application. Wageningen University, NL.
Vandecasteele, A., & Devillers, R. (2015). Improving Volunteered Geographic Information Quality Using a Tag Recommender System: The Case of OpenStreetMap. In OpenStreetMap in GIScience (pp. 59–80). Springer International Publishing. http://doi.org/10.1007/978-3-319-14280-7_4
Yang, A., Fan, H., & Jing, N. (2016). Amateur or Professional: Assessing the Expertise of Major Contributors in OpenStreetMap Based on Contributing Behaviors. ISPRS International Journal of Geo-Information, 5(2), 21. http://doi.org/10.3390/ijgi5020021

62
APPENDIX A
This appendix contains all source code for obtaining and processing the data. The code is written in python version 2.7 and R version 3.2.3.
Historical Data Extraction (history.py)
1. # Name : history.py 2. # Purpose : to download historical data of OpenStreetMap 3. # Author : [email protected] 4. # Input file : list of ways or nodes OSM id 5. # Output file : list of changeset, timestamp, user and uid of each version for eac
h OSM feature 6. 7. from __future__ import print_function 8. import collections 9. import json 10. import demjson 11. import sys 12. import urllib2 13. import sys 14. import xml.etree.ElementTree as ET 15. 16. #functions to check duplicated changesets due to software bug 17. def check_double(changeset_final,find): 18. find=0 19. for i in changeset_final: 20. if i==find: 21. find=1 22. else: 23. find=0 24. return find 25. 26. if len(sys.argv)<3: 27. print ('python history.py <input_file> <output_file>') 28. exit(0) 29. else: 30. try: 31. names=open(sys.argv[1]) 32. except: 33. print('File \'',sys.argv[1],'\' cannot be opened') 34. exit(0) 35. 36. outfile=sys.argv[2]+'.csv' 37. fout=open(outfile,'w') 38. 39. for nm in names: 40. tmp=nm+'/history' 41. tmp=tmp.replace('\n','') 42. #url='http://api.openstreetmap.org/api/0.6/node/'+tmp 43. url='http://api.openstreetmap.org/api/0.6/way/'+tmp 44. 45. try: 46. response=urllib2.urlopen(url) 47. html=response.read() 48. root=ET.fromstring(html) 49. root.tag,root.attrib 50.

63
51. changeset=list() 52. version=list() 53. tmp=list() 54. ver_changeset=dict() 55. for c in root: 56. changeset.append(c.attrib['changeset']) 57. version.append(c.attrib['version']) 58. ver_changeset[c.attrib['version']]=c.attrib['changeset'] 59. 60. version.reverse() 61. changeset.reverse() 62. 63. ver_final=list() 64. changeset_final=list() 65. for i in range(0,len(version)): 66. if len(ver_final)==0: 67. ver_final.append(version[i]) 68. changeset_final.append(changeset[i]) 69. else: 70. if(check_double(changeset_final,changeset[i]))==0: 71. ver_final.append(version[i]) 72. changeset_final.append(changeset[i]) 73. else: 74. pass 75. ver_final.reverse() 76. 77. version.reverse() 78. changeset.reverse() 79. 80. for i in range(0,len(version)): 81. pass 82. print('\n\nWriting ',nm,' to ',outfile,end='....') 83. nm=nm.rstrip('\r\n') 84. fout.write(nm) 85. fout.write(',') 86. for c in ver_final: 87. for r in root: 88. if c==r.attrib['version']: 89. fout.write(r.attrib['changeset']) 90. fout.write(',') 91. fout.write(r.attrib['timestamp']) 92. fout.write(',') 93. fout.write(r.attrib['version']) 94. fout.write(',') 95. fout.write(r.attrib['user']) 96. fout.write(',') 97. fout.write(r.attrib['uid']) 98. fout.write(',') 99. 100. fout.write('\n') 101. print('...Done',end='\n') 102. except urllib2.HTTPError,e: 103. print(nm,'raise HTTPError : ',str(e.code),end='\n\n') 104. pass 105. except Exception: 106. pass 107. fout.close()
Contributor profile data extraction (contributors.py)
1. # Name : contributors.py 2. # Purpose : to download a number of profile information of OSM contributors 3. # Author : [email protected]

64
4. # Input file : list OSM username 5. # Output file : name, uid, since, GPS-
tracks, first_node_id, first_node_tstamp, first_node_lon, first_node_lat, last_node_id, last_node_tstamp, last_node_lon, last_node_lat, nodes_created, nodes_modified, nodes_deleted, ways_created, ways_modified, way_deleted, relations_created, relations_modified, relations_deleted, changesets, map changes, max_gap_days, mapping days, used editors/programs, amenity, boundary, building, highway, landuse, leisure, name, natural, railway, addr for each OSM contributor
6. 7. from __future__ import print_function 8. import json 9. import demjson 10. import urllib2 11. import sys 12. 13. if len(sys.argv)<3: 14. print ('python contributor.py <input_file> <output_file>') 15. exit(0) 16. else: 17. try: 18. names=open(sys.argv[1]) 19. except: 20. print('File \'',sys.argv[1],'\' cannot be opened') 21. exit(0) 22. 23. def key_check(x,keys): 24. valid_key=list() 25. false=0 26. for i in keys: 27. for j in x: 28. if i==j: 29. valid_key.append(j) 30. 31. if(len(keys)-len(valid_key)!=0): 32. false=len(keys)-len(valid_key) 33. for t in [0,false]: 34. valid_key.append('flag') 35. return valid_key 36. 37. def writeto(x,keys): 38. valid_key=key_check(x,keys) 39. for i in valid_key: 40. k=str(i) 41. if i=='flag' or x[k]=='': 42. fout.write('N/A,') 43. else: 44. fout.write(str(x[k])) 45. fout.write(',') 46. 47. count=0 48. fout=open(sys.argv[2],'w') 49. 50. for i in names: 51. response=urllib2.urlopen('http://hdyc.neis-one.org/search/'+i) 52. html=response.read() 53. 54. if (html!='{"blablub":"baaaaaaaaaam"}'): 55. config=json.loads(html) 56. x=demjson.decode(json.dumps(config["contributor"])) 57. 58. keys=list() 59. keys=['name','uid','since','traces'] 60. writeto(x,keys) 61. 62. x=demjson.decode(json.dumps(config["node"]))
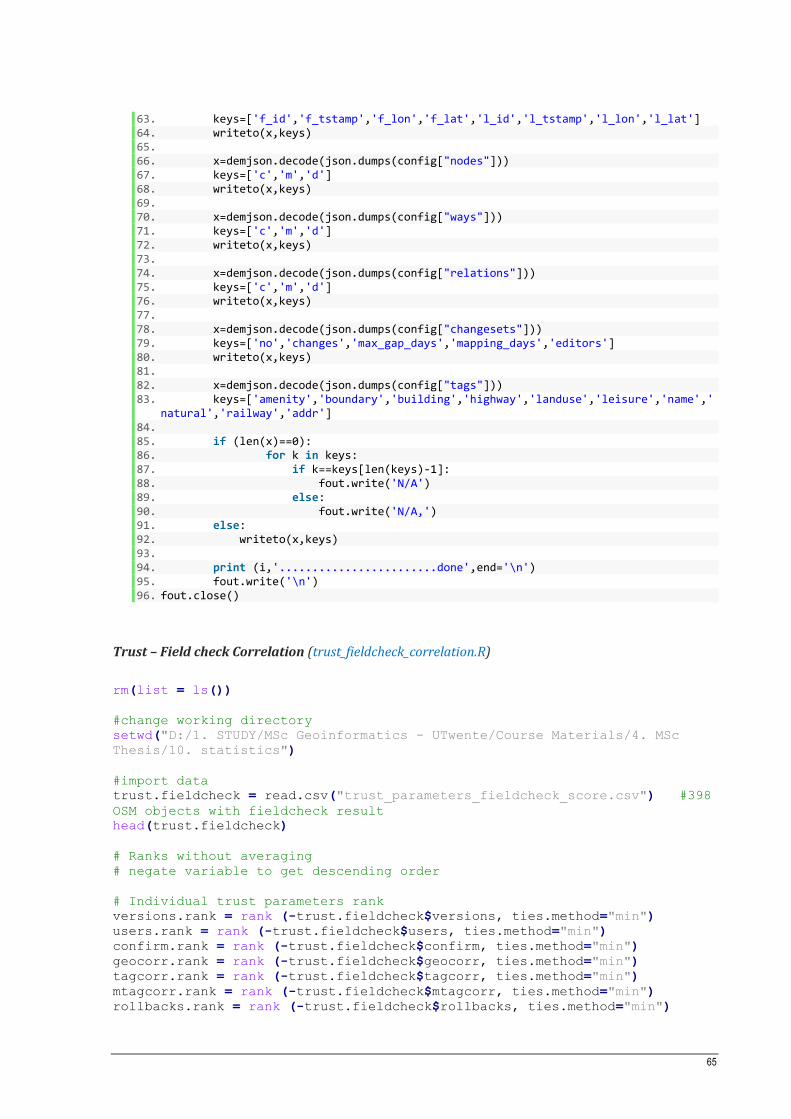
65
63. keys=['f_id','f_tstamp','f_lon','f_lat','l_id','l_tstamp','l_lon','l_lat'] 64. writeto(x,keys) 65. 66. x=demjson.decode(json.dumps(config["nodes"])) 67. keys=['c','m','d'] 68. writeto(x,keys) 69. 70. x=demjson.decode(json.dumps(config["ways"])) 71. keys=['c','m','d'] 72. writeto(x,keys) 73. 74. x=demjson.decode(json.dumps(config["relations"])) 75. keys=['c','m','d'] 76. writeto(x,keys) 77. 78. x=demjson.decode(json.dumps(config["changesets"])) 79. keys=['no','changes','max_gap_days','mapping_days','editors'] 80. writeto(x,keys) 81. 82. x=demjson.decode(json.dumps(config["tags"])) 83. keys=['amenity','boundary','building','highway','landuse','leisure','name','
natural','railway','addr'] 84. 85. if (len(x)==0): 86. for k in keys: 87. if k==keys[len(keys)-1]: 88. fout.write('N/A') 89. else: 90. fout.write('N/A,') 91. else: 92. writeto(x,keys) 93. 94. print (i,'........................done',end='\n') 95. fout.write('\n') 96. fout.close()
Trust – Field check Correlation (trust_fieldcheck_correlation.R)
rm(list = ls())
#change working directory
setwd("D:/1. STUDY/MSc Geoinformatics - UTwente/Course Materials/4. MSc
Thesis/10. statistics")
#import data
trust.fieldcheck = read.csv("trust_parameters_fieldcheck_score.csv") #398
OSM objects with fieldcheck result
head(trust.fieldcheck)
# Ranks without averaging
# negate variable to get descending order
# Individual trust parameters rank
versions.rank = rank (-trust.fieldcheck$versions, ties.method="min")
users.rank = rank (-trust.fieldcheck$users, ties.method="min")
confirm.rank = rank (-trust.fieldcheck$confirm, ties.method="min")
geocorr.rank = rank (-trust.fieldcheck$geocorr, ties.method="min")
tagcorr.rank = rank (-trust.fieldcheck$tagcorr, ties.method="min")
mtagcorr.rank = rank (-trust.fieldcheck$mtagcorr, ties.method="min")
rollbacks.rank = rank (-trust.fieldcheck$rollbacks, ties.method="min")

66
tagadd.rank = rank (-trust.fieldcheck$tagadd, ties.method="min")
tagrem.rank = rank (-trust.fieldcheck$tagrem, ties.method="min")
#Field check score
fieldcheck.scores = trust.fieldcheck$quality_score
# Field check rank
fieldcheck.rank = rank(-fieldcheck.scores, ties.method="min")
# Kendall's Tau correlation: individual parameters against fieldcheck score
cor.test(versions.rank, fieldcheck.rank, method="kendall")
cor.test(users.rank, fieldcheck.rank, method="kendall")
cor.test(confirm.rank, fieldcheck.rank, method="kendall")
cor.test(geocorr.rank, fieldcheck.rank, method="kendall")
cor.test(tagcorr.rank, fieldcheck.rank, method="kendall")
cor.test(mtagcorr.rank, fieldcheck.rank, method="kendall")
cor.test(rollbacks.rank, fieldcheck.rank, method="kendall")
cor.test(tagadd.rank, fieldcheck.rank, method="kendall")
cor.test(tagrem.rank, fieldcheck.rank, method="kendall")
Aggregated expertise – Field check Correlation (expertise_fieldcheck_correlation.R)
rm(list = ls())
#change working directory
setwd("D:/1. STUDY/MSc Geoinformatics - UTwente/Course Materials/4. MSc
Thesis/10. statistics")
#import data
expertise.fieldcheck = read.csv("expertise_score_fieldcheck_score.csv")
#398 OSM objects with aggregated expertise score and fieldcheck result
head(expertise.fieldcheck)
#Aggregated expertise parameter score by number of versions
agg.edit = expertise.fieldcheck$agg_map_changes
agg.mappingdays = expertise.fieldcheck$agg_mapping_days
agg.longevity = expertise.fieldcheck$agg_longevity
agg.localknowledge = expertise.fieldcheck$agg_localknowledge
agg.softwareskill = expertise.fieldcheck$agg_softwareskill
agg.hotcontrib = expertise.fieldcheck$agg_HOT_contributors
#Field check score
fieldcheck.scores =
(expertise.fieldcheck$accuracy+expertise.fieldcheck$completeness+expertise.
fieldcheck$topo_consistency)/3
# Ranks without averaging
# negate variable to get descending order
# Individual trust parameters rank
agg.edit.rank = rank (-agg.edit, ties.method="min")
agg.mappingdays.rank = rank (-agg.mappingdays, ties.method="min")
agg.longevity.rank = rank (-agg.longevity, ties.method="min")
agg.localknowledge.rank = rank (-agg.localknowledge, ties.method="min")
agg.softwareskill.rank = rank (-agg.softwareskill, ties.method="min")
agg.hotcontrib.rank = rank (-agg.hotcontrib, ties.method="min")

67
# Field check rank
fieldcheck.rank = rank(-fieldcheck.scores, ties.method="min")
# Kendall's Tau correlation: individual parameters against fieldcheck score
cor.test(agg.edit.rank, fieldcheck.rank, method="kendall")
cor.test(agg.mappingdays.rank, fieldcheck.rank, method="kendall")
cor.test(agg.longevity.rank, fieldcheck.rank, method="kendall")
#cor.test(agg.distance.rank, fieldcheck.rank, method="kendall")
cor.test(agg.localknowledge.rank, fieldcheck.rank, method="kendall")
cor.test(agg.softwareskill.rank, fieldcheck.rank, method="kendall")
cor.test(agg.hotcontrib.rank, fieldcheck.rank, method="kendall")
#---WEIGHTED SUM---#
#Normalized Expertise Variables
norm.agg.edits = (agg.edit-min(agg.edit))/(max(agg.edit)-min(agg.edit))
norm.agg.mappingdays = (agg.mappingdays-
min(agg.mappingdays))/(max(agg.mappingdays)-min(agg.mappingdays))
norm.agg.longevity = (agg.longevity-
min(agg.longevity))/(max(agg.longevity)-min(agg.longevity))
norm.agg.localknowledge = (agg.localknowledge-
min(agg.localknowledge))/(max(agg.localknowledge)-min(agg.localknowledge))
norm.agg.softwareskill = (agg.softwareskill-
min(agg.softwareskill))/(max(agg.softwareskill)-min(agg.softwareskill))
norm.agg.hotcontrib = (agg.hotcontrib-
min(agg.hotcontrib))/(max(agg.hotcontrib)-min(agg.hotcontrib))
#Combined Expertise Score: Aggregated Expertise
agg.expertise.scores =
norm.agg.edits+norm.agg.mappingdays+norm.agg.longevity+norm.agg.localknowle
dge+norm.agg.softwareskill+norm.agg.hotcontrib
#Combined avg agg trustworthiness score rank
agg.expertise.rank = rank(-agg.expertise.scores, ties.method="min")
#Kendall's Tau correlation
cor.test(agg.expertise.rank, fieldcheck.rank, method="kendall")
Linear Regression (linear_regression.R)
#remove (almost) everything in the working environment
rm(list = ls())
#change working directory
setwd("D:/1. STUDY/MSc Geoinformatics - UTwente/Course Materials/4. MSc
Thesis/10. statistics")
#import data
osm.cal = read.csv("osm_jakarta.csv") #398 OSM training dataset
#osm.cal = read.csv("osm_jakarta_273.csv") #273 OSM training dataset
head(osm.cal)
#Regression analysis
#-------------------
#(a) regressing quality (response) vs. versions (1 covariate)

68
moda <- lm(quality_score ~ versions, data=osm.cal)
#plot quality_score against versions
plot(osm.cal$versions, osm.cal$quality_score, xlim=c(0,25), ylim=c(0.6,1),
xlab="versions", ylab="quality score", main="Plot of quality against
versions")
#add the regression line
abline(moda, col=3)
#summary of linear regression between insitu and APM
summary(moda)
# residual diagnostic plots
X11()
par(mfrow=c(2,2))
plot(moda)
#(b) regressing quality (response) vs. total expertise score (1 covariate)
modb <- lm(quality_score ~ agg_total_expertise, data=osm.cal)
#plot quality_score against versions
plot(osm.cal$agg_total_expertise, osm.cal$quality_score, xlim=c(0,80),
ylim=c(0,1), xlab="aggregated expertise", ylab="quality score", main="Plot
of quality against aggregated expertise")
#add the regression line
abline(modb, col=3)
#summary of linear regression between insitu and APM
summary(modb)
# residual diagnostic plots
X11()
par(mfrow=c(2,2))
plot(modb)
#(c) regressing quality (response) vs. log norm of total expertise score (1
covariate)
modc <- lm(quality_score ~ ln_agg_total_expertise, data=osm.cal)
#plot quality_score against versions
plot(osm.cal$ln_agg_total_expertise, osm.cal$quality_score, xlim=c(0,5),
ylim=c(0.5,1), xlab="aggregated expertise (ln)", ylab="quality score",
main="Plot of quality against aggregated expertise")
#add the regression line
abline(modc, col=3)
#summary of linear regression between insitu and APM
summary(modc)
# residual diagnostic plots
X11()
par(mfrow=c(2,2))
plot(modc)

69
APPENDIX B
Table B.1. Count for Contributors’ Characteristics
assigned
user id
changesets map
changes
mapping
days
longevity distance main software
used
HOT
contributors
U01 2376 87785 249 2456 11057 JOSM 0
U02 16 8357 10 1706 34.79 Potlatch 0
U03 153 52971 66 2990 21164.64 iD, Potlatch 0
U04 25 9850 16 1300 7.67 Potlatch 0
U05 1 24 1 0 40.12 Potlatch 0
U06 2204 96527 727 2281 10826.66 Potlatch,
OsmAnd
1
U07 15693 696598 986 3113 9802.84 JOSM 0
U08 55 925 5 262 402.21 iD 0
U09 2234 481384 426 2882 15.15 Potlatch,
Merkaartor
0
U10 364 13911 146 2819 79.3 JOSM, OsmAnd 0
U11 604 116001 103 1873 10548.25 JOSM 0
U12 3080 894656 461 2150 1563.05 iD, JOSM 1
U13 34097 2936340 979 2687 4729.36 JOSM, iD,
Potlatch
0
U14 7095 346958 502 2528 11009.68 JOSM 0
U15 76 10434 12 1049 3794.88 Potlatch 0
U16 666 498700 241 2253 10661.39 JOSM 0
U17 826 389190 160 2078 33.69 JOSM, Potlatch 1
U18 137 3431 24 1994 70.54 iD, JOSM 1
U19 422 33647 38 316 34.06 JOSM 0
U20 19 240 7 488 0.15 Potlatch 0
U21 163 22730 72 619 9757.22 Potlatch, JOSM 0
U22 8187 1023820 287 1929 10634.51 JOSM 0
U23 28 235 5 86 10.14 iD 0
U24 114 5164 24 790 10964.66 iD 0
U25 2615 646432 357 1776 3.38 JOSM 1
U26 1704 252647 224 1754 20.23 JOSM 1
U27 15 1384 5 141 35.04 JOSM 1
U28 71 7817 6 1619 8.69 JOSM 0
U29 51 661 3 0 12.79 JOSM 0
U30 32 4997 4 1245 3.88 JOSM 1
U31 5 298 1 0 0.74 iD 0
U32 404 26657 31 337 70.08 iD 0
U33 1214 47526 291 1687 2603.94 JOSM 0
U34 739 24949 73 524 10874.64 JOSM 0
U35 37 3777 9 59 37.81 JOSM 0

70
U36 30 7835 8 49 1.11 JOSM 0
U37 46 4343 8 20 39.63 JOSM 0
U38 80171 3205766 682 1146 37983.24 JOSM 0
U39 227 13429 41 598 10.76 iD 0
U40 111166 2996641 549 906 23042.18 JOSM 1
U41 975 16344 81 806 14.66 iD 0
U42 77649 1936572 393 680 36398.92 JOSM 0
U43 1 24 1 0 0.48 iD 0
U44 8 87 1 0 8.16 iD 0
U45 108 6137 12 124 31.69 iD 0
U46 2470 3046 24 60 8.48 iD 0
U47 1005 1068 16 60 8.37 iD 0
U48 1805 1885 19 60 0.47 iD 0
U49 34768 356814 120 268 39325.47 JOSM 0
U50 1852 2204 18 47 909.79 iD 0
U51 9 27 7 171 1174.83 maps.me 0
U52 515 48510 42 265 119.38 JOSM 0

71
APPENDIX C
Call: lm(formula = quality_score ~ ln_agg_total_expertise, data = osm.cal) Residuals: Min 1Q Median 3Q Max -0.20141 -0.03869 -0.01161 0.04536 0.13061 Coefficients: Estimate Std. Error t value Pr(>|t|) (Intercept) 0.869384 0.006390 136.1 < 2e-16 *** ln_agg_total_expertise 0.025205 0.004066 6.2 2.1e-09 *** --- Signif. codes: 0 ‘***’ 0.001 ‘**’ 0.01 ‘*’ 0.05 ‘.’ 0.1 ‘ ’ 1 Residual standard error: 0.06335 on 271 degrees of freedom Multiple R-squared: 0.1242, Adjusted R-squared: 0.121 F-statistic: 38.44 on 1 and 271 DF, p-value: 2.101e-09