assessing the county’s readiness for a climate related event
TRANSCRIPT

Compiled in 2014 by education staff at the Chesapeake Bay National Estuarine Research Reserve in Virginia for use in the B-
WET Climate Education for a Changing Bay program
Assessing the County’s Readiness for a Climate Related Event
Materials:
2 printed maps of your county
1 printed map of the Chesapeake Bay
3 labeled folders with printed resources and corresponding worksheets
Markers
Computer
Procedure:
**This lesson was designed for two high schools located in coastal counties bordering the
Chesapeake Bay. Should you wish to recreate this lesson, similar resources such as those
found in the appendices, can be compiled for your county through local government offices.
Grade Level: 9th
-12th
Subject Area: Earth Science, Environmental Science
Virginia Standards of Learning: ES. 1, ES. 8, ES.10, ES. 11,
Objectives:
Students will:
Interpret local maps to identify key areas of their county
Compile resources to develop a plan for their county
Inform others of their research through a final presentation
Make informed decisions regarding climate change
Summary:
Students will participate in a role playing scenario in which they represent different
stakeholder groups, including emergency responders, land planners,
and watermen. Using a variety of provided resources, students are given a task to present on,
whether it be creating an evacuation route for their county and identifying shelters,
establishing new areas for development, or locations for the best catch of crabs in the year
2050.
Vocabulary: emergency responder, land planning, watermen, stakeholder, elevation,
development, water quality, storm surge

Compiled in 2014 by education staff at the Chesapeake Bay National Estuarine Research Reserve in Virginia for use in the B-
WET Climate Education for a Changing Bay program
Introduction
1. Explain to your students that they will be acting as a group of stakeholders concerned
about how climate change will impact their county; whether through land planning,
emergency response time, or as their way of life as watermen. Begin the lesson by having
a conversation with your students asking questions about what they already know about
each of the three named groups. For example:
a) What do you know about development in our county?
b) Where do we have the most development?
c) Where do we have the most agricultural land in our county?
d) How can we benefit from some of the rural areas in the county?
e) What are emergency responders?
f) How to they provide aid during an extreme weather event?
g) Do you know of any shelters in our county?
h) How could watermen be affected by water quality?
i) How do watermen impact the local economy?
Activity
1. Divide students into three groups, 1) Land Planners, 2) Emergency Responders and 3)
Watermen.
2. Give each group a folder with the corresponding questions and resources. (You will need
to compile these folders prior to giving the resources to your students.) The resources for
the Land Planning group can be found in Appendix 1, the Emergency Responders are in
Appendix 2, and the resources for the Watermen are in Appendix 3.
3. Give the Land Planning group a blank county map with markers and a laptop. Give the
Emergency Responder group a blank map of your county with markers. Give the
Watermen group a blank map of the Chesapeake Bay with markers. (You may wish to
print the maps as a poster size and laminate for reuse.)
4. Once all of the materials have been handed out, explain to your students that they are to
draw on their maps once they have answered the questions on their worksheet. Students
should be prepared to present their findings to the class as a conclusion. The Land
Planners are to think about potential areas for future development and areas of current
development that will be impacted by climate change. The Emergency Responders will

Compiled in 2014 by education staff at the Chesapeake Bay National Estuarine Research Reserve in Virginia for use in the B-
WET Climate Education for a Changing Bay program
identify shelters within the community and develop an evacuation plan. The Watermen
will decide where they will be most successful in the year 2050 catching blue crabs in the
Chesapeake Bay.
5. Check in with each group as they work their way through the questions. Each group has
different questions to guide them through their provided resources.
Wrap Up
1. Have each group take a turn presenting their information to the class. Each group should
highlight what steps they had to consider prior to drawing on their map. Each group
should explain what they did on their map.
2. After the groups present review the positive items they mentioned. And add any
additional comments as needed.
3. Conclude the lesson by explaining to your students that there are many people concerned
about climate change, not just scientists but also the groups which they represented. As
they get older, climate change is a topic that will continue to be discussed and that they
may eventually be in the situation to make informed decisions as a land planner,
emergency responder, or watermen.
Background Information
The impact of climate change on coastal areas will be seen across a diverse suite of
physical and chemical variables including changes in air, water and soil temperatures; water
chemistry; the quantity, timing and intensity of precipitation; the intensity of storm events; and
changes in sea level. Understanding changes in sea level and inundation, and the associated
responses of critical habitats and coastal communities are key to the Chesapeake Bay region.
Relative sea level rise rates and associated impacts within the southern Chesapeake Bay region
represent some of the highest rates and threats reported along the U.S. Atlantic coast.
There will be many different impacts to the Chesapeake Bay region as a result of climate
change. Concern for these impacts is justified given that current and projected rates of sea level

Compiled in 2014 by education staff at the Chesapeake Bay National Estuarine Research Reserve in Virginia for use in the B-
WET Climate Education for a Changing Bay program
rise reflect a greater increase over what we experienced during the last century. Low lying
coastal communities have to act now to plan for these future impacts. Climate change is not
something only scientists are concerned about, community members, such as land planners,
emergency responders, and watermen, are all involved in the discussion together, planning for
their future.
Land planners have to establish ways to maximize the ecological services provided by the
natural habitats. They need to consider how the community benefits from the natural
environment now, and how climate change will impact these areas. One of the ways land
planners can think about their community and future impacts is by considering the land elevation
with respect to sea level. Surveying the land or looking at a topographic map can tell a lot about
how an area may be impacted by rising sea levels or increased flooding due to storm events.
Future developments may need to build be in higher elevations, or current infrastructure may
need some modifications in order to prepare for climate related events.
Emergency responders within a community play a vital role when considering how a
community can plan for climate change impacts. One of the impacts of climate change will be
increased storm events and increased intensity of storm events. In a storm event like a hurricane,
emergency responders must be able to safely notify community members of the storm, while also
working to establish an evacuation route, should that be necessary, and appropriate shelter areas.
In order to prepare the community for such events, emergency responders must be sure that
everyone knows of the evacuation plan and shelters far in advance. Safe shelters can be
established in buildings that can be accessed during a storm event and are in a centralized
location, such as local schools. Emergency responders know that proper communication with the

Compiled in 2014 by education staff at the Chesapeake Bay National Estuarine Research Reserve in Virginia for use in the B-
WET Climate Education for a Changing Bay program
public is vital in order to prepare and inform the community of climate change and its associated
impacts.
Many watermen are concerned with the impacts from climate change as they are already
seeing sways in their catch due to water quality issues. Increased temperature, salinity, and
runoff are projected with climate change and will affect water quality. Marine organisms rely
heavily on specific water conditions for their habitat and for different development stages within
their life cycle. The health and distribution of many marine organisms could be affected as the
water quality parameters change. As water conditions change, watermen are faced with moving
their fishing grounds, switching to a different catch, or finding a new career. This can prove to be
very costly for watermen as switching to a different catch would require the purchase of new
equipment and licenses, switching to a different fishing ground would use up fuel and work time,
and finding a new career can be extremely difficult. Watermen depend on the water as a way of
life, and in turn support the local economy through their career.
Community members can all work together to be sure that their county is prepared with
the knowledge necessary to understand the impacts of climate change. It is very important to
recognize that our everyday actions can have a big impact on the community and the Chesapeake
Bay. People can work together to reduce their impact on climate change by making small daily
changes in their lives, such as carpooling to school or work together, walking rather than driving,
choosing to recycle, being water conscience, and environmentally friendly.

Compiled in 2014 by education staff at the Chesapeake Bay National Estuarine Research Reserve in Virginia for use in the B-
WET Climate Education for a Changing Bay program
Appendix 1 – Land Planning Questions and Resources
You and your group members are acting as a group of land planners which will be having a discussion about how climate change could impact your future plans for development in your community. You all live near the coast and have some prior knowledge about where development occurs and where there are areas for concern. Discuss with your group members what you already know about land planning. Please write your discussion points in the space below:
You will be focusing on the long-term ecosystem impacts of climate change. In order to predict the long- term landward movement of marshes, you will need to take into consideration sea level rise, land subsidence, and growth of marshes. Please use the provided materials to help you answer the following questions. Look through all of the materials first; some of the materials are general information about your county and local maps. Your discussion will then be reported to the class as a conclusion of the program in a discussion panel. Please ask the instructors should you have any questions. Questions:
1. What are some factors that you think land planners need to take into account when thinking about their community and climate change?
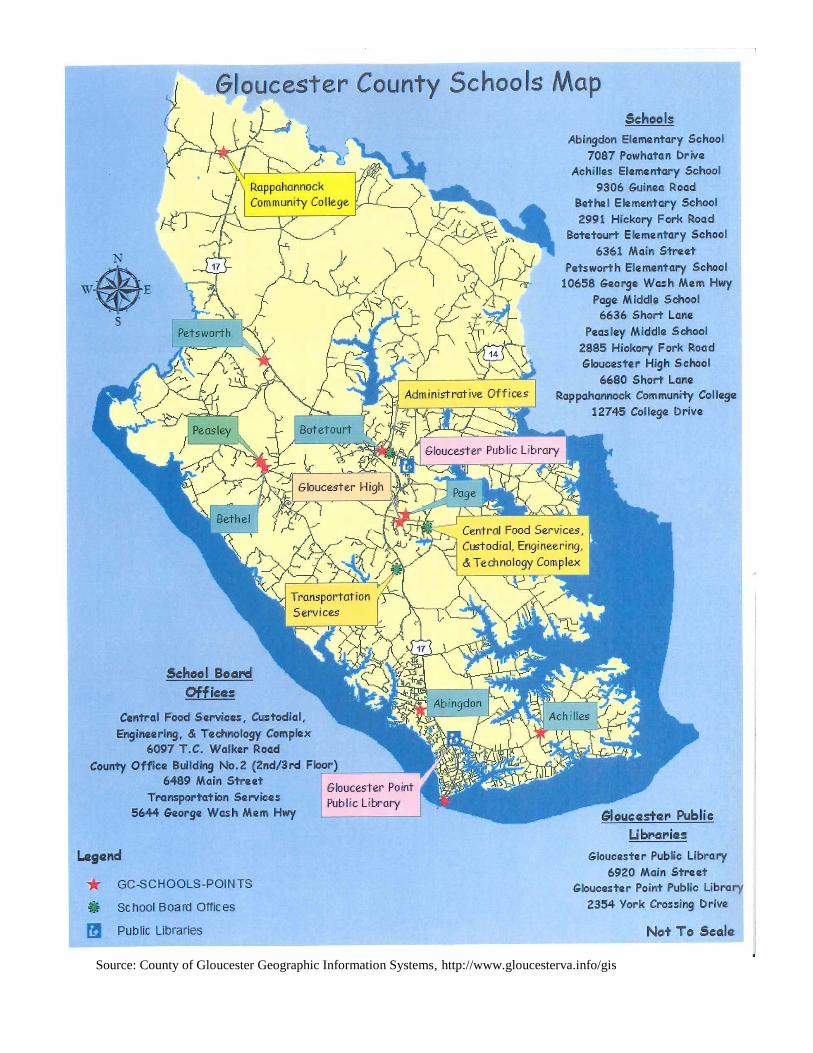
2. Where in your county do you find tidal wetlands? What is an example of a tidal wetland?
3. Knowing that the marsh can build up and will move landward as sea level rises;
draw on your map where the marsh could potentially reach using the provided materials? Do you have any developments too close to the marsh edge, how could this impact the marsh?

Compiled in 2014 by education staff at the Chesapeake Bay National Estuarine Research Reserve in Virginia for use in the B-
WET Climate Education for a Changing Bay program
4. As a land planner how could you maximize the natural services provided by these habitats?
5. Visit NOAA Sea Level Rise and Coastal viewer at http://csc.noaa.gov/slr/viewer/. Zoom in on the map to your county. Under Sea level slide the bar up to 2ft. SLR. And read the map overview on the left. What areas in your county are most likely to see impacts due to the sea level rise?
6. Now slide the Sea level bar to 3ft. SLR, was there much change in the land that would be affected? (Remember back to the school visit when we discussed different models for future SLR, some have an accelerated rate.
7. Using the provided materials, and the blank map draw out where you would like to see development in your county in the future. Label where each of the following will be built by the year 2050. (It may be helpful to draw where the water will be by 2050 when planning) Keep in mind that existing infrastructure could still be used!
a. Neighborhoods b. New schools c. Fire stations and police stations d. Shopping centers e. Farm land f. Parks g. Access to water front
8. How did you choose the areas that you decided to develop?

Source: NOAA Coastal Services Center, http://www.csc.noaa.gov/digitalcoast/tools/snapshots

Source: NOAA Coastal Services Center, http://www.csc.noaa.gov/digitalcoast/tools/snapshots

Source: A Coastal Floodplain Management Plan For Gloucester County, Middle Peninsula Planning District
Commission, http://www.mppdc.com/

Source: County of Gloucester Planning and Zoning, http://www.gloucesterva.info/Planning/tabid/571/Default.aspx

Source: County of Gloucester Geographic Information Systems, http://www.gloucesterva.info/gis

Appendix 2 – Emergency Responder Questions and Resources
You and your group members are acting as a group of emergency responders which will be having a discussion about how your local community will be impacted by a storm event. You all live near the coast and have some prior knowledge about storm events in our area. Discuss with your group members what you already know how your coastal community is impacted and responds to storm events, for example road closures due to flooding. Please write your discussion points in the space below:
One of the impacts of climate change will be increased storm events and increased intensity of storm events. Please use the provided materials to help you answer the following questions. Look through all of the materials first; some of the materials are general information about storm events and local land maps. Your discussion will then be reported to the class as a conclusion of the program in a discussion panel. Please ask the instructors should you have any questions. Few points to consider: 1. Increased sea level due to storm surge is not only caused by hurricanes, it can occur from winter storms and strong winds!
2. Sometimes ferries, bridges, and roadways can be shut down due to storm events.
Questions:
1. What is a storm surge, and what causes it?
2. Look at the VIMS tidewatch chart and instructions. What was the storm surge from Hurricane Irene?

3. Now look at the storm surge inundation map for your county. Hurricanes need not make landfall or move directly across Virginia to cause great damage. Hurricanes are classified into five categories based on wind speed and potential to cause damage.
a. Category One- Winds 74-95mph b. Category Two – Winds 96 – 110mph c. Category Three – Winds 111 – 129mph d. Category Five – Winds greater than 157mph
What areas in your county are likely to have storm surge inundation from a Category 1 hurricane and a category 2 hurricane?
4. What is the elevation in those areas which will be effect from storm surge during a category 1 or 2 hurricane?
5. Projected storm surges are one of the main reasons that evacuations are ordered. Your job is to now use the provided map and draw out an evacuation plan for the residents in your county. You will need to look at the inundation maps and your topographic map to consider elevation when drawing out your route.
a. Map a route which will get your town residents on a main route out of the county.
b. Identify roads that will be closed. c. Identify community shelter areas. d. Identify possible building or infrastructures that could face issues. e. Identify and schools or emergency response buildings in these areas.
6. Can you identify any pros or cons for a community issuing an evacuation?
7. Looking forward, how could you as an emergency responder prepare your community for future impacts of climate change? How would you notify your community members of future impacts?
8. Would you suggest having emergency services available in other areas of your community, if so where?

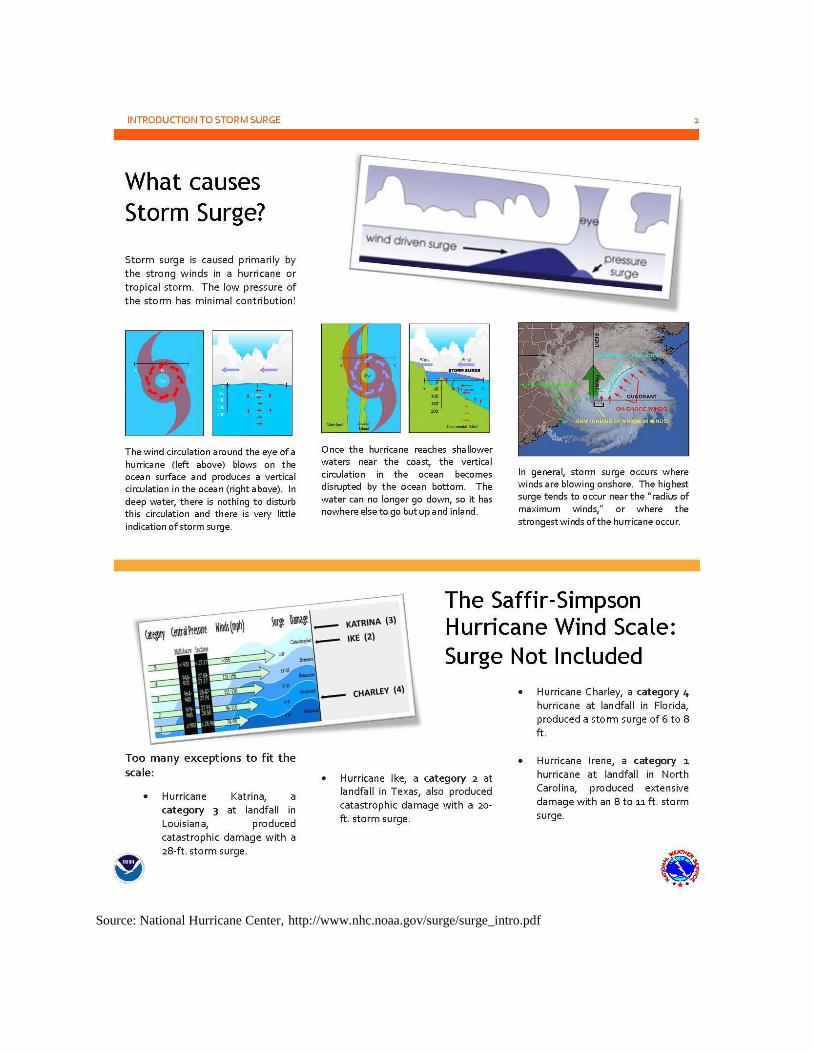
Source: National Hurricane Center, http://www.nhc.noaa.gov/surge/surge_intro.pdf

How to read a Tidewatch Chart
Legend & Definitions
Red line = observed water level (unverified data from the U.S. National Oceanic and Atmospheric
Administration)
Blue line = predicted astronomic tide
Green line = Residual difference between predicted and observed water level. Values are positive
when observed values exceed predicted values, and negative when observed values fall below
predicted values.
m30 is the 30-day mean water level covering the period of observation shown. It represents a time-
local departure from MSL that is due to a combination of the seasonal tide, the decadal change in sea
level, and the long-term sea-level trend relative to the land. The vertical reference for the astronomic
tide is m30. For this chart, the m30 value is 1.76 feet above mean lower low water (MLLW), and 1.06
feet above mean sea level (MSL).

HAT is the elevation of Highest Astronomical Tide for the station shown. No predicted tide
referenced to MSL or MLLW should ever be higher than HAT.
LAT is the elevation of Lowest Astronomical Tide for the station shown. No predicted tide
referenced to MSL or MLLW should ever be lower than LAT.
MHHW, MSL, MLLW are the tidal datums of Mean Higher High Water, Mean Sea Level, and
Mean Lower Low Water as defined by NOAA's National Ocean Service for the 1983-2001 National
Tidal Datum Epoch (seehttp://tidesandcurrents.noaa.gov/).
Extratidal High Water (XHW) and Extratidal Low Water (XLW) are observed water-level
extremes measured above the tidal datum HAT (XHW) or below the tidal datum LAT (XLW). These
extremes occur only in the presence of a weather-induced residual water level or ‘storm surge’
(observed water level minus the astronomic tide), a sea-level anomaly (m30-MSL vertical difference)
or, more often, a combination of the two. The astronomic tide—the water level change occurring at
tidal frequencies—will not exceed either datum in the absence of a sea-level anomaly.
Hurricane Irene Tidewatch Chart
Source: Virginia Institute of Marine Science, http://www.vims.edu/bayinfo/tidewatch/index.php

Source: Virginia Department of Emergency Management, http://www.vaemergency.gov/readyvirginia/stay-informed/hurricane/storm-surge

Source: A Coastal Floodplain Management Plan For Gloucester County, Middle Peninsula Planning District
Commission, http://www.mppdc.com/
Source: County of Gloucester Geographic Information Systems, http://www.gloucesterva.info/gis

Source: County of Gloucester Geographic Information Systems, http://www.gloucesterva.info/gis

Source: County of Gloucester Geographic Information Systems, http://www.gloucesterva.info/gis

Source: County of Gloucester Geographic Information Systems, http://www.gloucesterva.info/gis
