assessing the burden of disease from sharps injuries to ... · pdf fileenvironmental burden of...
TRANSCRIPT

Environmental Burden of Disease Series, No. 11
Sharps injuries
Assessing the burden of disease from sharps injuries to health-care workers at national and local levels Elisabetta Rapiti Annette Prüss-Üstün Yvan Hutin Series Editors Annette Prüss-Üstün, Diarmid Campbell-Lendrum, Carlos Corvalán, Alistair Woodward
World Health Organization Protection of the Human Environment Geneva 2005
A Microsoft Excel spreadsheet for calculating the estimates described in this document can be obtained from WHO/PHE. E-mail contact: [email protected]

ii
WHO Library Cataloguing-in-Publication Data Rapiti, Elisabetta.
Sharps injuries : assessing the burden of disease from sharps injuries to health-care workers at national and local levels / Elisabetta Rapiti, Annette Prüss-Üstün, Yvan Hutin. (Environmental burden of disease series / series editors: Annette Prüss-Üstün ... [et al.] ; no. 11)
1.Needlestick injuries - complications 2.Wounds, Stab - complications 3.Blood-borne pathogens 4.Hepatitis B - etiology 5.Hepatitis C - etiology 6.HIV infections - etiology 7.Accidents, Occupational 8.Health personnel 9.Risk assessment - methods 10.Cost of illness I.Prüss-Üstün, Annette. II.Hutin, Yvan J. F. III.Title IV.Series
ISBN 92 4 159232 X (NLM classification: WO 700) ISSN 1728-1652
Suggested citation
Rapiti, E, Prüss-Üstün, A, Hutin, Y. Sharps injuries : assessing the burden of disease from sharps injuries to health-care workers at national and local levels. Geneva, World Health Organization, 2005. (WHO Environmental Burden of Disease Series, No. 11).
© World Health Organization 2005
All rights reserved. Publications of the World Health Organization can be obtained from Marketing and Dissemination, World Health Organization, 20 Avenue Appia, 1211 Geneva 27, Switzerland (tel: +41 22 791 2476; fax: +41 22 791 4857; email: [email protected]). Requests for permission to reproduce or translate WHO publications – whether for sale or for noncommercial distribution – should be addressed to Marketing and Dissemination, at the above address (fax: +41 22 791 4806; email: [email protected]).
The designations employed and the presentation of the material in this publication do not imply the expression of any opinion whatsoever on the part of the World Health Organization concerning the legal status of any country, territory, city or area or of its authorities, or concerning the delimitation of its frontiers or boundaries. Dotted lines on maps represent approximate border lines for which there may not yet be full agreement.
The mention of specific companies or of certain manufacturers’ products does not imply that they are endorsed or recommended by the World Health Organization in preference to others of a similar nature that are not mentioned. Errors and omissions excepted, the names of proprietary products are distinguished by initial capital letters. The World Health Organization does not warrant that the information contained in this publication is complete and correct and shall not be liable for any damages incurred as a result of its use. The named authors alone are responsible for the views expressed in this publication. Printed by the WHO Document Production Services, Geneva, Switzerland.

Sharps injuries
iii
Table of contents
Preface ................................................................................................................................. v
Affiliations and acknowledgements ............................................................................................. vi
Summary .............................................................................................................................. viii
1. Introduction ............................................................................................................................ 1
2. Methodology .......................................................................................................................... 3
2.1 Summary................................................................................................................... 3 2.2 Parameters and methods ........................................................................................... 3 2.3 Main assumptions of the method .............................................................................. 7
3. Data requirements .................................................................................................................. 8
3.1 Size of the exposed population (N(HCW)) ................................................................... 8 3.2 Proportion of health-care workers and the general population
immunized against HBV (pi) .................................................................................... 8 3.3 Rate of transmission of infections (pt) ...................................................................... 8 3.4 Prevalence of infection in patients (pv) and incidence of infection in the
general population (Ib(GP) )......................................................................................... 9 3.5 Average number of sharps injuries per health-care worker per year (n)................. 12
4. Uncertainty analysis ............................................................................................................. 14
5. An example of how to calculate the burden of disease from sharps injuries ....................... 16
5.1 Calculating the proportion of the general population susceptible to infection (ps(GP))....................................................................................................... 17
5.2 Baseline incidence of infection in the susceptible proportion of the general population, Ibs(GP) ........................................................................................ 19
5.3 Calculating the proportion of health-care workers susceptible to infection, ps(HCW)...................................................................................................... 19
5.4 Baseline incidence of infection among health-care workers, Ib(HCW) ...................... 20 5.5 Baseline number of infections among health-care workers, Nb .............................. 21 5.6 Incidence of infection from sharps injuries in health-care workers,
In(HCW) ...................................................................................................................... 21 5.7 Number of infections in health-care workers from sharps injuries, Nn................... 22 5.8 Fraction of infections attributable to sharps injuries in health-care
workers.................................................................................................................... 22
6. Additional information on sharps injuries............................................................................ 24
7. Next steps ............................................................................................................................. 27
References ............................................................................................................................... 29
Annex 1 Estimates of the global disease burden from sharps injuries to health-care workers for the year 2000 .............................................................................. 37
Annex 2 Aide-mémoire for health-care worker safety ........................................................ 49

Sharps injuries
iv
List of tables
Table 1 Prevalence of HBV, HCV and HIV in hospital patients and in the general population, selected studies ............................................................................... 10
Table 2 Estimates of the annual frequency of sharps injuries in USA health-care workers .............................................................................................................. 12
Table 3 Studies investigating the frequency of sharps injuries....................................... 13 Table 4 Example of data for calculating the disease burden attributable to sharps
injuries in the age group 20−29 years. ............................................................... 16 Table 5 Estimating the proportion of the general population susceptible to HBV
using catalytic modelling ................................................................................... 18 Table 6 Frequency of procedure the health-care workers were using at the moment
of percutaneous injury, selected countries ......................................................... 25 Table 7 Estimates of the annual number of percutaneous injuries per health-care
worker, by job category, selected countries....................................................... 26
Table A1 Subregional estimates of HBV, HCV and HIV prevalence, year 2000 ............. 38 Table A2 Subregional estimates of HBV, HCV and HIV incidence in the
susceptible general population for the year 2000 .............................................. 39 Table A3 Estimates of the number of health-care workers in the 14 WHO
subregions and the proportion that is male ........................................................ 40 Table A4 Annual incidence of sharps injuries in the 14 WHO subregions, and data
sources ............................................................................................................... 41 Table A5 WHO subregional estimates of hepatitis B vaccine coverage among
health-care workers............................................................................................ 42 Table A6 Infections attributable to sharps injuries among health-care workers in the
14 WHO subregions .......................................................................................... 43 Table A7 Fraction of HBV, HCV and HIV infections attributable to sharps injuries
in health-care workers........................................................................................ 44 Figure
Figure 1 Fraction of HBV, HCV and HIV infections in health-care workers, 20−65 years old, attributable to sharps injuries ........................................................ 45

Sharps injuries
v
Preface
The disease burden of a population, and how that burden is distributed across different subpopulations (e.g. infants, women), are important pieces of information for strategies to improve population health. For policy-makers, disease burden estimates provide an indication of the health gains that could be achieved by targeted action against specific risk factors. The measures also allow policy-makers to prioritize actions and direct them to the population groups at highest risk. To provide a reliable source of information for policy-makers, WHO recently analysed 26 risk factors worldwide in the World Health Report (WHO, 2002). The Environmental Burden of Disease (EBD) series of guides continues this effort to generate reliable information, by presenting methods for assessing the burden of disease caused by environmental risk factors. The introductory volume in the EBD series outlines the general method (Prüss-Üstün et al., 2003), while subsequent guides address specific environmental risk factors. The guides on specific risk factors are organized similarly, first outlining the evidence linking the risk factor to health, and then describing a method for estimating the health impact of that risk factor on the population. All the guides take a practical, step-by-step approach and use numerical examples. The methods described in the guides can be adapted both to local and national levels, and can be tailored to suit data availability. The present guide provides information on how to assess the burden of disease at national and local levels that is caused by sharps injuries to health-care workers. The guide complements an earlier one in the EBD series, on the global burden of sharps injuries in health-care workers (Prüss-Üstün, Rapiti & Hutin, 2003).

Sharps injuries
vi
Affiliations and acknowledgements
Elisabetta Rapiti, Annette Prüss-Üstün, Yvan Hutin, Carlos Corvalán and Diarmid Campbell-Lendrum are at the World Health Organization, and Alistair Woodward is at the School of Population Health, University of Auckland, New Zealand. We would like to thank the reviewers of the global assessment method on which this guide is based, in particular Janine Jaegger, Julian Gold, Jukka Takala, Winnie Boal, Daniel Lavanchy, Neff Walker, Bernhard Schwartlander and the anonymous reviewers who contributed to the development of this study through their valuable comments. In addition, Kyle Steenland edited the document and provided helpful support. We would also like to thank the US Environmental Protection Agency for supporting the development of the Environmental Burden of Disease approaches. Finally, we are grateful to Kevin Farrell and Eileen Brown who put this document into its final format.
Sharps injuries
vii
Abbreviations
AF Attributable fraction.
EBD Environmental burden of disease.
HBV Hepatitis B virus.
HCV Hepatitis C virus.
HIV Human immunodeficiency virus.
Ib(GP) Baseline incidence of infection in the general population.
Ib(HCW) Baseline incidence of infection in all health-care workers.
Ibs(GP) Baseline incidence of infection in susceptible individuals in the general population.
Ibs(HCW) Baseline incidence of infection in susceptible health-care workers ( = Ibs(GP)).
In(HCW) Incidence of infection from sharps injuries, for all health-care workers.
Its(HCW) Total incidence of infection among susceptible health-care workers.
n Average number of sharps injuries per health-care worker per year.
Nb Baseline number of infections among health-care workers.
N(HCW) Number of health-care workers at risk.
Nn Number of infections in health-care workers from sharps injuries.
PEP Post-exposure prophylaxis.
pi Proportion of health-care workers (or the general population) immunized against HBV.
ps Proportion susceptible to infection.
ps(GP) Proportion of the general population susceptible to infection.
ps(HCW) Proportion of health-care workers susceptible to infection.
pt Rate of transmission of the infection following a sharps injury.
pv Prevalence of the infection in patients (or in the general population).

Sharps injuries
viii
Summary
This guide outlines a method for estimating the burden of disease at national or local levels from sharps injuries to health-care workers. Sharps include syringe needles, scalpels, broken glass and other objects contaminated with blood from a source patient. Health outcomes from percutaneous injuries include infections with hepatitis B virus (HBV), hepatitis C virus (HCV) or human immunodeficiency virus (HIV). Exposure is assessed from the number of sharps injuries in health-care workers each year, and from the infection prevalence in source patients. The immunization rate against HBV, and the post-exposure prophylaxis (PEP) coverage are also needed to assess the disease burden. The assessment provides the incidence of HBV, HCV and HIV infections caused by sharps injuries to health-care workers, and the fractions of the infections attributable to sharps injuries. The number of infections that could be prevented by PEP can also be estimated. The data can be used to assess the distribution of disease burden by category of health-care worker, by ward or by activity, which would allow protection measures to be more-specifically targeted. The guide includes a numerical example, and a Microsoft Excel worksheet is available at the WHO web site to assist with the calculations ([email protected]). Estimates from the Global Burden of Disease study for sharps injuries to health-care workers are listed in Annex 1 for each of the 14 WHO subregions (Table A1).

Introduction
1
1. Introduction
The first reported case of needlestick-transmitted HIV infection (Anonymous, 1984) led to increasing awareness and concern about the risks to health-care workers posed by sharps injuries. Today, it is clear that percutaneous injuries to health-care workers from needlesticks and other sharps carry significant risks of transmitting bloodborne pathogens such as HBV, HCV and HIV. It is estimated that sharps injuries cause about 66 000 HBV, 16 000 HCV and 200−5000 HIV infections among health-care workers each year (Prüss-Üstün, Rapiti & Hutin, 2003). For health-care workers worldwide, the attributable fractions for percutaneous occupational exposure to HBV, HCV and HIV are 37%, 39% and 4.4%, respectively. These bloodborne infections have serious consequences, including long-term illness, disability and death. In addition to HBV, HCV and HIV, other pathogens can be transmitted to health-care workers by sharps injury, including those that cause tuberculosis, diphtheria, herpes, malaria, Ebola plague, and Epstein-Barr infection (Collins & Kennedy, 1987; Sepkowitz, 1996). In this guide, only the transmission of HBV, HCV and HIV is studied, because these three viruses are likely to be responsible for a much larger fraction of the disease burden than other infections. This does not preclude the possibility that other infections may gain importance in the future. Also, only sharps injuries in health-care workers are examined, but other professional groups may be at risk. Examples include support personnel in health-care settings, such as laundry workers, or workers exposed to medical wastes. The attributable fractions for infections from sharps exposures thus apply only to health-care workers, rather than to the general population. The reason we chose to examine only health-care workers is that the data will be more relevant, since policy actions and interventions will mainly be directed to this professional group. A number of policy strategies are available for avoiding the disease burden associated with percutaneous injuries, including vaccination against HBV; PEP for HBV and HIV; reducing the number of injections and invasive procedures where appropriate; using safer devices; and properly disposing of needles and other sharps. Prevention and control policies for sharps injuries have been developed in many industrialized countries, in part because surveillance systems and ad hoc surveys provide the governments with information on exposures and outcomes in the health-care setting. The policies call for improving safety regulations, engineering strategies and exposure control plans. Nevertheless, there still remain many opportunities to reduce the disease burden, as in many settings the full impact of percutaneous injuries is not yet recognized. To take advantage of these opportunities countries need to identify the hazards; estimate the exposed population of health-care workers; assess injury rates from sharps; evaluate the risks in hospital and community settings; validate self-reported data; and evaluate comprehensive interventions to minimize the risk. This guide provides information for public-health and occupational-health professionals who wish to determine the burden of disease from sharps injuries at national, regional, or local levels. The first section describes the general method for conducting the assessment. An overview of the procedure is then followed by a more detailed discussion of each step. Other sections describe the minimum data

Introduction
2
requirements for the calculations, and how to estimate uncertainties. Finally, the general method is illustrated with a specific case-study. The methodology used in the guide allows results to be compared between diseases and risk factors, and between cultures and geographical regions. Global Burden of Disease estimates for sharps injuries in health-care workers are given in Annex 1 for all 14 WHO subregions (Table A1).

Methodology
3
2. Methodology
2.1 Summary
The following parameters are needed to estimate the burden of disease from sharps injuries: − the number of health-care workers and other workers at risk of a sharps injury
(N(HCW)) and the proportion susceptible to acquiring the infection (ps); − the average number of sharps injuries per health-care worker per year (n); − the prevalence (pv) of the infection in patients and in the general population; − the rate of transmission of the infection following a sharps injury (pt). The incidence of infection from sharps injuries to health-care workers (In(HCW)) can then be calculated by inserting the parameters into Equation 1: In(HCW) = 1 – (1 – ps pt pv)n (Equation 1) The attributable fraction (AF) of disease for sharps injuries is calculated from Equation 2:
In(HCW) AF = (Equation 2)
In(HCW) + Ib(HCW) where:
Ib(HCW) = Baseline incidence of infection in health-care workers. The baseline incidence of infection is the incidence from causes other than percutaneous injuries at the workplace. 2.2 Parameters and methods
Definition of exposure
An exposure places health-care workers at risk for HBV, HCV or HIV infection, by bringing them into contact with potentially infectious blood, tissue, or body fluids. In this guide, we only consider exposures via percutaneous injury (e.g. a needlestick or cut with a sharp object). We do not consider exposures that involve mucous membrane or non-intact skin.

Methodology
4
Health-care workers at risk and the proportion susceptible to infection (N(HCW) and ps)
The number of health-care workers at risk (N(HCW)) are those whose activities expose them to patients, or to blood or other body fluids from patients, in a health-care laboratory or public-safety setting. Examples include janitorial staff, students, nurses, clinicians, etc. Ideally, exposure would be determined for each group of health-care worker, but for simplicity we determine exposure for all health-care workers as a single group. The exposed population is defined as the workers at risk with at least one injury in the previous year with a sharp object contaminated with HBV, HCV or HIV. Not all the workers are at risk of becoming infected after a sharps injury, however. Only those not previously infected are susceptible (ps). For HBV, the proportion of immunized health-care workers is also needed to obtain ps. Average number of sharps injuries per health-care worker per year (n)
Although a worker can be exposed from either a percutaneous injury (i.e. injury of the intact or non-intact skin) or a mucocutaneous injury (injury of the mucous membranes), only a method for quantifying the health consequences of percutaneous injuries is given in this guide. This is because percutaneous injuries pose the highest risk, and because the health impacts of mucocutaneous exposures are difficult to quantify (in part, because of uncertainty around the transmission potential, pt). If possible, it is better to estimate risks for each category of health-care worker. This would be possible, for example, if the frequencies of sharps injuries are reported for each category of workers. Prevalence (pv) and incidence of infection in patients and in the general population
The prevalence of active infection in patients (and therefore in the general population) strongly influences the risk of infections from sharps injuries. The higher the prevalence of infection in patients, the higher is the risk that a health-care worker will become infected after an injury. The prevalence of active infection is generally higher in hospital patients than in the general population, but prevalences for patients are not always available. Data sources and patient−population differences are further discussed in Section 4. The incidence of infection attributable to sharps injuries in health-care workers, In(HCW), is needed to estimate both the AF (Equation 2; and discussed below), and the susceptibility to infection for the age and gender groups.

Methodology
5
Rate of transmission of an infection following a sharps injury (pt)
Relatively few studies have investigated the probability of seroconversion once a percutaneous injury has occurred. HCV does not appear to be transmitted efficiently through occupational exposure to blood. The average incidence of anti-HCV seroconversion was only 1.8% (range: 0−7%) after accidental percutaneous exposure to an HCV-positive source (Mitsui et al., 1992; Lanphear et al., 1994; Puro et al., 1995; Alter, 1997). One study indicated that transmission occurred only from hollow-bore needles, rather than from other sharps (Puro et al., 1995). The rate of seroconversion after percutaneous exposure to HBV varies, depending on whether the source patient is positive or negative for HBV e antigen (HBeAg). Estimates of infectivity range from 6% (for HbeAg negative source patients) to 30% (HbeAg positive source patients) with an average value of 18% (Seeff et al., 1978). According to an analysis of 21 prospective studies, the risk associated with occupational exposure to HIV through a percutaneous injury involving needles and other contaminated devices was 0.3% (0.18−0.46%) (Henderson et al., 1990; Ippolito et al., 1993; Tokars et al., 1993; Gerberding, 1994). Important determinants of transmission risk included the titre of virus in the contaminant, the type of needle used, the depth of needle penetration, the volume of blood involved, and the host defence system. In this guide, the average value of the transmission potential is used to estimate the disease burden. The high and low values of the transmission potentials provide the upper and lower estimates of the disease burden, respectively. Incidence of infection attributable to sharps injuries to health-care workers (In(HCW))
To estimate the incidence of HBV, HCV and HIV infections attributable to sharps injuries to health-care workers, we use a model that is based on an estimate of the probability of infection. The probability that at least one sharps injury will lead to infection during one year is (Snedecor & Cochran, 1989):
P(at least one infection) = 1 – (1 – p)n (Equation 3) where:
p = the probability that a sharps injury will result in infection. n = the average number of sharps injuries per health-care worker per
year. In our model, p represents the probability of all events that need to occur jointly for an injury with a contaminated sharp object to result in an infection:
p = pv pt ps (Equation 4) where:

Methodology
6
pv = the prevalence of active infection in the patient population (which determines the probability that the sharp causing the injury is contaminated with bloodborne pathogens).
pt = the probability that the infection will be transmitted to the health-care worker following percutaneous exposure with a sharp object used on an infected patient.
ps = the proportion of the population that is susceptible to infection (usually, 1 – prevalence).
This model assumes that the risk of infection increases proportionally to the number of infectious individuals in the population. Thus, the incidence of infection caused by sharps injuries to health-care workers can be calculated from Equation 1, repeated below:
In(HCW) = 1 – (1 – ps pt pv)n (Equation 1) Attributable fraction (AF)
The AF describes the proportion of disease that can be attributed to a given exposure, and indicates the proportional reduction in the number of cases that could be expected if the exposure were to be eliminated. In the present guide, the AF indicates the proportion of infections among health-care workers attributable to occupational sharps injuries, and is calculated from Equation 2, repeated below:
In(HCW) AF = (Equation 2)
In(HCW) + Ib(HCW) Post-exposure prophylaxis
PEP after a sharps injury reduces the incidence of infection for HBV and HIV, and if prophylaxis has been used, estimates of the incidence of infection after a sharps injury need to be reduced accordingly. A combination of hepatitis B immunoglobulin prophylaxis and hepatitis B vaccination is 85−95% effective in preventing HBV infection in the perinatal setting (Beasley et al., 1983; Stevens et al., 1985). Although the post-exposure efficacy of such a combination has not been evaluated in an occupational setting, it is presumed that it would be equally effective (CDC, 2001). PEP with antiretroviral agents after an occupational exposure to HIV is also recommended in industrialized countries (Rey et al., 2000; CDC, 2001). PEP with zidovudine reduced the risk of HIV infection by approximately 81% (95% CI = 48−94%) in a case−control study of health-care workers (Cardo et al., 1997). Following an exposure to a known or suspected HIV-seropositive source, PEP is usually offered after a careful risk assessment. Acceptance of PEP among health-care

Methodology
7
workers varies between 40−79% (Puro et al., 2000; Russi et al., 2000; Grime et al., 2001), and 12−33% of individuals interrupt PEP because of side-effects (Parkin et al., 2000; Puro et al., 2000; Wang et al., 2000). If PEP is used, average PEP efficacies of 90% and 81%, respectively, could be applied to the incidences of HBV and HIV infections due to sharps injuries that are used in this guide. 2.3 Main assumptions of the method
The accuracy of the results depends upon the validity of the assumptions used to estimate the disease burden. For example, if an average incidence rate of percutaneous injuries for all health-care workers is applied to subgroups of workers, this assumes that the average injury rate for each subgroup is the same as the average rate for all health-care workers, regardless of differences related to gender, age or occupational setting. Any deviation from this assumption is likely to reduce the accuracy of the results. Conversely, as the input data become more specific to a subgroup, the results will likely gain in accuracy. In this guide, average values are used for a number of parameters. Consequently, if a user of this guide inputs data for a small or specific study population, the results produced by the method in this guide are likely to be less accurate than those produced with more-specific values for the parameters. For example, to assess the disease burden in dentists, it would be more accurate to use values for the rate of injury and the vaccination coverage that are specific to this professional group, rather than use average values derived for the entire population of health-care workers. We also use an average transmission rate of infection in this guide, but it has been shown that the transmission rate depends on the type of injury, the device used, the amount of blood involved, and the serological status of the patient. Some parameters, such as the transmission rate, may not only be subgroup-specific, but also depend on differences in local health-care practices. The burden of disease is only calculated for percutaneous injuries, but mucocutaneous contacts could contribute up to 15% of the overall number of infections in health-care workers (J. Jagger, personal communication, 2002). Therefore, the total transmission of bloodborne pathogens to health-care workers is likely to be underestimated. Additional assumptions will need to be made, depending on the data that are locally available or that are being assessed, and these assumptions may influence the accuracy of the results. The sample chosen to assess the prevalence of infection in the general population or patient population, for example, will entail assumptions (Section 4). The accuracy of estimates will also depend on the accuracy of the input data for the model. We therefore report uncertainty intervals around the estimates developed by the method. The results produced by the model can be compared between countries, settings or regions, and can be used to monitor progress in lifting the disease burden.

Data requirements
8
3. Data requirements
Data on the size of the exposed population, current disease levels, and risk-factor levels are all needed to calculate the attributable burden of disease from sharps injuries within a country. In general, it is advisable to use national or local statistics whenever possible, but the availability and quality of the data can differ from country to country. We therefore discuss alternative sources of data. 3.1 Size of the exposed population (N(HCW))
The exposed population is the number of health-care workers at risk of sharps injuries in occupational settings such as hospitals. It can include all the health-care workers of a country, or only those in a region of the country, depending on the aim of the exposure assessment. As high-quality data as possible should be used to estimate the exposed population, for example census data, ministry of health statistics, hospitals personnel lists and office of labour statistics. Most countries report data to WHO on selected groups of health-care workers (nurses, midwives and doctors), and the statistics are available through WHOSIS, the WHO Statistical Information System (http://www-nt.who.int/whosis/statistics/menu.cfm). Male and female health-care workers should be assessed separately, since the burden of disease is calculated for each gender in this guide. If you wish to assess how the burden of disease is distributed between categories of health-care worker, or between occupations, the exposed population and other parameters will need to be calculated for each category (occupation). 3.2 Proportion of health-care workers and the general population
immunized against HBV (pi)
The HBV immunization rate in health-care workers needs to be determined before you can estimate the proportion of health-care workers at risk for hepatitis B. Vaccination data could be collected from hospitals and other health-care settings, if a vaccine programme exists in the country or region of interest. If not, population-based surveys could be used to assess the immunization status of health-care workers. The HBV vaccination rate in the general population is also needed to estimate the fraction of HBV infections in health-care workers that is attributable to occupation, as opposed to activities outside the workplace. It is assumed that the risk of infection for health-care workers outside their workplace is the same as for the general population. 3.3 Rate of transmission of infections (pt)
For percutaneous injuries, the probability of transmission (pt) is assumed to be 0.018 (1.8%) for HCV (CDC, 1997a) and 0.003 (0.3%) for HIV (Cardo et al., 1997). These figures are based upon estimates obtained in the health-care setting. For HBV, pt is

Data requirements
9
assumed to be 0.3 (30%) for source patients who are HBeAg-positive (Seeff et al., 1978). The risk of infection with HIV following a mucocutaneous exposure was estimated to be 0.09% in a review of six studies (Ippolito et al., 1993). A mucocutaneous exposure involves contact of an infectious substance with mucous membranes, rather than a sharps injury. We do not estimate the disease burden from such exposures because the assessment of exposure frequency is generally even less well documented than that for percutaneous exposure. No estimates for mucocutaneous exposure are available for HBV or HCV, neither has the risk of transmission of HBV, HCV or HIV following skin exposure been estimated. Future studies may provide more precise estimates of the rate of transmission through exposures other than percutaneous, and then a more complete calculation of the burden of disease due to occupational accidents maybe possible. 3.4 Prevalence of infection in patients (pv) and incidence of infection
in the general population (Ib(GP) )
The prevalence of an infection in patients (pv) is needed to determine the probability that a sharp will be contaminated. The incidence of infection in the general population is used as the baseline incidence of infection in the general population, Ib(GP) (i.e. the incidence of infection due to risks other than occupational sharps injuries). For most countries, rates of infection in the general population can be found in national statistics or in the literature. UNAIDS data can also be used (UNAIDS, 2000, 2001, 2002). If country-specific data are not available, WHO subregional averages can be used as indicative values (Annex 1, Tables A1 and A2). Infection prevalence in patients varies between health-care settings and can generally only be assessed by specifically-designed studies. It could be assumed that the prevalence of infection in patients is similar to that in the general population, but several studies have shown that HCV and HIV might be more prevalent among hospitalized patients than in the general population (e.g. Table 1). The prevalence of infection among patients should preferably be assessed directly, but the prevalence in the general population could be used if it is thought to be similar to the infection prevalence in patients. Prevalence figures may also be used to obtain an upper-bound estimate of the number of sharps-related infections in health-care workers.

Data requirements
10
Table 1 Prevalence of HBV, HCV and HIV in hospital patients and in the general population, selected studies
HCV (%)a HBV (%) HIV (%)
Country H GP Ratio H GP Ratio H GP RatioOrigin of
patient sample Size of patient
sample Source Algeria 0.19 0.2 1.0 1.6 5.0 0.3 − − − Obstetric clinic 715 Ayed et al. (1995)
Brazil 1.5 2.6 0.6 − − − − − − Obstetric clinic 6 995 Lima, Pedro & Rocha (2000)
Brazil 0.8 2.6 0.3 0.8 2.0 0.8 0.6 0.57 1.1 Obstetric clinic 1502/1006/1473 Reiche et al. (2000)
Chinab 12.7 3.0 4.2 16.7 12.0 1.4 0.8 0.07 11.4 All wards 1 805 Shiao, Guo & McLaws (2002)
Congo − − − 46 12.0 3.8 − − −Gastroenterology and internal medicine dept.
139 Ibara et al. (1991)
Denmark 1.5 0.2 7.5 0.85 0.3 2.8 − − − All wards 466 Nelsing et al. (1995) Egypt 19 18.1 1.0 − − − − − − Obstetric clinic 100 Kassem et al. (2000) Greecec 4.75 1.5 3.2 2.66 3.0 0.9 − − − High-risk patients 46 901 Koulentaki et al. (2001)
Italy 2.36 0.44 5.4 0.9 3.0 0.3 − − − Dermatology dept. 677 Bongiorno, Pistone & Arico (2002)
Italy 1.7 0.5 3.4 − − − − − − Obstetric clinic 1 700 Floreani et al. (1996) Mexico 0.53 0.7 0.8 0.3 1.0 0.3 − − − Perinatal care 1 500 Ortiz-Ibarra et al. (1996)
Mongolia 48 10.7 4.5 28.7 14.0 2.1 − − − All wards (outpatients) 150 Fujioka et al. (1998)
Poland 22.3 1.4 15.9 − − − − − − All wards 980 Polz et al. (1995)
Spain 1.4 0.7 2.0 − − − − − − Obstetric clinic 2 615 Munoz-Almagro et al. (2002)
South Africa − − − − − − 54 19.94 2.7 All wards 535 Colvin et al. (2001)
Sudan 3 3.2 0.9 26 10.0 2.6 − − − All wards (outpatients) 651 McCarthy et al. (1994)
Tanzania − − − − − − 32.8 8.09 4.1 All wards 1 422 Kwesigabo et al. (1999)
Ugandac − − − − − − 58 8.30 7.0 Suspected immuno-suppressed patients 8 000 Muller & Moser (1990)
UK 0.8 0.02 40.0 − − − − − − Antenatal clinic 4 729 Ward et al. (2000)

Data requirements
11
HCV (%)a HBV (%) HIV (%)
Country H GP Ratio H GP Ratio H GP RatioOrigin of
patient sample Size of patient
sample Source
UK − − − − − − 1.3 0.11 11.8 Accidents and emergency dept. 922 Poznansky et al. (1994)
UK 0.14 0.02 7.0 0.56 0.3 1.9 − − − Antenatal clinic 3 522 Boxall et al. (1994)
USA 11.7 1.8 6.5 − − − − − −Random, elective surgery, gastrointestinal dept.
530 Austin et al. (2000)
USA − − − − − − 6 0.61 9.8 Emergency dept. 2 544 Kelen et al. (1989)
USA − − − − − − 4.7 0.61 7.7 20 acute-care hospitals 195 829 Janssen et al. (1992)
Median − − 3.4 − − 1.9 − − 5.9a Abbreviations: H = prevalence of virus in hospital samples; GP = prevalence of virus in the general population; Ratio = prevalence in the hospital sample
divided by the prevalence in the general population. “−” = data not available. b The estimate is extrapolated from data for Taiwan. This population may not be representative of the Chinese population, and the ratio is not included in the
median calculation. c The patients in these studies are “high risk” and not representative of the patients of the ward, and the ratio is not included in the median calculation

Data requirements
12
3.5 Average number of sharps injuries per health-care worker per year (n)
The average number of occupational injuries to health-care workers from sharps each year is needed to calculate the AF of disease for sharps injuries. The average number of sharps injuries should be representative of the group of health-care workers under study. For example, the number could represent the average for all health-care worker categories, or for only subgroups of health-care workers in specific settings. The number of occupational injuries in health-care workers may not always be available, and it is important to state all assumptions if alternative data are used. The main sources of data are surveillance systems at hospital, local or national levels, but surveillance systems tend to underestimate the true rate of sharps injuries. In the USA for example, underreporting was estimated to be between 18% and 70% (Mangione, 1991; Henry & Campbell, 1995; Perry, 2000). The marked variation in assessed sharps injuries for the USA is illustrated in Table 2. Specifically-designed studies may provide more accurate results, but until such data are available surveillance figures may need to be adjusted for underreporting to get a more accurate estimate. Table 2 Estimates of the annual frequency of sharps injuries in USA health-care workers
Occupation na Type of assessment Source
Health-care worker 0.096 Surveillance data EPInet (1998)
Intern or resident 0.67 Cross-sectional survey with anonymous questionnaire in three hospitals
Mangione et al. (1991)
Physician 0.51 National survey, self-administered questionnaire
Hersey & Martin (1994)
Nurse 0.77 Prospective study Aiken, Sloane & Klocinski (1997)
a Average number of injuries per health-care worker per year. In addition to recording the job category of a worker, studies or surveillance systems often document the procedures being performed and the devices being handled when the sharps accidents occurred. This would allow category-specific risks to be calculated, and the procedures or devices carrying the greatest risks to be identified. If local studies on sharps injuries are not available, an ad hoc survey or study can be implemented. A number of studies investigating the occurrence of sharps injuries are listed in Table 3 as examples for study design.

Data requirements
13
Table 3 Studies investigating the frequency of sharps injuries
Source Country Type of study Instrument Personnel Mangione et al. (1991)
USA Survey Self-assessed questionnaire
House officers
Nelsing, Nielsen & Nielsen (1993)
Denmark Survey Self-assessed questionnaire
Medical personnel of infectious disease department
Mujeeb, Khatri & Khanani (1998)
Pakistan Survey Self-assessed questionnaire
Operation room
Pournaras et al. (1999)
Greece Retrospective analysis of reports
None Hospital health-care workers
Shanks & Al-Kalai (1995)
Saudi Arabia Retrospective analysis of reports
None Hospital health-care workers
Adegboye et al. (1994)
Nigeria Survey Self-assessed questionnaire
Hospital health-care workers
McCarthy, Koval & MacDonald (1999)
Canada Mailed survey Self-assessed questionnaire
Dentists
Khuri-Bulos et al. (1997)
Jordan Prospective analysis of reports
Self-assessed questionnaire
Hospital health-care workers

Uncertainty analysis
14
4. Uncertainty analysis
The main sources of uncertainty will depend on the specific data used for the analysis, but in general they include the following parameters:
− the annual incidence of sharps injuries − the estimated hepatitis B immunization coverage − the number of workers at risk of a contaminated sharps injury.
The estimated values of these parameters may not be accurate for the following reasons: • The parameter was assessed for a different population of workers, or where
practices were different, and it may not be representative of the group of health-care workers to be studied. For example, the annual number of sharps injuries in surgeons of one particular hospital is unlikely to be representative of the total health-care workforce.
• The average number of injuries may be overestimated or underestimated for methodological reasons. Self-reporting of sharps injuries, for example, may lead to systematic underreporting (see Section 3.5).
An attempt should be made to estimate lower and upper uncertainty intervals for the AFs and the disease burden. If a quantitative evaluation is not possible (e.g. there is no information about the accuracy of input parameters), the main sources of uncertainty should be evaluated qualitatively. Plausible lower and upper estimates for the annual incidence of sharps injuries, HBV immunization rates, and transmission probabilities can be used for the lower and upper uncertainty bounds, respectively. Lower and upper estimates for the population at risk could also be included, if necessary. This does not constitute a formal uncertainty analysis, but the approach can highlight the fact that there is uncertainty in certain parameters, which could allow alternative estimates of the attributable disease burden. If confidence intervals are reported by a study, these could be used as the lower and upper uncertainty intervals for the average number of sharps injuries. Otherwise, the uncertainty intervals can be defined by expert opinion. In the global estimate of the sharps burden, for example, the lower and upper bounds of the average number of sharps injuries was defined as the mean of the average deviation, which was equivalent to 65% of the average number of sharps injuries (Prüss-Üstün, Rapiti & Hutin, 2003). For the HCV transmission rate, lower and the upper values currently reported by the literature are 0% and 7%, respectively (CDC, 1997a); for HBV, the corresponding values are 6% and 30% (Alter et al., 1976; Seeff et al., 1978); and for HIV, 0.18% and 0.46% (Cardo et al., 1997; L. Chiarello, personal communication, 2000). These values may need to be updated as more data become available. For the HBV immunization rate, the lower and upper bounds will again depend on the accuracy of assessment. If confidence intervals are reported, these values can be

Uncertainty analysiss
15
used, otherwise they can be supplied by expert opinion. The uncertainty around HBV immunization rates typically depends on the source of information. For example, if a survey was carried out in a hospital, the results may not be representative for all health-care workers in a country, particularly for those working outside of hospitals. The proposed model is relatively sensitive to the prevalence of HBV, HCV and HIV in the general population. The uncertainty around this value will depend on the accuracy of the specific assessment performed (e.g. assessment at national level or from other sources). The incidence of HBV, HCV and HIV in the general population does not influence the number of infections in health-care workers due to sharps injuries, only the AF.

Worked example
16
5. An example of how to calculate the burden of disease from sharps injuries
This section describes how to calculate the burden of disease from sharps injuries at national level, using example numbers for the input parameters to the model. WHO provides Microsoft Excel calculation sheets that include the formulas needed to perform the calculations ([email protected]). The input parameters are given in Table 4 (see also Section 2.2). The disease burden from sharps injuries should be estimated by age group, as certain parameters vary with age (e.g. the susceptibility to infection, ps). We suggest using 20−29, 30−44, 45−59 and 60−69 years as the age groups for this risk factor. In this worked example, calculations are presented only for the age group 20−29 years, but they should be repeated for all age groups. Table 4 Example of data for calculating the disease burden attributable to sharps injuries in
the age group 20−29 years.
Input data Abbreviation Example value Size of the exposed population (in the age group
20−29 years) NHCW 22 358
Rate of HBV immunization among health-care workers pi(HCW) 39%
HCV 0.10%
HBV 0.50% Annual incidence of infection in the general
population Ib(GP) HIV 0.11%
HCV 2.39%
HBV 2.01% Prevalence of infection in the patient population pv
HIV 0.51%
Average number of sharps injuries per health-care worker per year n 2.53
HCV 1.80%
Rate of transmission of the infections (constant values)
pt HBV 18%
HIV 0.32%
The disease burden is usually estimated for a particular year (e.g. the past year or a recent year for which data are available), which should be chosen at the beginning of the assessment. It is important to remember that the disease burden for a particular year, say 2003, includes not just the disease burden for 2003, but also health outcomes that occur in later years and that are a consequence of an event in 2003. Events that occur in later years, say 2007, and are attributed to 2003, should not be included in the disease burden for 2007.

Worked example
17
5.1 Calculating the proportion of the general population susceptible to infection (ps(GP))
Not all individuals are at risk of becoming infected after a sharps injury. Only those not previously infected are at risk. We use a “catalytic” model to estimate the proportion of individuals susceptible to infection with HBV, HCV and HIV in the general population for a certain age or age group. The model accounts for the proportion of susceptible individuals in the preceding age group, as well as the baseline incidence of infection among those susceptible. The formula for estimating the susceptible proportion of the population for a certain age (i.e. a one-year age group) and for a given year is:
ps(year a) in the general population = ps(year a−1) (1 − Ibs(GP)) (Equation 3) a = one-year age group When age groups of several years are considered, rather than a single age, the formula becomes:
ps(years a) in the general population = ps(previous age group) (1 − Ibs(GP))A (Equation 4)
where:
a = the age group A = the total number of years in the age groups Ibs(GP) = the baseline incidence of the infection in the susceptible
proportion of the general population. As the susceptibility to infection is generally 100% at birth and decreases with age, calculations start at age “0” and continue to the age of interest. The susceptibility at a given age is thus the susceptibility of the previous age minus the new incidence during the last year. For the first age group (or age 0), the proportion of susceptible individuals in the age-group population is equal to 1 minus the incidence. The baseline incidence of infection for the general population is the incidence of infection from causes other than occupational sharps injuries. An outline of the calculation for the proportion of the general population susceptible to HBV in our example is given in Table 6. The susceptible population for each age is estimated by catalytic modelling, which means that each year additional people will become infected (as a proportion of the susceptible population), and thus the susceptible proportion of the population decreases with age.

Worked example
18
Table 5 Estimating the proportion of the general population susceptible to HBV using catalytic modellinga
Age (years) Proportion infectedb
Ten-year average of proportion infectedc
Proportion susceptible
(ps)d
0 0.005 0.995 1 0.010 0.990 2 0.015 0.985 3 0.020 0.980 4 0.025 0.975 5 0.030 0.970 6 0.034 0.966 7 0.039 0.961 8 0.044 0.956 9e 0.049 0.027 0.973
10 0.054 0.946 11 0.058 0.942 12 0.063 0.937 13 0.068 0.932 14 0.072 0.928 15 0.077 0.923 16 0.082 0.918 17 0.086 0.914 18 0.091 0.909 19e 0.095 0.075 0.925 20 0.100 0.900 21 0.104 0.896 22 0.109 0.891 23 0.113 0.887 24 0.118 0.882 25 0.122 0.878 26 0.127 0.873 27 0.131 0.869 28 0.135 0.865 29e 0.140 0.120 0.880f
a Baseline incidence in the susceptible proportion of the general population, Ibs(GP) = 0.005 per year.
b Proportion infected = ps (previous year) × (1 - Ibs(GP)) c Ten-year average of the proportion infected = (an + an+1 +..+an+9)/10. d The proportion susceptible = (1 – proportion infected); the 10-year average for the proportion
susceptible = (1 - 10-year average of the proportion infected). e Average values for the preceding 10-year age group. f This value is used in the example calculation in this guide, and is an average for the age group
20−29 years. The baseline incidence of susceptible individuals could also be back-calculated from the prevalence in the general population, or from the susceptible proportion, ps, and the baseline incidence, Ib(GP), at any age.

Worked example
19
For HCV, the catalytic modelling outlined in Table 5 yields the results in Box 1. For HIV, the susceptible proportion is generally kept constant for these burden of disease estimates.
5.2 Baseline incidence of infection in the susceptible proportion of
the general population, Ibs(GP)
The baseline incidence of infection in the susceptible proportion of general population is equal to the baseline incidence of the infection in the general population, Ib(GP), divided by the proportion of the general population susceptible to the infection, ps(GP) (Box 2).
Ibs(GP) = Ib(GP) / ps(GP) If national or local incidence or prevalence data are not available, WHO subregional averages could be used for preliminary estimates (see Tables A1 and A2 in Annex 1). 5.3 Calculating the proportion of health-care workers susceptible to
infection, ps(HCW)
The proportion of susceptible health-care workers is calculated as for the proportion of susceptible individuals in the general population (Section 5.1). When health-care workers first begin their occupational activity (generally around 20 years of age), the proportion susceptible to infection is the same as in the general population, but their risk of infection to HBV, HCV and HIV is higher than in the general population and therefore needs to be estimated separately:
Box 2 Baseline incidence of infection in the susceptible proportion of the general population, 20−29 years old
Ibs(GP)HBV = 0.005 / 0.88 = 0.0057 cases/person/year (or 57 cases/10 000 people/year) Ibs(GP)HCV = 0.001 / 0.97 = 0.0011 cases/person/year (or 11 cases/10 000 people/year) Ibs(GP)HIV = 0.0011 / 0.99 = 0.0009 cases/person/year (or 11 cases/10 000 people/year)
Box 1 Proportion of the general population susceptible to infection, 20−29 years old
ps(GP) HBV = 0.88 (88%) ps(GP) HCV = 0.97 (97%) ps(GP) HIV = 0.99 (99%)

Worked example
20
ps(HCW)(a) = ps(previous age group) × (1 − Its(HCW))A
where:
a = the age group under consideration; A = the total number of years in the age groups; Its(HCW) = the total incidence of infection among susceptible
health-care workers in the preceding age group.
Its(HCW) equals the baseline incidence of infection in the susceptible proportion of the general population, Ibs(GP) (which is the same as the incidence for the general population), plus the incidence of infection from sharps injuries in health-care workers (In(HCW)) divided by the proportion of susceptible health-care workers (ps(HCW)):
Its(HCW) = Ibs(GP) + (In(HCW) / ps(HCW)) For the first age group of health-care workers, however, it is assumed that the susceptible proportion is the same as that for the general population. This is because it is not possible to estimate the incidence of infections due to sharps injuries in health-care workers before estimating the susceptibility, and vice-versa. For HBV infections, calculation of ps(HCW) should also take into account the rate of HBV vaccination in health-care workers:
ps(HCW) = ps(GP) − (ps(GP) × pi(HCW)) It is also assumed that the proportion of individuals susceptible to HIV infection is the same for all age groups, as the incidence of HIV is generally low. The proportion of susceptible individuals in the first age group of health-care workers (20−29 years) is shown in Box 3.
5.4 Baseline incidence of infection among health-care workers, Ib(HCW)
The baseline incidence of infection in susceptible health-care workers (i.e. the incidence that is not due to occupational exposures) is assumed to be the same as the
Box 3 Proportion of susceptible health-care workers, 20−29 years old
ps(HCW) HBV = 0.88 − (0.88 × 0.39) = 0.54 (54%) ps(HCW) HCV = 0.97 (97%) ps(HCW) HIV = 0.99 (99%)
Worked example
21
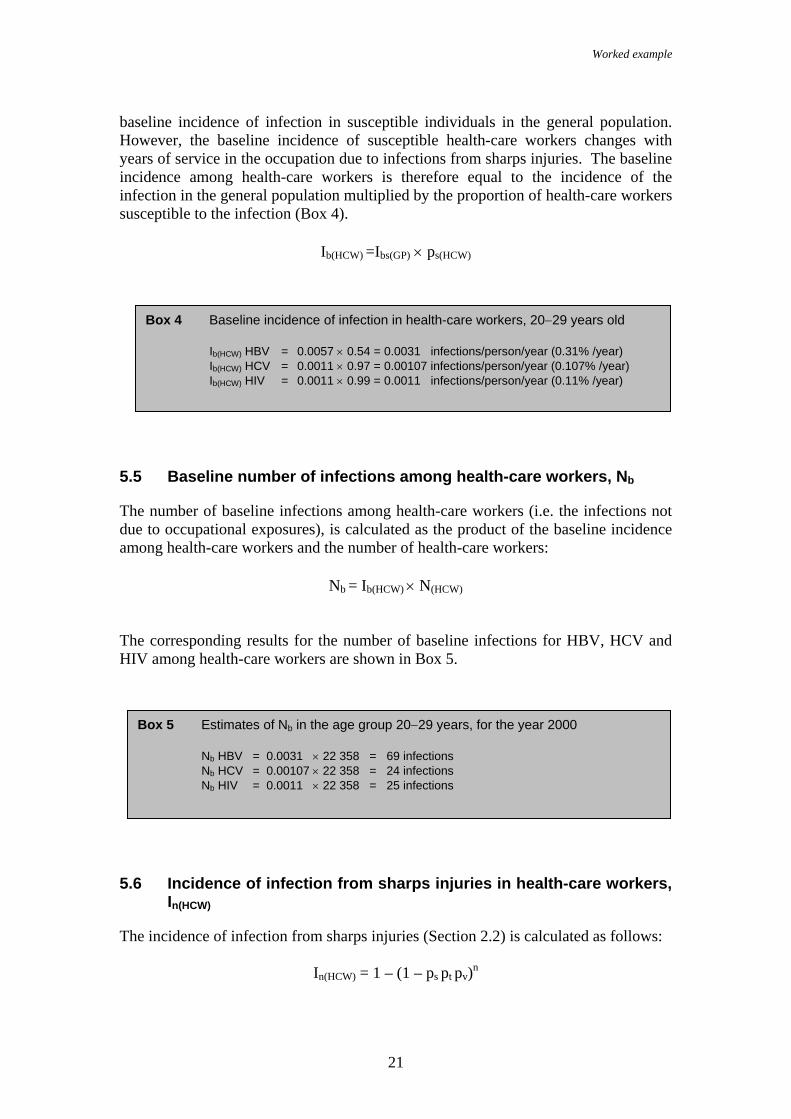
Box 4 Baseline incidence of infection in health-care workers, 20−29 years old
Ib(HCW) HBV = 0.0057 × 0.54 = 0.0031 infections/person/year (0.31% /year) Ib(HCW) HCV = 0.0011 × 0.97 = 0.00107 infections/person/year (0.107% /year) Ib(HCW) HIV = 0.0011 × 0.99 = 0.0011 infections/person/year (0.11% /year)
Box 5 Estimates of Nb in the age group 20−29 years, for the year 2000
Nb HBV = 0.0031 × 22 358 = 69 infections Nb HCV = 0.00107 × 22 358 = 24 infections Nb HIV = 0.0011 × 22 358 = 25 infections
baseline incidence of infection in susceptible individuals in the general population. However, the baseline incidence of susceptible health-care workers changes with years of service in the occupation due to infections from sharps injuries. The baseline incidence among health-care workers is therefore equal to the incidence of the infection in the general population multiplied by the proportion of health-care workers susceptible to the infection (Box 4).
Ib(HCW) =Ibs(GP) × ps(HCW)
5.5 Baseline number of infections among health-care workers, Nb
The number of baseline infections among health-care workers (i.e. the infections not due to occupational exposures), is calculated as the product of the baseline incidence among health-care workers and the number of health-care workers:
Nb = Ib(HCW) × N(HCW) The corresponding results for the number of baseline infections for HBV, HCV and HIV among health-care workers are shown in Box 5.
5.6 Incidence of infection from sharps injuries in health-care workers,
In(HCW)
The incidence of infection from sharps injuries (Section 2.2) is calculated as follows:
In(HCW) = 1 – (1 – ps pt pv)n

Worked example
22
Box 7 Estimate of Nn for health-care workers in the age group 20−29 years, for the year 2000
Nn HBV = 0.0049 × 22 358 = 109 Nn HCV = 0.0011 × 22 358 = 25 Nn HIV = 0.00004 × 22 358 = 1
This calculation takes into account the probability of having a sharps injury, the probability of being susceptible to infection, the probability of the sharp object being contaminated with virus, and the probability of transmission of the infection once the sharps injury has occurred. Estimates of the incidence of infections due to sharps injuries for the present example are shown in Box 6.
In this example, it is assumed that no PEP is provided for sharps injuries. 5.7 Number of infections in health-care workers from sharps injuries,
Nn
The number of infections from sharps injuries is the product of the incidence of infection due to sharps injuries and the total number of health-care workers at risk of a sharps injury:
Nn = In(HCW) × N(HCW) Estimates for health-care workers in the age group 20−29 years are given in Box 7.
5.8 Fraction of infections attributable to sharps injuries in health-care
workers
The final step is to calculate the attributable fraction, given the number of infections due to sharps (Nn) and the number of baseline infections (Nb):
AF = Nn / (Nn + Nb)
Box 6 Incidence of infections from sharps injuries, for health-care workers 20−29 years old
In(HCW) HBV = 1 − (1 − 0.54 × 0.18 × 0.0201)2.53 = 0.0049 infections/person/year (0.49% /year) In(HCW) HCV = 1 − (1 − 0.97 × 0.018 × 0.0239)2.53 = 0.0011 infections/person/year (0.11% /year) In(HCW) HIV = 1 − (1 − 0.99 × 0.0051 × 0.0032)2.53 = 0.00004 infections/person/year (0.004% /year)
Worked example
23
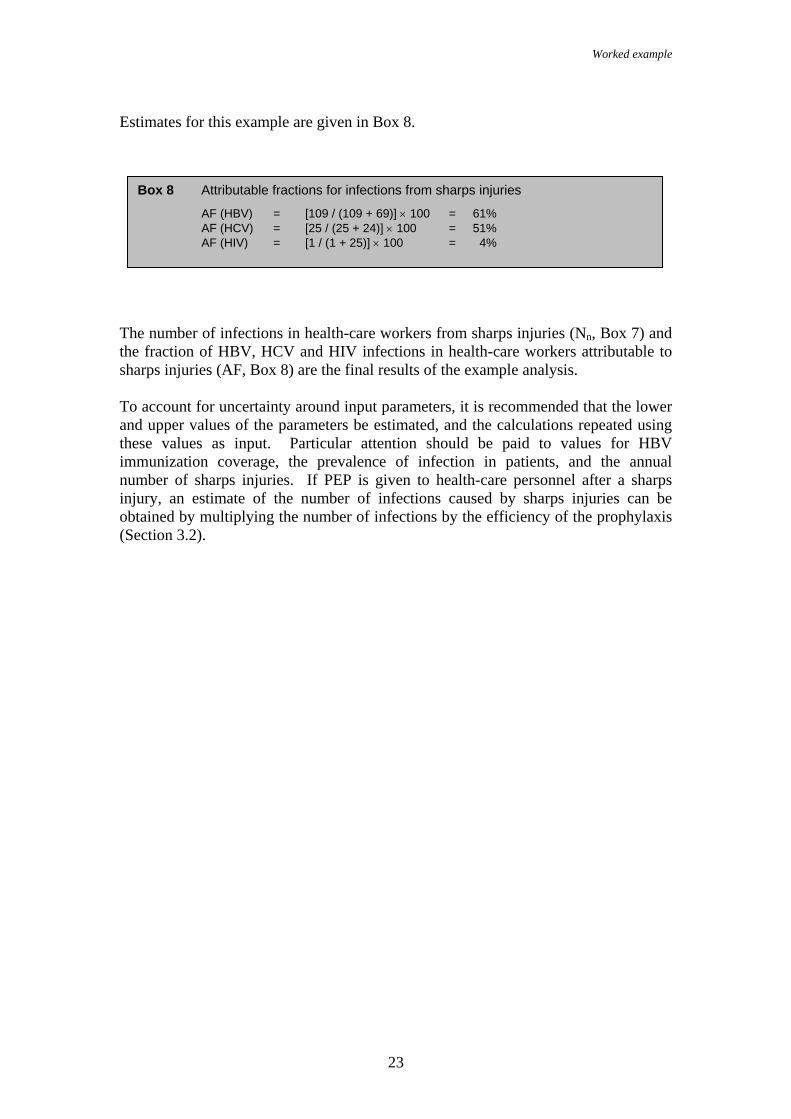
Box 8 Attributable fractions for infections from sharps injuries
AF (HBV) = [109 / (109 + 69)] × 100 = 61% AF (HCV) = [25 / (25 + 24)] × 100 = 51% AF (HIV) = [1 / (1 + 25)] × 100 = 4%
Estimates for this example are given in Box 8.
The number of infections in health-care workers from sharps injuries (Nn, Box 7) and the fraction of HBV, HCV and HIV infections in health-care workers attributable to sharps injuries (AF, Box 8) are the final results of the example analysis. To account for uncertainty around input parameters, it is recommended that the lower and upper values of the parameters be estimated, and the calculations repeated using these values as input. Particular attention should be paid to values for HBV immunization coverage, the prevalence of infection in patients, and the annual number of sharps injuries. If PEP is given to health-care personnel after a sharps injury, an estimate of the number of infections caused by sharps injuries can be obtained by multiplying the number of infections by the efficiency of the prophylaxis (Section 3.2).

Additional information
24
6. Additional information on sharps injuries
In this section are compiled data from the literature that illustrate the circumstances and health-care worker categories in which sharps injuries occur. Sharps injuries have been extensively investigated in some countries through surveillance studies and surveys. Data from these studies indicate that nurses account for most of the reported incidents, in terms of absolute numbers, while the rate of occurrence seems to be higher among surgeons. Other groups reporting significant rates of sharps injuries include laboratory technicians, students and housekeepers. Most exposures occur in patients’ rooms, with incidents in operating theatres, emergency departments and intensive care units next in order of incidence (Litjen, Hawk & Sterling, 2001). Approximately 38% of the accidents occur while using needles, and 42% occur after needle use but before disposal (Litjen, Hawk & Sterling, 2001). Such data (e.g. Tables 6 and 7) can help in the design and targeting of interventions that aim to reduce the frequency of exposures.

Additional information
25
Table 6 Frequency of procedure the health-care workers were using at the moment of percutaneous injury, selected countries
Procedure involved in the accident (%)a Country (reference) Recapping
Stuck by colleague
Disassembling a device
During disposal
Unattended needle
Movement of a patient
New Zealand (Lum et al., 1997) 15.0 NRb NR 21.0 NR NR
Nigeria (Adegboye et al., 1994) 18.0 18.0 10.0 NR NR 29.0
South Africa (Karstaedt & Pantanowitz, 2001) 17.4 7.2 3.0 9.6 4.8 23.4
Taiwan (Guo et al., 1999) 32.1 3.1 2.6 6.1 NR NR
USA (Mangione et al., 1991) 12.0 NR NR 13.0 8.0 NR
a The percentages do not sum to 100% because individual studies reported different categories of procedures than those in this table. b NR = not reported.

Additional information
26
Table 7 Estimates of the annual number of percutaneous injuries per health-care worker, by job category, selected countries
Annual number of percutaneous injuries Job category
Country (reference) Doctor Nurse Housekeeper Technician Chile (Wolff & Hidalgo, 1992) 1.11 4.1 NRa 1.8
Denmark (Nelsing, Nielsen & Nielsen, 1993) 0.42 0.11 NR NR
Greece (Pournaras et al., 1999) 0.016 0.03 0.028 0.02
Nigeria (Adegboye et al., 1994) 1.4 0.6 0.2 0.1
Saudi Arabia (Al-Turki & Abu-Gad, 2000) 0.009 0.02 0.005 0.006
Spain (Benitez et al., 1999) 0.43 0.16 0.11 0.39
Switzerland (Luthi et al., 1998) NR 1.6 0.53 NR
Tanzania (Gumodoka et al., 1997) 5.3 5.4 NR 6.1
UK (Williams, Gooch & Cockroft, 1993) 1.75 0.70 0.70 0.70
USA Hersey & Martin, 1994) 0.51 1.08 0.09 NR
a NR = not reported.

Next steps
27
7. Next steps
The assessed burden of disease from occupational sharps injuries for a country is a measure of the importance of the risk factor in health-care workers, and the information can be used to guide preventive measures. A number of such measures are available for sharps injuries, and national and international institutes and agencies have implemented recommendations to prevent the transmission of bloodborne pathogens to health-care workers (CDC, 1987; Health Canada, 1997; NIOSH, 2000). Some of the determinants of sharps injuries include (also see Annex 2; CDC, 1987; NIOSH, 2000): − overuse of injections and unnecessary sharps − lack of supplies, such as disposable syringes, safer needle devices, and sharps
disposal containers − lack of access to, and failure to use, sharps disposal containers immediately after
an injection − poorly-trained staff or a shortage of staff − recapping needles after use − no engineering controls, such as safer needle devices − passing instruments from hand to hand in the operating suite − lack of hazard awareness and training. The most effective means of preventing the transmission of bloodborne pathogens is to prevent exposure to needlestick injuries. Consequently, primary prevention of needlestick injuries is achieved through the elimination of unnecessary injections, and the elimination of used needles. If steps are taken, such as implementing education programmes and Universal Precautions, eliminating needle recapping, and using containers to safely dispose of sharps, needlestick injuries can be reduced by 80%. Additional reductions are possible if safer needle devices are used (Jagger, 1996; CDC, 1997b). The concept of Universal Precautions came into being in 1985 as the AIDS epidemic raised awareness worldwide about the occupational hazards of bloodborne pathogens. Universal Precautions is an administrative control measure that calls for the implementation of practices and the installation of equipment that protect the health-care worker whenever the potential exists for exposure to blood. Every patient is considered to be infected with a bloodborne pathogen, regardless of serostatus. (South African Law Commission, 1997; WHO/UNAIDS/International Council of Nurses, 2000; ILO, 2001). Traditionally, measures to prevent needlestick injuries have been ranked according to a hierarchy of controls, from most effective to least effective (American Nurses Association, 2002):

Next steps
28
Hazard elimination. Rather than use injections, administer medications another way, such as by using tablets, inhalers, or transdermal patches. Needleless intravenous systems, such as jet injectors, can be substituted for syringes and needles. If injections are used, minimize the number by eliminating all unnecessary injections. Remove unnecessary sharps (e.g. towel clips) and needles from the workplace. Engineering controls. Examples include needles that retract, sheathe, or blunt immediately after use. The technology of these devices has improved over the last decade, and they are widely available in North America and Europe. They are required by law in the USA. Administrative controls. These include policies and training programmes aimed at limiting exposure to the hazard, such as Universal Precautions (see below), allocating resources in such a way as to demonstrate a commitment to the safety of health-care workers, instituting a needlestick prevention committee, formulating an exposure control plan, and having consistent training programmes. Work practice controls. Examples include rules that prohibit the recapping of needles; placing sharps containers at eye-level and at arms reach; checking sharps disposal containers on a schedule and emptying them before they become full; and establishing the means for safely handling and disposing of sharps devices before beginning a procedure. Personal protective equipment. These are barriers and filters between the worker and the hazard. Examples include eye goggles, face shields, gloves, masks and gowns. A control programme to prevent needlestick injuries in health workers can only be effective when it is part of a larger occupational health and safety policy for the workplace (in this case the health-care setting). A committed management team is therefore essential for the success of the programme. Occupational health and safety committees also play a key role in implementing the strategies.

References
29
References
Adegboye AA, Moss GB, Soyinka F, Kreiss JK (1994). The epidemiology of needlestick and sharp instrument accidents in a Nigerian hospital. Infection Control and Hospital Epidemiology, 15(1):27−31.
Aiken LH, Sloane DM, Klocinski JL (1997). Hospital nurses occupational exposure to blood: prospective, retrospective, and institutional reports. America Journal of Public Health, 87:103−107.
Alter MJ (1997). The epidemiology of acute and chronic hepatitis C. Clinical Liver Disease, 1:559−568.
Alter MJ, Seeff LB, Kaplan PM et al. (1976). Type B hepatitis: the infectivity of blood positive for e-antigen and DNA polymerase after accidental needlestick exposure. New England Journal of Medicine, 295:909−913.
al-Turki KA, Abu-Gad HA (2000). Frequency of and prevention measures for needle-stick injuries among hospital healthcare workers in Saudi Arabia. Journal for Healthcare Quality: Promoting Excellence in Healthcare, 22(6):23−28.
American Nurses Association (2002). Needlestick prevention guide, p. 13.
Anonymous (1984). Needlestick transmission of HTLV-III from a patient infected in Africa. Lancet, 2(8416):1376−1377.
Austin GE, Jensen B, Leete J, De L’Aune W, Bhatnagar J, Racine M, Braun JE (2000). Prevalence of hepatitis C virus seropositivity among hospitalized US veterans. American Journal of Medical Science, 319(6):353−359.
Ayed Z, Houinato D, Hocine M, Ranger-Rogez S, Denis F (1995). Prevalence of serum markers of hepatitis B and C in blood donors and pregnant women in Algeria. Bulletin de la Société de Pathologie Exotique, [Bulletin of the Society for Exotic Pathology] 88(5):225−228.
Beasley RP, Hwang L-Y, Lee GC, Lan CC, Roan CH, Huang FY, Chen CL (1983). Prevention of perinatally transmitted hepatitis B virus infection with hepatitis B immune globulin and hepatitis B vaccine. Lancet, 2(8359):1099−1102.
Benitez Rodriguez E, Ruiz Moruno AJ, Cordoba Dona JA, Escolar Pujolar A, Lopez Fernandez FJ (1999). Underreporting of percutaneous exposure accidents in a teaching hospital in Spain. Clinical Performance and Quality Health-care, 7(2):88−91.
Bongiorno MR, Pistone G, Arico G (2002). Hepatitis B and Hepatitis C virus infections in dermatological patients in west Sicily: a seroepidemiological study. Journal of the European Academy of Dermatology and Venereology, 16(1):43−46.
Boxall E, Skidmore S, Evans C, Nightingale S (1994). The prevalence of hepatitis B and C in an antenatal population of various ethnic origins. Epidemiology and Infection, 113(3):523−528.

References
30
Cardo DM, Culver DH, Ciesielski CA, Srivastava PU, Marcus R, Abiteboul D, Heptonstall J, Ippolito G, Lot F, McKibben PS, Bell DM (1997). A case−control study of HIV seroconversion in health-care workers after percutaneous exposure. New England Journal of Medicine, 337:1542−1543.
CDC (1987). Universal precautions for prevention of transmission of HIV and other bloodborne infections. Morbidity and Mortality Weekly Report, 36(Suppl. No. 2S).
CDC (1997a). Recommendations for follow-up of health-care workers after occupational exposure to hepatitis C virus. Morbidity and Mortality Weekly Report, 46(26):603−606.
CDC (1997b). Evaluation of safety devices for preventing percutaneous injuries among healthcare workers during phlebotomy procedures – Minneapolis-St. Paul, New York City , and San Francisco. Morbidity and Mortality Weekly Report, 46(19):21−23.
CDC (2001). Updated US public health service guidelines for the management of occupational exposures to HBV, HCV, and HIV and recommendations for postexposure prophylaxis. Morbidity and Mortality Weekly Report, 50(RR-11).
CDC (2002a). Preventing occupational HIV transmission to health care personnel. Atlanta, GA, Centers for Disease Control and Prevention (http://www.cdc.gov/hiv/pubs/facts/hcwprev.htm, accessed October 2002).
CDC (2002b). Guideline of infection control in healthcare workers. Atlanta, GA, Centers for Disease Control and Prevention (http://www.cdc.gov/ncidod/hip/guide/InfectControl98.pdf, accessed October 2002).
Colvin M, Dawood S, Kleinschmidt I, Mullick S, Lallo U (2001). Prevalence of HIV and HIV-related diseases in the adult medical wards of a tertiary hospital in Durban, South Africa. International Journal of Sexually Transmitted Disease and AIDS, 12:386−389.
Collins CH, Kennedy DA (1987). A review − microbiological hazards of occupational needlestick and sharps injuries. Journal of Applied Bacteriology, 62:385−402.
EPINet (1998). Uniform needlestick and sharp object injury report. University of Virginia, USA, International Healthcare Worker Safety Center, Exposure Prevention Information Network (http://www.med.virginia.edu/medcntr/centers/epinet/soi98.html, accessed October 2002).
Floreani A, Paternoster D, Zappalà F, Cusinato R, Bombi G, Grella P, Chiaramonte M (1996). Hepatitis C virus infection in pregnancy. British Journal of Obstetrics and Gynaecology, 103:325−329.
Fujioka S, Shimomura H, Ishii Y, Kondo J, Fujio K, Ikeda F, Miyake M, Kusachi S, Tsuji T (1998). Prevalence of hepatitis B and C markers in outpatients of Mongolian general hospital. Kansenshogaku Zasshi, [Journal of the Japanese Association for Infectious Diseases,] 72(19):5−11.

References
31
Gerberding JL (1994). Incidence and prevalence of HIV, hepatitis B virus, hepatitis C virus, and cytomegalovirus among health care personnel at risk for blood exposure: final report from a longitudinal study. Journal of Infectious Diseases, 170:1410−1417.
Grime PR, Risi L, Binns C, Carruthers JR, Williams S (2001). Pan-Thames survey of occupational exposure to HIV and the use of post-exposure prophylaxis in 71 NHS Trusts. Journal of Infection, 42:727−732.
Gumodoka B, Favot I, Berege, ZA, Domanns WMV (1997). Occupational exposure to the risk of HIV infection among health-care workers in Mwanza region, United Republic of Tanzania. Bulletin of the World Health Organization, 75:133−139.
Guo YL, Shiao J, Chuang Y-C, Huang K-Y (1999). Needlestick and sharps injuries among health-care workers in Taiwan. Epidemiology and Infection, 122:259−265.
Health Canada (1997). Preventing the transmission of bloodborne pathogens in health care and public service settings. Canada Communicable Disease Report, 23S3 (http://www.hc-sc.gc.ca/hpb/lcdc/publicat/ccdr/97vol23/bbp_sup/index.html#intro, accessed October 2002).
Henderson DK, Fahey BJ, Willy M, Schmitt JM, Carey K, Koziol DE, Lane HC, Fedio J, Saah AJ (1990). Risk for occupational transmission of human immunodeficiency virus type 1 (HIV-1) associated with clinical exposures: a prospective evaluation. Annals of Internal Medicine, 113:740−746.
Henry K, Campbell S (1995). Needlestick/sharps injuries and HIV exposure among health care workers: national estimates based on a survey of US hospitals. Minnesota Medicine, 78:41−44.
Hersey JC, Martin LS (1994). Use of infection control guidelines by workers in healthcare facilities to prevent occupational transmission of HBV and HIV: results from a national survey. Infection Control and Hospital Epidemiology, 15:243−252. (http://www.cdc.gov/ncidod/hip/Blood/UNIVERSA.HTM, accessed December 2002).
Ibara JR, Itoua-Ngaporo A, Maniez-Montreuil M, Dupressoir MV, Huart JJ, Paris JC (1991). Serological markers of hepatitis B virus in hospitalized patients (Gastroenterology and Internal Medicine Service of the University Hospital Center of Brazzaville – Congo). Medécine Tropicale, [Tropical Medicine,] 51(1):9−13.
ILO (2001). An ILO code of practice on HIV/AIDS and the world of work. Geneva, International Labour Office.
Ippolito G, Puro V, De Carli G, and the Italian Study Group on Occupational Risk of HIV infection (1993). The risk of human immunodeficiency virus infection in health care workers: Italian multicenter study. Archives of Internal Medicine,153:1451−1458.

References
32
Jagger J (1996). Reducing occupational exposure to bloodborne pathogens: where do we stand a decade later? Morbidity and Mortality Weekly Report, 46:21−23.
Janssen RS, St Louis ME, Satten GA, Critchley SE, Petersen LR, Stafford RS, Ward JW, Hanson DL, Olivo N, Schable CA, Dondero TJ, and the Hospital HIV Surveillance Group (1992). HIV infection among patients in US acute care hospitals. New England Journal of Medicine, 327:445−452.
Karstaedt AS, Pantanowitz L (2001). Occupational exposure of interns to blood in an area of high HIV seroprevalence. South African Medical Journal, 91(1):57−61.
Kassem AS, el-Nawawy AA, Massoud MN, el-Nazar SY, Sobhi EM (2000). Prevalence of hepatitis C virus (HCV) infection and its vertical transmission in Egyptian pregnant women and their newborn. Journal of Tropical Pediatrics, 46(4):231−233.
Kelen GD, DiGiovanna T, Bisson L, Kalainov D, Siverston KT, Quinn TC (1989). Human immunodeficiency virus infection in emergency department patients. – epidemiology, clinical presentations, and risk to health-care workers: the Johns Hopkins Experience. Journal of the American Medical Association, 262:516−522.
Khuri-Bulos NA, Toukan A, Mahafzah A, al-Adham M, Faori I, Abu Khader I, Abu Rumeileh ZI (1997). American Journal of Infection Control, 25:322−329.
Koulentaki M, Ergazaki M, Moschandrea J, Spanoudakis S, Tzagarakis N, Drandakis PE, Spandidos DA, Kouroumalis EA (2001). Prevalence of hepatitis B and C markers in high-risk hospitalised patients in Crete: a five-year observational study. BMC Public Health, 1(1):17−24.
Kwesigabo G, Killewo JZJ, Sandstrom A, Winani S, Mhalu FS, Biberfeld G, Wall S (1999). Prevalence of HIV infection among hospital patients in North West Tanzania. AIDS Care, 11(1):87−93.
Lanphear BP, Linnemann CC Jr, Cannon GC, de Ronde MM, Pendy L, Kerley LM (1994). Hepatitis C virus infection in health care workers: risk of exposure and infection. Infection Control and Hospital Epidemiology, 15:745−750.
Lima MPJS, Pedro RJ, Rocha MDC (2000). Prevalence and risk factors for hepatitis C virus (HCV) infection among pregnant Brazilian women. International Journal of Gynaecology and Obstetrics, 70:319−326.
Litjen Tan, Hawk C, Sterling ML (2001). Report of the Council on Scientific Affairs: Preventing needlestick injuries in health care settings. Archives of Internal Medicine, 161:929−936.
Lum D, Mason Z, Meyer-Rochow G, Neveldsen GB, Siriwardena M, Turner P (1997). Needle stick injuries in country general practice. New Zealand Medical Journal, 110:122−125.
Luthi JC, Dubois-Arber F, Iten A, Maziero A, Colombo C, Jost J, Francioli P (1998). The occurrence of percutaneous injuries to health-care workers: a cross sectional survey in seven Swiss hospitals. Journal Suisse de Medécine, [Swiss Journal of Medicine,] 128(14):536−543.

References
33
Mangione CM, Gerberding JL, Cummings SR (1991). Occupational exposure to HIV: frequency and rate of underreporting of percutaneous and mucocutaneous exposure by medical house staff. American Journal of Medicine, 90(1):85−90.
McCarthy GM, Koval JJ, MacDonald JK (1999). Occupational injuries and exposures among Canadian dentists: the results of a national survey. Infection Control and Hospital Epidemiology, 20:331−336.
McCarthy MC, el-Tigani A, Khalid IO, Hymas KC (1994). Hepatitis B and C in Juba, southern Sudan: results of a serosurvey. Transactions of the Royal Society of Tropical Medicine and Hygiene, 88(5):534−536.
Mitsui T, Iwano K, Masuko K, Yamazaki C, Okamoto H, Tsuda F, Tanaka T, Mishiro S (1992). Hepatitis C virus infection in medical personnel after needlestick accident. Hepatology, 16:1109−1114.
Mujeeb SA, Khatri Y, Khanani R (1998). Frequency of parenteral exposure and seroprevalence of HBV, HCV, and HIV among operation room personnel. Journal of Hospital Infection, 38(2):133−137.
Muller O, Moser R (1990). HIV-1 disease in a Kampala Hospital 1985−89. Lancet, 335(8683):236−237.
Muñoz-Almagro C, Juncosa T, Fortuny C, Guillèn J-J, Gonzàles-Cuevas A, Latorre C (2002). Prevalencia de la infeccion por el virus de la hepatitis C en mujeres embarazadas y transmision vertical de este virus. [Prevalence of hepatitis C virus in pregnant women and its vertical transmission.] Medicina Clínica, [Clinical Medicine,] 118(12):452−454.
Nelsing S, Nielsen TL, Nielsen JO (1993). Occupational blood exposure among health care workers: I. Frequency and reporting. Scandinavian Journal of Infectious Diseases, 25(2):193−198.
Nelsing S, Wantzin P, Skøt J, Krarup E, Nielsen TL, Krarup HB, Nielsen JO (1995). The seroprevalence of hepatitis B and C in hospitalized Danish patients. Scandinavian Journal of Infectious Diseases, 27:445−448.
NIOSH (2000). Preventing needlestick injuries in health care settings. Washington, DC, US Department of Health and Human Services, National Institute for Occupational Safety and Health (Publication No. 2000-108). Available at (http://www.cdc.gov/niosh/2000-108.html, accessed October 2002).
Ortiz-Ibarra FJ, Figueroa Damian R, Lara-Sanchez J, Arredondo-Garcia JL, Ahued-Ahued JR (1996). Prevalence of serologic markers of hepatitis A, B, C, and D viruses in pregnant women. Salud Publica de Mexico, [Public Health of Mexico,] 38(5):317−322.
Parkin JM, Murphy M, Anderson J, el-Gadi S, Forster G, Pinching AJ (2000). Tolerability and side-effects of post-exposure prophylaxis for HIV infection. Lancet, 355(9205):722−723.
Perry J (2000). CDC releases national needlestick estimates. Advances in Exposure Prevention, 5(2):19.

References
34
Polz MA, Rajtar B, Daniluk J, Kowalczyk J, Ksiazek A, Pokora J (1995). Infection with HCV in patients hospitalized for various causes. I. Prevalence of anti-HCV antibodies in selected groups of patients. Przeglad Epidemiologiczny, [Epidemiological Review,] 49(3):313−316.
Pournaras S, Tsakris A, Mandraveli K, Faitatzidou A, Douboyas J, Tourkantonis A (1999). Reported needlestick and sharp injuries among health care workers in a Greek general hospital. Occupational Medicine, 49(7):423−426.
Poznansky MC, Torkington J, Turner G, Bankes MJK, Parry JV, Connell JA, Touquet R, Weber J (1994). Prevalence of HIV infection in patients attending an inner city accident and emergency department. British Medical Journal, 308:636.
Prüss-Üstün A, Rapiti E, Hutin Y (2003). Sharps injuries: global burden of disease from sharps injuries to health-care workers. Geneva, World Health Organization, 2003 (WHO Environmental Burden of Disease Series, No. 3).
Prüss-Üstün A, Mathers C, Corvalán C, Woodward A (2003). Introduction and methods: assessing the environmental burden of disease at national and local levels. Geneva, World Health Organization (Environmental Burden of Disease Series, No. 1).
Puro V, Petrosillo N, Ippolito G, Italian Study Group on Occupational Risk of HIV and Other Bloodborne Infections (1995). Risk of hepatitis C seroconversion after occupational exposure in health care workers. American Journal of Infection Control, 23:273−277.
Puro V, Govoni A, Mattioli F, de Carli G, Ippolito G, Italian PEP Registry (2000). Antiretoviral post-exposure prophylaxis in Italy. In: XIII International AIDS Conference. Durban, South Africa, July 2000 (Abstract WePeC4311).
Reiche EM, Morimoto HK, Farias GN, Hisatsugu KR, Geller L, Gomes AC, Inoue HY, Rodrigues G, Matsuo T (2000). Prevalencia de tripanossomiase americana, sifilis, toxoplasmose, rubeola, hepatite B, hepatite C e da infeccao pelo virus da imunodeficiencia humana, avaliada por intermedio de testes sorologicos, em gestatantes atendidas no periodo de 1996 a 1998 no Hospital Universitario Regional Norte do Parana. [Prevalence of American trypanosomiasis, syphilis, toxoplasmosis, rubella, hepatitis B, hepatitis C, human immunodeficiency virus infection, assayed through serological tests among pregnant patients, from 1996 to 1998, at the Regional University Hospital Norte do Parana]. Revista Da Sociedade Brasileira de Medicina Tropical, [Journal of the Brazilian Society of Tropical Medicine,] 33(6):519−527.
Rey D, Bendiane M-K, Moatti J-P, Wellings K, Danziger R, MacDowall W, and the European Study Group on HIV testing policies and practices in Europe (2000). AIDS Care, 12(6):695−701.
Russi M, Buitrago M, Goulet J, Calello D, Perlotto J, van Rhijn D, Nash E, Friedland G, Hierholzer W (2000). Antiretroviral prophylaxis of health-care workers at two urban medical centers. Journal of Occupational and Environmental Medicine, 42(11):1092−1100.

References
35
Seeff LB, Wright EC, Zimmerman HJ, Alter HJ, Dietz AA, Felsher BF (1978). Type B hepatitis after needle-stick exposure: prevention with hepatitis B immune globulin. Final report of the Veterans Administration Cooperative Study. Annals of Internal Medicine, 88:285−293.
Sepkowitz KA (1996). Occupationally acquired infections in health-care workers. Part II. Annals of Internal Medicine, 125(11):917−928.
Shanks NJ, al-Kalai D (1995). Occupation risk of needlestick injuries among health care personnel in Saudi Arabia. Journal of Hospital Infection, 29(3):221−226.
Shiao J, Guo L, McLaws M-L (2002). Estimation of the risk of bloodborne pathogens to health-care workers after a needlestick injury in Taiwan. American Journal of Infection Control, 30:15−20.
Snedecor GW, Cochran WG (1989). Statistical methods, 8th ed. Ames, Iowa, Iowa State University Press.
South African Law Commission (1997). Aspects of the law relating to AIDS (Project No. 85): universal workplace infection control measures (Universal Precautions). Pretoria, South Africa.
Stevens CE, Toy PT, Tong MJ, Taylor PE, Vyas GN, Nair PV, Gudavalli M, Krugman S (1985). Perinatal hepatitis B virus transmission in the United States: prevention by passive-active immunization. Journal of the American Medical Association, 253:1740−1745.
Tokars JI, Marcus R, Culver DH, Schable CA, McKibben PS, Bandea CI, Bell DM (1993). Surveillance of HIV infection and zidovudine use among health-care workers after occupational exposure to HIV-infected blood. Annals of Internal Medicine, 118:913−919.
UNAIDS (2000). Global HIV epidemic update: December 2000. Geneva, UNAIDS.
UNAIDS (2001), Table of country-specific HIV/AIDS estimates and data in Ms Excel and HTML, http://www.unaids.org/epidemic_update/report/index.html#table (accessed in December 2001).
UNAIDS (2002). Global HIV/AIDS and STD surveillance. (http://www.unaids.org/hivaidsinfo/statistics/fact_sheets/index_en.htm, accessed October 2002)
US Department of Labor (2002). Safety and health topics: bloodborne pathogens. Washington, DC, Occupational Safety and Health Administration (http://www.osha.gov/SLTC/bloodbornepathogens/, accessed October 2002).
Wang SA, Panlilio AL, Doi PA, White AD, Stek M Jr, Saah A (2000). Experience of healthcare workers taking postexposure prophylaxis after occupational HIV exposures: findings of the HIV Postexposure Prophylaxis Registry. Infection Control and Hospital Epidemiology, 21(12):780−785.
Ward C, Tudor-Williams G, Cotzias T, Hargreaves S, Regan L, Foster GR (2000). Prevalence of hepatitis C among pregnant women attending an inner London obstetric department: uptake and acceptability of named antenatal. Gut, 47:277−280.

References
36
WHO (2001). WHO Statistical Information System WHOSIS. Geneva, World Health Organization (http://www-nt.who.int/whosis/statistics/menu.cfm, accessed 2001).
WHO (2002). World health report. Geneva, World Health Organization.
WHO/UNAIDS/International Council of Nurses (2000). HIV and the workplace and Universal Precautions. Fact sheets on HIV/AIDS for nurses and midwives. (Geneva, 2000).
Williams S, Gooch C, Cockroft A (1993). Hepatitis B immunization and exposure to blood among surgical staff. British Journal of Surgery, 80(6):714−716.
Wolff M, Hidalgo S (1992). Exposicion accidental del personal de salud a sangre y liquidos biologicos de pacientes. [Accidental exposure of health-care workers to blood and body fluids from patients.] Revista Medica de Chile, [Medical Journal of Chile,] 120:1247−1253.

Annex 1
37
Annex 1 Estimates of the global disease burden from sharps injuries to health-care workers for the year 2000
This annex summarizes the global estimate of the disease burden from sharps injuries to health-care workers for the year 2000. Further details can be found in Prüss-Üstün, Rapiti & Hutin (2003). The disease burden was estimated for 14 WHO subregions (Table A1), by gender, and for the age groups 15−29, 30−44, 45−59 and 60−69 years. Basic input parameters included the prevalence and incidence of HBV, HCV and HIV(Tables A1 and A2), and the number of health-care workers by WHO subregion (Table A3).

Annex 1
38
Table A1 Subregional estimates of HBV, HCV and HIV prevalence, year 2000a
WHO subregion Countries
HBV (%)
HCV (%)
HIV (%)
AFR D Algeria, Angola, Benin, Burkina Faso, Cameroon, Cape Verde, Chad, Comoros, Equatorial Guinea, Gabon, Gambia, Ghana, Guinea-Bissau, Liberia, Madagascar, Mali, Mauritania, Mauritius, Niger, Nigeria, Sao Tome and Principe, Senegal, Seychelles, Sierra Leone, Togo
11.5 2.6 1.3
AFR E Botswana, Burundi, Central African Republic, Congo, Côte d’Ivoire, Democratic Republic of the Congo, Eritrea, Ethiopia, Kenya, Lesotho, Malawi, Mozambique, Namibia, Rwanda, South Africa, Swaziland, Uganda, United Republic of Tanzania, Zambia, Zimbabwe
11.8 2.8 5.1
AMR A Canada, Cuba, United States of America 0.51 1.60 0.29
AMR B Antigua and Barbuda, Argentina, Bahamas, Barbados, Belize, Brazil, Chile, Colombia, Costa Rica, Dominica, Dominican Republic, El Salvador, Grenada, Guyana, Honduras, Jamaica, Mexico, Panama, Paraguay, Saint Kitts and Nevis, Saint Lucia, Saint Vincent and the Grenadines, Suriname, Trinidad and Tobago, Uruguay, Venezuela
1.61 1.51 0.30
AMR D Bolivia, Ecuador, Guatemala, Haiti, Nicaragua, Peru 2.0 2.4 0.51
EMR B Bahrain, Cyprus, Iran (Islamic Republic of), Jordan, Kuwait, Lebanon, Libyan Arab Jamahiriya, Oman, Qatar, Saudi Arabia, Syrian Arab Republic, Tunisia, United Arab Emirates
5.7 2.3 0.01
EMR D Afghanistan, Djibouti, Egypt, Iraq, Morocco, Pakistan, Somalia, Sudan, Yemen 4.3 5.5 0.03
EUR A Andorra, Austria, Belgium, Croatia, Czech Republic, Denmark, Finland, France, Germany, Greece, Iceland, Ireland, Israel, Italy, Luxembourg, Malta, Monaco, Netherlands, Norway, Portugal, San Marino, Slovenia, Spain, Sweden, Switzerland, United Kingdom
1.16 0.44 0.13
EUR B Albania, Armenia, Azerbaijan, Bosnia and Herzegovina, Bulgaria, Georgia, Kyrgyzstan, Poland, Romania, Slovakia, Tajikistan, The Former Yugoslav Republic of Macedonia, Turkey, Turkmenistan, Uzbekistan, Yugoslavia
5.5 1.9 0.01
EUR C Belarus, Estonia, Hungary, Kazakhstan, Latvia, Lithuania, Republic of Moldova, Russian Federation, Ukraine 3.8 2.5 0.16
SEAR B Indonesia, Sri Lanka, Thailand 9.0 2.9 0.28
SEAR D Bangladesh, Bhutan, Democratic People’s Republic of Korea, India, Maldives, Myanmar, Nepal, Timor Leste 3.6 1.84 0.36
WPR A Australia, Brunei Darussalam, Japan, New Zealand, Singapore 1.9 2.7 0.02
WPR B Cambodia, China, Cook Islands, Fiji, Kribati, Lao People’s Democratic Republic, Malaysia, Marshall Islands, Micronesia (Federated States of), Mongolia, Nauru, Niue, Palau, Papua New Guinea, Philippines, Republic of Korea, Samoa, Solomon Islands, Tonga, Tuvalu, Vanuatu, Viet Nam
11.8 3.2 0.06
a Sources: WHO subregional country groupings (WHO, 2002). Hepatitis B estimates (WHO Vaccines and Biologicals Department, unpublished data, 1996). Hepatitis C estimates (WHO Communicable Disease Surveillance and Response, unpublished data, 2001). HIV estimates (UNAIDS, 2000, 2001). WHO regularly updates health statistics and new figures can be requested at ([email protected]).

Annex 1
39
Table A2 Subregional estimates of HBV, HCV and HIV incidence in the susceptible general population for the year 2000a
HIV (%)
Subregion HBV (%)
HCV (%) Male Female
AFR D 0.12 5.0 0.27 0.51
AFR E 0.13 5.0 0.95 1.71
AMR A 0.06 0.15 0.03 0.01
AMR B 0.06 0.15 0.06 0.03
AMR D 0.10 0.50 0.17 0.08
EMR B 0.08 2.0 0.02 0.01
EMR D 0.24 2.0 0.02 0.01
EUR A 0.02 0.15 0.02 0.004
EUR B 0.06 2.0 0.002 0.0005
EUR C 0.07 2.0 0.2 0.04
SEAR B 0.11 5.0 0.05 0.03
SEAR D 0.07 2.0 0.09 0.09
WPR A 0.1 0.5 0.002 0.0002
WPR B 0.11 5.0 0.03 0.01
a Sources: WHO subregional country groupings (WHO, 2002). Hepatitis B estimates
(WHO Vaccines and Biologicals Department, unpublished data, 1996). Hepatitis C estimates (WHO Communicable Disease Surveillance and Response, unpublished data, 2001). HIV estimates (UNAIDS, 2000, 2001). WHO regularly updates health statistics and new figures can be requested at ([email protected]).

Annex 1
40
Table A3 Estimates of the number of health-care workers in the 14 WHO subregions and the proportion that is male
WHO subregion
Health-care workers in the subregion
(N)
Health-care workers as a proportion of the
subregional population (%)
Proportion of health-care workers that is
male (%)
AFR D 611 000 0.21 56
AFR E 1 011 000 0.30 56
AMR A 7 696 000 2.47 21
AMR B 1 518 000 0.35 32
AMR D 176 000 0.25 32
EMR B 739 000 0.55 54
EMR D 782 000 0.24 54
EUR A 5 773 000 1.41 22
EUR B 2 255 000 1.04 19
EUR C 4 222 000 1.69 18
SEAR B 488 000 0.17 32
SEAR D 1 395 000 0.11 32
WPR A 2 351 000 1.55 26
WPR B 6 685 000 0.44 32
Totals 35 702 000 0.59 27
From a review of the literature, the average number of sharps injuries per year was estimated for each WHO subregion (Table A4). Hepatitis B immunization coverage is also estimated for each subregion, based on the available literature (Table A5).

Annex 1
41
Table A4 Annual incidence of sharps injuries in the 14 WHO subregions, and data sources
Country data sources and assessment tools
WHO subregion
Sharps injuries per health-care worker per yeara
Sharps injury surveys or review of surveillance systems Rapid assessment surveys Tool C surveys1,2
AFR Db 2.10 Nigeria3 NAc Burkina Faso, Chad, Gambia, Niger
AFR Eb 2.10 South Africa4 Tanzania5 Ethiopia
AMR A 0.18 USA6 NA NA
AMR B 2.53 Brazil,7 Chile,8 Jamaica9 NA NA
AMR D 2.53 Extrapolated from AMR B NA NA
EMRB 1.06 Saudi Arabia10 NA Syria
EMR D 4.68 Egypt,11 Pakistan12 NA Egypt, Morocco
EUR A 0.64 Denmark,13 France,14 Greece,15 Spain,16, 17 Switzerland,18 UK19
NA NA
EUR Bb 0.93 NA Uzbekistan20 Kyrgystan
EUR Cb 0.93 NA NA Moldova
SEAR B 2.08 Thailand21 NA NA
SEAR D 2.27 NA India22 NA
WPR A 0.74 Australia,23 New Zealand24 NA NA
WPR B 1.30 China25 Mongolia26 NA a Mean values. b Data for the two subregions AFR D and AFR E, and for EUR B and EUR C, were pooled. c NA = not available. Data sources: 1WHO (2001); 2J. Fitzner (personal communication, 2001); 3Adegboye et al. (1994); 4Karstaedt & Pantanowitz (2001); 5Gumodoka et al.
(1997); 6J. Jagger (personal communication, 2002); 7Costa et al. (1997); 8Wolff & Hidalgo (1992); 9Figueroa, Carpenter & Hospedales (1994); 10al-Turki & Abu-Gad (2000); 11M. Talaat (personal communication, 2001); 12Mujeeb, Khatri & Khanani (1998); 13Nelsing, Nielsen & Nielsen (1993); 14Abiteboul et al. (1992); 15Pournaras et al. (1999); 16Failde et al. (1998); 17Benitez et al. (1999); 18Luthi et al. (1998); 19Williams, Gooch & Cockroft (1993); 20R. Kammerlander, JP Stamm (unpublished data, 2001); 21Danchaivijitr, Kachintom & Sangkard (1995); 22S. Vishnu-Priya & C. Lee (unpublished data, 2001); 23McCall (1999); 24Lum et al. (1997); 25Guo et al. (1999); 26S. Logez (unpublished data, 2001).

Annex 1
42
Table A5 WHO subregional estimates of hepatitis B vaccine coverage among health-care workers
WHO subregion
Mean HBV immunization rate among health-care workers
(%) Data sources Countries for which immunization rates were
available AFR D 18 Immunization surveys Nigeria1,2
AFR E 18 Extrapolated from AFR D NAa
AMR A 67 Estimated from survey USA3
AMR B 39 Immunization surveys Brazil,4 Jamaica5
AMR D 39 Extrapolated from AMR B NA
EMRB 39 Immunization surveys Saudi Arabia,6,7 Egypt,8 Pakistan9,10
EMR D 39 Immunization surveys NA
EUR A 71 Immunization surveys, review of sharps accidents Czech Republic,11 Denmark,12 Italy,13 UK14−16
EUR B 29 Tool C (draft) Romania17
EUR C 29 Extrapolated from EUR B NA
SEAR B 39 Extrapolated from AMR B NA
SEAR D 18 Extrapolated from AFR D NA
WPR A 77 Immunization surveys Australia,18 New Zealand19
WPR B 39 Extrapolated from AMR B NA a NA = not available. Data sources: 1Omokhodion (1998); 2Olubuyde et al. (1997); 3Mahoney et al. (1997); 4Costa et al. (1997); 5Figueroa, Carpenter & Hospedales (1994);
6Shanks & al-Kalai (1995); 7al-Turki & Abu-Gad (2000); 8M. Talaat (personal communication, 2001); 9Nasir et al. (2000); 10Mujeeb, Khatri & Khanani (1998); 11Helcl et al. (2000); 12Nelsing, Nielsen & Nielsen (1993); 13Stroffolini et al. (1998); 14Alzahrani, Vallely & Klapper (2000); 15Gyawali, Rice & Tilzey (1998); 16Williams, Gooch & Cockroft (1993); 17C. Dentinger (personal communication, 2001); 18McCall, Maher & Piterman (1999); 19Lum et al. (1997).

Annex 1
43
In calculating the disease burden of sharps injuries it is assumed that PEP for HBV and HIV is systematically applied after a sharps injury in AMR A, EUR A and WPR A, and that the prevalence of HIV in patients is twice as high as in the general population. The resulting estimated numbers of infections are shown in Table A6, and the fractions of those infections attributable to the occupation of the health-care worker are shown in Table A7 and Figure 1. In the year 2000, sharps injuries to health-care workers worldwide resulted in 16 000 HCV infections that will cause 145 (53−766) early deaths between the years 2000−2030; 66 000 HBV infections that will lead to 261 (86−923) early deaths by 2030; and 736 (129−3578) health-care workers will die prematurely from 1000 HIV infections by 2030. Table A6 Infections attributable to sharps injuries among health-care workers in the 14 WHO
subregionsa
WHO subregion HCV (n)
HBV (n)
HIV (n)
AFR D 580 3 600 100 (200−3 100) (1 300−10 900) (20−510) AFR E 1 000 6 200 620 (350−5 400) (2 200−18 800) (110−3 000) AMR A 390 40 5 (240−1 800) (20−120) (1−20) AMR B 1 000 6 000 70 (360−5 500) (1 800−25 100) (13−360) AMR D 180 760 14 (60−980) (230−3 200) (3−70) EMR B 310 2,300 1 (110−1 700) (680−9 600) (0−3) EMR D 3 200 6 800 7 (1 200−14 900) (2 200−25 000) (1−30) EUR A 290 210 6 (100−1 600) (60−730) (1−30) EUR B 690 6 400 1 (240−3 800) (2 100−23 000) (0−7) EUR C 1 700 8 200 40 (590−9 100) (2 600−29 800) (7−200) SEAR B 500 1 500 20 (180−2 700) (480−6 100) (3−90) SEAR D 1 000 7,300 70 (360−5 500) (2 600−22 000) (13−350) WPR A 830 110 0 (290−4 500) (30−400) (0−2) WPR B 4 700 16 000 30 (1 700−25 400) (5 100−63 500) (6−160) Totals (rounded) 16 400 65 600 1 000 (5 900−86 000) (2 400−240 000) (200−5 000)
a The numbers of infections are mean values for health-care workers 20−65 years old. Lower and upper estimates are given in parentheses beneath the mean value. For WHO “A” subregions, it was assumed that PEP was used for HBV and HIV.

Annex 1
44
Table A7 Fraction of HBV, HCV and HIV infections attributable to sharps injuries in health-care workersa
WHO subregion HBV (%)
HCV (%)
HIV (%)
AFR D 46 45 4.5 (23−73) (22−82) (0.8−19) AFR E 47 45 5.0 (24−73) (22−82) (0.9−20) AMR A 1 8 0.5 (1−3) (5−29) (0.2−2) AMR B 83 55 11 (63−94) (30−87) (2.0−37) AMR D 65 52 7 (39−85) (28−86) (1.3−27) EMR B 35 35 0.6 (16−63) (16−75) (0.1−3) EMR D 64 66 6.2 (39−85) (40−91) (1.1−24) EUR A 8 25 1.4 (3−22) (11−65) (0.3−7) EUR B 32 34 7.0 (14−59) (15−74) (1.3−27) EUR C 24 38 1.2 (10−50) (17−77) (0.2−6) SEAR B 40 51 9.8 (19−68) (26−85) (1.9−35) SEAR D 42 52 7.9 (20−70) (27−86) (1.5−29) WPR A 5 27 3.1 (2−14) (11−67) (0.6−14) WPR B 36 41 3.7 (16−63) (20−80) (0.7−16) Totals (rounded) 37 39 4.4 (18−65) (19−78) (0.8−18.5) a The values are for health-care workers 20−65 years old. Lower and upper estimates
are given in parentheses beneath the value.

Annex 1
45
Figure 1 Fraction of HBV, HCV and HIV infections in health-care workers, 20−65 years old, attributable to sharps injuries
0.00.10.20.30.40.50.60.70.80.91.0
Attr
ibut
able
Fra
ctio
n
AFR DAFR E
AMR A
AMR B
AMR D
EMR B
EMR D
EUR AEUR B
EUR C
SEAR B
SEAR D
WPR A
WPR B
Subregions
HBVHCVHIV

Annex 1
46
References to Annex 1 Abiteboul D, Antona D, Fourrier A, Brucker G, Descamps JM, Leprince A, Pernet M,
Bouvet E (1992). Occupational risk of exposure to blood in nurses. Results of a one-year monitoring of the risk for nurses in 17 hospitals. Pathologie Biologie, [Pathology Biology] 40(10):983−989.
Adegboye AA, Moss GB, Soyinka F, Kreiss JK (1994). The epidemiology of needlestick and sharp instrument accidents in a Nigerian hospital. Infection Control and Hospital Epidemiology, 15(1):27−31.
al-Turki KA, Abu-Gad HA (2000). Frequency of and prevention measures for needle-stick injuries among hospital healthcare workers in Saudi Arabia. Journal for Healthcare Quality: Promoting Excellence in Healthcare, 22(6):23−28.
Alzahrani AJ, Vallely PJ, Klapper PE (2000). Needlestick injuries and hepatitis B virus vaccination in health-care workers. Communicable Diseases and Public Health, 3:217−218.
Benitez Rodriguez E, Ruiz Moruno AJ, Cordoba Dona JA, Escolar Pujolar A, Lopez Fernandez FJ (1999). Underreporting of percutaneous exposure accidents in a teaching hospital in Spain. Clinical Performance and Quality Health-care, 7(2):88−91.
Costa JM, Pasqualotto AC, Segat FM, Santos RP, Guillande S, Copette FR (1997). Hepatitis B vaccination of health-care workers is not yet a reality. Brazilian Journal of Infectious Diseases, 1(5):248−255.
Danchaivijitr S, Kachintorn K, Sangkard K (1995). Needlesticks and cuts with sharp objects in Siriraj Hospital 1992. Journal of Medical Association of Thailand, 78(Suppl. 2):S108−S111.
Failde I, Lopez FJ, Cordoba JA, Zarzuela M, Benitez E, Senabre V (1998). Evolution and factors associated with biological-risk accidents reported in a university hospital in Spain, 1989 to 1995. Clinical Performance Quality Health-care, 6:103−108.
Figueroa JP, Carpenter H, Hospedales CJ (1994). A survey of hepatitis B among health workers in Jamaica. West Indian Medical Journal, 43(1):2−5.
Gumodoka B, Favot I, Berege ZA, Domanns WMV (1997). Occupational exposure to the risk of HIV infection among health-care workers in Mwanza region, United Republic of Tanzania. Bulletin of the World Health Organization, 75:133−139.
Guo YL, Shiao J, Chuang YC. Huang KY (1999). Needlestick and sharps injuries among health-care workers in Taiwan. Epidemiology and Infection, 122(2):259−265.
Gyawali P, Rice PS, Tilzey AJ (1998). Exposure to blood borne viruses and the hepatitis B vaccination status among healthcare workers in inner London. Occupational and Environmental Medicine, 55(8):570−572.

Annex 1
47
Helcl J, Castkova J, Benes C, Novotna L, Sepkowitz KA, DeHovitz JA (2000). Control of occupational hepatitis B among healthcare workers in the Czech Republic, 1982 to 1995. Infection Control and Hospital Epidemiology, 21(5):343−346.
Karstaedt AS, Pantanowitz L (2001). Occupational exposure of interns to blood in an area of high HIV seroprevalence. South African Medical Journal, 91(1):57−61.
Lum D, Mason Z, Meyer-Rochow G, Neveldsen GB, Siriwardena M, Turner P (1997). Needle stick injuries in country general practice. New Zealand Medical Journal, 110:122−125.
Luthi JC, Dubois-Arber F, Iten A, Maziero A, Colombo C, Jost J, Francioli P (1998). The occurrence of percutaneous injuries to health-care workers: a cross sectional survey in seven Swiss hospitals. Journal Suisse de Médecine, [Swiss Journal of Medicine,] 128(14):536−543.
Mahoney FJ, Stewart K, Hu H, Coleman P, Alter MJ (1997). Progress toward the elimination of hepatitis B virus transmission among health-care workers in the United States. Archives of Internal Medicine, 157(22):2601−2605.
McCall L, Maher T, Piterman L (1999). Preventive health behaviour among general practitioners in Victoria. Australian Family Physician, 28(8):854−857.
Mujeeb SA, Khatri Y, Khanani R (1998). Frequency of parenteral exposure and seroprevalence of HBV, HCV, and HIV among operation room personnel. Journal of Hospital Infection, 38(2):133−137.
Nasir K, Khan KA, Kadri WM, Salim S, Tufail K, Sheikh HZ, Ali SA (2000). Hepatitis B vaccination among health-care workers and students of a medical college. Journal of the Pakistan Medical Association, 50(7):239−243.
Nelsing S, Nielsen TL, Nielsen JO (1993). Occupational blood exposure among health-care workers: I. Frequency and reporting. Scandinavian Journal of Infectious Diseases, 25(2):193−198.
Olubuyide IO, Ola SO, Aliyu B, Dosumu OO, Arotiba JT, Olaleye OA, Odaibo GN, Odemuyiwa SO, Olawuyi F (1997). Prevalence and epidemiological characteristics of hepatitis B and C infections among doctors and dentists in Nigeria. East African Medical Journal, 74(6):357−361.
Omokhodion FO (1998). Health and safety in clinical laboratory practice in Ibadan, Nigeria. African Journal of Medicine & Medical Sciences, 27(3−4):201−204.
Pournaras S, Tsakris A, Mandraveli K, Faitatzidou A, Douboyas J, Tourkantonis A (1999). Reported needlestick and sharp injuries among health-care workers in a Greek general hospital. Occupational Medicine, 49(7):423−426.
Prüss-Üstün A, Rapiti E, Hutin Y (2003). Sharps injuries: global burden of disease from sharps injuries to health-care workers. Geneva, World Health Organization (WHO Environmental Burden of Disease Series, No. 3).
Shanks NJ, al-Kalai D (1995). Occupation risk of needlestick injuries among health-care personnel in Saudi Arabia. Journal of Hospital Infection, 29(3):221−226.

Annex 1
48
Stroffolini T, Petrosillo N, Ippolito G, Lopalco A, Sagliocca L, Adamo B, Iannotti MP, Simonetti A, Bitti PR, Marzolini A, Forastiere F, Mele A (1998). Hepatitis B vaccination coverage among healthcare workers in Italy. Infection Control and Hospital Epidemiology, 19:789−791.
UNAIDS (2000). Global HIV epidemic update: December 2000. Geneva, Joint United Nations Programme on HIV/AIDS.
UNAIDS (2001). Table of country-specific HIV/AIDS estimates and data in MS Excel and HTML. Geneva, Joint United Nations Programme on HIV/AIDS (http://www.unaids.org/epidemic_update/report/index.html#table, accessed December 2001).
Williams S, Gooch C, Cockroft A (1993). Hepatitis B immunization and exposure to blood among surgical staff. British Journal of Surgery, 80(6):714−716.
Wolff M, Hidalgo S (1992). Exposicion accidental del personal de salud a sangre y liquidos biologicos de pacientes. [Accidental exposure to health care workers of blood and body fluids from patients]. Revista Medica de Chile, [Medical Journal of Chile,] 120:1247−1253.
WHO (2001). Tool for the assessment of injection safety. Geneva, World Health Organization (WHO/V&B/01.30).
WHO (2002). World Health Report 2002: reducing risks, promoting healthy life. Geneva, World Health Organization.

Aide-mémoire for health-care worker safety Annex 2
49
© World Health Organization 2003. All rights reserved. Rev.1 WHO/EHT/03.11. Printed December 2003
WORLD HEALTH ORGANIZATION
Health care worker safety
AIDE-MEMOIRE for a strategy to protect health workers from infection with bloodborne viruses Health workers are exposed to blood and other body fluids in the course of their work. Consequently, they are at risk of infection with bloodborne viruses including human immunodeficiency virus (HIV), hepatitis B virus (HBV) and hepatitis C virus (HCV). The risk of infection for health workers depends on the prevalence of disease in the patient population and the nature and frequency of exposures. Occupational exposure to blood can result from percutaneous injury (needle-stick or other sharps injury), mucocutaneous injury (splash of blood or other body fluids into the eyes, nose or mouth) or blood contact with non-intact skin. The most common form of occupational exposure to blood and the most likely to result in infection, is needle-stick injury. The most common causes of needle-stick injury are two-handed recapping and the unsafe collection and disposal of sharps waste. Health workers in areas such as operating, delivery and emergency rooms and laboratories have a higher risk of exposure. Cleaners, waste collectors and others whose duties involve handling blood-contaminated items are also at risk. Among the 35 million health workers worldwide, about 3 million experience percutaneous exposures to bloodborne pathogens each year; two million of those to HBV, 0.9 million to HCV and 170 000 to HIV. These injuries may result in 15 000 HCV, 70 000 HBV and 1 000 HIV infections. More than 90% of these infections occur in developing countries. Most blood exposures in health settings are preventable. Strategies to protect health workers include implementation of Universal Precautions, immunization against hepatitis B, provision of personal protection and the management of exposures. Elimination of unnecessary sharps and injections also minimizes the potential for exposure. Successful implementation of these strategies requires an effective infection control committee with support from the health setting management team.
Words of advice Set up and empower an Infection Control Committee
Use surveillance to identify risk situations and procedures and modify them wherever possible
Achieve compliance with Universal Precautions though ongoing commitment, training of all staff members and provision of supplies
Immunize health workers against hepatitis B early in their career
Ensure availability of personal protective equipment
Manage cases of exposure to blood and body fluids
Enforce safe practices though monitoring and supervision
Checklist
Universal Precautions
Hand washing after any direct contact with patients
No needle recapping Safe collection and disposal of sharps Gloves for contact with body fluids, non-intact
skin and mucous membranes Wearing a mask, eye protection and a gown if
blood or other body fluids might splash Covering cuts and abrasions Cleaning up spills of blood and other body
fluids Safe system for hospital waste management
and disposal
Hepatitis B immunization
Immunize early in the career Pre-vaccination serological testing is
unnecessary Use 0, 1 and 6 months schedule If possible, conduct post-vaccination testing Do not administer boosters routinely
Personal protection
Where possible, use needle-stick prevention devices
Ensure adequate supplies Involve staff in the selection of personal
protective equipment Train staff in correct use Use influential senior staff as role models Monitor compliance and inappropriate use Dispose safely
Post-exposure management
Guidelines outlining all procedures Dissemination of guidelines Information, education and communication Support and counselling Where possible, provision of post-exposure
prophylactic medication for high-risk exposures
Analysis of surveillance data

Annex 2 Aide-mémoire for health-care worker safety
50
Key elements
Universal Precautions
Universal Precautions are a simple set of effective practices designed to protect health workers and patients from infection with a range of pathogens including bloodborne viruses. These practices are used when caring for all patients regardless of diagnosis. They are applied universally. It is not feasible, effective or cost-effective to test all patients for all pathogens prior to giving care in order to identify those who are infected and take precautions only with them. Knowing a patient is infected does not prevent occupational exposure to blood. Thus, decisions regarding the level of precautions to use are based on the nature of the procedure and not on the actual or assumed serological status of the patient. It is not safe to take precautions only with those from so-called risk groups for infection with bloodborne pathogens as many people belonging to risk groups are not infected and many infected people do not belong to risk groups. In practice, the implementation of Universal Precautions includes the following interventions:
Hand washing after any direct contact with patients Preventing two-handed recapping of needles Safe collection and disposal of needles (hypodermic and suture) and sharps (scalpel blades, lancets, razors,
scissors), with required puncture- and liquid- proof safety boxes in each patient care area Wearing gloves for contact with body fluids, non-intact skin and mucous membranes Wearing a mask, eye protection and a gown (and sometimes a plastic apron) if blood or other body fluids might
splash Covering all cuts and abrasions with a waterproof dressing Promptly and carefully cleaning up spills of blood and other body fluids Using a safe system for health care waste management and disposal
Hepatitis B immunization
Routine immunization of health workers against infection with HBV is an effective way to protect them. HBV is the most infectious bloodborne virus and in many parts of the world, the most prevalent. The long-term sequelae of HBV infection include cirrhosis and hepatocellular carcinoma. Hepatitis B vaccine is effective, cost-effective relatively inexpensive (less than US$ 0.5 a dose) and widely available. Immunize health workers early in their career Pre-vaccination serological testing is unnecessary but may save resources if feasible and if prevalence of immunity is high Use a 0, 1 and 6 months schedule of three injections If possible, control antibody levels between two to six months after the last dose Do not administer boosters routinely as protection is lifelong
Personal protection
Personal protective equipment includes gloves, goggles or glasses, masks, gowns and plastic aprons. Where possible, use needle-stick prevention devices (i.e., devices where the sharp is sheathed or retracted after use) Ensure adequate supplies of personal protective equipment in all areas Involve staff in the selection of personal protective equipment as equipment that is of poor quality or uncomfortable to wear will not be used Train staff in the correct use of personal protective equipment Use influential senior staff as role models to promote personal protective equipment Monitor compliance and inappropriate use. Inappropriate glove use wastes resources. Compliance with eye protection often requires additional efforts Dispose of used personal protective equipment safely
Post-exposure management
The risk of infection following a needle-stick injury with needle from an infected source patient is ~ 0.3% for HIV, 3% for hepatitis C and 6-30% for hepatitis B. An effective response to occupational exposure to blood or other body fluids involves the following: Development guidelines outlining the first aid required, reporting mechanism and procedure to be followed for post-exposure prophylaxis and follow-up testing Dissemination of guidelines Information, education and communication Provision of support and counselling Where possible and indicated, provision of post-exposure prophylactic medication Analyze reported cases of exposure to improve practices
Additional information on the safe and appropriate use of injections can be obtained on the World-Wide Web at www.injectionsafety.org and on the Safe Injection Global Network
internet forum at [email protected].