assessing the applicability of compuer aided photo ... documents/assessing the applicability...
TRANSCRIPT

University of MiamiScholarly Repository
Open Access Theses Electronic Theses and Dissertations
2015-04-30
Assessing the Applicability of Compuer AidedPhoto-identification for Pinniped Studies Throughthe Determination of Site Fidelity in Long Island,NY Harbor Seals (Phoca Vitulina Concolor)Meaghan McCormackUniversity of Miami, [email protected]
Follow this and additional works at: http://scholarlyrepository.miami.edu/oa_theses
This Open access is brought to you for free and open access by the Electronic Theses and Dissertations at Scholarly Repository. It has been accepted forinclusion in Open Access Theses by an authorized administrator of Scholarly Repository. For more information, please [email protected].
Recommended CitationMcCormack, Meaghan, "Assessing the Applicability of Compuer Aided Photo-identification for Pinniped Studies Through theDetermination of Site Fidelity in Long Island, NY Harbor Seals (Phoca Vitulina Concolor)" (2015). Open Access Theses. Paper 557.

UNIVERSITY OF MIAMI
ASSESSING THE APPLICABILITY OF COMPUTER AIDED PHOTO-IDENTIFICATION FOR PINNIPED STUDIES THROUGH THE DETERMINATION OF SITE FIDELITY IN LONG ISLAND, NY HARBOR SEALS (PHOCA VITULINA
CONCOLOR)
By
Meaghan McCormack
A THESIS
Submitted to the Faculty of the University of Miami
in partial fulfillment of the requirements for the degree of Master of Science
Coral Gables, Florida
May 2015

©2015 Meaghan McCormack All Rights Reserved

UNIVERSITY OF MIAMI
A thesis submitted in partial fulfillment of the requirements for the degree of
Master of Science
ASSESSING THE APPLICABILITY OF COMPUTER AIDED PHOTO-IDENTIFICATION FOR PINNIPED STUDIES THROUGH THE DETERMINATION OF SITE FIDELITY IN LONG ISLAND, NY HARBOR SEALS (PHOCA VITULINA
CONCOLOR)
Meaghan McCormack
Approved:
________________ _________________
Marialuisa E. Estevanez Daniel O. Suman, Ph.D. Senior Lecturer of Marine Affairs and Policy Professor of Marine Affairs and Policy
________________ _________________
Jill L. Richarson, Ph.D. M. Brian Blake, Ph.D. Senior Lecturer Marine Biology and Fisheries Dean of the Graduate School

MCCORMACK, MEAGHAN (M.S., Marine Affairs and Policy)
Assessing the Applicability of Computer (May 2015) Aided Photo-identification for Pinniped Studies Through the Determination of Site Fidelity in Long Island, NY Harbor Seals (Phoca vitulina concolor) Abstract of a thesis at the University of Miami. Thesis supervised by Professor Marialuisa Estevanez. No. of pages in text. (99) Studying the population parameters of marine mammals requires that individuals
be identified both spatially and temporally. Traditionally, to identify individuals in the
field, animals have been captured and physically marked with a unique feature, allowing
the individual to be identified in the future. This method known as Capture-Mark-
Recapture (CMR) has been widely utilized to analyze marine mammal populations.
While quite effective, traditional CMR is invasive and poses potential risk for both
animals and researches. More recently, with advanced technology and camera equipment
a far less invasive and more cost effective method of Photo-identification based Mark
Recapture has been developed (PMR).
To assess the efficacy of computer aided matching software and the applicability
of such software for future pinniped studies, a photographic based mark recapture study
was conducted across the 2011-2014 harbor seal seasons using both manual and
computer aided methods to determine if the Long Island, NY population display site
fidelity, in that they return to the same haul-out location over multiple seasons.
Additionally, manual and computer methods were compared for accuracy and their
potential use in future pinniped studies.

Results indicated that some Long Island harbor seals show site fidelity, returning
to the same haul-out locations over multiple seasons. Both methods were successful at
identifying and organizing capture histories of harbor seals. The computer aided method
was found to be slightly more accurate, resulting in higher re-sighing rates and greater
numbers of identifiable individuals. However, both the manual and computer aided
methods were time consuming. Automating pre-processing steps in the computer aided
methods will aid in minimizing effort associated with this method. Likewise, the
development of a similarity coefficient threshold for viewing potential matches will
minimize effort. Errors, particularly false negative errors, remain an issue in both
methods. Future research on computer matching software should focus on minimizing
effort, largely through the automating of pre-processing steps, development of a
similarity coefficient threshold, and reducing false negative errors. Further advancements
in computer aided matching software will enhance our ability to study the population
parameters of pinnipeds via haul out and rookery sites both accurately and effectively.

iii
DEDICATION
I would like to dedicate this thesis to my parents who have supported me
throughout my education and in all aspects of my life. Thank you for supporting me
from the very beginning; you support does not go unnoticed.

iv
ACKNOWLEDGMENTS
I would like to acknowledge a few individuals, without whom this thesis would
not be possible. First, I would like to thank Dr. Kopelman, president and founder of the
Coastal Research and Education Society of Long Island (CRESLI), who took all the
subsequent photos of harbor seals as well as beginning the large scale photo-
identification efforts to monitor this population of seals. Secondly, I would like to thank
Dr. Lex Hiby, co-developer of the extract compare and seal demo program, which was
utilized in this study. Dr. Hiby was very gracious in answering my specific questions
about the program and the application to my thesis, and I express the upmost gratitude in
return. Thirdly, I would like to thank Andrea Bogomolni of Woods Hole Oceanographic
Institute, who helped me to acquire grey seal photos for my analysis. Finally, I would
like to thank my thesis committee, Maria Estevanez, Dr. Suman and Dr. Richardson, as
well as the RSMAS community, for making this thesis a reality.

v
TABLE OF CONTENTS
Page
LIST OF FIGURES……………………………..……………………………………….vii
LIST OF TABLES..………………………………………………………………….....viii
Chapter
1 INTRODUCTION …………………………………………..……………….1 North Atlantic Harbor Seal…………………………………………...............1 Harbor Seal Haul-out Behavior………………………………………………2 Site Fidelity in Harbor Seals and Management Implications....………...........9 Photo-identification based Capture Mark Recapture…….……….................12 Manual Photo-identification Techniques……………………………………15 Computer Aided Photo-identification Techniques………………………….16 Capture Mark Recapture Assumptions……………………………...............17 Errors in Photo-identification……………………………………………….19 Study Site and Objectives…………………………………………...............21
2 MATERIALS AND METHODS……………………………………………24 Study Site and Data Collection……………………………………………...24 Data Analysis for Manual Photo-identification ……………….……………24 Data Analysis for Computer Aided Photo-identification………………...….26 Comparing Manual vs. Computer Aided Photo-identification Methods……28 General Population Statistics and Probability of Capture…………………...29 Spatial Analysis of LI Harbor Seal Haul-out………………………………..30 Blind Study of Manual Matching Success of Harbor Seals…………………30 Computer Aided Matching of Grey Seals…………………………………...32 Comparing Error Rates of Harbor and Grey Seals………………………….32
3 RESULTS……..……………..……………………………………………...33 Manual Photo-identification and Site Fidelity Determination……................33 Computer Aided Photo-identification and Site Fidelity Determination…….33 Comparing Manual vs. Computer Aided Photo-ID methods………………..34 General Population Statistics and Probability of Capture…………………...35 Spatial Analysis of LI Harbor Seal Haul-out.……………………………….36 Blind Study of Manual Matching Success…………………………………..37 Computer Aided Identification of Grey Seals………………………………37 Comparing Error Rates of Harbor and Grey Seals………………………….38
4 DISCUSSION……………………………………………………………….39 Site Fidelity of Long Island Harbor Seals……..………………….…………39 Comparison of Manual vs. Computer Aided Methods……………………...47 Errors in Photo-identification……………………………………………….51 Manual Matching of Trained vs. Untrained Photo-analysts………………...53 Comparing Error Rates of Harbor and Grey Seals…..……………………...53

vi
Citizen Science Applications………………………………………………..54 Future Research Needs……………………………………………...............56 Study Limitations………...………………………………………………….56
5 CONCLUSION…………………………………………,...………………...58
FIGURES………………………………………………………………………………...60
TABLES…………………………………………………………………………………85
WORKS CITED…...………………………….……………………………………........94

vii
LIST OF FIGURES
Page
Figure 1. Map of coastal range of Western Atlantic harbor seal………………...............60
Figure 2. Map of Long Island indicating location of study site ........................................61
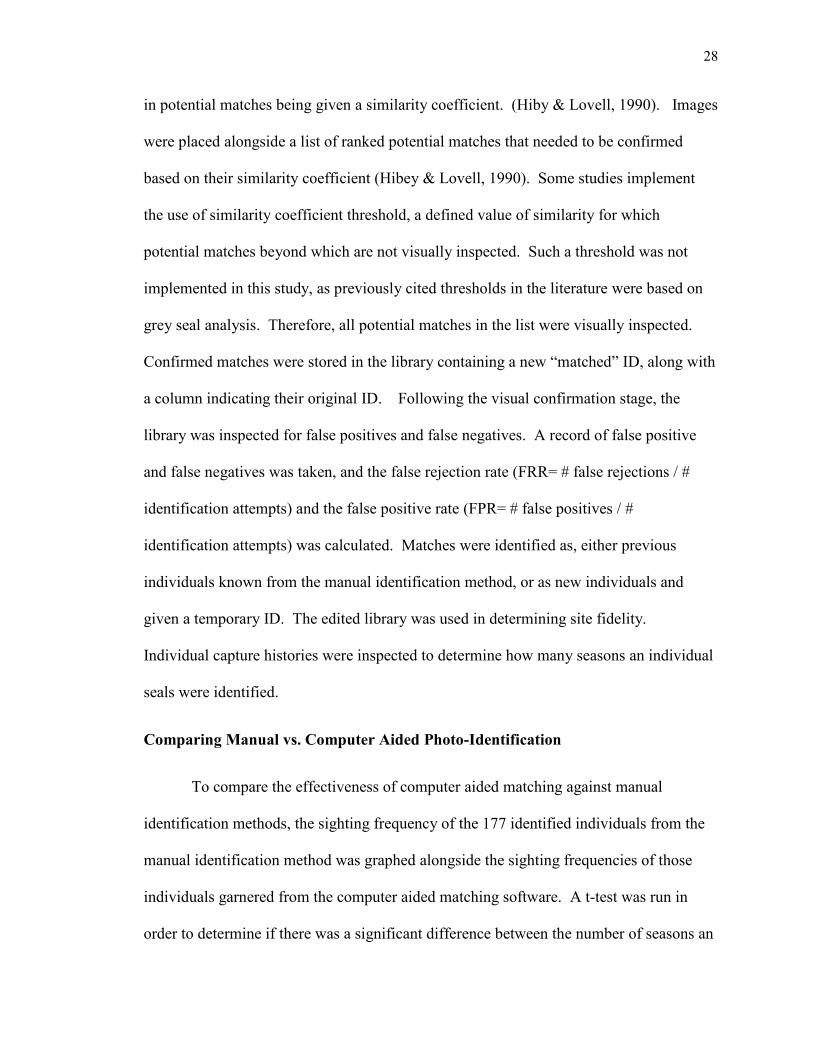
Figure 3. Example of manual matching color phase criteria……….................................62
Figure 4. Example of manual matching spot density criteria………………....................63
Figure 5. Example of manual matching spot complexity criteria…………..………........64
Figure 6. Example of placing points in computer aided pre-processing……....…………65
Figure 7. Example of superimposing a 3D image in computer aided pre-processing......66
Figure 8. Example of taking a pattern extract in computer aided matching software.......67
Figure 9. Example of Extract, De-trend and Wavelets…..………………………….......68
Figure 10. Photo of Grey Seal……………………………………………………………69
Figure 11. Percentage of Seals with Good Marks and Id’d……………………………...70
Figure 12. Comparison of the number of seasons seals identified…………………..…..71
Figure 13. Comparison of cumulative number of seals identified……………………….72
Figure 14. Comparison of re-sighting…………………………………………................73
Figure 15. Comparison of seasonal sighting frequency.....................................................74
Figure 16. Change in mean observation of harbor seal sighting 2011-2014...…………..75
Figure 17. Change in mean observation of harbor seal sighting 2007-2014…………….76
Figure 18.Harbor Seal Haul-out and Tides………………………………………………77
Figure 19. Monthly mean sightings per observation…………………………………….78
Figure 20. Human population density and harbor seal haul-out…………………………79
Figure 21. Bathymetry and harbor seal haul-out………………...…...………………….80
Figure 22. Wind speed and harbor seal haul-out………………………………………...81
Figure 23. Effect of photo-identification experience on manual matching success……..82
Figure 24. Long Island water quality issues………………………………………...…...83
Figure 25. Comparing manual and computer methods (accuracy and speed)…………...84

viii
LIST OF TABLES
Page
Table 1. Manual identification of individuals (Nov. 2010-Apr.14)...................................85
Table 2. Manual identification of individuals (Nov.2004- Apr.2014)…………...............86
Table 3. Computer aided sighting frequency of individuals within study period……….87
Table 4. Computer aided matching of harbor seals false negative errors……..…………88
Table 5: Computer aided matching of harbor seals false positive errors…………..…….90
Table 6: Comparing New identifications and Re-sighting data………………………….91
Table 7: Computer aided matching of grey seal false negative errors………..………….92

1
Chapter 1 Introduction
Studying the population dynamics, site utilization, and movement patterns of
animal populations requires that individuals be tracked both spatially and temporally
(Beaumont & Goold, 2007). This can be an extremely difficult task, especially for cryptic
species, including marine mammals. Challenges in studying marine mammals relate to
access and scale. They live entirely (cetaceans and sirenians) or most of their lives in
water (pinnipeds) and inhabit large geographical areas (Boyd, Bowen & Iverson, 2010).
Pinnipeds are a unique case in that although they spend a large portion of their lives in
water, not visible to us, they also regularly haul-out on land. Such haul-out locations
provide researchers opportunities to analyze seal behavior and population parameters.
North Atlantic Harbor Seal
This study focused on harbor seals, the most widespread of the pinniped species.
Harbor seals are found in all near shore waters of the North Atlantic Ocean, from about
30°N to 80°N (Katona, Rough & Richardson, 1993). The North Atlantic Stock is further
differentiated into the Western North Atlantic (WNA) and Eastern North Atlantic Stocks
(ENA) (Waring et al., 2010). While the geographic boundaries dividing the eastern and
western North Atlantic populations are undetermined, Stanley et al. (1996) found that
WNA and ENA harbor seals were highly differentiated based on differences in
mitochondrial DNA sequences. In the Western North Atlantic, harbor seals are found
from Eastern Canada to New Jersey (Katona et al., 1993). Harbor seals are considered
non-migratory species, although they do display seasonal movements related to breeding,
molting and foraging patterns (Waring et al., 2010).

2
Harbor seals can inhabit northern coastal waters of Maine and south-east Canada
year round. However, some harbor seals display seasonal migrations patterns, traveling
south in the fall-winter months to southern New England, New York and New Jersey. In
these warmer waters, spanning, harbor seals are seasonal inhabitants, occupying coastal
waters from September through May (Waring et al., 2006). A reverse northern
movement is apparent, prior to the pupping season, in May and June, with seals traveling
back north to Northern New England and Canada (Fig.1) Pupping occurs in summer, and
molting occurs in early fall in these more northern locations (Waring et al., 2010).
Throughout this seasonal migration, harbor seals regularly haul out, making them
accessible to researchers.
Harbor Seal Haul-Out Behavior
Pinnipeds haul out for a variety of reasons including resting, rearing and nursing
pups, thermoregulation, avoiding predators, and molting (Watts, 1992). Haul out sites
have been shown to be tremendously important. For example, McConelll et al. (1999)
determined that grey seals spend a significant amount of time (40%) around specific haul
out sites, which were often more than 50km away from foraging sites. Some adult grey
seals have been monitored traveling over 100km between haul out sites (McConnell et
al., 1999). Such high travel costs and reduced foraging opportunities indicate that the
benefits of hauling out are substantial and that haul-out site selection is extremely
important to overall fitness. Seals spend approximately half of their time hauled out on
land. A seals’ energy budget while hauled out is dominated by resting and scanning
behaviors. Harbor seals, like other phocids, can achieve low wave sleep while
submerged but can only achieve rapid eye movement sleep while at the surface of the

3
water or hauled out (Ridgeway et al., 1978; Da Silva & Terhune, 1988). Thus, haul out
sites are important for adequate rest; however, while hauled, seals must also be aware of
their surroundings and exposure to potential threats. As such, another common haul out
behavior is scanning. Scanning is typically defined by an increase in visual field; it is
often categorized by a seal raising its head from the resting position, moving its head
horizontally for a time and returning its head to the resting position (Terhune & Brillant,
1996). Resting and scanning behaviors are incompatible, and animals must balance the
need for rest with the need to be alert to potential threats. One possible explanation for
how seals reconcile these demands is by hauling out in groups as an anti-predator
strategy.
When harbor seals are hauled out, they form unstable groups, which are not
thought to driven by social behaviors (Da Silva & Terhue, 1988; Godsell, 1987). Early
hypotheses considered that largely solitary seals formed haul out aggregations as a
response to a shortage of suitable space available or haul-out sites. However, groups
often arise even when there appears to be ample, suitable haul-out sites and space. It has
been determined that, similar to the behavior in flocking birds, as seal group size
increases, individuals spend less time scanning and more time resting (Terhune, 1985; Da
Silva & Terhune, 1988). While individual vigilance decreases, the vigilance of the group
is increased, and seals are alerted to potential threats simply by other individuals flushing
the haul-out site. This differs from anti-predator strategies in stable groups formed by
social animals such as meerkats, Suricata suticata, where scanning behavior is reduced
for all but a few individuals who actively alert other members of the danger (Turnhue &
Brillant, 1996). This is termed the ‘watchman’s song hypothesis’. There has been no

4
evidence to indicate that harbor seals coordinate their levels of vigilance, as such
coordination would be difficult considering these are non-social groups without
permanent members (Terhune & Brillant, 1996; Wickler, 1985). Additionally, seals near
the periphery display higher levels of vigilance than seals at the center, likely because
animals residing near the periphery have a higher chance of being preyed upon and must
remain more vigilant (Terhune & Brillant, 1996). Harbor seals were also determined to
be more vigilant when they first arrived at the site, often utilizing the only available space
at the periphery of the aggregation. Therefore, increased vigilance near the periphery
may be related to increase predation risk and simply being a new comer to the haul-out
site (Terhune & Brillant, 1996). The spacing and orientation of seals when hauled out
also indicates that haul out aggregations are a result of an anti-predator strategies. Seals
position themselves at least one body length apart from one another and orient toward the
water. This facilitates a quick escape, while avoiding collisions, in the event of a
disturbance (Terhune & Brillant, 1996).
As outlined above, there are numerous factors that can be attributed to harbor seal
haul-out behavior. Theoretically, harbor seals should spend the maximum amount of
time hauled out (Watts, 1992). Immersion is energetically costly, seals cannot rest and
must contest with wave energy when submerged. Seals are also at risk of being preyed
upon by aquatic predators when at sea. Additionally, it has been shown that peripheral
tissues of harbor seals do not metabolize appropriately at temperatures below 17°C.
Since the skin temperature while submerged is often close to ambient temperatures, that
are below 17°C, regular haul outs would be beneficial in maintaining adequate skin
health (Watts, 1992; Feltz & Fey, 1966). Considering the benefits of hauling out, it

5
would be reasonable to presume that harbor seals should spend all their time during the
day and enter the water at night to forage, when foraging efficiency is greatest (Watts,
1992). While harbor seals are generally nocturnal foragers, they do not remain hauled
throughout the daylight hours, and there is reason to believe that this is a result of
thermoregulatory behavior (Watts, 1992).
Pinnipeds are semi-aquatic marine mammals and therefore, need to reconcile the
demands both marine and terrestrial thermoregulatory needs. Water conducts heat 25x
more rapidly than air. In order to reduce heat loss while submerged, pinnipeds utilize a
layer of blubber which impedes heat flow. This insulating mechanism, although
productive while submerged, can be detrimental to seals when they are hauled out on
land, causing hyperthermia. Seals can only loose heat through areas with little no
blubber- largely the through the flippers and head. The only ways to lose heat in such
situations is for wet seals to lose heat through evaporative cooling or for dry or wet seals
to stay in in contact with cool substrate, losing heat through conduction (Watts, 1992). In
addition to the limitations regarding the dumping excess heat, seals are also at risk of
taking on too much heat. Depending on solar radiation, the pelage and skin can act as a
heat trap, with heat reflected by hairs and absorbed by darkly pigmented skin (Watts,
1992). Harbor seals are sensitive to overheating and may increase body temperature at
rates of 1°C per fifteen min and, therefore, avoid situations in which hauling out would
greatly increase core body temperature. The thermoregulatory mechanisms that allow
seals to maintain an aquatic existence preclude seals from spending too much time hauled
out for risk of hyperthermia. Thermal constraints may explain site specific differences in
daily haul-out time between sites as well seasonal changes in haul-out behavior.

6
Haul-out behavior is also dictated by life history events, including breeding.
Seasonal changes in haul-out behavior in response to breeding results in skewed
population haul out proportions. Just prior to giving birth, females will haul out in
anticipation of parturition. These haul-out sites, known as nursery sites, are ideal for new
born pups having gently sloping substrates and calm water. Mother-pup pairs constitute
the majority of animals at nursery sites (Kovacs et al., 1990). Three lactation strategies
have been suggested for three pinniped families. Phocids generally build up fat reserves
so they can fast during lactation, providing pups with a high fat content milk over a short
period of time. Otarids have an extended period of lactation, providing milk with lower
fat content and alternating between lactating and foraging. The Odobenidae have an
extended period of lactation, and the pup accompanies the female while foraging, so
suckling and feeding can occur at once. Harbor seals seem to have a strategy in between
that of phocids and otarids. Studies have shown that in the early stages of caring for their
pup, females will spend a larger amount of time hauled out in order to lactate, which
often results in unequal sex ratio of hauled out adults (Godsell, 1988). That being said,
there is considerable evidence that female harbor seals spend a significant amount of time
foraging during the later stages of the maternal care period (Thomspon et al., 1996).
There is also evidence that pups may accompany females on foraging trips like the
odobenidae (Thompson et al., 1996). These foraging trips are often shorter and occur
within a smaller range compared to trips that are not associated females caring for pups.
A final variable that influeces female haul-out is the level of stored fat reserved prior to
giving birth. Larger females can rely on stored fast reserves and spend less time
foraging.

7
While females are spending much of their time hauled out caring for pups, male
behavior during the breeding season also influences the proportion of the population that
is hauled out. About half of pinniped specie are land breeding species. Large bodies and
limited mobility on land predispose pinnipeds to mating strategies in which males
maximize reproductive success by defending territories (and the resources needed by
females, e.g. pupping sites) or defending females. The remaining half of all pinniped
species, including harbor seals, are aquatic breeding pinnipeds. Reproductive strategies
utilized in land breeding species, including territorial defense, and female defense are not
successful among aquatic breeding species, as pinnipeds have greater mobility in water,
and females are widely dispersed. Therefore, divergent strategies including common
lekking (a strategy in which males gather perform competitive displays), roving (a
strategy in which males roam looking for receptive females), and defending territories
(e.g. defending foraging corridors) have been suggested as possible strategies utilized by
aquatic breeding species (Boness et al., 2006). All three strategies have been observed in
harbor seals, with lekking identified as the most prominent strategy observed.
Males have been shown to spend considerable time around nursery sites and
traffic corridors towards the end of the lactation period. Once the female has weaned her
pup, she will enter estrus. During this time, males gather, emit acoustical underwater
displays and display male-male competitive behaviors near these female ‘hot spots’.
Such behavior is similar to lekking behaviors in other species such as birds, in which
males aggregate and display, which results in some level of female choice (Hayes et al.,
2004). Female choice is also thought to be a factor, evidenced by the fact that males
patrolling areas closest nursery sites do not sire more offspring compared to those

8
patrolling areas farther from nursery sites (Boness et al., 2006). Changes in behavior
during the breeding season substantially alter haul-out behavior and must be considered
when determining population parameters based on haul-out surveys.
While the general explanations for haul-out behavior are well established, the
mechanisms driving haul-out site selection are less certain. The common variables that
have been proposed as influencing site selection include, tidal conditions, time of day,
distance to prey, protection from wind, and distance from disturbance (Montgomery,
Hoef, & Boveng, 2007). These variables vary both spatially and temporally. The two
factors that have most commonly been cited across studies as significantly affecting haul
out behavior are tidal conditions and disturbance. Seals tend to haul out at low tide and at
sites that are far from potential disturbances (Nordstrom, 2002). Therefore, different
environmental conditions will result in differing haul-out behavior between populations
of seals, and seasonal changes in environmental conditions may influence the haul-out
behavior within a population of seals. Such conditions must be taken into consideration
when designing surveys and analyzing findings.
The choice of haul-out site is fundamental to survival. The use of geospatial
modeling has greatly increased our understanding of what environmental factors drive
haul-out site choice and how habitat selection varies spatially (Montgomery et al., 2007).
Determining the ideal conditions for specific populations can aid in determining what
ideal haul-out proportions of a population are, and in turn, increase the accuracy of
population studies and aid in management decisions (Simpkins et al., 2003). Harbor
seals are the most widely distributed of the pinniped species, occupying a variety of
habitats, which allows for the comparison of site choice between different habitats.

9
Particularly important from a management perspective is the determination of site fidelity
among populations of pinnipeds.
Site Fidelity in Harbor Seals and Management Implications
Site fidelity, that is the return of an animal to a previously utilized location, is an
important component of animal behavior and can result from social interactions,
territorialism, and/or the efficient exploitation of scattered resources (Giuggioli &
Bartumeus, 2012). It is often, but not necessarily, tied to breeding behavior. Site fidelity
is also an example of an animals’ efficient exploitation of heterogeneous landscape,
taking advantage of scattered resources, be it food, mates and/or protection (Giuggioli &
Bartumeus, 2012). Studying site fidelity allows us to better understand the underlying
behavioral mechanisms at play that dictate site choice.
Site fidelity related to specific haul-out locations has been identified across
multiple pinniped species, including harbor seals (Hoezel, 2009). In harbor seals, site
fidelity is most commonly associated with breeding and foraging behavior (Kelly et al.,
2010). Site fidelity as a result of breeding behavior was studied by Härkönen & Harding
(2001) by tracking freeze branded harbor seals pups in Sweden over 14 years. They
determined that none of the 164 pups were found more than 32km of where they were
branded as pups. Site fidelity as a result of foraging behavior has been studied by Bjørge
et al., (1995) in which 13 harbor seals were tracked in Norway using radio VHF
telemetry during the summer season, and they determined that, while individual seals
utilized different types of foraging habitat, all individuals repeatedly used the same
foraging location throughout the season.

10
Sustained patterns of site use have various consequences for management. First,
monitoring of anthropogenic disturbances is necessary to maintain healthy populations.
Harbor seals have been shown to exhibit varying responses to anthropogenic disturbance,
including temporary abandonment of haul-out sites, permanent abandonment of haul-out
sites, and habituation (Grigg et al., 2012). Temporary abandonment of haul-out site is
commonly associated with pedestrian boat and beach traffic, as well as a result of eco-
tours. Henry & Hammill (2001) measured harbor seal responses to the presence of power
boats, sailboats and kayaks in the St. Lawrence estuary and found that the most common
cause of abandonment was kayak disturbance. While kayaking is largely considered a
low impact activity, the authors theorized that because kayakers had quiet approaches,
seals were startled by the sudden close proximity of kayaks, which caused the seals to
flush to the haul-out. Alert behavior, including increased time scanning, also increased in
response to levels of disturbance, which increases energy demands and may decrease
overall fitness Seal behavior varied over seasons, with seals being less likely to be
disturbed and enter the water during the molting season. Continued use and haul-out
numbers throughout the year suggest that the site is only temporarily abandoned in times
of high disturbance (Henry & Hammill, 2001). Other populations of harbor seals have
permanently abandoned previously utilized haul-out sites in response to human
disturbance. For instance, Becker, Press & Allen (2011) reported data that helps to
explain the long term spatial shifts in haul-out harbor seal pupping in response to
shellfish aquaculture operations in north-central California. The study showed that
continuous disturbance from anthropogenic sources, such as aquaculture activities, differs
from discrete forms of human disturbances, such as hikers or kayakers, and can result in

11
permanent abandonment of haul-out sites. Alternatively, some harbor seal populations
appear to show little behavioral changes in response to high levels of anthropogenic
disturbance. For example, harbor seals in San Francisco Bay have demonstrated high
levels of habituation to human disturbance, continuing to utilize foraging and haul-out
locations heavily influenced by recreational use, boating and fishing activities (Grigg et
al., 2012). Such overlap between humans and seal populations is likely to increase in the
future. If seals do not find suitable habitat, they could be at risk. In this case, the
development of a protected area may be necessary.
A second management implication as a result of seals displaying site fidelity deals
with environmental concerns. First, it is necessary to monitor of disease. Disease
outbreaks, including those of phocine distemper virus (PDV), can result in large scale
mortalities and be particularly devastating for populations displaying site fidelity over
small geographic areas (Olsen et al., 2013). For example, in 1988 an epidemic outbreak
of PDV claimed over 23,000 European harbor seals, nearly 60% of the North Seal harbor
seal population (Härkönen et al., 2006). In 2002, over 30,000 harbor seals died as a
result of being infected with a similar strain of morbillivirus identified as canine
disptemper virus (Härkönen et al., 2006). Harbor seal populations in this area have been
shown to display season site fidelity, relating to breeding behavior, particularly in the
summer months. Populations as a result are genetically distinct despite relatively close
geographic location. However, outside of the breeding season, seals expand their home
range and may interact with other populations (Olsen et al., 2013). It is thought that this
is how the phocine distempter virus was so devastating to localized populations but also
was transferred between distinct populations. Likewise, animals that display site fidelity

12
are also at risk for other environmental stressors including decreases in water quality,
decreases in prey availability, and increased presence of contaminants, including
organochlorines, PCBs, heavy metals and harmful algal blooms.
Lastly, site fidelity has been shown to be correlated with the genetic isolation of
seal populations. Seals aggregate in haul-out groups along the coast. The absence of
physical barriers between these aggregations and given that seals have been documented
travel far distances, it was originally presumed that there was genetic interchange
between these populations. However, genetic analysis revealed that increased geographic
distance was correlated with increase genetic differentiation (Stanley et al., 1996). These
findings could not be explained by distance alone, as seals were shown to be capable of
migrating at greater distances than those which separated populations. Therefore, it was
presumed that a behavioral mechanism must be at play to hamper gene flow, such as a
specific form of site fidelity, called philopatry, in which seals return to their natal site to
breed (Härkönen et al., 2006). In such instances these populations should be treated as
separate ecological stocks (Karlsson et al., 2005). In order to determine a population’s
spatial use patterns, and if populations display site fidelity, individuals must be tracked
over relevant spatial and temporal scales.
Photo-identification based Capture Mark Recapture
In order to determine the importance of specific haul out locations and the
possibility of site fidelity, individual seals must be identified over multiple seasons. The
inability to capture and follow large numbers of seals in the wild has been a significant
hindrance to furthering our understanding of pinniped species (Loughlin, 2010). It is only
recently that we have expanded research beyond focusing on dead specimens to include

13
animals that have been captured, marked and followed – a method coined Capture-Mark-
Recapture (CMR) (Loughlin et al., 2010). Previously utilized CMR methods have relied
on manually capturing and artificially marking animals via hot iron branding, freeze
branding and/or flipper tagging (Beaumont & Goold, 2007). Though efficiently utilized,
tags are costly and prone to lack of permanence over time (Arntezen et al., 2004). Most
importantly, these methods are invasive and result in stress to the animal, as well as
potential injury to researchers (Beaumont & Goold, 2007). In response to growing
concerns over the associated negative impact of physical CMR studies, researchers
sought less invasive marking techniques.
Identifying animals based on natural markings provides a feasible alternative to
physical tags. Advances in camera equipment and technology has allowed for a far less
invasive method of CMR involving photo-identification based capture-mark-recapture
(PMR) to be successfully utilized (Hastings, Hiby, & Small, 2008). Photo-ID based
Capture-Mark-Recapture (PMR) relies on re-sighting of animals with naturally occurring
markings to determine population parameters, including movement patterns, site fidelity,
and populations size (Karlsson et al., 2005). Natural markings on individuals are
“captured” photographically and stored in a digital catalogue. Individuals recaptured
later can be matched with earlier photos of that animal based on its’ unique
characteristics, creating a unique capture history for that individual (Speed, Meekan, &
Bradshaw, 2007). The use of photo-identification based on natural marking provides
many advantages.
Photo-identification makes it possible to identify individuals over multiple years.
In most cases, markings are stable over time, which nearly eliminates the risk of ‘tag’

14
loss prevalent in traditional CMR studies (Beaumont & Goold, 2007). For example,
harbor seals display unique patterns of spots and rings overlain on contrasting light and
dark pelage which have been shown to be stable over time (Yochem et al., 1990).
Natural marking also tend to be universal within a species and allow researchers to
“capture” a far greater number of animals than traditional tagging methods
(Arzoumanian, Holmberg & Norman, 2005). The use of photo-identification is also very
cost effective, relying solely on the use of high quality photographic materials and allows
researchers to “capture” many animals at once (Beaumont & Goold, 2007). The use of
photo-identification based on natural markings is the most appropriate choice in
circumstances where physical capture is difficult or impossible. It also may be the only
appropriate choice when dealing with endangered species, in order to minimize potential
disturbance. (Stevick et al., 2001).
For these reasons, photo-identification has become the leading method utilized in
wildlife tagging studies. Photographic methodologies can be broken down into two
categories, active and passive, based on the level of potential disturbance to the animal
(Sears et al., 1990). Passive methods include, aerial surveys (e.g. whales, Sears et al.,
1990) and infrared cameras, as they are unlikely to disturb target individuals (e.g.
bobcats, Heilbrun et al., 2003). Active methods include physically approaching an
animal on land or in a boat in order to take a photograph, as they are more likely to cause
potential disturbance of target individuals (Gilkinson et al., 2007). Pinniped photo-
identification, utilized in the present study, is largely a passive approach, as it occurs on
the main beach while seals are hauled out on nearby sand banks. Surveying from an
adequate distance from the sandbar, rarely results in disturbance of seals. However, large

15
and vociferous crowds gathered during seal walks do have the potential to alter seal
behavior. Both passive and active photo-identification methods require that images are
stored in a library to later be visually matched and to develop individual capture histories.
Manual Photo-identification Techniques
The most common method of photo-identification involves manually matching
every image in the library, unassisted by computer matching software (although images
may be inspected using a computer). Advantage to manual matching methods include
minimal cost and minimal training of photo analysts. However, a certain amount of time
may be required for photo analysts to gain familiarity with the population in order to
avoid errors in matching. Manual matching is ideal for small (<200) to medium (<850)
catalogues (Hammond, Mizaroch & Donovan, 1990). However, while it is possible to
manage small databases of images, the task of manually matching individuals becomes
increasingly time consuming and error prone as library catalogues grow (Arntzen et al.,
2004). In response, many photographic studies add additional steps to the pre-sorting of
images, in which images are given alphanumeric names according to dates of capture and
categorize individuals based on physical appearance using keywords to aid in the
matching process. For example, harbor seals may be named based on their sighting date
and keywords associated color phase, spot density and/or spot complexity (ex: unnamed-
2011-02-01A “color phase=dark”). In this way when that individual is compared to other
individuals in the catalogue the search can be narrowed down to other individuals that
have similar keywords which may reduce matching effort. This additional step
lengthens the already tedious process of manual identification. Eventually, the sheer size
of the database makes it nearly impossible to manage manually, and many researches turn

16
to computer assisted, semi-automated matching software to save time, minimize effort
and cost, and increase accuracy.
Computer Aided Photo-Identification Techniques
Computer aided techniques are semi-automated in that they require manual
importing of photos, pre-processing of images, and visual confirmation of potential
matches by the photo-analyst. The part of the process that does not require manual input
is the batch compare stage, which expedites the matching process and leads to the
greatest potential benefit of computer aided techniques in terms of reduced matching
effort. Matching software can be categorized as either being metric or non-metric.
Metric based systems rely on metrical analyses of extracts taken from features such as a
dorsal fin, fluke patters, or pelage coloration (Adams et al., 2006). 2012). In contrast,
non-metric matching software use categorical descriptions of features to aid in the
matching process (e.g. Finbase using descriptions of dorsal fins). Such descriptive
features are stored in a database and can be used by the photo-analyst to aid in matching
individuals. Non-metric systems tend to be less dependent on photo quality, but they are
often criticized for being subjective, relying on photo analysts to input categorical data
(Adams et al., 2006). In both metric and non-metric systems there are three main phases.
First, photos are imported into the computer software. This may involve
digitizing, scanning, or simply downloading photos. Some photos may need to be
cropped or lightened to be useful in matching software. These steps require human input
as they are not automated. Next, in metric systems, an extract is taken to describe the
morphological features (e.g. scarring in manatees) or patterns of pigmentation (e.g.
pelage patterns in harbor seals). In non-metric systems, images are qualitatively

17
described by photo analysts (e.g. describing the position of notches in the dorsal fin of
dolphins).
Second, images are compared to all other images and ranked as potential matches.
In metric systems, this is accomplished through the use a pattern recognition algorithms.
In many cases, a similarity coefficient is determined to identify where in a list of potential
matches, true matches occur. Beyond the defined similarity coefficient, it is estimated
that no true matches will occur and such potential matches are disregarded. Both
matching algorithms and similarity coefficients differ between matching programs and
are largely species specific. Non-metric systems generate a list of potential matches
based on the number of similar categories and/or characteristics that two images share.
Finally, researchers manually make the final decision to verify or reject potential
matches. Ideally, the computer has facilitated the matching process by reducing the
amount of photos from the library that researchers need to visually inspect. For datasets
with known matches, efficiency and accuracy of the programs can be reported by where
the match was found relative to the similarity coefficient and number of false positive and
false negative errors.
Capture Mark Recapture Assumptions
In both manual and computer aided photo-identification studies, researchers must
take careful consideration of the assumption made by CMR studies, that all animals have
equal probability of being captured, marked, and later identified for each capture event.
To meet this assumption, all animals must have equal probability of both being sighted
and captured, and in the case of photographic based studies, being photographed.

18
This assumption is not always met. Researchers should be aware and report
instances in the study in which these conditions may not be met. Behaviorally, some
animals may be more difficult to photograph. Additionally, certain life history events
may dictate behaviors that preclude this assumption from being met. For example,
during harbor seals’ breeding season, there is a disproportionate number of females
hauled out while they are caring for pups. The distinctiveness of individual marks also
effects this assumption. Certain animals have more distinct marks than others and are
thus, more likely to be captured and recognized via photo-identification (Hammond,
Mizroch & Donavon, 1990). Harbor seal pelage is variable, with some individuals
displaying more unique characteristics.
Final factors that affect the likelihood that animals will have equal probability of
being captured are photo quality and measurability. If photo quality is poor there will a
lower detection rate. Photo quality is loosely defined by factors including clarity, focus,
resolution, background noise, contrast, and glare (Hammond 1986; Arzoumanian,
Holberg & Norman, 2005). Photo quality can only be minimally controlled for in the
natural environment. Since photographic quality is inextricably linked to the
distinctiveness of marks, as photo quality decreases, the distinctness of marks decreases
(Friday et al., 2000). Photo quality is often assessed as images are imported into
databases. While computer assisted matching programs are often very sensitive to
decreases in photo quality, manual identification is often still possible with low quality
photos. Despite the level of quality, researchers should report photo quality as it can lead
to errors or bias. The final factor to consider deals with measurability, in particular our
ability to identify a pattern that exists on a 3 dimensional animal from a photograph

19
(Gunnlaugsson & Sigurjoinsson, 1990). At any moment a camera is not perpendicular to
the animal, and patterns can be distorted (Speed, 2007). To minimize the risk of missing a
match due to measurability, photos are taken from multiple angles and and/or a
computerized system developed to superimpose a 3D surface model over the image is
utilized. The 3-D model approach was introduced in 1990 by Hiby & Lovell as a
method to photographically capture grey seals regardless of the seals’ orientation, which
can otherwise lead to sources of error in photographic studies.
Errors in Photo-Identification
In both manual and computer aided photo-identification, misidentification of
individuals is a major concern. Misidentification may include, matching two different
individuals as the same individual (“false positive”) or failing to match images as the
same individual (“false negative”) (Stevick et al., 2001). These two types of errors can
alter results differently. False positives (incorrectly matching two different individuals)
results in overestimations of survival and recapture rates, and underestimates population
size (Hammond, 1986). False negatives (failing to match two photographs of the same
individual) results in reduced survival and recapture rates and inflates population
estimations. In an effort to reduce errors, only high quality photographs are used,
matches are often confirmed by multiple people, catalogues of capture histories are
routinely edited, and matching sessions are kept short to avoid the fatigue of photo
analysts (Hammondm Mizroch & Donovan, 1990). Finding a method that reduces effort
is tremendously important. However, it remains uncertain as to whether manual or
computer aided techniques result in fewer photo-identification errors.

20
Comparing methods in terms of speed and accuracy can be very difficult.
Methods have variable steps that make comparisons difficult. Additionally, comparing
accuracy through the comparison of error rates between methods is difficult, as
estimating error rates can be extremely confusing, and researchers often differ in both
their definition of error and reporting of error rates. Errors have been reported various
ways including as a number of correct matches found within a specific similarity
coefficient threshold (Kelly, 2001), an error rate calculated by the number of incorrect
matches over the total number of matching attempts (Morrison et al., 2013), and the
number of incorrect possible matches that ranked higher than true matches (Hillman et
al., 2003). On occasion, studies also fail to report the total number of images included in
the catalogue, which makes interpreting error rates nearly impossible. All in all, reporting
of errors found in photo-identification studies is confusing and inconsistent.
In order to switch from a manual to computer aided photographic systems,
researchers should be confident that the process is likely to both increase accuracy and
speed. In marine mammal research, strides have been made to describe advantages and
disadvantaged photo-identification techniques. The largest advancements have occurred
in cetacean studies, many of which are now geared to specific species morphological and
pigmentation pattern traits, including notches in dolphin dorsal fins and notches as well
as patterns in humpback whale flukes (Loughlin et al., 2010). Advancements in
cetacean computer aided photographic identification have greatly reduced matching
efforts and enhanced the ability to track animals. There has been less focus of photo-
identification of pinnipeds due to the difficult nature of manually identifying individuals,

21
as well as the continued utilization of physical marks and tags. As a result, the
applicability of such methods to pinniped studies is far less certain.
Study Site and Objectives
Cupsogue Beach County Park, located on the south shore of eastern Long Island,
is part of Westhampton Beach (Figure 2). Westhampton beach is a barrier island along
the south shore of Long Island, NY, situated between Moriches and Shinnecock Inlet.
The barrier island is very vulnerable to beach erosion. Consequently, a number of beach
erosion control measures have been implemented under the supervision of the New York
Beach Erosion and Hurricane Protection project, including beach nourishment, groin
formation and dune construction (Bocamazo et al., 2011). Recreational use of the beach
is largely restricted to the summer months. Throughout the seal season (Sept-May)
harbor seals are the most abundant pinniped species in the study area. Less frequently
observed pinnipeds include grey seals, harp seals and hooded seals. Since monitoring
began following the enactment of the Marine Mammal Protection Act (1972), the number
of harbor seals in the study area has increased, as have localized strandings of harbor
seals in New York and New Jersey (Waring et al., 2010). There are no studies to date
that determine if Long Island harbor seals display site fidelity.
The determination of site fidelity as well as other population parameters is
extremely important for conservation policy. In the U.S. harbor seals are protected
under the Marine Mammal Protection Act (MMPA) (1972). The MMPA prohibits the
“take” of marine mammals, which includes the “hunting, killing, capturing or harassing”
of marine mammals. Certain exceptions are permitted under Section 101(a) and (b) to
allow for the takes associated with scientific research, public display, and incidental

22
commercial by-catch. The 1994 amendment to the MMPA requires regular stock
assessment reports, which include the evaluation of anthropogenic sources of mortality to
ensure that takes are below the recommended potential biological removal (PBR).
In U.S. waters, harbor seal takes are below PBR (Waring et al., 2010). The
greatest source of anthropogenic mortality is due to fishery by-catch, with the highest
mortality seen in juveniles. Herring purse seining, lobster traps, and anchored sink gill
net fisheries are the largest contributors to harbor seal by-catch. Fishery by-catch
accounts for 20% of the potential biological removal (PBR). While this level of removal
is above the 10% mortality goal of the MMPA, mitigation is not a deemed to be a priority
as the U.S. harbor seal population is increasing (Waring et al., 2010). Further
information regarding stock structure is needed to evaluate current, as well as future
anthropogenic threats, in particular the effects of ecotourism. The research proposed in
this study will aid scientists and managers in tracking individual seals and assessing
population trends. Future management should focus on determining the effects of
nonlethal disturbance due to local ecotourism, including seal walks and seal cruises that
occur throughout the Long Island seal season. Research was conducted under the
supervision of a local non-profit research and education group.
The Coastal Research and Education Society of Long Island (CRESLI), founded
in 1996, conducts research on cetaceans, pinnipeds, and sea turtles around Long Island.
CRESLI’s Seal Research Program helps to monitor seal populations, as well as to
conduct long term studies on seal behavior around Long Island. Seal surveys are
conducted using land platforms. By compiling these studies, scientists have documented
14 sites around Long Island that seals occupy. Monitoring of these sites as become an

23
integral part of long term studies. To aid in these studies, in 2009, Arthur H. Kopelman
president of CRESLI, began a large-scale photo identification based Capture-Mark-
Recapture (CMR) study to identify individual harbor seals hauled out at Cupsogue Beach
County Park, based on their natural pelage markings.
The goal of this study through the photographic identification of Long Island
harbor seals was to 1) determine if Long Island harbor seals display site fidelity and 2)
through the comparison of manual and computer matching photo-identification
techniques, determine the applicability of computer matching software to this and other
pinniped studies.

24
Chapter 2 Materials and Methods
Study Site and Data Collection
Harbor seals hauled out on tidally exposed sand bars and swimming in the area of
Cupsogue Beach County Park (40°46’ N 72°44’W) were photographed from land during
the months of November-April, from November 2010 through April 2014, during seal
walks. Disturbances were rare but, when they did occur, they were recorded. Over
20,000 photos of harbor seals have been captured, from land based surveys, using a
Nikon D600, which is a full frame camera (Nikon FX forma); Effective pixels = 24.3
million; images were taken in RAW format at 6,016 x 4,016 pixel dimensions. The lens
was a Sigma 150-500mm, VR, F5-6.3 lens.
Data Analysis for Manual Photo-identification of Harbor Seals
Photographs were catalogued using Adobe Photoshop. Photographs were given a
rating of 0-5, with five being the best quality photos. Criteria for photo quality included
resolution and focus, and highly ranked photos were of high resolution and sharp focus.
The rate of matching error has been shown to increase substantially with decreasing
photo quality; therefore, only photos with a rating of 5 were used for analysis (Stevick et
al., 2001).
A scheme to aid in the initial sorting of individuals was adopted based on
Crowley, Kelly & Daniel (1999). Each photograph was categorized by: color phase (3
phases), spot to background ratio (5 gradations) and spot complexity (3 gradations). The
color phases included, light (light background with dark spots), intermediate, and dark
(dark background with light spots) (Figure 3). The spot to background ratio ranged from

25
1-5, with 1 having the least spot density and 5 having the greatest spot density (Figure 4).
Spot complexity included, low, intermediate, and high; with low having the least
deviation from the simple oval spot and high characterized by the most deviation from
the simple oval spot (Figure 5) (Crowley, Kelly, & Daniel, 1999).
Following the initial sorting, individuals with noticeably distinct marks were
flagged. To determine distinctive markings, images were assessed very carefully,
beginning with the ventral surface, if available, followed by the neck and head regions.
Flagged photos were visually analyzed and either identified as a previously identified
individual or a new individual. When appropriate catalogue searches using criteria from
the initial sorting were implemented, previously identified individuals were noted, and
new individuals were given alphanumeric names designated by the date of capture.
Both previously identified individuals and newly identified individuals were
assigned an entry in the photo-id catalogue created using Excel. Information regarding
initial classification and sighting history was recorded for each individual. Additionally,
each entry was linked to a sheet containing photos of the individual from each capture
event and a red square indicating the area that the distinct marking used for identification
could be located. Next, photos were carefully inspected in order to ensure that neither
“false positives” nor “false negatives” were prevalent in the data set. In order to aid in
this process, individuals with markings that closely resembled an object were renamed to
reflect this resemblance. Previous names were kept in a column next to the new name in
the catalogue to ensure capture histories was not altered. If a false negative or false
positive match was found, it was corrected, and the capture histories were updated. Once
it was determined that there were no false positives or false negative matches, the number

26
of seasons for which an individual was captured was recorded. The four seasons were
defined as Nov. 2010- April 2011, Nov. 2011- April 2012, Nov. 2012- April 2013 and
Nov. 2013-April 2014. Additionally, photo records of lesser quality from six seasons
prior to the implementation of a new digital camera in Nov. 2010 were obtained and
analyzed to determine if individuals utilized the same haul-out beyond the scope of the
four year study period.
Finally, for all capture dates the number of seals with unique marks were recorded
as well as the number of seals previously identified. A percentage of seals with good
marks that were already previously identified was determined by the following equation
(# seals with good marks x (1/ID’d seals). The percentages were graphed over time to
determine if photo-identification efforts were improving towards the point at which all
seals with unique marks were identified. In other words was there a positive correlation
between time and percent of seals with unique marks that were identified. Lastly, an
ANOVA statistical test was run to determine if the percentage of seals with good marks,
that were previously identified, differed between years.
Data Analysis for Computer Aided Photo-Identification of Harbor Seals
Photos were run through a computer aided automated matching program initially
developed for grey seals (Hiby & Lovell 1990) (software developed by Conservation
Research Ltd; www.conservationresearch.co.uk). Again, only five star rated photos were
used for analysis. The program is designed to match distinct pelage patterns of seals by
superimposing a 3-dimensional body model over each image and extracting pattern
information (Hiby & Lovell, 1990). Utilizing a three dimensional model image allows

27
individuals to be identified regardless of the orientation of the animal at the time the
photo was taken (Hiby & Lovell, 1990).
Photos were first imported into the new sightings form, including the date the
photos were taken. Photos were set for extract of the head and neck region to ensure that,
regardless of whether the seal was hauled out or in the water, there would be a fair chance
of identifying it. To extract a pattern from an image, points were placed on each subject
at the nose and mid flipper. Following the setting of the initial points, “special points”
were placed for the “right flipper”, “left flipper”, “left ear”, and “right ear” (Figure 6).
Next, the margins of the body were determined by placing points along the upper and
lower margins of the body from the pelvis to the neck. An initial fit was created by
superimposing a 3D surface model on the image of the seal based upon the placed points
(Figure 7). The fit was adjusted to better suit the image as needed, and areas containing
features not belonging to the target subject were erased. Once an adequate extract was
determined, the pattern cell or identifying array (IA) was extracted and saved for
comparison (Figure 8). That pattern cell was displayed in a window containing three
images- the first being extracted from the image, the next being the de-trended version of
the extract, and the last being the wavelets decomposition of the extract (Figure 9) (Hibey
& Lovell, 1990).
Two comparison algorithms, the “n” and “c” algorithms, were used to compare
IAs of photographs. The two algorithms were complimentary to one another. The “n”
algorithm was most useful in dealing with obscured areas but less useful in dealing with
amorphous shapes. The “c” algorithm alternatively, was useful in dealing with
amorphous shapes and less useful in dealing with obscured areas. This process resulted
28
in potential matches being given a similarity coefficient. (Hiby & Lovell, 1990). Images
were placed alongside a list of ranked potential matches that needed to be confirmed
based on their similarity coefficient (Hibey & Lovell, 1990). Some studies implement
the use of similarity coefficient threshold, a defined value of similarity for which
potential matches beyond which are not visually inspected. Such a threshold was not
implemented in this study, as previously cited thresholds in the literature were based on
grey seal analysis. Therefore, all potential matches in the list were visually inspected.
Confirmed matches were stored in the library containing a new “matched” ID, along with
a column indicating their original ID. Following the visual confirmation stage, the
library was inspected for false positives and false negatives. A record of false positive
and false negatives was taken, and the false rejection rate (FRR= # false rejections / #
identification attempts) and the false positive rate (FPR= # false positives / #
identification attempts) was calculated. Matches were identified as, either previous
individuals known from the manual identification method, or as new individuals and
given a temporary ID. The edited library was used in determining site fidelity.
Individual capture histories were inspected to determine how many seasons an individual
seals were identified.
Comparing Manual vs. Computer Aided Photo-Identification
To compare the effectiveness of computer aided matching against manual
identification methods, the sighting frequency of the 177 identified individuals from the
manual identification method was graphed alongside the sighting frequencies of those
individuals garnered from the computer aided matching software. A t-test was run in
order to determine if there was a significant difference between the number of seasons an

29
individual was identified using the manual and computer aided methods. Additionally, a
table was created to determine the number of new individuals sighted each year, as well
as the number of individuals re-sighted each year for both manual and computer aided
matching methods. Two separate t-tests were conducted to determine if the number of
new sightings and the number of re-sightings differed between methods. (# seals with
good marks x (1/ID’d seals). The cumulative number of seals identified suing both
methods was also compared using a t-test. Finally, the number of cumulative number of
seals identified over one, two three and four seasons was compared using a t-test. The
comparison was largely limited to comparisons of accuracy, as the steps between
methods varied significantly, making time calculations difficult. Previous work on the
manual identification of harbor seals had already been initiated before the start of the
study, which also made comparing time, as well as error rates, between methods difficult.
General Population Statistics and Probability of Capture
In order to identify potential factors that may affect capture probability both
within a study season and between seasons a few variables were analyzed. First, an
ANOVA was run to determine if change in mean sighting per observation (2011-20114)
was significantly different between seasons. This was then expanded to include data
from 2007 and another ANOVA was run to determine if change in mean sighting per
observation differed between seasons form (2007-2014). Next, in order to determine the
effects of study design on the potential amount of individuals that could be captured, the
mean number of seals captured was graphed in relation to time that the first photo was
taken from low tide. Next, a correlation test was conducted to determine if time from low
tide was a significant factor in determining how many seals were captured. Following, a

30
closer analysis of monthly capture information was analyzed. An ANOVA was run to
determine the change in mean sightings per observation between months (averages from
2011-2014). Finally, it was important to determine if males and females differed in
their probability of capture. Ten individuals were of known sex. A t-test was used to
compare the seasonal sighting frequencies of the known males and females.
Spatial Analysis of Long Island Harbor Seal Haul-out Sites
The objective of the spatial analysis was to determine if Long Island Harbor seal
haul-out behavior was influenced by the ; 1) human population (as a proxy for
anthropogenic disturbance); 2) distance to water depths (20m; 30m; 40m; and 50m); and
3) wind speed. Determining what factors influence haul out site selection will aid in the
management of local seal populations. The overall goal was display to the haul-out data
alongside three rasters displaying, human population, bathymetry and wind speed. An
Ordinary Least squares (OLS) was then utilized to determine the relationship between
haul-out locations and the environmental variables.
Blind Study of Manual Matching Success of Harbor Seals
In order to test the ability of both naïve and trained observers to identify
individual seals, methods were adopted based on Patton & Jones (2008) which tested the
ability of trained and untrained observers to identify photographs of black rhinos. Four
types of identification photographs were chosen, a right and left head view and a right
and left flank view. There were 15 individuals in which were at least a right and left
flank view and/or a right a left head view i.e. 30 photos. Additional photos of those
individuals were added if additional views were available (i.e. if a right flank view was

31
available as well as a left and right head image view and /or if there were similar but not
the same identification photograph from the same perspective). Adding these additional
photos brought the total photo count to n=49.
A test was designed using Excel. Each sheet in the excel file corresponded to one
matching test. For each perspective (left head, right head, left flank and right flank),
there were at least eight individuals that had at least two photos from that perspective,
totaling 32 photos. Each image was presented along with the remaining seven in that
category and the duplicate match, with given instructions to place a star on the image that
represented the correct match. Instructions also indicated that there was a single match
for every test. This was done for all four views, totaling in 32 matching tests. Finally, an
additional eight tests were compiled including all four views in which matches were
randomly selected from previous trials. This brought the total number of tests to n=40.
The Excel file was sent to volunteer participants with various degrees of photo-
identification experience. Upon sending their results, volunteers were also asked to
provide their age and level of photo-identification experience, if applicable. Participants
that indicated they had previous photo-identification were also asked to provide
information regarding the duration of their experience and for what species.
Submissions were graded based on the number of correct matches and applicants
with photo-identification experience responses were compared against those responses
from participants without photo-identification experience. A t-test was used to determine
if there was a significant difference between trained and untrained observers. Results
were also graphed to assess possible correlations between level of photo-identification
experience and manual matching success.

32
Computer Aided Matching of Grey Seals
In order to determine the efficacy of the computer program to match different
species of seals, grey seal photos were obtained from Shoals Marine Lab of seals of grey
seal haul-outs on Duck Island, ME (permit # NMFS LOC 16260-01) (Fig.10). In total,
514 photos were imported into the matching software from the 2011 and 2012 field
seasons combined. Images were processed in the same manner as harbor seals were in
the previous trial. The final catalogue was compared to an ID catalogue provided by
Shoals Marine Lab of previously identified seals. Finally, false negative errors and false
positive errors were recorded. The false negative rate was defined as the (# of false
negative matches/# of potential correct matches). The false positive rate was defined as
the (# of false positive matches/# of potential correct matches).
Comparing Error Rates of Harbor Seals and Grey Seals
To compare the false negative rates of harbor seals and grey seals a hypothesis
test to determine the difference in proportions was calculated. The null hypothesis was
that the false negative rate for harbor seals ≥ the false negative rate for grey seals. The
alternative hypothesis was that the false negative rate for harbor seals < the false negative
rate of harbor seals. Similarity, to compare the false positive rates of harbor seals and
grey seals another hypothesis tests to determine the difference in proportion was
calculated. The null hypothesis was that the false positive rate for harbor seals ≥ the false
positive rate for grey seals. The alternative hypothesis was that the false negative rate for
harbor seals < the false negative rate of harbor seals.

33
Chapter 3 Results
Manual Photo-Identification of Harbor Seals and Site Fidelity Determination
Results from the manual identification indicate that some individuals display site
fidelity, in that they return to the same haul-out location over multiple seasons (Table 1).
Eight individuals were observed during all four seasons of the study. Additionally, when
data were expanded to include photo-identification work beyond the scope of this study,
four individuals were sighted up to eight seasons (Table 2). In total, 202 individuals were
noted to have an identifiable marking. Eight were seen over four seasons, four over three
seasons, thirteen over two seasons and 177 over a single season. Error rates were
difficult to determine, as the photo-identification work began prior to the start of this
study and error rates were not previously recorded. Finally, the percentage of seals with
unique marks that had been previously identified did not significantly differ between
season (p=0.15). There was no correlation between time and percentage of seals with
good marks that had been identified (Fig.11).
Computer Aided Photo-Identification of Harbor Seals and Site Fidelity
Determination
Computer-Aided results indicated that some individuals display site fidelity. A
total of 229 individuals were identified, with nine being observed over four seasons, four
noted over three seasons, sixteen seen over two seasons and 200 observed over one
season (Table 3).
Both false negatives and false positives identifications occurred using the
computer aided method. False negatives occurred when groups of successfully paired
individuals failed to match to another group of successfully paired individuals and/or

34
when a single individual failed to successfully match another individual (Table 4). The
False negative rate (# false negative matches/ # of potential matches) was 21.4%
(233/1041). The majority of false negatives occurred when images of the same
individuals failed to successfully match to one another, resulting in an individual having
two or more unique ID’s. False negatives also occurred resulting in individuals having
2-12 unique ID’s. Two individuals, hammerhead and horseshoe, had over 20 unique ID’s
as a result of false negative matches. False Positives were far less common than false
negatives, with only 6 instances occurring in the sample, corresponding to a false positive
error rate (# false positive matches/ # potential matches) of 0.5% (6/1041) (Table 5).
Comparing Manual vs. Computer Aided Photo-Identification
In comparing manual and computer aided results it is important to consider both
accuracy and speed. Computer aided identification increased accuracy. The number of
seasons that an individual was sighted differed significantly between methods, with
computer methods on average capturing individuals over more seasons (p=0.037) (Fig.
12). Overall, the computer aided matching schemed resulted in a greater cumulative
number of individuals identified although this finding was not significant (p=0.328)
(Figure 13). Computer methods also resulted in a greater number of new identifications,
which was also not significant (p=0.411) (Table 6). In addition, the computer aided
methodology resulted in a greater number of re-sightings across all four years. However,
this finding was also not significant (p=0.347) (Fig. 14). In comparing sighting
frequency, the manual method of identification, with exception of individuals sighted
over three seasons which was equal for both methods, was less than the computer
methods but, the difference was not significant (p=0.460) (Fig. 15). There were 10

35
individuals for which sex could be identified. In all cases, the number of seasons
observed for these ten individuals did not differ between manual and computer methods.
A t-test indicated that there was not a significant difference between the sex and the
number of seasons sighted (p=0.293).
Comparing differences in speed was a much more difficult task, as steps of both
methodologies were often too different to quantitatively compare. Where the computer
aided method had the greatest potential to decrease effort in the matching phase, this
study did not as a similarity coefficient was not invoked to minimize effort in matching.
The suggested coefficient proposed by Hiby & Lovell (1990) was not invoked, because
the coefficient was determined for grey seals and not largely tested for harbor seals. In
addition, accuracy of identification was important in that the study was of greater
importance in order to determining whether the population displayed site fidelity and if
computer aided methods were reliable method photo-identification.
Photo-identification error rates are also an important comparison to make between
methods. While, photo-identification errors were recorded for computer aided methods
and to an extent for manual methods a valuable comparison could not be made, because
the manual photo-identification had begun prior to the start of this study and previous
errors were not accounted for.
General Population Statistics and Capture Probability
The mean number of seals per observation differed significantly between seasons
within the study period (p=0.01), with 2011 having the greatest observations (>70
individuals) and trending down to 2012-2013 having on average between 40-50

36
individuals (Fig. 16). However, when mean number of seals per observation was
analyzed from 2007-2014 it again was significantly different between years, but the trend
was increasing across years (p=0.004) (Fig. 17). An increasing population is consistent
with the general increase in population size in the North West stock as a whole (Waring
et al., 2007). Time in which the first photo was taken from low tide was not significantly
correlated with mean number of seals observed per observation (r=0.03) (Fig. 18). The
average number seals observed per month differed significantly, with March having the
greatest number of seals observed (p<0.01) (Fig. 19). Sex was not deemed to be a
significant factor in determining seasonal sighting frequencies (p=0.7).
Spatial Analysis of LI Harbor Seal Haul-out
Preliminary spatial analysis of the 14 known harbor seal haul out locations around
Long Island analyzed the relationship between harbor seal haul-out locations, human
population density, bathymetry, and wind speed. The only significant factor in the
analysis was human population. There was a significant negative relationship between
haul-out sites and human population (p=0.015) (Fig.20). Additionally, the directional
distribution of haul-outs showed that haul-out locations were focused in the northeast
coast of Long Island (Fig.20). Distance to water depths was not a significant factor in
determining haul-out site utilization (20m p=0.17; 30m p=0.06; 40m p=0.25; 50m p=
0.14) (Fig.21). However, it should be noted that distance to 30m depth was just shy of
being significant (p=0.06). Wind speed was not a significant factor in determining haul-
out site utilization (p=0.32) (Fig. 22).

37
Blind Study Manual Matching Success of Harbor Seals
Ten participants partook in the study, five having no photo-identification
experience, and five having varying degrees of photo-identification experience ranging
from 3 month internships to 30+ years of experience with photo-identification of harbor
seals. T-test results indicated that there was so significant difference between those who
had photo-identification experience and those who did not (p=0.7). There was a slight
negative relationship between photo-identification experience and percent correct
matches (r=-0.1) (Fig. 23). The highest scoring individual did have the most extensive
photo-identification experience.
Computer Aided Identification of Grey Seals
Upon comparing the library catalogue to an available photo-identification manual,
there were 43 individuals associated with false negative errors. The false negative rate (#
false negative matches/ # potential matches) was 17.89% (92/514). 47% of such error
where a result of failing to match single photos of individuals to each other. Further, of
such errors, 58% were the results of failing to match a photos of a right side of an animal
to a photos of a left side of an animal. The remaining false errors occurred from failing
to match a group of correctly matched individuals to another group of correctly matched
individuals and/or a single photo. In such cases, all errors resulted from failing to match
a group of right side photos to a group or single photo of the left side photos or vice
versa. The remaining errors occurred from a mix of falsely matched left and right side
images (e.g. a group of correctly matched left images and a single left image). There
were no cases of false positives in the dataset.

38
Comparing Error Rates of Harbor and Grey Seals
The hypothesis test to compare difference in proportions of false negative rates
between harbor seals and grey seals was not significant (p=0.9), indicating that grey seal
false negative errors rates were not greater than harbor seal false negative errors. The
hypothesis test to compare differences in proportions of false positives between harbor
and grey seals was also not significant (p=0.7), indicating that grey seal false positive
error rates were not greater than harbor seal false positive rates.

39
Chapter 4 Discussion
Site Fidelity of Long Island Harbor Seals
To be able to understanding the dynamics of populations, individuals must be
identified over various temporal and spatial scales. Following individual animals allows
researchers to determine vital rates, quantify fitness, and understand behavioral patterns
(Bolger et al., 2012). Understanding population dynamics is also vitally important from a
management perspective, as there are often legal requirements that require marine
mammal populations to be monitored and if necessary, given additional protection
(Cunningham et al., 2008). Traditionally, pinnipeds have been monitored by physically
being captured and placing a visual mark on them. Animals were then monitored via a
robust mark-recapture scheme. However, due to the highly invasive nature of these
methods, potential risk to both researchers and animals, as well as high cost, such mark-
recapture methods have been replaced by photographic mark recapture (PMR) methods
based on naturally occurring markings on animals (Bolger et al., 2012). One area in
which PMR has been applied to pinniped studies is through the identification of site
fidelity.
Site fidelity, defined broadly as the return of an animal to an area previously
utilized, has been documented among harbor seals. Seals spend approximately half of
their time hauled out on land. Site fidelity in to specific haul-out in response to breeding
and foraging behavior has been cited in harbor seals. Harbor seals are coastal animals
often remaining within 25km of the coast, providing opportunities to protect important
terrestrial haul-outs as well a marine foraging areas (Cunningham et al., 2008). In
addition, evidence that seals consistently utilize a network of specific haul-outs

40
providessupport for the creation of a network of protected areas (Cunningham et al.,
208). Also important to consider is the seasonal changes in haul-out behavior, which
coincide with life cycle events, including breeding and molting, which may change
management needs. Both the manual method of photo-identification, as well as the
computer aided method of photo-identification suggests that some harbor seals return
over multiple seasons to the same haul-out location in Cuspogue Beach County Park,
Long Island, NY. At least 8 seals were observed over the entire study period. While the
photo-identification study spanned only four seasons (2011-2014), when new camera
equipment greatly enhanced photo-quality, inclusion of photos from 10 seasons indicated
that least 4 individuals have returned to Cupsogue Beach County Beach for 8 seasons.
The return of harbor seals to specific haul out locations over multiple years
reflects the importance of haul-out behavior and haul out site selection in maintaining
overall fitness. Knowledge of what environmental variables drive haul-out site selection
and habitat use in marine mammals is an important component in the development of
management and conservation strategies (Grigg et al., 2012). Site fidelity in harbor seals
has most commonly been associated with specific life history events, including breeding
behavior. Many populations of harbor seals display a specific type of site fidelity, termed
natal philopatry, in which seals return to their natal site to breed (Kelley et al., 2010).
Interestingly, in this study, seals displayed site fidelity in the absence of any major life
history events. Harbor seals inhabit coastal areas of Long Island form November- April,
just following the molting season and just prior to the breeding season. The absence of
any major life history event, indicates that there is some other factor that is driving haul-
out site fidelity in this population. Environmental variables which have commonly been

41
cited as influencing haul out site selection include, access to prey, access to deep water,
protection from wind, and distance from relative disturbance (Montgomery, Hoef, &
Boveng, 2007). Being able to determine what factors are important in determining haul-
out site selection, and site fidelity, will aid in the designation of appropriate management
schemes for the population.
Spatial analysis of the 14 known harbor seal haul out locations around Long
Island determined that the only significant factor influencing harbor seal haul-out site
selection was human population. There was a significant negative relationship between
haul-out sites and human population. Additionally, the directional distribution of haul-
outs showed that haul-out locations were focused in the northeast coast of Long Island.
Distance to water depths and wind speed were not a significant factors in determining
haul-out site utilization.
It is common across studies that harbor seals tend to haul-out in aggregations away from
human communities (Montgomery et al., 2007). Similar results were found in my project
as haul-out locations were negatively related to human population. The spatial
distribution of haul-outs indicated that seal haul-outs were focused in the northeast of
Long Island. This is consistent with human population trends. Western Long Island is
more densely populated than eastern Long Island. I would hypothesize that the north
shore was utilized more than the south shore, as the north shore has less wave activity
and wave activity has been shown to be negatively correlated with seal haul-out behavior.
Access to deep water has been cited as an important factor in haul-out behavior, allowing
for quick escape from terrestrial predators and access to prey (Montgomery et al., 2007).

42
Access to deep water was not a significant factor in determining haul-out site in
preliminary spatial analysis. That being said, a more precise measure of distance to water
depths would likely improve the strength of the analysis. Manually making polylines was
relatively successful in areas where changes in depth were clear and dropped off
moderately. However, in areas where water dropped off quickly it was difficult to create
accurate polylines without overlap. Additionally, the area off the northeast coast of Long
Island, where seal haul-out locations was also an area of deep water. Future work should
focus on the bathymetry and prey distribution in this area in relation to haul-out sites.
Harbor seals are central place foragers, tending to remain close to haul-out sites and
revisit foraging grounds (Orians & Pearson, 1979; Grigg et al., 2012). Determining if
prey availability is an important factor influencing haul-out site selection and subsequent
site fidelity is an important prerequisite to management and conservation of the Long
Island harbor seal population.
Finally, protection from wind has also been cited as a variable positively affecting
seal haul-out behavior. Seals tend to haul-out in areas that are protected from high winds
(Watts, 1996). Wind speed was not shown to be a significant factor influencing LI
harbor seal haul-outs. This may be due to the fact the data was not ideal for this analysis.
The shapefile provided by the National Renewable Energy Laboratory was designed for
the site selection of wind turbines. The wind speeds were for 50m height and can
therefore only be used relatively to explain haul-out site selection. Additionally, the data
had been classified into 5 categories according to ranges of wind speeds. The highest
range was given a 5 and deemed the most appropriate site for wind energy while the
lowest values were deemed as being poor sites for wind energy. Since the data was

43
already classified the wind speed was not exact for each haul-out location but was rather
an integer from 0-5 representing associated ranges of wind speeds. Having seal level
wind speeds would enhance analysis.
Conclusions that can be draw from the data are, that some Long Island harbor
seals display site fidelity, in that they return to Cupsogue Beach over multiple seasons.
However, this site fidelity is not associated with breeding behavior, as most commonly
seen across other populations of harbor seals. In the absence of life history events that
dictate haul out behavior, Long Island harbor seals must be influenced by other factors
which result in site fidelity. Potential factors may include, distance form disturbance,
access to prey and access to deep water. While relatively few seals were seen to return
over multiple seasons in relation to seals that were seen over one season, it is possible
that more seals could have been identified if survey methods were altered.
Opportunistic survey methods may have limited the amount of seals that could be
re-sighted. The number of harbor seals that are hauled out varies considerably over time
and between locations. Variability can be partially explained by environmental
conditions and life history events (Simpkins et al., 2003; Watts, 1996). Harbor seals tend
to haul-out at low tide, although the strength of this correlation varies between sites.
Inclement weather can also reduce the amount of seals ashore (Simpkins et al., Watts,
1996). Due to the opportunistic nature of survey methods, coinciding with educational
seal walks, identifying and re-sighting individuals was most likely limited. Not all
surveys were conducted at low tide when the greatest number of seals would be expected
to come ashore.

44
In addition, haul-out proportions vary seasonally in response to life history events.
Haul-out numbers peak in the molting season and pupping season. In the last few weeks
of the molting season, as seals are reentering the water haul out numbers can drop by
more than 85% (Simpkins et al., 2003; Matthew & Kelley 1996). During the pupping
season, females and pups dominate the haul out sites, while males rove nearby waters.
This sexual difference in haul-out behavior during the breeding season, likely decreases
the re-capture probability for males. Since this study took place outside of the breeding
season it is not likely that sexes represented unequal capture probabilities. Of the ten
individuals for which sex was determined there was no difference between males and
females in the number of seasons sighted. Determining what local conditions that result
in the maximum proportion of seals hauled out, would result in the greatest potential for
new identifications and re-sightings of individuals.
In terms of seasonality, the best time to conduct a photo-identification study for
harbor seals would coincide with the annual molt, and ideal local environmental
conditions. Since molting does not occur during the seal season in Long Island, the best
approach to increase the accuracy of photo-identification work would be to design a
survey around local ideal environmental conditions, within the study season, that result in
the greatest number of seals hauled out. These conditions are not well established for
Long Island seal populations. Low tide is likely a contributing factor, according to local
biologists, but this would need to be further investigated. Photographs collected from
2007-2011 were all taken within 2.5 hours of low tide. Within this times frame there was
no correlation between minutes from low tide that the first photograph was taken and
overall number of seals captured. Another possibility would be to focus survey efforts at

45
a certain time within the seal season in which the maximum number of seals are
observed. This has not been well established either, but photo-identification data from
Dr. Kopleman at Cupsogue spanning 10 seasons indicates that the number of seals
observed differed between months. The highest numbers of seals were observed in
March. This is logical, considering it takes time for all seals traveling south to reach
Long Island. Focusing efforts and funds towards the latter half of the seal season make
increase photo-identification efficiency. Further evidence indicating that there is a
possibility for greater number of seals to be recaptured, and perhaps indicate that more
seals display site fidelity can be seen in the percentage of seals with unique marks that
have been previously identified. If all seals with unique marks were being identified,
over time the percentages would increase, approaching but never reaching 100% as there
is always individuals coming in and out of the population. This trend was not observed
in the data. There was no significant relationship between time and the percentage e of
seals with unique marks that had been identified. This indicates that there are still
individuals that need to be identified, and could perhaps lead to greater re-sighting
frequencies. In addition to life history events and environmental conditions, photo-
identification errors can also limit the amount of seals that can be captured and accurately
identified. In any event, this study indicates that some Long Island harbor seals do
display site fidelity.
Sustained patterns of site use have various consequences for management.
Showing fidelity to a site increases the risk that a population may experience severe
declines due to anthropogenic stress, predation, or disease. While the Northwest stock is
increasing, new potential anthropogenic stressors are also increasing. Such stressors

46
include increases in various eco-tours including seal walks and seal cruises. While the
tours are wonderful opportunities to educate the public, the effects of such tours on seal
populations is largely unknown. Seals have been shown to become more vigilant and
even flush haul-out sites in the presence of ecotourism activities (Granquist &
Sigurjonsdottir, 2014). Increased vigilance and abandonment of haul-out site both
negatively affect overall fitness. What effect this increase in energy expenditure and
reduced fitness has at both the individual and population level is unknown. Harbor seals
populations vary widely in their response to anthropogenic disturbance, with some being
temporally disturbed, some being permanently disturbed, and others habituating to
disturbance. Voluntary management should be put in place to inform guests to remain
calm and for tour operators to remain at an adequate distance as to not disrupt seals.
Other potential threats that are increased when populations show site fidelity to a
small geographic area are those of environmental quality. There is increasing evidence of
mortality due to infectious disease, including morbillivirus. It remains uncertain if
morbillivirus is the cause of epizootics or simply a contributing factor among many
others. Being able to isolate a direct cause, after an animal is stranded can be extremely
difficult. Continued re-infection of populations with diseases that have in the past
contributed to large scale mortality can put additional stresses on populations that are
recovering. Additional environmental stresses include environmental contaminants,
including but not limited to agricultural runoff, PCBs, and organochlorides, as well as
harmful algal blooms and hypoxic events. Long Island is highly urbanized. Spanning
only 13 miles in width, terrestrial activities greatly affect coastal water quality. Coastal
waters of the north-west, where certain harbor seals haul-out are subject to frequent

47
hypoxic events, due to nutrient input and limited water exchange. Areas on the south
shore are more prone to harmful algal blooms as well as both diarrhetic shellfish
poisoning (DSP) and paralytic shellfish poisoning (PSP) (Figure 24). Managers should
be aware of potential risks to populations and ways in which they may mitigate potential
hazards.
Since harbor seal haul-out is based on a multitude of factors and does not solely
reflect environmental patchiness, managers must take a precautionary approach when
dealing with populations that exhibit site fidelity, to ensure areas that require protection
and monitoring are dealt with appropriately (Da Silva & Terhune, 1988). While photo-
identification of natural markings has provided a relatively non-invasive approach to
monitor populations, careful consideration is required to choose the most appropriate
methodology for the study which ideally increases accuracy and reduces cost.
Comparison of Manual vs. Computer Aided Identification
The process of photo-identification include three main methods, manual
identification, manual identification with alpha-numeric coding, and computer aided
matching photo-identification. In choosing the most appropriate method of identification
for a scientific study, careful consideration must be taken to acknowledge the advantages
and disadvantages of each method to ensure that the most appropriate method is chosen
for the particular study and the limitations associated with the resulting study are clearly
understood and outlined. Finally, in comparing manual and computer aided methods it is
important to consider two key variables-accuracy and speed, in this case qualitatively
(Fig. 25).

48
Manual photo-identification has proven to be both an effective and simple way to
approach photo-identification studies, capturing many individuals in diverse conditions
both cost effectively and reliably. Such methods have been successfully utilized to
categorize small photographic libraries, but once a catalogue becomes larger and/or
involves more complex pattern recognition, manual identification becomes very tedious.
Even so, manual methods continue to be utilized to manage large databases. It is often
the case that such databases began long before the application of computer assisted
identification, and the pre-processing of such large quantities of photos for proper use in
photo-identification software is too time consuming and often viewed as not worth the
effort. Manual methods are also sensitive to reductions in photo quality, with successful
matches decreasing and error rates increasing as photo quality decreases. Similarly, the
less distinct the individuals marking, the more errors will occur. This case study
indicated that manual photo-identification can be successfully utilized for large databases
of seals with unique pelage markings, to track individuals over multiple years. Compared
to computer assisted methods, the manual method resulted in fewer identifications of
seals and lower sighting frequencies, making this method slightly less accurate. It was
also lengthy and tedious work. Nevertheless, the method was easy to apply and resulted
in little confusion or technical difficulty. One additional requirement of many manual
photo-identification methods, and one that was applied in this case study, is the use of
alpha numeric coding.
The use of alphanumeric coding within manual identification practices expedites
the process of matching individuals, particularly for larger catalogues. Alphanumeric
coding is appropriate when marks can be consistently categorized and are stable over

49
time. This method requires additional time in the pre-processing of photos. Such
drawbacks should be considered when assessing the applicability of using alpha numeric
coding. Keywords can also be used to categorize individuals and aid in the matching
process. In this case study, animals that displayed unique marks and were determined to
not have been previously identified were given alpha numeric codes corresponding to the
date they were captured and categorized based on color phase, distinctiveness of marks
and spot density. This categorization aided in initiating searches for potential matches
and well as confirming suspected matches
Finally, computer assisted matching software, which can be broken down into
metric and nonmetric systems, although more technically challenging is often the most
appropriate and choice when dealing with large and complex catalogues. While, not all
comparisons were significant in this study, computer aided matching software did
significantly increase the re-sighting of individuals, which suggests increased efficiency.
I would predict that with even larger photographic catalogues that this benefit would be
more pronounced. Costs are low, as many programs are available for free. However,
pre-processing of photos is often a lengthy a process. Photos are first imported and set
for pattern extraction for metric systems or unique classification in nonmetric systems.
These steps are often tedious and more time consuming when compared to manual
methods. Next, designed algorithms determine a list of potential matches, and visual
confirmation is conducted by the researcher. This step has the capability to greatly
reduce matching time, if accurate matches can consistently be found in the potential
match list, thus avoiding false negative errors and reducing the amount of photos the
image has to be compared to. This process can be ever more beneficial if a similarity

50
coefficient can be determined and invoked in which individuals in the list that exceed
such a value are not visually checked (Auger-Méthé, Marcoux,& Whitehead, 2011). For
example, Hiby and Lovell (1990) found that 98% of true grey seals matches occurred
when similarity coefficients were greater than 0.5. Implementing the use the threshold
greatly reduced matching efforts, and the authors further suggested that those utilizing
their computer assisted matching software to identify grey seals apply a similar threshold
value to their methodologies. A threshold was not invoked in the present study, because
the target species was the harbor seal. Harbor seals display unique pelage markings in
way of spots or rings that vary greatly from grey seal pelages. Therefore, the entire list of
potential matches was searched during the visual confirmation stage, which minimized
the potential benefits, in terms of reduced effort; that could be realized with the use of a
computer aided matching system. This balance between time and reduction in false
negatives is apparent across photo-identification studies. As protocols are implemented
to reduce false negative errors, such as inspecting the entire list of potential matches
and/or having more than once individual visually confirm a match, false negative errors
are often reduced. However, this cautionary approach leads to greater effort and more
time required. Finding a balance between these diverging needs of accuracy and
timeliness is often difficult and is largely based on the study and researchers’ discretion.
In this case study, the use of computer assisted photo-identification resulted in a greater
number of identifiable individuals and higher re-sighting frequencies, despite having a
lengthy pre-processing phase and visual confirmation stage (Table 6). Many photo-
identifications studies will err on the side of caution and implement methodologies that
aim to reduce the rate of error, as errors can significantly alter results.

51
Errors in Photo-Identification
Photo-identification errors are common in both manual and computer aided
methods. Two possible sources of error in photo-identification work are false positive
errors, identifying two different individuals as the same individual, a false negative
errors, identifying two photos of the same individual as different- a false negative (Patton
& Jones, 2008).
False positive errors can cause large biases in population parameter estimations.
However, risk aversion to false positives increases the probability of a false negative
finding, the balance between which has not been widely investigated. The likelihood of a
false positive result is dependent upon the similarity of markings, with highly similar
markings causing the greatest risk for false positive errors. In general, false positive
errors are of little concern in photo-identification studies, as strict matching protocols,
including the use of restrictive criteria, minimize the risk of false positive error.
Additionally, final visual confirmation is normally conducted by experienced photo-
analysts and/or by two individuals (Stevick et al., 2001). A limited number of false
positive errors was detected in the present study (Table 5). False positives that did occur
can most likely be attributed to human error, as matching images is time consuming as
well as physically and mentally exhausting.
A much greater concern in photo-identification studies is the risk of false negative
errors. False negative errors have been shown to be common in photo-identification
studies utilizing natural marking (Stevick et al., 2001). False negative errors means that a
single individual is identified as two individuals. False negative errors were very
prevalent in the present study, resulting in a false negative rate of 21.4 % (Table 4).

52
Both photo quality and the distinctiveness of marks appear to be related to error
rates. In both errors related to photo quality and distinctiveness of marks, important
assumptions for mark-recapture studies are violated (Hammond, 1986). If marks are
indistinct the probability of identifying that animal is decreased, leading to heterogeneity
of the sampling probabilities. Photographic quality is independent of the animal it
represents. However, it is difficult to consider photo quality and the distinctiveness of
marks independently. Stevick et al. (2001) determined that coders often gave photos of
lower quality a lower score for distinctiveness of marks. Stevick et al. (2001) found no
error rates with the highest quality photos, but high levels of error with each successive
decline in photo quality measure. Pattern change can also result in error. Errors related
to distinctiveness of marks increases when images are only partial photographs, i.e.
photos that do not show all of the area of focus are subject to high rates of error.
Errors can significantly alter results. Both false negatives and false positive errors
can be reduced by controlling for photo-quality and setting high photo quality standards.
That being said, eliminating low quality photos can substantially reduce sample sizes and
result in loss of precision. Additionally, very distinctive individuals can often be
manually identified in even in photos of low quality. Being able to determine error rates
specific to image quality and distinctiveness allows researchers to make corrections for
biases resulting from false positive and false negative identifications (Stevick et al.,
2001). Double marking experiments, which compare results from mark-recapture
utilizing physical tags and genetic analysis, are conducted to estimate the rate of error.
However, double matching experiments have not widely been applied to studies utilizing
natural markings and genetic analysis. (Stevick et al., 2001)

53
Manual Matching of Trained vs. Untrained Photo-analysts
There was no significant difference in manual matching success in relation to
photo-identification experience (p>0.05). However, the sample size for this study was
very small, which makes meaningful comparisons difficult. Ideally, there would be more
participants with clear categorizes of relative photo-identification experience, depending
on the amount of time, species involved and age. The highest percentage of correct
matches was achieved by an individual with 30+ years of photo-identification, including
work with harbor seals, which may indicate that many years of experience is beneficial.
However, such gains were not seen in individuals with less experience, such as a few
months during an internship. In addition, some individuals with no experience at all
scored high, indicating that some people may simply be better at visual identification than
others. These findings are consistent with the literature. Schofield et al., (2008) tested
the ability of trained, and untrained observers to identify sea turtles. They found that
while all participants scored highly the most experienced had the highest scores. A
follow up study implemented a 20 min training protocol to inform untrained observers of
what to look for in identifying turtles. The study demonstrated that there was significant
improvement among untrained observes following the short training protocol (Schofield
et al., 2008). Implementing a similar approach in further tests to determine the ability of
untrained observers to identify harbor seals would be beneficial.
Comparing Error Rates of Harbor and Grey Seals
Matching grey seal photos using the computer software was slightly more
effective, resulting in less photo-identification errors, than matching harbor seals photos.
Grey seals have more distinctive markings, of contrasting dark and light patches, which

54
likely made them easier to identify. The computer software was also developed
specifically for grey seals, and perhaps when tailored to meet the needs of harbor seals
could perform equally as well in identifying harbor seals. The most errors were false
negative errors. Future research efforts should focus on reducing false negative errors.
Citizen Science Applications
There is a growing desire for public participation in scientific research termed
“Citizen Science” (Bonney et al., 2009). Projects that foster community involvement in
scientific research highlight the benefits that can be garnered from such collaboration for
both the public and scientists. Citizen science projects promote public involvement in
scientific research and environmental education, addressing the broader need to for open
dialogue between the scientific community and the public to foster stewardship of our
environment. A previously restrictive field, science has been hesitant to incorporate the
public into scientific research, in fear that public observers are not reliable. However, as
Bonney et al. (2009) pointed out, with clear protocol, data collection forms, and
interactive public support networks, citizen science can provide reliable observer data to
contribute to scientific research of unprecedented scope. Photo-identification in many
respects is a prime candidate for a citizen science project.
Public volunteers could potentially be involved in the photo collection, importing
of photos to a computer assisted program, pre-processing of photos, and even the visual
confirmation of individuals. Collaborative databases can be created worldwide by both
public participants and scientists alike to upload images to an internet based photo-
identification library. For example, a system that incorporates images of manta rays by
novice divers is being created (Town, Marshall & Sethasathien, 2013). This process,

55
however, should be done with caution, as to not promote novice photographers getting
too close to seals, and potentially disturbing them. Education is key, and by including the
public in the photo-identification monitoring, more will be educated. Photo-identification
provides a valuable opportunity to involve the local community in monitoring of
populations, by integrating the local involvement through the uploading of images to the
photo-identification library, thus giving the community a larger role in the management
of local marine mammal populations (Auger- Méthé, Marcouz & Whitehead et al., 2011).
Arguably, such integration of the community into scientific project should lead to greater
respect and understanding of their local environment. The user friendly interface of
computer assisted matching software provides further opportunities for public
participation in scientific research. Volunteers can also aid in the visual confirmation of
individuals, but there are concerns regarding observer reliability when using the public in
citizen science projects.
Matching individuals is the most time consuming process of any photo-
identification study, and thus provides the greatest potential benefit for implementing
public participation. However, there is a concern than visual confirmation, traditionally
done by at least one trained photo analysts, can be done effectively and reliably by an
untrained observer. As with any photo-identification project false negative and false
positive errors are of great concern as they can substantially alter results.
The computer matching software is easy to operate and could easily be
incorporated into a citizen science project (Auger-Méthé, Marcoux & Whitehead, 2011).
Much of the work can be accomplished given a training of the software and requires little
familiarity with the individual seals. The visual confirmation phase would likely require

56
a more experienced photo-analyst make the final confirmation, unless untrained
observers are at least given a training session and demonstrate accuracy and reliability in
their identifications.
Future Research Needs
While shown to be more accurate, computer aided matching software techniques
are still tedious and time consuming. Automated pre-processing is necessary to further
increase the speed of computer assisted programs (Town et al., 2013). Additionally, it
has been noticed that combining a metric and nonmetric based computer aided system to
identify sperm whales has improved accuracy (Beekmans et al., 2005). Utilizing metric
and non-metric systems alongside each other may be beneficial in pinniped studies.
Metric systems can be used to extract patterns and non-metric systems to describe mark
complexity, color phase, and spot density. Finally, to increase the speed of matching
individuals a threshold should be found in which potential matches beyond a similarity
coefficient are not checked. This would require further harbor seal photo-identification
tests in the software recording where in the list of potential matches true matches
occurred.
Study Limitations
The study was able to determine that some Long Island seals display site fidelity
and that the computer aided photo-identification methods were slightly more accurate, in
that individuals were re-sighted more frequently using the computer method than manual
photo-identification methods. While differences were not always statistically significant,
as catalogue sizes grow and more seals are identified these differences will likely be more
pronounced. One area in which the comparison of method was weak, was in determining

57
photo-identification errors. Since the manual photo-identification process was already
begun before the start of the study it was not possible to account for photo-identification
errors made prior to the start of the study. The study was also weak in its ability to
compare methods based on speed. Methods varied tremendously, and again since manual
photo-identification had already begun prior to this study comparisons were difficult.
Matching individuals is the most time consuming portion of photo-identification.
Without the use of a similarity coefficient threshold, matching using the computer
software was not reduced. Further research in harbor seal photo-identification and the
development of specific harbor seal similarity coefficient threshold, will lead to
tremendous gains in this technology. Particularly considering that harbor seals are the
most widespread pinniped species. Finally, continued surveys should be conducted to
determine if photo-identification experiences significantly alters manual matching
success.

58
Chapter 5 Conclusion
This study indicates that photo-identification based mark recapture using natural
markings is an effective method to study pinniped population dynamics. This study also
determined that some individual harbor seals return to Cupsogue Beach County Park over
multiple seasons, displaying site fidelity. Continued monitoring is necessary to ensure
that these areas are adequately protected. In addition, it was determined that while both
manual and computer aided photo-identification methods were effective at managing
large photograph catalogues of harbor seals, computer methods were slightly more
accurate resulting in a greater number of identifiable seals and higher numbers of re-
sightings. That being said, both methods were very tedious and timely. Automating pre-
processing steps as well as developing and implementing a similarity coefficient
threshold specific to harbor seals will likely increase the speed of visual matching and
make computer aided photo-identification more desirable. Such thresholds have been
successfully implemented in grey seal photo-identification. Finally, the use of photo-
identification and particularly CRESLIs’ work in Long Island lends itself to citizen
science. Volunteers can aid in data collection, processing and matching of photographs.
CRESLI as an organization that prides itself on engaging the local community and as a
result often utilizes scientific data collection trips as an opportunity for public education.
Seal walks and whale watches provide opportunities for Dr. Kopelman to collect
photographic information and educate the public. Furthering the public involvement
through a citizen science framework would likely greatly enhance the long term study of
the local seal population as well as increase awareness, education and stewardship of the
local environment. Advancements in computer aided matching software will certainly

59
increase the applicability of such methods to pinniped studies, allowing for the study of
population parameters and conservation of species through the monitoring of large, long
term databases effectively and accurate

60
Figure 1. Coastal range of western Atlantic harbor seal. Long Island harbor seals are seasonal inhabitants, occupying NY coastal waters from September- May. Data from NOAA, protected species.

61
Figure 2. Map of Long Island harbor seal haul-out locations indicating the location of the study site, Cuspogue Beach County Park, outlined by a yellow square.
62
Figure 3. Example of manual matching color phase criteria. Individual seals were determined to have color phases that were

63
Figure 4. Example of manual matching spot density criteria, with one having the least spots and 5 having the most spots

64
Figure 4. Example of manual matching spot density criteria. Individuals were given a score of 1-5, with 1 corresponding to low density of spots to background ratio and 5 corresponding to a high density of spots to background ratio.
Figure 5. Example of manual matching spot complexity criteria. Individuals were determined to have low, intermediate and high spot complexity. Low complexity individuals had spots which did not deviate from an oval spot and high complexity individuals had many spots which were variable and were more complex than oval spots.

65
Figure 6. Example of computer aided pre-processing of images by placing points corresponding to different anatomical locations on the image. First, points were placed on the nose and mid-flipper. Next points were placed indicating the location of the right flipper, left flipper, right eye and left eye when appropriate. Finally, the margins of the body were determined by placing red points along the top of the body and blue points along the bottom of the body.

66
Figure 7. Example of computer matching pre-processing in which a 3D surface model is superimposed on the image.

67
Figure 8: Example of computer aided pre-processing in which an extract is taken from the image.

68
Figure 9: Example of computer aided pre-processing in which extracts are saved. Image displays from left the extract, detrended extract, and wavelet view of the extract.

69
Figure 10. Photo of grey seal indicating the distinctive pelage markings of contrasting dark and lite coloration

70
R² = 0.0025
0
0.2
0.4
0.6
0.8
1
1.2
1.4
% w
ith g
ood
mar
ks th
at a
re Id
'd
Time
Percetage of Seals with Goog Marks and Id'd
Figure 11. The (# seals with good marks x (1/ID’d seals) was constant. If all seals with unique marks were previously identified than the percentage would be 100%.

71
Figure 12. Manual vs. computer aided photo-identification sighting frequencies of known individuals. The x-axis displays names of individuals and the y-axis shows the number of seasons sighted. Blue bars represent manual identifications and orange bars represent computer aided identifications. Methods differed significantly p=0.0373. Computer methods had greater overall re-sightings

72
Figure 13. Cumulative number of seals identified over four seasons using manual and computer aided methods. Manual identification results are displayed in blue and computed aided results are displayed in orange. Both methods showed an increase in number of identified seals over the four seasons. Computer methods consistently resulted in greater number of identifications although this was not significant (p=0.328)
0
50
100
150
200
250
2011 2012 2013 2014
Cum
ulat
ive
Num
ber o
f Sea
ls Id
entif
ied
Year
Cumulative Number of Seals Identified
Manual
Computer Aided

73
Figure 14. Manual vs Computer aided resightings data. The number of individuals which were determined to be resighted using manual methods are displayed in blue and the number of individuals determined to be resighted using computer aided methods are displayed in orange. The computer aided matching method resulted in greater number of individuals having repeat sightings but, this result was not significant
2011 2012 2013 2014Resightings (Manual) 0 13 11 20Resightings (Computer
Aided) 0 16 19 21
0
5
10
15
20
25
Num
ber o
f Sea
ls Re
-sgh
ited
Re-sighting Data

74
Figure 15. Manual vs. computer aided seasonal sighting frequencies. The number of individuals sighted using manual identification (blue) and computer aided identification (orange) over one, two three and four seasons. While computer methods resulted in larger sighing frequencies over 1, 3, and 4 seasons the difference was not significant (p=0.460).
0
50
100
150
200
250
1 2 3 4
# of
indi
vidu
al a
nim
als
# of Seasons Identified
Seasonal Sighting Frequency
Manual
Computed Aided

75
R² = 0.8526
01020304050607080
2011 2012 2013 2014
Num
ber o
f Sea
ls
Year
Change in Mean Sighitng per Observation within Study Period
Figure 16. Change in mean sighting per observation within study period differed significantly between years (p=0.01). There was a decrease trend across years in the number of seals observed per sighting.

76
10.67
39.07 33.08
62.00 74.57 78.22
54.21 51.08
R² = 0.4346
R² = 0.4346
0.00
20.00
40.00
60.00
80.00
100.00
2007 2008 2009 2010 2011 2012 2013 2014YEAR
Change in mean seal sightings per observation
Mean number of harbor seals per observation
Linear (Mean number of harbor seals per observation)
Figure 17. Change in mean seal sighting per observation (2007-2014) differed significantly between years (p=0.004). The trend in mean observations was increasing,

77
R² = 0.0013
0
20
40
60
80
100
120
140
0 20 40 60 80 100 120 140 160
num
ber o
f sea
ls id
entif
ied
Minutes from 1st photo of low tide
Haul-out and Tides
Figure 18. Number of harbor seals observed within minutes of low tide. All photos were taken within 2.5 hours of low tide. Within this time frame there was no correlation between the number of seals identified and the minutes from low tide.

78
-10
0
10
20
30
40
50
60
70
80
NOVEMBER DECEMBER JANUARY FEBRUARY MARCH APRIL
Monthly Mean and standard error, # of harbor seals
Figure 19. Monthly mean number of harbor seals observed (2004-2014) p<0.01

79
Figure 20. Long Island, NY harbor seal haul-out locations and human population. The top map displays human population density including NYC and the bottom map displays human population density excluding NYC. The bottom image is a more accurate representation of Long Island population density trends, with the west being more densely populated than the east. Mean haul-out is indicated by a red star, median haul-out by a yellow circle, and directional distribution by the opaque oval. Harbor seal haul-out was negatively related to human population density (0.015)

80
Figure 21: Bathymetry and Harbor Seal Haul. Distance form haul-out to water depth was not a significant in determining haul-out site. (20m p=0.17; 30m p=0.06; 40m p=0.25; 50m p= 0.14)

81
Figure 22. Wind Speed at 50m and Haul-out Site Locations. Wind speed was not significantly related to haul-out locations (p=0.32).

82
R² = 0.0157
0102030405060708090
Perc
ent C
orre
ct R
espo
nse
Level of Experience (Low-High)
Effect of Photo-identicifation Experience on Manual Matching Sucess
Figure 23. Effects of Photo-identification experience on manual matching success. There was no significant difference between those with and without experience (p>0.05)

83
Figure 24. Long Island water quality issues

84
Figure 25. Comparing manual and computer aided methods in terms of accuracy and speed.

85
Table 1. Manual sighting frequency of individuals within study period (Nov. 2010 Apr.14)
# of seasons # of individuals re-sighted
4 8
3 4
2 13
1 177

86
Table 2. Manual sightings frequency of seals within 10 seasons (Nov.2004- Apr. 2014)
# of seasons # of seals re-sighted 8 4 7 1 6 1 5 3 4 0 3 2 2 9 1 157

87
Table 3: Computer aided sighting frequency of individuals within study period (Nov. 2010-Apr.2014)
# of seasons # of seals re-sighted 4 9 3 4 2 16 1 200

88
Table 4: Computer aided identification of harbor seals false negative errors
# Groups # Single Total ID's 4 spot 0 2 2 4c 0 3 3 6K 0 2 2 8 right 0 2 2 angler fish 0 2 2 bat right lambda 0 12 12 bowtie 1 1 2 cadusues left 0 3 3 CHO 1 3 4 circles head right 0 4 4 dark circles 0 2 2 dead mans float 0 6 6 dracula 0 2 2 ear rings 0 4 4 enterprise 3 3 6 evil seahorse 0 2 2 fish right 0 2 2 footprints 0 3 3 H20 2 2 4 hammerhead right 2 22 24 horsehoe 2 25 27 iou mickey mouse 1 1 2 jack-o-lantern 0 2 2 ladder 0 2 2 metaphase 1 3 4 mikey flank 0 2 2 N/A 2 2 2 4 N/A 22 2 1 3 N/A 25 0 2 2 N/A 3 0 3 3 N/A 7 0 2 2 neck rings right 0 2 2 orion hind 1 5 6 pawprint 1 2 3 puppy right 0 2 2 red eye right 0 7 7 shopping cart left 2 6 8 sideways tornado 0 2 2 simon templar 0 2 2

89
square flank 1 2 3 triangle 0 6 6 traingle flank 0 2 2 unnamed-2011-01-01a 0 3 3 unnamed-2011-01-01m 1 1 2 unnamed-2011-02-06f 0 2 2 unnamed-2011-02-06g 0 3 3 unnamed-2011-03-27a 0 2 2 unnamed-2011-03-27e 0 2 2 unnamed-2011-04-02a 0 2 2 unnamed-2011-04-03b 0 2 2 unnamed-2011-04-15b 0 2 2 unnamed-2011-12-18a 0 2 2 unnamed-2012-012-28a 0 4 4 unnamed-2013-01-6d 0 3 3 unnamed-2013-01-21a 2 2 4 unnamed-2013-11-29a 0 3 3 unnamed-2014-02-8d 1 2 3 unnamed-2014-03-15b 0 2 2 V chest 0 2 2 wicked witch right 0 3 3 26 207 233

90
Table 5. Computer aided identification of harbor seals false positive errors
Mismatch # False Positives
Aspect
unnamed-2011-03-04d ≠ unnamed-2011-03-024e 1 Neck/Body unnamed-2011-03-27e ≠ orion hind 2 Body/Body Footprints ≠ Wicked Witch Right 1 Head/Head unnamed-2012-01-09 a ≠ CHO 1 Head/Head unnamed-2013-04-06a ≠ unnamed-2013-01-21a 1 Body/Body

91
Table 6. Manual vs. computer aided new Identifications and re-sighting. Although new identifications and re-sightings were greater for computer methodologies. These results
were not statistically significant (p=0.411; p=0.347)
Year Number of Surveys
New Identifications (Manual)
New Identifications (Computer Aided)
Re-sightings (Manual)
Re-sightings (Computer Aided)
2011 21 68 79 0 0 2012 28 52 58 13 16 2013 26 42 51 11 19 2014 36 40 41 20 21 Total 111 202 229 44 56

92
Table 7. Computer aided identification of grey seals false negative errors
Individual # Groups # Single Total ID's
Aspect
Grey 1 2 1 3 R/L Grey 10 0 2 2 R/L Grey 15 0 2 2 L/L bunnyface 2 0 2 R/L cactus 0 2 2 R/L cat woman 0 2 2 R/R daisy 2 0 2 R/L douser 0 2 2 R/L Dr. Sues 0 2 2 R/L Exclamation 1 1 2 R/L giraffe 0 2 2 R/L mermaid 1 1 2 R/L Mola 0 3 3 Mix Piper 1 1 1 R/L white chair right
2 0 2 R/L
Xmas 0 4 4 Mix angelfish 0 2 2 R/L aquarius 2 0 2 R/L baby narwhal
0 2 2 R/R
Batman 1 1 2 R/L bettywhite 0 2 2 R/L Blimpie 1 1 2 Mix cinderella 0 2 2 L/L cowhead 0 2 2 L/L Donut 0 2 2 R/L female symbol
1 2 3 Mix
Fireface 2 0 2 R/L flat squirrel 0 2 2 L/L Fluke 2 0 2 R/L google eyes 1 1 2 R/L Ladel 0 1 2 R/L Minnie 1 1 2 R/L mothernhen 1 1 2 Mix MrT 1 1 2 R/L

93
mushroom 0 2 2 R/L Orion 0 3 3 Mix Ostrich 0 2 2 R/L pompom 0 2 2 L/L Splotch 1 1 2 R/L Tank 0 2 2 R/L Texas 1 2 3 Mix Throne 1 1 2 R/L Turtle 0 2 2 R/L

94
WORKS CITED
Adams, J. D., Speakman, T., Zolman, E., & Schwacke, L. H. (2006). Automating image matching, cataloging, and analysis for photo-identification research. Aquatic Mammals, 32(3), 374–384.
Arntzen, J. W., Goudie, I. B. J., Halley, J., & Jehle, R. (2004). Cost comparison of marking techniques in long-term population studies: PIT-tags versus pattern maps. Amphibia-Reptilia, 25(3), 305-315.
Arzoumanian, Z., Holmberg, J., & Norman, B. (2005). An astronomical pattern‐matching algorithm for computer‐aided identification of whale sharks Rhincodon typus. Journal of Applied Ecology, 42(6), 999-1011.
Auger-Méthé, M., Marcoux, M., & Whitehead, H. (2011). Computer-assisted photo-identification of narwhals. Arctic, 342-352.
Beaumont, E. S., & Goold, J. C. (2007). Cheap and accessible method to aid individual photo-identification of grey seals , Halichoerus grypus, 1337–1343.
Becker, B. H., Press, D. T., & Allen, S. G. (2011). Evidence for long‐term spatial displacement of breeding and pupping harbour seals by shellfish aquaculture over three decades. Aquatic Conservation: Marine and Freshwater Ecosystems, 21(3), 247-260.
Beekmans, B. W. P. M., Whitehead, H., Huele, R., Steiner, L., & Steenbeek, A. G. (2005). Comparison of two computer-assisted photo-identification methods applied to sperm whales (Physeter macrocephalus). Aquatic Mammals, 31(2), 243.
Bendik, N. F., Morrison, T. A., Gluesenkamp, A. G., Sanders, M. S., & O’Donnell, L. J. (2013). Computer-assisted photo identification outperforms visible implant elastomers in an endangered salamander, Eurycea tonkawae. PloS one, 8(3), e59424.
Bjørge, A., Thompson, D., Hammond, P., Fedak, M., Bryant, E., Aarefjord, H., ... & Olsen, M. (1995). Habitat use and diving behaviour of harbour seals in a coastal archipelago in Norway. Developments in Marine Biology, 4, 211-223.
Bolger, D. T., Morrison, T. a., Vance, B., Lee, D., & Farid, H. (2012). A computer-assisted system for photographic mark-recapture analysis. Methods in Ecology and Evolution, 3(5), 813–822.
Boness D.J., Bowen W.D., Buhleier, B.M. & Marshall, G.M. (2006). Mating tactics and mating systems of an aquatic-mating pinniped: the harbor seal, Phoca vitulina. Behavioral Ecology. 61, 119-130.

95
Bonney, R., Cooper, C. B., Dickinson, J., Kelling, S., Phillips, T., Rosenberg, K. V., & Shirk, J. (2009). Citizen science: a developing tool for expanding science knowledge and scientific literacy. BioScience, 59(11), 977-984.
Boyd, I. L., Bowen, W. D., & Iverson, S. J. (Eds.). (2010). Marine mammal ecology and conservation: a handbook of techniques. Oxford: Oxford University Press.
Cordes L.S., Thompson, P.M. (2013) Mark-recapture modeling accoutning for state uncertainty provides concurrent estimates of survival and fecundity in a protected harbor seal population. Marine Mammal Science. 30(2), 691-7-5.
Da Silva, J. & Tenhune, J.M. (1988). Harbour seal grouping as an anti-predator strategy. Animal Behavior, 36, 1309-1316.
Eguhi, T. (2104) Estimating the proportion of itentifiable individals and groups sixe in photographic identification studies. Marine Mammals Science. 30(3), 1122-1139.
Feltz, E. T., & Fay, F. H. (1966). Thermal requirements in vitro of epidermal cells from seals. Cryobiology, 3(3), 261-264.
Forcada, J., & Robinson, S. L. (2006). Population abundance, structure and turnover estimates for leopard seals during winter dispersal combining tagging and photo-identification data. Polar Biology, 29(12), 1052–1062. doi:10.1007/s00300-006-0149-y
Friday, N., Smith, T. D., Stevick, P. T., & Allen, J. (2000). Measurement of photographic quality and individual distinctiveness for the photographic identification of humpback whales, Megaptera novaeangliae. Marine Mammal Science, 16(2), 355-374.
Godesell, Janet. (1988). Herd formation and haul-out behavior in harbour seals (Poca vitulina) Journal of Zoolgy London. 215, 83-98.
Gilkinson, A. K., Pearson, H. C., Weltz, F., & Davis, R. W. (2007). Photo‐identification of sea otters using nose scars. The Journal of Wildlife Management, 71(6), 2045-2051.
Giuggioli, L., & Bartumeus, F. (2012). Linking animal movement to site fidelity. Journal of Mathematical Biology, 64(4), 647–56.
Granquist, S. M., & Sigurjonsdottir, H. (2014). The effect of land based seal watching tourism on the haul-out behaviour of harbour seals (Phoca vitulina) in Iceland. Applied Animal Behaviour Science.

96
Grigg, E. K., Allen, S. G., Craven-Green, D. E., Klimley, A. P., Markowitz, H., & Elliott-Fisk, D. L. (2012). Foraging distribution of Pacific harbor seals (Phoca vitulina richardii) in a highly impacted estuary. Journal of Mammalogy, 93(1), 282-293.
Gunnlaugsson, T., & Sigurjonsson, J. (1990). A note on the problem of false positives in the use of natural marking data for abundance estimation. Report of the International Whaling Commission Special, (12), 143-145.
Hammond, P. S. (1986). Estimating the size of naturally marked whale populations using capture-recapture techniques. Reports of the International Whaling Commission, 8(Special Issue), 253-282.
Hammond, P. S., Mizroch, S. A., & Donovan, G. P. (1990). Individual recognition of cetaceans: use of photo-identification and other techniques to estimate population parameters. Reports of the International Whaling Commission.
Härkönen, T., & Harding, K. C. (2001). Spatial structure of harbour seal populations and the implications thereof. Canadian Journal of Zoology, 79(12), 2115-2127.
Härkönen, T., Dietz, R., Reijnders, P., Teilmann, J., Harding, K., Hall, A., ... & Thompson, P. (2006). The 1988 and 2002 phocine distemper virus epidemics in European harbour seals. Diseases of aquatic organisms, 68(2), 115-130.
Hastings, K. K., Hiby, L. a., & Small, R. J. (2008). Evaluation of a computer-assisted photograph-matching system to monitor naturally marked harbor seals at Tugidak Island, Alaska. Journal of Mammalogy, 89(5), 1201–1211.
Hayes S.A., Costa D.P., Harvey J.T., Le Boeuf, B.J. (2004). Aquatic mating strategies of the male pacific harbor seal (phoca vituline richardII): Are males defending the hotspot? Marine Mammal Science. 20(3), 639-656.
Heilbrun, R. D., Silvy, N. J., Tewes, M. E., & Peterson, M. J. (2003). Using automatically triggered cameras to individually identify bobcats. Wildlife Society Bulletin, 748-755.
Henry, E., & Hammill, M. O. (2001). Impact of small boats on the haulout activity of harbour seals(Phoca vitulina) in Metis Bay, Saint Lawrence Estuary, Quebec, Canada. Aquatic Mammals, 27(2), 140-148.
Hiby, A. R., & Hammond, P. S. (1989). Survey techniques for estimating abundance of cetaceans. Report of the International Whaling Commission, 11(Special Issue).
Hiby, A.R. & Lovell, P. (1990) Computer matching of natural markings: a prototype system for grey seals. Reports of the International Whaling Comission, special issue 12, 57-61

97
Hiby, L., Lundberg, T., Karlsson, O., Watkins, J., Jüssi, M., Jüssi, I., & Helander, B. (2013). Estimates of the size of the Baltic grey seal population based on photo-identification data. NAMMCO Scientific Publications, 6, 163-175.
Hillman, G. R., Wursig, B., Gailey, G. A., Kehtarnavaz, N., Drobyshevsky, A., Araabi, B. N., ... & Weller, D. W. (2003). Computer-assisted photo-identification of individual marine vertebrates: a multi-species system. Aquatic Mammals, 29(1), 117-123.
Hoelzel, A. R. (Ed.). (2009). Marine mammal biology: an evolutionary approach. John Wiley & Sons.
Karlsson, O., Hiby, L., Lundberg, T., Mart, J., Jussi, I., & Bjorn, H. (2005). Photo-identification , Site Fidelity , and Movement of Female Gray Seals ( Halichoerus grypus ) Between Haul-outs in the Baltic Sea. Ambio, 34(8), 628–634.
Katona, S.K., V. Rough and D.T. Richardson 1993. A field guide to whales, porpoises, and seals from Cape Cod to Newfoundland. Smithsonian Institution Press, Washington, DC. 316 pp.
Kelly, B. P., Badajos, O. H., Kunnasranta, M., Moran, J. R., Martinez-Bakker, M., Wartzok, D., & Boveng, P. (2010). Seasonal home ranges and fidelity to breeding sites among ringed seals. Polar Biology, 33(8), 1095–1109. doi:10.1007/s00300-010-0796-x
Kelly, J. M. (2001). Computer-aided photographic matching in studies using indiviudal identification: an example from Serengeti chettahs. Journal of Mammaology, 82(2), 440–449.
Kovaks, K.M., Jonas, K.M. & Welke, S.E. (1990) Sex and age segregating by phoca viturlina concolor at haul out sites during the breeding season in the Passamaquoddy bay region, New Brunswick. Marine Mammal Science. 6(3), 204-214.
Mackey, B.L., Durban, J.W., Middlemas, S.J. & Thompson, P.M. (2007). A Bayseisn estimate of harbor seal survival using sparse photo identification data. Journal of Zoology. 274, 18-27.
Mattheews, E.A., and Kelley B.P. (1996) Extreme temporal variation in harbor seal (Phoca vitulina richarsi) numbers in Glacier Bay, a glacial fjord in Southeast Alaska. Marine Mammal Science,12, 483-489.
Montgomery, R. A., Hoef, J. M. Ver, & Boveng, P. L. (2007). Spatial modeling of haul-out site use by harbor seals in Cook Inlet , Alaska. Marine Ecology Progess Series, 341, 257–264.

98
Morrison, T. A., Yoshizaki, J., Nichols, J. D., & Bolger, D. T. (2011). Estimating survival in photographic capture–recapture studies: overcoming misidentification error. Methods in Ecology and Evolution, 2(5), 454-463.
Nordstrom, C.A. (2002) Haul-out selection by pacific harbor seal (phoca vitulina richardII): Isolation and percieved predation risk. Marine Mammal Science. 18(1), 194-205.
Olsen, M. T., Dietz, R., Teilmann, J., Andersen, S. M., & Rige, F. (2013). Movements and Site Fidelity of Harbor seals (Phoca vitulina) in Kattegat, Denmark, with implications for epidemiology of the phocine distemper virus. Journal of Marine Science, 70, 186–195.
Orians, G. H., & Pearson, N. E. (1979). On the theory of central place foraging. Analysis of ecological systems, 155, 177.
Patton, F., & Jones, M. (2008). Errors that occur when using photo-identification to identify individual black rhinos. Pachyderm, (44), 35-44.
Ridgeway, S.H., Harrison, R.J. Joye, P.L. (1975). Sleep and cardiac rhythm in grey seal. Science, N.Y., 187, 553-555.
Schofield, G., Katselidis, K. A., Dimopoulos, P., & Pantis, J. D. (2008). Investigating the viability of photo-identification as an objective tool to study endangered sea turtle populations. Journal of Experimental Marine Biology and Ecology, 360(2), 103-108.
Sears, R., Williamson, J. M., Wenzel, F. W., Bérubé, M., Gendron, D., & Jones, P. (1990). Photographic identification of the blue whale (Balaenoptera musculus) in the Gulf of St. Lawrence, Canada. Report of the International Whaling Commission Special Issue, 12, 335ò342.
Schofield, G., Katselidis, K. A., Dimopoulos, P., & Pantis, J. D. (2008). Investigating the viability of photo-identification as an objective tool to study endangered sea turtle populations. Journal of Experimental Marine Biology and Ecology, 360(2), 103-108.
Simpkins M.A., Withrow, D.E., Cesarone, J.C. & Boveng, P.L. (2003) Stability in the proportion of harbor seals hauled out under locally ideal conditions. Marine Mammal Science. 19(4), 791-805
Speed, C. W., Meekan, M. G., & Bradshaw, C. J. (2007). Spot the match - wildlife photo-identification using information theory. Frontiers in Zoology, 4, 2.
Stanley, H. F., Casey, S., Carnahan, J. M., Goodman, S., Harwood, J., & Wayne, R. K. (1996). Worldwide patterns of mitochondrial DNA differentiation in the harbor seal (Phoca vitulina). Molecular Biology and Evolution, 13(2), 368-382.

99
Stevick, P. T., Palsboll, P. J., Smith, T. D., Bravington, M. V., & Hammond, P. S. (2001). Errors in Identification Using Natural Markings: Rates, sources, and effects on capture-recapture estiamtes of abundance. Canadian Journal of Fisheries and Aquatic Scciences, 58.9(September), 1861–1870.
Tenhune, J.M. & Brillant, S.W. (1996). Harbour seal vigilance decreases over time since haul out. Animal Behavior, 51, 757-763.
Thompson, P.M., Miller, D., Cooper, R. & Hammond, P.S. (2006) Changes in distriubtion and activity of female harbor seals during breeding season: implications for their lactation strategy and mating patterns. Journal of Animal Ecology. 61(1), 24-20.
Town, C., Marshall, A., & Sethasathien, N. (2013). Manta Matcher: automated photographic identification of manta rays using keypoint features. Ecology and evolution, 3(7), 1902-1914.
Waring, G. T., Gilbert, J. R., Loftin, J., & Cabana, N. (2006). Short-term movements of radio-tagged harbor seals in New England. Northeastern Naturalist, 13(1), 1–14.
Waring, G. T., Josephson, E., Fairfield, C. P., & Maze-Foley, K. (2007). US Atlantic and Gulf of Mexico marine mammal stock assessments–2006. NOAA Tech. Memo. NMFS-NE, 201, 378.
Watts, Peter. (1992). Thermal contraints on hauling out by harbor seals (Phoca vitulina). Candain Journal of Zoology, 70, 553-560
Watts, P. (1996). The diel hauling‐out cycle of harbour seals in an open marine environment: correlates and constraints. Journal of Zoology, 240(1), 175-200.
Wickler, W. (1985). Coordination of vigilance in bird groups. The 'watchman's song' hypthesis. Z. Tierpsychol., 59. 250-253.
Yochem, P.K., Stewart, B.S., Mina, M., Zorin, A., Sadovo, V. & Yablokov, A. (1990). Non-metrical analysis of pelage patterns in demographic studies of harnour seals. Reports of the International Whaling Commission, special issue 12, 87-70.