assessing stream quality using information on mesohabitat distribution and character
TRANSCRIPT
AQUATIC CONSERVATION: MARINE AND FRESHWATER ECOSYSTEMS
Aquatic Conser6: Mar. Freshw. Ecosyst. 10: 179–196 (2000)
Assessing stream quality using information on mesohabitatdistribution and character
DAVID TICKNERa,*, PATRICK D. ARMITAGEb, MELANIE A. BICKERTONa and KEVINA. HALLc
a School of Geography, Uni6ersity of Birmingham, UKb Institute of Freshwater Ecology, Ri6er Laboratory, East Stoke, Wareham, UKc Institute of Ecology and Resource Management, Uni6ersity of Edinburgh, UK
ABSTRACT
1. The purpose of this paper is to demonstrate: (i) how mesohabitats—medium-scale habitatswhich arise through the interactions of hydrological and geomorphological forces—can be used asa basis for assessing instream habitat diversity; (ii) how combining data on mesohabitatdistribution with those from macroinvertebrate sampling can produce an index for assessing streamquality; and (iii) how, when nested with River Habitat Survey (RHS), mesohabitat information canprovide a comprehensive assessment of stream quality.
2. A survey of a small chalk stream in southern England showed that the distribution ofmesohabitats varied considerably between reaches. However, a mesohabitat quality index, derivedfrom data on mesohabitat distribution and faunal communities, indicated that there was relativelylittle longitudinal variation in stream quality as defined by mesohabitat diversity andmacroinvertebrate community. Heavy modification of the channel banks, as indicated by RHS,suggested significant habitat impoverishment.
3. Simulations, using different environmental conditions, suggested that the mesohabitat qualityindex was a potentially useful measure of stream quality.
4. The combination of mesohabitat survey and RHS provided a more comprehensive view of thestream channel and banks than either technique used alone. The study indicated that managementefforts to rehabilitate impoverished reaches should be directed towards maximizing instreammesohabitat diversity and mitigating human impacts on the river margin.Copyright © 2000 John Wiley & Sons, Ltd.
KEY WORDS: mesohabitats; instream quality; macroinvertebrate sampling; River Habitat Survey
INTRODUCTION
The perception of freshwater quality depends on the main concerns of those observing or measuring it(Boon and Howell, 1997). Historically, freshwater biologists have assessed the quality of a stream bymeasuring the degree of pollution stress on instream biota. However, recently a broader range of issues,such as sustainability and diversity, have been included in assessment techniques. Thus, freshwater qualitycan now be defined as ‘the totality of features and characteristics of the water that bear upon its abilityto support an appropriate natural fauna, and to sustain legitimate uses’ (Pugh, 1997).
* Correspondence to: School of Geography, University of Birmingham, Birmingham, B15 2TT, UK.
Copyright © 2000 John Wiley & Sons, Ltd. Received 31 March 1999Accepted 7 December 1999
D. TICKNER ET AL.180
As part of this shift in perception, some freshwater ecologists have begun to use instream habitats asa tool for assessing the impact of human activities on the aquatic environment. Oviposition, feedingpreference and refuge from predation mean that the instream faunal assemblage of a site is influenced byits habitat structure. Moreover, most management activities in river systems, such as dredging, channelstraightening, flow regulation and water abstraction, involve either direct or indirect changes to habitat(Armitage and Cannan, 1998). Information on the composition and distribution of instream habitats iscrucial to understanding the impacts of any physical changes (Armitage et al., 1997). If a river or streamcan be described by its composite habitats, and provided the typical fauna of each habitat is known, theeffects on the fauna of management decisions and of natural variations in flow and channel morphologycan be assessed by studying the changes in habitat. This rationale underpins several stream assessmentand classification techniques which have been developed including River Habitat Survey (RHS) in the UK(Raven et al., 1997) and the Physical Habitat Simulation (PHABSIM) component of the Instream FlowIncremental Methodology (IFIM) in the USA (Stalnaker, 1994).
Mesohabitats are defined here as medium-scale habitats which arise through the interactions ofhydrological and geomorphological forces. In small rivers and streams, instream mesohabitats are discreteareas of habitat as viewed from the river bank, such as macrophyte stands and patches of gravel or silt.The mesohabitat concept was originally used by fisheries scientists in the USA (e.g. Kershner and Snider,1992; Kershner et al., 1992; Vadas, 1992) but researchers using macroinvertebrate sampling have recentlyadopted the approach to study the species assemblages of different patches of substrate (Armitage andPardo, 1995; Pardo and Armitage, 1997; Beisel et al., 1998). The approach has been used with somesuccess to illustrate downstream variation in fauna along streams and to show that water velocity, flowdynamics and the nature of the substrate are largely responsible for this variation. The mesohabitatapproach has been developed in parallel with the work of Harper (1992, 1995) and Harper and Smith(1995) on the ‘functional habitats’ of rivers in the UK and the Czech Republic. As in studies ofmesohabitats, the assumption was made that management and conservation of a reach is more practicalthan management of individual species. If each type of instream habitat is represented, then all the speciesthat the river can support are protected, providing there is no major change in water quality.
To date, research in this field has focused primarily on defining characteristic macroinvertebrateassemblages of different mesohabitat types and on seasonal changes in these communities. Consequently,there is a paucity of quantitative data on the distribution of the mesohabitats themselves. There may alsobe scope for combining mesohabitat survey with other habitat assessment techniques to provide a morecomprehensive picture of stream quality. RHS, which involves a simple system of recording instream andriparian physical habitat over 500 m reaches, is used to provide a comprehensive analysis of the riverchannel and banks for whole rivers or reaches (Raven et al., 1998). It facilitates comparisons of habitatquality between different rivers of similar nature using assessment measures including a scoring systemand it can also quantify the extent of human interference to the channel using a Habitat ModificationScore (HMS). Instream mesohabitat survey has the potential for complementing RHS by providing amore detailed picture, thereby enabling more informed decisions to be made on the management ofindividual streams or of stretches of rivers. By measuring the quantity of mesohabitats present in a streamand their quality (in terms of faunal assemblage) mesohabitat survey is potentially useful in deciding howto maximize biodiversity in freshwater environments.
The aims of this study were threefold:
1. To demonstrate the use of mesohabitat survey as a tool for assessing the meso-scale habitat diversityof any stream or river where benthic habitats can be easily surveyed and sampled.
2. To derive an index of instream habitat quality using data on the distribution and characteristicmacroinvertebrate fauna of mesohabitats.
Copyright © 2000 John Wiley & Sons, Ltd. Aquatic Conser6: Mar. Freshw. Ecosyst. 10: 179–196 (2000)

ASSESSING STREAM QUALITY 181
3. To assess the potential for ‘nesting’ habitat survey techniques to provide a comprehensive assessmentof habitat quality across the river channel and banks for management purposes.
MATERIALS AND METHODS
The study area
The Wool Stream runs for approximately 1.25 km from a spring to the south of the village of Wool inDorset, England (National Grid Reference SY 845 862) to its confluence with the River Frome nearBindon Abbey, 8 km west of Wareham (National Grid Reference SY 854 868). It is typical of the smallchalk streams found throughout southern England (see Berrie, 1992, for a description of chalk streamcharacteristics). The stream is underlain mainly by Tertiary deposits such as Reading Beds, London Claysand Bagshot Beds. Discharge is fairly stable at an annual mean of 0.05 m3 s−1 with peaks up to 0.2 m3
s−1 and troughs as low as 0.02 m3 s−1. Other physical characteristics are set out in Table 1.For the purposes of this study, the stream was divided into five reaches reflecting changes both in
physical characteristics and in instream and riparian management (Figure 1).
Cress Farm
Here the channel had been widened and separated to form two channels, one approximately 80 m long,the other 120 m. The banks of both arms were reinforced with concrete but sedimentation along thechannel edge meant that, in places, water width was significantly narrower than bankfull width. Althoughno longer actively cultivated, cress (Nasturtium officinale agg.) was abundant. Other macrophytes includedwater crowfoot (Ranunculus sp.), bur-reed (Sparganium sp.), rushes (Carex sp.) and grasses such asGlyceria fluitans (L.) R. Br.
Village
The stream showed signs of extensive modification in Wool. The banks had been resectioned andreinforced with concrete and the channel had been culverted in several places. Where the stream ran
Table 1. The physical characteristics of five sites on the Wool Stream based on the mean values ofparameters recorded at the five reaches in October 1995, April 1996, and July 1996a
PastureMeadowVillageCress Farm Shaded
20 16 15 14Altitude (m O.D.) 120.05 0.6 0.77 0.91Distance from source (km) 1.23
6.257.15.97.37.5Slope (m km−1)Water width (m) 4.5 1.7 2.6 2.5 2.1
171716119Mean depth (cm)333 33Surface velocity (cm s−1)
7.35 — — 7.72 7.13pHCalcium (mg L−1 Ca) 110 — — 111 —Conductivity (mS cm−1) 562 — — 473 607Chloride (mg L−1 Cl) —30.62 —36.9—
8.83 —Nitrate (mg L−1 N) — 7.997.55———Phosphate (mg L−1 P) 10.27
a Chemical data based on five samples taken from the Cress Farm in 1995 and three in 1996; threesamples taken from the Shaded reach in 1984; one sample taken from the Pasture in 1998. (Source:Armitage and Blackburn, 1998.)
Copyright © 2000 John Wiley & Sons, Ltd. Aquatic Conser6: Mar. Freshw. Ecosyst. 10: 179–196 (2000)

D. TICKNER ET AL.182
Figure 1. Map showing the five reaches of the Wool Stream, Dorset with a schematic example of a mesohabitat sketch map.
through a private garden an artificial island had been constructed. Although there were small patches ofRanunculus and some Carex and yellow flag iris (Iris pseudacorus L.), large sections had been cleared ofvegetation.
Meadow
This was the shortest reach and appeared to be the least disturbed. The channel meandered a little andriffles were present. However, there were signs that the stream had been diverted from its original courseand, subsequent to the mesohabitat survey, large amounts of Ranunculus were removed from the channelby local residents. Apart from Ranunculus, a variety of vegetation was present in, or marginal to, thewater including N. officinale, fool’s water-cress (Apium nodiflorum L. Lag.), lesser water-parsnip (Berulaerecta (Hudson) Colville), water mint (Mentha aquatica L.) and bittersweet (Solanum dulcamara L.).
Shaded
On leaving the meadow the stream flowed for 100 m between a road and a narrow belt of deciduouswoodland comprising a mixture of ash (Fraxinus excelsior L.), alder (Alnus glutinosa L.), hazel (Corylusa6ellana L.) and holly (Ilex aquifolium L.). This reach also appeared to be fairly undisturbed although asmall weir was present and it was apparent that the channel had once been straightened. Shading fromoverhanging trees meant that few macrophytes grew along this reach although I. pseudacorus, Ranunculusand N. officinale were occasionally present at low abundances.
Copyright © 2000 John Wiley & Sons, Ltd. Aquatic Conser6: Mar. Freshw. Ecosyst. 10: 179–196 (2000)

ASSESSING STREAM QUALITY 183
Pasture
The stream then ran through a short (40 m) stretch bordered by dense ruderal vegetation on either sidebefore entering a field. It flowed through the field for 250 m before entering a culvert and joining theRiver Frome a short distance downstream. This reach had been resectioned and embanked and there wasevidence of significant poaching of the banks by cattle. Macrophytes included abundant N. officinale, withmore occasional A. nodiflorum and B. erecta.
Mesohabitat classification and description
Fieldwork was carried out in June and July, 1997. A preliminary survey of the Wool Stream was carriedout and, from this, 12 instream mesohabitats were proposed. However, as five of these were present onlyoccasionally and in small amounts, only seven were analysed in full.
Emergent 6egetation
Vegetation rooted in the channel including inundated marginals, but not dominated by (i.e. B50%) N.officinale.
Pebble/gra6el
Substrate comprising particles with an estimated diameter of 2–64 mm.
Mixed sand/silt/gra6el
Substrate comprising a combination of sand, silt and gravel with no single type dominant.
Silt
Substrate comprising particles with a estimated diameter of B0.06 mm (distinguished from sand by itsdarker colour).
Sand
Substrate comprising particles with an estimated diameter of 0.06–2 mm.
Ranunculus
Instream beds of Ranunculus spp.
Nasturtium
Vegetation rooted in the channel comprising mostly (i.e. \50%) N. officinale. This was classifiedseparately because of its abundance and its presence in distinct monospecific stands.
Field procedures
Mesohabitat sur6ey
The stream was divided into 20 m lengths, each of which was marked out using range poles and mappedon a separate sheet on which grid squares marked out 1 m intervals. To start, a surveyor stood on thebank at the downstream limit of the length in question and marked on the sheet the estimated width ofthe stream and the area of each instream mesohabitat present in a 1 m wide cross-section facing him. The
Copyright © 2000 John Wiley & Sons, Ltd. Aquatic Conser6: Mar. Freshw. Ecosyst. 10: 179–196 (2000)

D. TICKNER ET AL.184
surveyor then moved along another 1 m and repeated the process; this continued until the whole 20 mlength had been mapped. A new 20 m length was then marked out and mapped in the same way. Thistechnique was simple and enabled the entire stream to be mapped in approximately 5 days. An exampleof a completed sketch map is shown in Figure 1.
Macroin6ertebrate sur6ey
Instream faunal samples were taken using a pond net (900 mm mesh, 230×255 mm frame, 275 mm bagdepth). Mesohabitats were disturbed by kicking and/or sweeping for a period of 15 s (Wright et al., 1992).Three replicate samples were taken from each mesohabitat in each reach. In order to avoidpseudoreplication, replicates were taken from different mesohabitat patches within the same reach. Aftereach sample the net was rinsed carefully to avoid cross-contamination. Samples were preserved in 5%formalin solution, sorted into 70% alcohol and identified to family level.
Ri6er Habitat Sur6ey
RHS was carried out using the methodology set out in the 1995 RHS Field Methodology Guidance Manual(National Rivers Authority, 1995). Two 500 m lengths were delineated and for each length informationon grid references, altitude, slope, solid and drift geology, mean annual flow and distance from source wasgathered from maps and other records. During field survey, information about channel banks and theriparian corridor to a distance of 50 m either side of the stream was recorded on a standard form usinga system of two-lettered codes. Channel substrate type, presence of key habitat features, aquaticvegetation types, bank vegetation structure and artificial modifications were recorded at 10 equidistantspot checks along each 500 m length. Other features, such as bankfull and water width, bankfull heightand water depth were measured once per reach at a selected location. A ‘sweep-up’ along the whole 500 mlength ensured that the presence of important features, such as pools and riffles, occurring between spotchecks was noted. Once the two 500 m lengths had been surveyed, a second accredited surveyor walkedthe stream and checked the completed record sheets. This served as a quality control measure and helpedto resolve problems encountered by the first surveyor.
Data analysis
The information on the sketch maps was converted to quantitative data using the ARC/INFOGeographical Information System (Environmental Systems Research Institute Inc., CA, USA, copyright1991). The maps were digitized and the total area of each mesohabitat in each segment was calculated. Itwas then a simple task to obtain total mesohabitat areas, which were converted into proportional figuresfor each reach. To examine the faunal similarities between the seven mesohabitats and five reaches, aDetrended Correspondence Analysis (DCA) was performed on the sample invertebrate data, includingeach replicate separately so as to investigate within-mesohabitat and within-reach variability. The analysiswas performed using the DCA option of the Canonical Community Ordination (CANOCO) program (terBraak, 1988). The community structure of reaches and mesohabitats was examined and compared byvisual interpretation of an ordination plot of first and second DCA axis scores and by comparison of thevariance of scores in each sample group. Similarities between mesohabitats and between reaches were alsoassessed by calculation of a simple similarity index showing the proportion of taxa shared betweenmesohabitats and reaches. Calculations were based on total taxon lists from all replicates for eachmesohabitat and reach.
An index of mesohabitat quality was calculated incorporating faunal richness and a measure of thepreference of fauna for the mesohabitat in question. For a given mesohabitat, the abundance of eachtaxon present was divided by the total abundance of that taxon recorded across all mesohabitats. This
Copyright © 2000 John Wiley & Sons, Ltd. Aquatic Conser6: Mar. Freshw. Ecosyst. 10: 179–196 (2000)
ASSESSING STREAM QUALITY 185
gave a measure (between 0 and 1) of the relative preference of each taxon for each mesohabitat. Therelative preference values of all taxa within the mesohabitat were then totalled, to give the MesohabitatQuality Score (MH). This score increased with both the number of taxa present and their individualrelative preference values:
MH=%N t
abt
%N h
abt
where MH is the Mesohabitat Quality Score; Nh is the total number of mesohabitats present in the reach;Nt is the number of invertebrate taxa in the mesohabitat; abt is the abundance of each taxon t in eachmesohabitat.
For a given mesohabitat, the theoretical maximum score was equal to the number of taxa present inthat mesohabitat. This maximum score could be achieved only in the unlikely situation where all taxa inthe reach were recorded only in that mesohabitat. Thus, each would have a relative preference value of1.
A reach Mesohabitat Quality Score (MR) was then derived from the Mesohabitat Quality Scores andthe proportional mesohabitat areas in each reach, using the following formula:
MR=1− %N h
ph2
MH
where ph is the proportion of each mesohabitat h in the reach.This formula was derived such that MR should generally be higher where there were even proportions
of all mesohabitats in the reach, but was also weighted towards larger proportions of mesohabitats withhigher Mesohabitat Quality Scores (MH). For a given reach, the optimum proportion of each mesohabitatcould be calculated by dividing its Mesohabitat Quality Score by the sum of the Mesohabitat QualityScores for the whole reach:
ph (optimum)=MH
%N h
MH
Note that the denominator (the sum of all the MH values) was equal to the total number of taxa recorded(NT). Thus, the theoretical maximum reach Mesohabitat Quality Score was given by
MRmax=1−
1NT
This theoretical maximum should normally be very close to 1 (e.g. 0.98 if there are 50 taxa). Thetheoretical minimum would occur where an entire reach consisted only of the mesohabitat attaining thelowest MH score:
MRmin=1−
1MHmin
where MHminis the lowest of the individual Mesohabitat Quality Scores.
Finally, in order to test the applicability of the Mesohabitat Quality Score to different instreamconditions, hypothetical changes were proposed to the mesohabitat composition of the Wool Stream andMR predicted for each scenario. It should be noted that, for the purposes of this analysis, the predictionsdid not consider variations in relative macroinvertebrate abundance due to water quality, mesohabitat sizeor the combined effects of several adjacent mesohabitats.
Copyright © 2000 John Wiley & Sons, Ltd. Aquatic Conser6: Mar. Freshw. Ecosyst. 10: 179–196 (2000)
D. TICKNER ET AL.186
RHS analysis
Both HMS and Habitat Quality Assessment (HQA) values were calculated to give an indication of theextent of modification and the physical habitat quality of each length. HMS values were derived for each500 m length by allocating points for each unnatural feature, such as culverts, reinforced banks or weirs.The higher the score, the more modified the channel. HQA scores were calculated by attributing pointsfor the presence, extent and diversity of ‘natural’ features (Raven et al., 1998). Comparison of HMS andHQA values for the Wool Stream with other rivers in the Frome/Piddle catchment provided a relativeassessment of physical habitat quality.
RESULTS
Mesohabitat survey
Mesohabitat characteristics
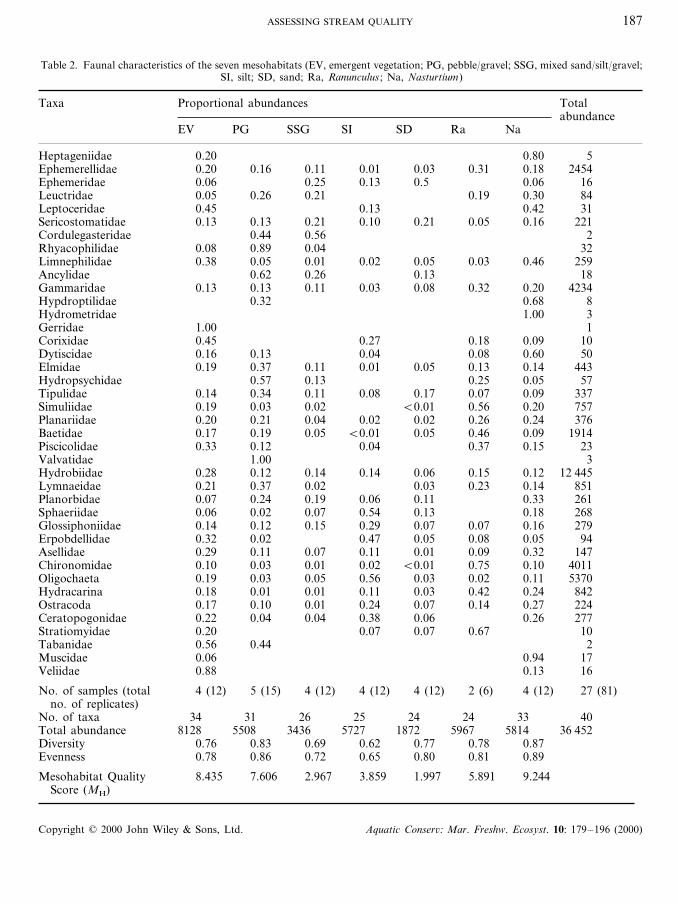
Table 2 shows that, in total, 40 taxa were found along the stream. Taxon richness varied between theseven mesohabitats with only 24 taxa present in sand but 34 occurring in emergent vegetation. A similarpattern could be seen with total faunal abundance ranging from 1872 individuals in sand to 8128individuals in emergent vegetation. The picture was slightly different once diversity and evenness werecalculated. Silt represented the lowest scores for these measures mainly because, in most reaches, thismesohabitat was dominated by large numbers of certain taxa, notably Hydrobiidae and Oligochaeta. Incontrast Nasturtium and pebble/gravel mesohabitats seemed most diverse due to their relatively hightaxon richness and the lack of any truly dominant families.
The first two axes of the Detrended Correspondence Analysis had eigenvalues of 0.13 and 0.09 andaccounted for a total of 25% of the variance in the taxon data (these values are low but not unusually sowhere there is considerable variability in taxon composition between small samples). Subsequent axes hadmuch smaller eigenvalues and were ignored. Figure 2 displays the results of the analysis as ordinationplots of axis 2 versus axis 1 scores, with the distribution of sample points (a) by mesohabitat and (b) byreach highlighted. From the ordination diagrams it is apparent that, for mesohabitat sample groups, thedistance between centroids is greater and overlap between groups smaller than for reach sample groups.This indicates greater and more consistent differences in community composition between mesohabitatsthan between reaches. The first axis most clearly distinguishes mesohabitats of different substrate type,from coarse-grained pebbles/gravel on the left to fine-grained silt on the right. The second axis separatesthe vegetated mesohabitats (bottom) from bare substrates (top). Reach sample groups reflect thedominant influence of mesohabitat type, with the Cress Farm the only reach clearly separated (on thesecond axis), due to the dominance of vegetated mesohabitats and associated silts. The spread of replicatesample points is also notably smaller on the first axis within each mesohabitat sample group than withineach reach sample group, indicating greater heterogeneity of community composition within reaches thanwithin mesohabitats. This difference becomes more apparent on examination of the variances of scoreswithin each sample group. Comparing mesohabitat and reach sample groups, these are similar on thesecond axis, but the variances of axis 1 scores within mesohabitat sample groups ranged from 0.016(Ranunculus) to 0.056 (pebbles/gravel), whilst within reach sample groups they ranged from 0.103(Village) to 0.199 (Pasture). The greater variances of reach sample group scores again reflects the rangeof community types associated with different substrate mesohabitats within these groups.
Investigation of taxon similarity between mesohabitats and between reaches indicated that there weremany ubiquitous taxa found across all mesohabitats and all reaches. Oligochaetes were found in everyreplicate sample, and 13 out of 40 taxa were present in at least two thirds of replicate samples. However,
Copyright © 2000 John Wiley & Sons, Ltd. Aquatic Conser6: Mar. Freshw. Ecosyst. 10: 179–196 (2000)
ASSESSING STREAM QUALITY 187
Table 2. Faunal characteristics of the seven mesohabitats (EV, emergent vegetation; PG, pebble/gravel; SSG, mixed sand/silt/gravel;SI, silt; SD, sand; Ra, Ranunculus ; Na, Nasturtium)
Proportional abundances TotalTaxaabundance
PG SSG SI SD Ra NaEV
Heptageniidae 0.80 50.200.20 0.16 0.11 0.01 0.03 0.31 0.18 2454Ephemerellidae
0.25Ephemeridae 0.13 0.5 0.06 160.060.26 0.210.05 0.19 0.30 84Leuctridae
0.45Leptoceridae 0.13 0.42 310.13 0.21 0.10 0.21 0.05Sericostomatidae 0.16 2210.130.44 0.56Cordulegasteridae 2
0.08Rhyacophilidae 0.89 0.04 320.05 0.01 0.02 0.05 0.03 0.46 259Limnephilidae 0.380.62 0.26 0.13Ancylidae 180.13 0.11 0.03 0.08 0.32Gammaridae 0.20 42340.130.32 0.68 8Hypdroptilidae
Hydrometridae 1.00 31.00Gerridae 10.45Corixidae 0.27 0.18 0.09 100.16Dytiscidae 0.13 0.04 0.08 0.60 50
0.37 0.11 0.01 0.050.19 0.13 0.14 443ElmidaeHydropsychidae 0.57 0.13 0.25 0.05 57
0.34 0.11 0.08 0.17 0.07Tipulidae 0.09 3370.140.03 0.02 B0.010.19 0.56Simuliidae 0.20 757
0.20Planariidae 0.21 0.04 0.02 0.02 0.26 0.24 3760.19 0.05 B0.01 0.05 0.46 0.09 1914Baetidae 0.170.12 0.040.33 0.37 0.15 23Piscicolidae1.00Valvatidae 30.12 0.14 0.14 0.060.28 0.15 0.12 12 445Hydrobiidae
0.21Lymnaeidae 0.37 0.02 0.03 0.23 0.14 8510.24 0.19 0.06 0.110.07Planorbidae 0.33 261
0.06Sphaeriidae 0.02 0.07 0.54 0.13 0.18 2680.14Glossiphoniidae 0.12 0.15 0.29 0.07 0.07 0.16 279
0.02 0.47 0.050.32 0.08 0.05 94Erpobdellidae0.29Asellidae 0.11 0.07 0.11 0.01 0.09 0.32 147
0.03 0.01 0.02 B0.01 0.75Chironomidae 0.10 40110.100.03 0.05 0.56 0.030.19 0.02Oligochaeta 0.11 5370
0.18Hydracarina 0.01 0.01 0.11 0.03 0.42 0.24 8420.10 0.01 0.24 0.07 0.14Ostracoda 0.27 2240.170.04 0.04 0.38 0.060.22Ceratopogonidae 0.26 277
0.20Stratiomyidae 0.07 0.07 0.67 100.44Tabanidae 20.56
0.06Muscidae 0.94 170.88Veliidae 0.13 16
4 (12) 5 (15) 4 (12) 4 (12) 4 (12) 2 (6) 4 (12) 27 (81)No. of samples (totalno. of replicates)
31 26 25 24No. of taxa 2434 33 405508 3436 5727 1872 5967Total abundance 5814 36 4528128
0.83 0.69 0.62 0.770.76 0.78 0.87DiversityEvenness 0.78 0.86 0.72 0.65 0.80 0.81 0.89
8.435 7.606 2.967 3.859 1.997 5.891 9.244Mesohabitat QualityScore (MH)
Copyright © 2000 John Wiley & Sons, Ltd. Aquatic Conser6: Mar. Freshw. Ecosyst. 10: 179–196 (2000)

D. TICKNER ET AL.188
Figure 2. Detrended Correspondence Analysis plot of Wool Stream segments approximately clustered according to (a) mesohabitattype (EV, emergent vegetation; PG, pebble/gravel; M, mixed sand/silt/gravel; SI, silt; SD, sand; RN, Ranunculus ; and NA,Nasturtium); and (b) reach (C, Cress Farm; V, Village; M, Meadow; S, Shaded; and P, Pasture). The centroid (mean axis 1 and axis2 scores) of each mesohabitat or site sample group is shown as a coded circle, and the location of each replicate sample point
indicated by a line drawn from the centroid.
community types were much more distinct within mesohabitats than within reaches with 24 taxa beingfound in all reaches, compared with only 15 in all mesohabitats. The percentage of shared taxa betweeneach mesohabitat and all alternative mesohabitats was between 66% (Ranunculus) and 69% (Nasturtium,sand and emergent vegetation). The percentage of shared taxa between each reach and all alternativereaches ranged from 75% (Cress Farm and Meadow) and 79% (Village).
Reach characteristics
Figure 3 shows the observed proportions of each of the seven major mesohabitats in each of the fivereaches and the respective reach Mesohabitat Quality Scores (MR). With regard to the former, there werenotable differences in the mesohabitat composition of each reach. The Cress Farm was dominated byNasturtium with pebble/gravel and silt the only other mesohabitat types present. In contrast the Meadowconsisted of a mosaic of all seven mesohabitats with emergent vegetation, Nasturtium and pebble/graveldominant. The removal of instream macrophytes in the Village and the reduced light in the Shaded reachwere reflected in the increased proportions of mineral substrates. In the Pasture, where the channelgradient was lowest, emergent vegetation and Nasturtium were dominant. Ranunculus was present only inthe Village and the Meadow.
Table 3 illustrates the changes in instream quality between the reaches using taxon richness, totalabundance, diversity, evenness and reach Mesohabitat Quality Score (MR) as measures. The Meadow wasthe most valuable reach for macroinvertebrates with taxon richness, total abundance and MR reachingmaximum levels there. All seven mesohabitats were present here, with the three mesohabitats whichattained the highest MH scores dominant.
Interestingly, while taxon richness was lowest in the Cress Farm, diversity and evenness were highest.The lowest MR value occurred in the Village reach where mixed sand/silt/gravel (with a low MH value)was an important mesohabitat and Nasturtium was absent. Another notable feature of Table 3 is thenarrow range of MR scores with all reaches scoring close to the theoretical maximum. This, together withthe considerable degree of overlap between reaches on the ordination in Figure 2b, indicates that instreammesohabitat quality was fairly good along the entire length of the stream.
Copyright © 2000 John Wiley & Sons, Ltd. Aquatic Conser6: Mar. Freshw. Ecosyst. 10: 179–196 (2000)

ASSESSING STREAM QUALITY 189
Figure 3. Distribution of mesohabitats in each reach of the Wool Stream and for simulated conditions (top) with correspondingreach Mesohabitat Quality Scores (MR) (bottom).
Copyright © 2000 John Wiley & Sons, Ltd. Aquatic Conser6: Mar. Freshw. Ecosyst. 10: 179–196 (2000)

D. TICKNER ET AL.190
Table 3. Summary characteristics of the five reaches of the Wool Stream
Cress Farm Village Meadow Shaded Pasture
No. of taxa 28 31 38 34 31Total abundance 1603 6007 14835 7651 6369Diversity 0.88 0.76 0.86 0.77 0.69Evenness 0.92 0.79 0.88 0.80 0.71No. of habitats 3 5 7 6 6MR 0.946 0.941 0.969 0.948 0.956
Predicted response of Mesohabitat Quality Scores to mesohabitat change
Figure 3 illustrates predicted MR scores for each reach under two hypothetical mesohabitat changescenarios: (1) where all vegetative mesohabitats have been removed and the proportions of the remainingmesohabitats have increased proportionally; and (2) where the proportions of vegetative mesohabitatshave been doubled and those of other mesohabitats decreased proportionally.
Figure 3 also shows the predicted optimum mesohabitat proportions for instream faunal diversity forany given reach of the Wool Stream (ph (optimum)). As can be seen, MR is maximized where all mesohabitatsare present but with higher proportions of those mesohabitats which attained high MH values, i.e.Nasturtium, emergent vegetation and pebble/gravel.
Under the first scenario, where vegetation was removed, in all cases MR decreased. This was mainly dueto the reduction in the number of mesohabitats present. The fact that two of the vegetative mesohabitats,Nasturtium and emergent vegetation, tended to obtain high MH scores, was also important. The case inthe Pasture reach was an extreme example where, prior to ‘removal’, the proportion of vegetation in thereach was high and the remaining mineral mesohabitats were those which attained low MH scores, i.e.sand, mixed sand/silt/gravel and silt. Conversely, the Village and Shaded reaches, where the originalproportions of vegetation were low and a considerable amount of high-scoring pebble/gravel was present,showed relatively little change in instream mesohabitat quality.
The picture was less clear under the second scenario, where the proportion of vegetative mesohabitatswas doubled. The Village and Shaded reaches again responded with an increase in MR because theincreased areas of vegetative mesohabitats scored more highly than the mineral substrates which theyreplaced. The Cress Farm, Meadow and Pasture reaches saw a decrease in instream mesohabitat quality.In the latter two reaches this was almost certainly due to a reduction in mesohabitat diversity as theincrease in the area of vegetation led to a total exclusion of some mineral mesohabitats.
River Habitat Survey
Table 4 shows the output from the RHS analysis. The impact of human activities along the entire lengthof the stream was reflected in the HMS values. Rivers which score 0–2 in this category can be regardedas semi-natural and, at the other end of the scale, those which score more than 44 are heavily modified(Raven et al., 1998). Measured on this scale, it was clear that the channel of the Wool Stream includingits banks has been subject to major interference. Length 1 in particular scored very highly due to extensivebank reinforcement, the construction of small weirs and the presence of several small culverts.
Comparison of the Wool Stream with other streams in the Frome/Piddle catchment showed that onlyone (Piddle 1) attained a HQA score lower than the Wool Stream lengths. Another, the River Cerne,attained the same score as Length 2 of the Wool Stream. As with the HMS analysis, this suggested thatthe Wool Stream offered a relatively poor physical environment. Analysis of the individual scores for eachHQA category suggests that the main reason for this was modification of the channel banks. For instance,
Copyright © 2000 John Wiley & Sons, Ltd. Aquatic Conser6: Mar. Freshw. Ecosyst. 10: 179–196 (2000)

ASSE
SSING
STR
EA
MQ
UA
LIT
Y191
Copyright
©2000
JohnW
iley&
Sons,L
td.A
quaticC
onser6:M
ar.F
reshw.
Ecosyst.
10:179
–196
(2000)
Table 4. Output from RHS analysis showing HMS for the two lengths of the Wool Stream and HQA scores in relation to similarly classified streams in theFrome/Piddle catchment
Total HQAHQA componentHMS
BankBank Land-useChannel Trees Land-useChannel Specialvegetationvegetation (5 m) (50 m)
8 3Sydling Water 7 0 0 4111 5 77 0 4 0 05 273Piddle 1 8
12 2 10 0 5 49Char 12 6 210 2 10 0 54 49612Piddle 210 0 5S. Winterbourne 0 0 3913 5 67 1 5 0 54 37411Cerne
10 4 11 0 20 72Corfe 13 8 69 2 10 0 155 60613Empool Bottom
11 1 10 0 10 53Bride 9 7 58 4 10 0 104 453Sherford 68 0 2 0 0 30Wool Stream 1 136 11 3 67 0 4 0 5 377Wool Stream 2 34 311
D. TICKNER ET AL.192
widespread bank resectioning and reinforcement had resulted in a lack of natural bankside features suchas point bars and, consequently, a low score for bank features. Similarly, a dearth of bankside vegetation,especially trees, in all except the Shaded reach meant that the component scores under these headings werepoor. In contrast, the instream environment appeared to be relatively diverse with comparatively highvalues for channel features and channel vegetation.
DISCUSSION
Mesohabitat survey
Previous studies of mesohabitats have used mesohabitat classifications different from that used here.Armitage and Cannan (1998), in a study of the River Frome in Dorset, used six mesohabitats some ofwhich were in common with this project: silt, sand, main channel gravel, riffle gravel, Ranunculus andemergent vegetation. Harper and Smith (1995) suggested a standard classification of 16 functional habitats.Hall (1997) concluded that the seven mesohabitats analysed in the Wool Stream could be amalgamatedinto three larger mesohabitat groups reflecting faunal habitat preferences within reaches: vegetativemesohabitats (emergent vegetation, Nasturtium and Ranunculus), large-particle mineral substrates(pebble/gravel and mixed sand/silt/gravel) and small-particle substrates (silt and sand). While there is scopefor discussion as to their definition, standardization would be useful if a habitat-based approach to streamassessment is to become more widely used. Use of a simplified classification would undoubtedly makefieldwork and data processing quicker and easier and could be justified in future surveys of the WoolStream. However, this approach would probably not be appropriate for studies in longer rivers as it wouldprovide less information on fine-scale changes in habitat, defeating the object of mesohabitat survey whichis to provide more detailed information on instream habitat and macroinvertebrate diversity. A balancemust be struck between speed and efficiency of survey and the scale of study. In practice, preliminarysurvey of the study site, as carried out on the Wool Stream, can help to refine the habitat list for a givenriver and maximize efficiency. Similarly, a preliminary analysis of faunal composition of mesohabitats canhelp to identify those which support similar communities. For instance, in the case of the Wool Streamthis might have led to the amalgamation of sand and mixed sand/silt/gravel.
Harper and Smith (1995) used several measures of habitat diversity in their study. They found thathabitat heterogeneity (measured using the Shannon–Wiener Index) and richness (the number of habitatspresent) were the aspects of diversity which changed most with cross-sectional variables. The MesohabitatQuality Score developed here provides a useful alternative approach because it combines, simply andeffectively, measures which are sensitive to both physical disturbance of habitat (ph) and changes in faunaldiversity (MH). The output, a single value for each reach (MR) which can be disaggregated into componentsfor individual mesohabitats, can be used to assess the contribution of each mesohabitat to instream habitatand macroinvertebrate diversity and to compare the habitat and fauna of different reaches. Moreover,actual mesohabitat distributions in a reach or stream can be compared with theoretical optimumdistributions and the impact of changes in mesohabitat proportions can be easily predicted.
In this study, mesohabitat survey and analysis showed that despite variation in the mesohabitatcomposition of each reach, the scores attained by the Wool Stream were close to the theoretical maximumthroughout. The lack of variation in reach Mesohabitat Quality Scores was largely due to the similarityin faunal composition along its length. This is not surprising in such a short lowland stream. Thesimulations of hypothetical mesohabitat conditions indicated that while all reaches of the Wool Streamwould score highly despite considerable changes in the relative proportions of mesohabitats, the highestreach Mesohabitat Quality Scores were obtained where all mesohabitats were present and the proportionof those with high MH scores was increased. Thus, instream quality could be maximized by directingmanagement efforts towards an increase in mesohabitat diversity wherever possible and by facilitating anincrease in the coverage of high scoring mesohabitats.
Copyright © 2000 John Wiley & Sons, Ltd. Aquatic Conser6: Mar. Freshw. Ecosyst. 10: 179–196 (2000)

ASSESSING STREAM QUALITY 193
Conservation and management applications: nesting mesohabitat survey and RHS
RHS was used to quantify the physical habitat quality across the channel and banks and the extent ofhuman impact. The HQA score should be treated with caution though, as assessment of the scoresconfirmed the conclusion of the instream mesohabitat survey that the channel physical habitat was quitediverse. There was little scope for using RHS to differentiate within-stream variation other than bycomparison of HQA and HMS for the two reaches but comparison with the characteristics of otherstreams should help to refine these applications in future.
By including the channel banks in stream assessment, RHS offers a more comprehensive approach toassessment of habitat diversity than mesohabitat survey. Through classification of rivers, quantification ofthe degree of modification and analysis of the separate components of the HQA in comparison with thoseof other watercourses of the same type, it also facilitates determination of the primary causes ofdegradation. However, while it can relate physical habitat features and impacts at the spot-check level (i.e.every 50 m) and provides an impression of overall change at the 500 m scale, the RHS method alone doesnot give such detailed information as instream mesohabitat survey on the impacts of changes in physicalstructure on instream habitat quality.
Although the whole of the Wool Stream was surveyed for this study, it should be possible to delineateand survey typical reaches, possibly in conjunction with RHS, for assessment of longer and larger rivers.As well as a standard habitat classification, there is scope for adopting a standard mesohabitat/functionalhabitat methodology taking account of previous work in the field. There is considerable potential forundertaking a standard mesohabitat survey methodology with RHS when required by circumstances andsurvey objectives. At present, instream habitat is assessed during RHS at 50 m intervals but only thepredominant flow, channel substrate and vegetation types are recorded. For more detailed studies,information on all main mesohabitats would be required. Armitage and Pardo (1995) suggested that sucha technique should include a subjective judgement of the range and type of mesohabitats present, faunalsampling of each mesohabitat and mapping of mesohabitat distribution in each stream segment. In thelight of the Wool Stream study, it would be useful to add to this procedure the following steps:
1. Once the distribution of mesohabitats has been mapped, quantify this information using GIS or asimilar method (a simple, but reasonably accurate, analysis can be obtained by counting grid squareson a sketch map).
2. Use the Mesohabitat Quality Score to assess the instream habitat and macroinvertebrate diversity ofeach reach.
3. Combine this method with RHS to provide a broader picture of the physical habitat of both channeland banks and a means of comparison with other, similar streams.
As discussed above, the Mesohabitat Quality Score does not at present consider variations in mesohabitatstructure caused by changes in water quality. Indeed the method has yet to be tested on streams whichhave been affected by pollution. Consequently it is only possible to speculate on the effects on the indexof changes in water quality. Poor water quality can affect the faunal assemblages of different mesohabitatsin various ways depending on the nature of the pollutant. Conversely, it is conceivable that water qualitymight be improved through changes in the proportion of instream mesohabitat composition. For example,in a stream mildly contaminated with organic pollution, there might be some merit in creating artificialriffles in order to maximize oxygenation rates. In any case, a mesohabitat-based approach offers anadditional component to the available environmental assessment techniques such as RHS, SERCON(System for Evaluating Rivers for Conservation—Boon et al., 1997) and RIVPACS (River InvertebratePrediction and Classification System—Wright et al., 1993).
Copyright © 2000 John Wiley & Sons, Ltd. Aquatic Conser6: Mar. Freshw. Ecosyst. 10: 179–196 (2000)

D. TICKNER ET AL.194
Future research
In recent years there has been an increasing interest in habitat prediction and related matters (Leclerc etal., 1996). Studies have examined mapping habitat over small and large scales, the hydraulics of habitattypes, and habitat response to flow change (see Hardy, 1998 for a review of this subject area). Forcompleteness, future surveys should consider mesohabitat size and the nature of adjacent mesohabitats asinfluences on instream habitat and macroinvertebrate diversity. It would also be useful to explore therelationship between mesohabitat distribution and physical parameters such as flow velocity, discharge,channel morphology and chemistry. These studies could usefully assess the degree of downstream (i.e.between reach) and smaller scale (within reach) variation in mesohabitats on a variety of larger and lessdisturbed streams and rivers.
In order to improve the use of the mesohabitat approach it is important that their occurrence ispredictable. That is to say, the physical conditions that give rise to a specific mesohabitat need to bedefined in a range of channel and river types. Physical measurements have been used to identify pools,riffles and runs (Jowett, 1993) and attempts have been made to translate channel morphology intohydraulic habitat (Rowntree and Wadeson, 1996) At rather more focused scales the hydraulics associatedwith specific habitats have been examined (Padmore, 1998; Kemp et al., 1999). Despite these studies,understanding of mesohabitat distribution is still incomplete. However, the rapid advances in mappingtechnology and the ability to record information on bed topography (Hardy, 1998) now provide a meansof describing habitat in relation to landscape features along the entire lengths of both large and smallrivers. This array of approaches should eventually provide the information needed to predict theoccurrence and distribution of mesohabitats. As discussed above, such information could in turn be usedin conjunction with data from habitat assessment methods currently in use in the UK, such as RHS andSERCON. These methodologies could be used to identify categories of unstressed natural/semi-naturalsites whose mesohabitat composition and distribution could be used as target habitat objectives.
The importance of linking instream habitats with flow type and faunal composition has been recognized(Armitage and Pardo, 1995; Harper et al., 1995; Newson et al., 1998) as central to further developmentof successful predictive tools for environmental management of rivers from source to mouth. Downstreamvariation in faunal assemblages is related to environmental factors (Hynes, 1970; Vannote et al., 1980).Determination of the major influences on instream mesohabitat distribution would complement thisknowledge and, by providing answers to ‘what if . . . ?’ questions (such as, ‘what would happen toinstream habitats if channel cross-section morphology was altered?’), would increase the viability of themesohabitat concept as a predictive tool for stream management.
ACKNOWLEDGEMENTS
The authors would like to thank Caroline Cannan for advice and help with fieldwork; John Blackburn for help withmacroinvertebrate identification; Peter Scarlett and Michael Gravelle for advice on RHS; and Jim Smith and KaySymes for their ARC/INFO expertise. Discharge data for the Wool Stream was provided by the EnvironmentAgency. The authors are also grateful to P. Boon, P. Raven and an anonymous reviewer who provided helpfulcomments on a draft of the paper. This study was partly funded by the Natural Environment Research Council.
REFERENCES
Armitage PD, Blackburn JH. 1998. The environmental quality of a small spring-fed watercourse, the Wool Stream(Dorset), assessed with macroinvertebrate data. Proceedings of the Dorset Natural History and ArchaeologicalSociety 120: 77–84.
Armitage PD, Cannan CE. 1998. Nested multi-scale surveys in lotic systems-tools for management. In Ad6ances inRi6er Bottom Ecology, Bretschko G, Helesic J (eds). Backhuys Publishers: Leiden, The Netherlands; 293–314.
Copyright © 2000 John Wiley & Sons, Ltd. Aquatic Conser6: Mar. Freshw. Ecosyst. 10: 179–196 (2000)

ASSESSING STREAM QUALITY 195
Armitage PD, Cannan CE, Symes KL. 1997. Appraisal of the use of ecological information in the management of lowflows in rivers. R&D Technical Report W72, Environment Agency, Bristol.
Armitage PD, Pardo I. 1995. Impact assessment of regulation at the reach level using macroinvertebrate informationfrom mesohabitats. Regulated Ri6ers: Research & Management 10: 147–158.
Beisel JN, Usseglio-Polatera P, Thomas S, Moreteau JC. 1998. Effects of mesohabitat sampling strategy on theassessment of stream quality with benthic invertebrate assemblages. Archi6 fur Hydrobiologie 142: 493–510.
Berrie AD. 1992. The chalk stream environment. Hydrobiologia 248: 3–9.Boon PJ, Howell DL (eds). 1997. Freshwater Quality: Defining the Indefinable?. The Stationery Office: Edinburgh.Boon PJ, Holmes NTH, Maitland PS, Rowell TA, Davies J. 1997. A system for evaluating rivers for conservation
(SERCON): development, structure and function. In Freshwater Quality: Defining the Indefinable?, Boon PJ,Howell DL (eds). The Stationery Office: Edinburgh; 299–326.
Hall KA. 1997. An investigation of the spatial variation in instream mesohabitat communities of the Wool Stream,Dorset, MSc Thesis. Lancaster University, UK.
Hardy TB. 1998. The future of habitat modeling and instream flow assessment techniques. Regulated Ri6ers: Research& Management 14: 405–420.
Harper DM. 1995. River bottom habitats: biological reality and practical value in river management. Folia FacultatisScientarium Naturalium Uni6ersitatis Masarykianae Brunensis, Biologia 91: 35–45.
Harper DM. 1992. Habitats as the building blocks for river conservation assessment. In Ri6er Conser6ation andManagement, Boon PJ, Calow P, Petts GE (eds). John Wiley: Chichester; 311–319.
Harper DM, Smith CD. 1995. Building blocks for river conservation: the biological reality and practical value ofhabitats in British rivers. R & D Note 417, National Rivers Authority, Bristol.
Harper DM, Smith CD, Barham P, Howell R. 1995. The ecological basis for the management of the natural riverenvironment. In The Ecological Basis for Ri6er Management, Harper DM, Ferguson A (eds). John Wiley:Chichester; 59–78.
Hynes HBN. 1970. The Ecology of Running Waters. Liverpool University Press: Liverpool.Jowett IG. 1993. A method for objectively identifying pool, run and riffle habitats from physical measurements. New
Zealand Journal of Marine and Freshwater Research 27: 241–248.Kemp JL, Harper DM, Crosa GA. 1999. A morphological and hydraulic approach to river habitat restoration.
Aquatic Conser6ation: Marine and Freshwater Ecosystems 9: 159–178.Kershner JJ, Snider WM. 1992. Importance of a habitat level classification system to design instream flow studies. In
Ri6er Conser6ation and Management, Boon PJ, Petts GE, Calow P (eds). John Wiley: Chichester; 179–194.Kershner JL, Snider WM, Turner DM, Moyle PB. 1992. Distribution and sequencing of mesohabitats: are there
differences at the reach scale? Ri6ers 3: 179–190.Leclerc M, Capra H, Valentin S, Boudreault A, Cote Y (eds). 1996. Ecohydraulics 2000. Proceedings of the Second
IAHR Symposium on Habitat Hydraulics, Quebec.National Rivers Authority. 1995. Ri6er Habitat Sur6ey: Field Methodology Guidance Manual. NRA: Bristol.Newson MD, Harper DM, Padmore CL, Kemp JL, Vogel B. 1998. A cost-effective approach for linking habitats,
flow types and species requirements. Aquatic Conser6ation: Marine and Freshwater Ecosystems 8: 431–446.Padmore CL. 1998. The role of physical biotopes in determining the conservation status and flow requirements of
British rivers. Aquatic Ecosystem Health and Management 1: 25–35.Pardo I, Armitage PD. 1997. Species assemblages as descriptors of mesohabitats. Hydrobiologia 344: 111–128.Pugh KB. 1997. Organizational use of the term ‘freshwater quality’ in Britain. In Freshwater Quality: Defining the
Indefinable?, Boon PJ, Howell DL (eds). The Stationery Office: Edinburgh; 9–23.Raven PJ, Fox P, Everard M, Holmes NTH, Dawson FH. 1997. River Habitat Survey: A new system for classifying
rivers according to their habitat quality. In Freshwater Quality: Defining the Indefinable?, Boon PJ, Howell DL(eds). The Stationery Office: Edinburgh; 215–234.
Raven PJ, Holmes NTH, Dawson FH, Fox PJA, Everard M, Fozzard IR, Rouen KJ. 1998. River Habitat Quality:the physical character of rivers and streams in the UK and the Isle of Man. River Habitat Survey Report No.2,Environment Agency, Bristol.
Rowntree KM, Wadeson RA. 1996. Translating channel morphology into hydraulic habitat: application of thehydraulic biotope concept to an assessment of discharge related habitat changes. In Ecohydraulics 2000, Proceedingsof the Second IAHR Symposium on Habitat Hydraulics, Quebec, Leclerc M, Capra H, Valentin S, Boudreault A,Cote Y (eds); A281–A292.
Stalnaker CB. 1994. Evolution of instream flow habitat modelling. In The Ri6ers Handbook, vol. 2, Calow P, PettsGE (eds). Blackwell Scientific Publications: Oxford; 276–286.
ter Braak CJF. 1988. CANOCO—A FORTRAN program for canonical community ordination. Technical ReportLWA-88-02 GLW, Wageningen.
Copyright © 2000 John Wiley & Sons, Ltd. Aquatic Conser6: Mar. Freshw. Ecosyst. 10: 179–196 (2000)
D. TICKNER ET AL.196
Vadas Jr RL. 1992. Seasonal habitat use, species associations and assemblage structure of forage fishes in GooseCreek, northern Virginia. II. Mesohabitat patterns. Journal of Freshwater Ecology 7: 149–164.
Vannote RL, Minshall GW, Cummins KW, Sedell JR, Cushing CE. 1980. The river continuum concept. CanadianJournal of Fisheries and Aquatic Sciences 37: 130–137.
Wright JF, Blackburn JH, Westlake DF, Furse MT, Armitage PD. 1992. Anticipating the consequences of rivermanagement for the conservation of macroinvertebrates. In Ri6er Conser6ation and Management, Boon PJ, CalowP, Petts GE (eds). John Wiley: Chichester; 137–149.
Wright JF, Furse MT, Armitage PD. 1993. RIVPACS—a technique for evaluating the biological quality of rivers inthe UK. European Water Pollution Control 3: 15–25.
Copyright © 2000 John Wiley & Sons, Ltd. Aquatic Conser6: Mar. Freshw. Ecosyst. 10: 179–196 (2000)
.