assessing marketing risk - cufelib.cufe.edu.cn/upload_files/other/4_20140605100650... ·...
TRANSCRIPT

J BUSN RES 1987:15:X9-530 519
Assessing Marketing Risk
Victor J. Cook, Jr. John R. Page Tulane University
A model for assessing the risks specific to a marketing strategy is developed and applied to data generated by executive decisions made in the Mark&-at environ- ment. The specific risks of a marketing strategy are those associated with changes in primary demand and market share. The riskiness and profitability of different strategies are assessed statistically. Primary-demand risk and return on investments are found to be positively correlated. More volatile, risky, market segments yield higher average returns. The strong temptation to harvest market share is isolated in the positive correlation between harvesting risk and rate of return. The pressure not to build long-term positions is found in the high negative correlation between building risk and return on investments. Overall, the model successfully explains risk-taking behavior in the Markstrat environment, and offers theoretical direction for future research in the real world.
Introduction
Managers do not have useful tools for assessing the risks specific to a marketing strategy. Specific risk in marketing strategy traditionally has been quantified in three ways. First, risk has been defined as the standard error of market-response parameter estimates [13, 22, 271. While this approach provides measures of “par- ametric risk” in marketing, most managers operate in a world of unknown param- eter errors. A second measure of specific risk in marketing strategy is found in the “strengths and weaknesses” of standardized product portfolio models [18, 10, 261. While this approach provides measures of “strategic risk” in marketing, the results are so subjective that the true riskiness of a project is hidden by interpretive judgements. A third approach to specific risk is the direct adaptation to marketing of financial portfolio models [l, 3, 9, 11, 12, 14, 15, 19, 2.51. While this approach provides an objective measure of “systematic risk,” management cannot diversify away the residual risks specific to a marketing strategy.
Address correspondence to Victor J. Cook, Jr., A. B. Freeman School of Business, ‘Tulane Uni- versity, New Orleans, Louisiana 70118-5669.
Journal of Business Research 15, 519-530 (1987) 0 1987 Elsevier Science Publishing Co., Inc. 1987 52 Vanderbilt Ave., New York, NY 10017
0148-2963/87/$3.50
520 J BUSN RES 1987:15:X9-530
V. J. Cook, Jr. and J. R. Page
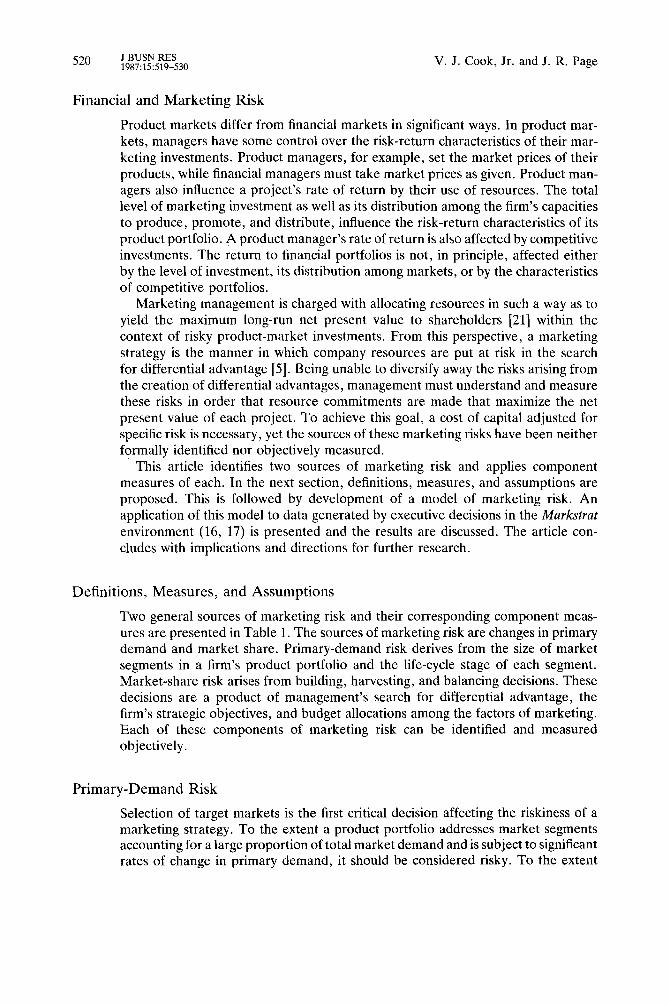
Financial and Marketing Risk Product markets differ from financial markets in significant ways. In product mar- kets, managers have some control over the risk-return characteristics of their mar- keting investments. Product managers, for example, set the market prices of their products, while financial managers must take market prices as given. Product man- agers also influence a project’s rate of return by their use of resources. The total level of marketing investment as well as its distribution among the firm’s capacities to produce, promote, and distribute, influence the risk-return characteristics of its product portfolio. A product manager’s rate of return is also affected by competitive investments. The return to financial portfolios is not, in principle, affected either by the level of investment, its distribution among markets, or by the characteristics of competitive portfolios.
Marketing management is charged with allocating resources in such a way as to yield the maximum long-run net present value to shareholders [21] within the context of risky product-market investments. From this perspective, a marketing strategy is the manner in which company resources are put at risk in the search for differential advantage [5]. Being unable to diversify away the risks arising from the creation of differential advantages, management must understand and measure these risks in order that resource commitments are made that maximize the net present value of each project. To achieve this goal, a cost of capital adjusted for specific risk is necessary, yet the sources of these marketing risks have been neither formally identified nor objectively measured.
This article identifies two sources of marketing risk and applies component measures of each. In the next section, definitions, measures, and assumptions are proposed. This is followed by development of a model of marketing risk. An application of this model to data generated by executive decisions in the Murkstrut environment (16, 17) is presented and the results are discussed. The article con- cludes with implications and directions for further research.
Definitions, Measures, and Assumptions Two general sources of marketing risk and their corresponding component meas- ures are presented in Table 1. The sources of marketing risk are changes in primary demand and market share. Primary-demand risk derives from the size of market segments in a firm’s product portfolio and the life-cycle stage of each segment. Market-share risk arises from building, harvesting, and balancing decisions. These decisions are a product of management’s search for differential advantage, the firm’s strategic objectives, and budget allocations among the factors of marketing. Each of these components of marketing risk can be identified and measured objectively.
Primary-Demand Risk Selection of target markets is the first critical decision affecting the riskiness of a marketing strategy. To the extent a product portfolio addresses market segments accounting for a large proportion of total market demand and is subject to significant rates of change in primary demand, it should be considered risky. To the extent

Assessing Marketing Risk J BUSN RES 1987:15:519-530 521
Table 1. Measures of Marketing Risk
Sources of Risk Measures of Risk
1. Primary-demand risk: Segment-size weight Product-life-cycle stage
2. Market-share risk: Building Harvesting Balancing
w =weight. Q = segment demand in units.
i = segment index; 1, 2, , 10. 0 = standard deviation of percent change. A = year-to-year change in segment demand. x = company share of marketing capacity.
m = company share of unit segment demand. s = budget share of company investments. b = investments that build share; x>m. h = investments that harvest share; x<m.
served market segments are small, with stable demand, a marketing strategy should be considered low risk.
The size of a market segment incorporates the idea that a large market is in- herently riskier than a smaller one. This fact is implicit in the concept of a market- niche strategy. In formulating a measure of primary-demand risk, segment size serves as a scaling factor to weight the relative importance of one segment compared with another. The weight is defined in Table 1 as the ratio of segment primary demand to total industry demand.
The product-life-cycle stage affects the level of primary-demand risk by the degree to which a market segment is found attractive to competitors and introduces volatility into demand expectations. A market in the growth stage of its life cycle is riskier than one in maturity because it attracts competition. A mature market segment is less risky than a declining one because of less uncertainty about future demand. The greater the variation in rates of change in demand for products in the company’s portfolio, the greater the risk.
Variations in segment demand are measured by the percent change in unit consumption. In a test of the validity of the product life cycle [20], this measure was found to be normally distributed with an expected value of zero and a standard deviation of 14% in a sample of 140 categories of nondurable consumer products. In Mu&strut, primary-demand risk is measured in Table 1 as the segment-size weighted standard deviation of percent change in unit sales among products in the firm’s portfolio.
Market-Share Risk
Market-share risk is introduced in three ways. First, risk is introduced in the firm’s search for competitive or differential advantages. Second, risk may be increased as a result of the firm’s strategic objectives. Third, the balancing of resources among the factors of marketing strategy influence risk.
The search for differential advantage is a major force in the creation of marketing

522 J BUSN RES 1987:15:519-530 V. J. Cook, Jr. and J. R. Page
risk. If segment demand in each year of the planning horizon is Q,, and future market-share expectations are l.~.~~, then future unit volume is I);~= p+,Q,. Market- share expectations depend on a firm’s prices and marketing capacity. A Markstrat firm’s capacity to produce, promote, and distribute its products is built with fixed marketing investments [6, 7, 8, 241. Designate the total fixed costs of a firm’s marketing strategy as the sum of expenditures “ej” assignable to a number of different marketing factors, where “j” is an index of factors. In Markstrat, factor costs are the same for all firms.
If a firm’s total expenditure on a marketing strategy aggregated over segments and factors is “e,” the budget share of total expenditures on each marketing factor is sil = ejtt e,. The market’s total expenditure on each factor by all competitors is Ej,. The ratio x,, = ejt + Ej, is one firm’s share of competitive capacity on any given marketing factor. A firm’s current share of a market segment is mit= qit+ Qil. Differential advantages exist whenever xjr > m,. Disadvantages exist whenever xjt < m, [4, 71. The market-share attraction model [2] is implicit in this formulation of differential advantage.
Strategic Objectives. Market-share risks arise from the increasing variation in cost and revenue estimates associated with strategic moves that place the firm farther and farther from its current market share m,,, to a future market-share p.ir position that is either greater or less than current share. A building strategy causes current market share and future share of marketing capacity to diverge. Expected unit volumes differ ever more significantly, and thus variances in estimates of expected costs and revenues increase. At the same time, the asset base is built up gradually reducing returns on the current position. A harvesting strategy leads to the risk of opportunity losses associated with moves that weaken the firm’s future market position. The risks of harvesting are the most insidious of all. The asset base gradually is reduced leading to higher short-run returns. In the short run, there is a positive effect on the financial statements and the potential long-term negative effects are not revealed in the accounts. A holding strategy that sets current share of market and future share of marketing capacity equal minimizes the risks introduced by strategic objectives.
Balancing Resources. Variability in resource allocations among the factors of marketing strategy introduces further risk. Under the assumption of equal linear- additive response and equal factor costs, allocation risk is minimized when each capacity share equals market share. It may be possible, however, to achieve target share of market by investing more heavily in one factor to compensate for a weakness in another. Figure 1 illustrates this trade-off. The curved schedule T represents the various allocations that, ceteribus paribus, would achieve target market share. This schedule is a “contour of equilibrium market share [14].” It is nonlinear if the firm cannot eliminate its investment in one factor by increasing investments in another. The straight lines c, and c2 correspond to different factor- cost schedules. If factor costs are equal, schedule c, implies the minimum cost- investment decision is at points x4 and x5. Generally, the balancing component of marketing risk is minimized if x,, = xzt . . . Xi, = m,. Schedule c2 applies if the factor cost of advertising is twice that of salesforce. The minimum cost investment then shifts to xq’ and x5’. The minimum risk investment, however, remains at x4=x5.

Assessing Marketing Risk J BUSN RES 1987:15:519-530
523
0 x5 "15 1.0
Sales Force Share (x 5)
Figure 1. Balancing the factors of marketing
Assumptions
For simplicity, and because it fits the Markstrut world reasonably well, it is assumed 1) that the long-run average xii = ujt, 2) primary-demand elasticities with respect to marketing capacity and segment price are constant, 3) market-share elasticities are constant and equal among all brands, 4) the factor costs cjt of all marketing in- vestments are equal among competitors and linear over the decision range, 5) the total revenue function is linear over the decision interval, 6) price is a dimension of perceived product performance, and 7) all firms face a market-response function that may be taken to be linear-additive [5, 231.
A Model of Marketing Risk A model for assessing marketing risk is presented in Figure 2. The selection of which market segments to enter defines the level of primary-demand risk in each time period. Primary-demand is labeled u in Figure 2. This represents the base

524 .I BUSN RES 1987:15:519-530
MARKET SHARE
RISK
V. J. Cook, Jr. and J. R. Page
PRIMARY DEMAND
RISK
m = Share of Unit Sales x I Share of Marketing Invesanents I
Figure 2. A model of marketing risk
rate of risk exposure elected by management in selection of the target markets in its product portfolio.
Changes in market share induced by management decisions to increase or de- crease the level of resource commitments among marketing factors lead to addi- tional risks. Deviations on either side of the firm’s current market-share position introduce greater uncertainty with respect to both consumer response (variance in revenues) and fixed costs of marketing capacity (variance in costs). The budget weighted root mean square of positive differences between current market share and expected share of marketing investments captures the effect of risk induced by a “building” strategy. The budget weighted root mean square of negative dif- ferences between market share and share of marketing investments measures the effect of risk induced by a “harvest” strategy. The sum of these differentials meas-

Assessing Marketing Risk J BUSN RES 1987:15:519-530
ures market-share risk. This risk component is labeled 0 in Figure 2. Theta may be interpreted as a strategic orientation coefficient (SOC). The SOC’s indicate the direction and degree of “tilt” away from a balanced, low-risk, share-holding strategy.
Application and Results
The data used in the following analysis were produced in an eight-year play of the Markstrat game by 25 senior marketing executives of a multibillion dollar inter- national corporation [7, 231.
Application
The mean rate of change in segment demand during this eight-year play of the game was + 20.1%) with a standard deviation of 28.6%. Both the mean and stan- dard deviation in growth rates were significantly higher than the average of real- world experience [20].
The management of Markstrut firms, like their real-world counterparts, pursued the growth segments over the course of the game, dropping the declining markets as they appeared. Primary-demand risk ranged from a low of .002 (Firm 4, period 2), to a high of 1.34 (Firm 4, period 4). Management of Firm 4 shifted its portfolio from one that was literally equivalent with the market, to one that was 1.34 sigmas above the mean risk of competitive portfolios. Its segment-weighted rate of port- folio growth moved from approximately 20% to over 58% in three years. Growth of this magnitude is difficult to manage in any environment.
Different segment-entry-time combinations are also important to a firm’s port- folio. For example, firms that had a portfolio entry in segment 5 during periods 5 through 8 were in markets that accounted for 21% of cumulative eight-year primary demand, but represented only 10% (4/40) of the entry opportunities in the eight years of play.
Market share is compared with each firm’s share of marketing capacity on seven marketing investment variables in the panels of Figure 3. In each panel, marketing capacity is expressed as a proportion of cumulative Markstrut industry totals. A firm’s share of unit sales (m) to the left side of each panel represents its true “weighted average market share [6, 7, 81.” The marketing capacity variables (x) appear from left to right across each panel. Share of unit production is identified as x,, share of ending inventory is x2, share of research-and-development expend- itures is x3, share of media advertising is x,, salesforce share is x5, marketing- research share is x6, and share of (inverted) volume-weighted interpoint distances between each brand in the firm’s portfolio and all segment ideal points is x,. The comparison of actual market share with the shares of each marketing investment is emphasized by the horizontal line in Figure 3.
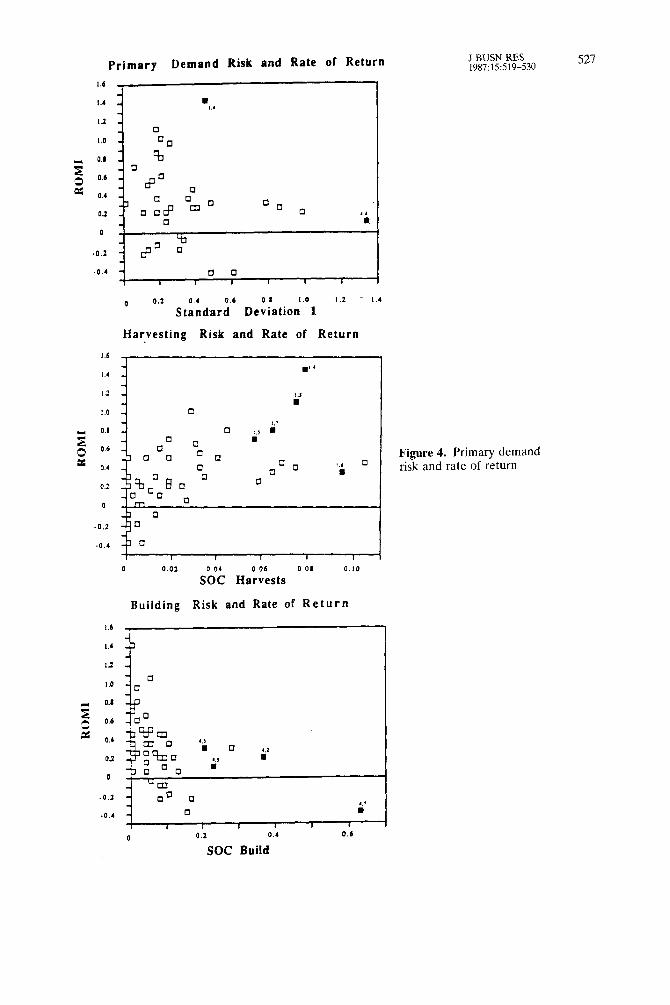
From these data, it is clear that Firm 1 followed a harvesting strategy over the eight years of play on all variables except research and development. The risky effects of this strategy appear in panel 2 of Figure 4. The strategic orientation coefficients (SOC) for Firm 1 tilted to the high side of the harvesting risk scale. For example, the highest rates of return on marketing investment as well as one of the largest harvest SOC’s was due to Firm 1, in period 4 (labeled 1,4 in panel

526 J BUSN RES 1987:15:519-530 V. J. Cook, Jr. and J. R. Page
Figure 3. Market share and share of marketing capacity
2 of Figure 4). In five of eight decisions, Firm 1 management exhibited very risky harvest coefficients.
The success of the risky strategy adopted by Firm 1 turned on the time pattern of a single R&D investment and of segment-entry decision. In period 3, manage- ment invested in 37.2% of the industry’s R&D, while its market share was 23.7%. The outcome of its R&D effort was a brand that was introduced dead center on the ideal point of segment 4. The same year (period 4), that segment grew by 85% in volume, followed by a 50% increase the next period. On two counts, the man- agement of Firm 1 was making a risky play-market-share harvesting in a rapidly growing market. In that year, the growth in segment 4 demand was 2.28 sigmas beyond the average for the game. Overall share of market for Firm 1 increased to 35.0% in period 4, and further to 44.0% in period 5 as a direct consequence of this one significant decision. The company continued its harvest throughout the
Primary Demand Risk and Rate of Return 1.6
0 0.6 so
a a aff
a
a a ma
0 0.2 StiAdari6 Dei:atioi’“l
1.2 - I.4
Harvesting Risk and Rate of Return
I.6 1
J BUSN RES !987:15:519-530
521
1.0 - a I.7
s 0.6 - a ,., l
2 -2 a a Figure 4. Primary demand 0.4 - risk and rate of return
0 -0.2 a
0.02 0 04 0 06 0.06 0 IO
SOC Harvests
Building Risk and Rate of Return
1.6 ,
a
0.1
0.6
0.4
I I I I I 1 1 I 0 0.2 0.4 0.6
SOC Build
528 J BUSN RES 1987:15:519-530 V. J. Cook, Jr. and J. R. Page
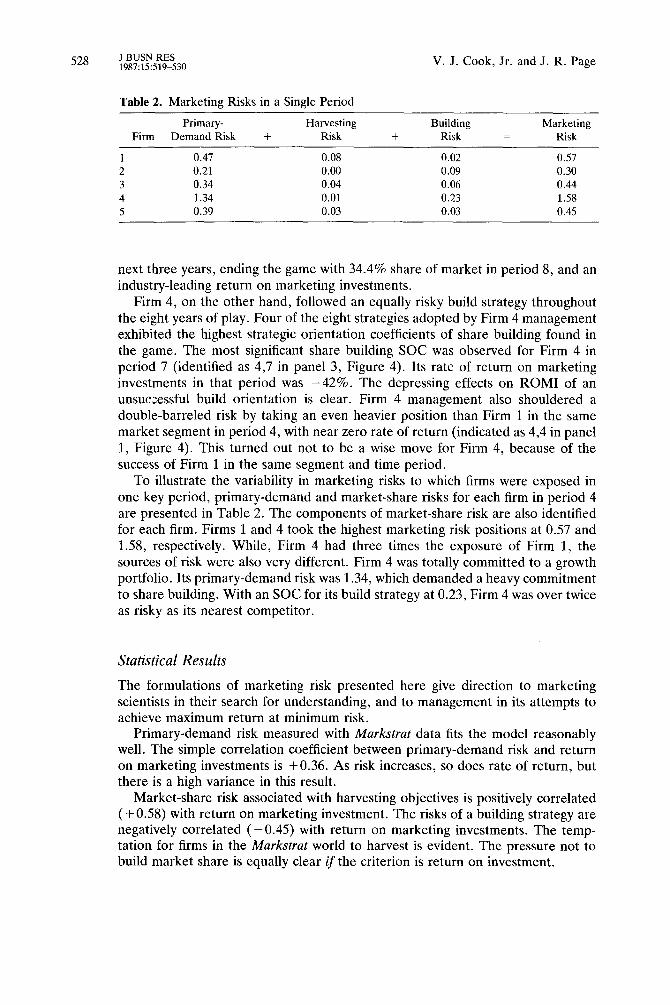
Table 2. Marketing Risks in a Single Period
Primary- Harvesting Building Marketing Firm Demand Risk + Risk + Risk = Risk
1 0.47 0.08 0.02 0.57 2 0.21 0.00 0.09 0.30 3 0.34 0.04 0.06 0.44 4 1.34 0.01 0.23 1.58 5 0.39 0.03 0.03 0.45
next three years, ending the game with 34.4% share of market in period 8, and an industry-leading return on marketing investments.
Firm 4, on the other hand, followed an equally risky build strategy throughout the eight years of play. Four of the eight strategies adopted by Firm 4 management exhibited the highest strategic orientation coefficients of share building found in the game. The most significant share building SOC was observed for Firm 4 in period 7 (identified as 4,7 in panel 3, Figure 4). Its rate of return on marketing investments in that period was - 42%. The depressing effects on ROM1 of an unsuccessful build orientation is clear. Firm 4 management also shouldered a double-barreled risk by taking an even heavier position than Firm 1 in the same market segment in period 4, with near zero rate of return (indicated as 4,4 in panel 1, Figure 4). This turned out not to be a wise move for Firm 4, because of the success of Firm 1 in the same segment and time period.
To illustrate the variability in marketing risks to which firms were exposed in one key period, primary-demand and market-share risks for each firm in period 4 are presented in Table 2. The components of market-share risk are also identified for each firm. Firms 1 and 4 took the highest marketing risk positions at 0.57 and 1.58, respectively. While, Firm 4 had three times the exposure of Firm 1, the sources of risk were also very different. Firm 4 was totally committed to a growth portfolio. Its primary-demand risk was 1.34, which demanded a heavy commitment to share building. With an SOC for its build strategy at 0.23, Firm 4 was over twice as risky as its nearest competitor.
Statistical Results
The formulations of marketing risk presented here give direction to marketing scientists in their search for understanding, and to management in its attempts to achieve maximum return at minimum risk.
Primary-demand risk measured with Murkstrat data fits the model reasonably well. The simple correlation coefficient between primary-demand risk and return on marketing investments is +0.36. As risk increases, so does rate of return, but there is a high variance in this result.
Market-share risk associated with harvesting objectives is positively correlated ( + 0.58) with return on marketing investment. The risks of a building strategy are negatively correlated (-0.45) with return on marketing investments. The temp- tation for firms in the Murkstrut world to harvest is evident. The pressure not to build market share is equally clear if the criterion is return on investment.

Assessing Marketing Risk J BUSN RES 1987:X:519-530
Implications and Future Research The risk-return characteristics of financial and marketing decisions are fundamen- tally different. Theoretically, marketing managers have some control over these characteristics, while financial managers do not. The control exercised by marketing management centers around decisions of 1) which segments to include in the port- folio and 2) the level and timing of investments in marketing capacity. The Murkstrat environment offers a particularly useful context in which to explore the effects of portfolio and investment decisions on marketing risk, because it offers compre- hensive, error-free measurements of competitive activity.
Since management has some control over exposure to marketing risks and can influence the observed rate of return on investments, the links between the two must be isolated explicitly. This article attempted to isolate such explicit links. Two major sources of marketing risk are changes in primary demand and market share. The model presented here appears to explain risk-taking behavior in the Markstrut environment, and offers theoretical direction to future research.
Research on objective, variance-based measures of marketing risk is only be- ginning. The next steps should include formal testing of hypotheses with larger samples and applications to real-world data. What may be gained from future research on measures of marketing risk is the possibility of explaining the residual contribution of primary-demand risk and market-share risk to a product portfolio’s overall risk-return characteristics. In turn, this will help management better control the impact of marketing decisions on the risk-return characteristics of product- market investments.
The authors thank Tracey Post for her assistance in development and analysis of the data base used in this study, and the A. B. Freeman School of Business for financial support.
References
1. Aaker, David A., and Jacobson, Robert, The Role of Risk in Strategic Decision Making: The Asset Risk Pricing Model, ORSA/TIMS Marketing Science Conference, Vanderbilt University, Session SAZB, March 1985.
2. Bell, David K., Kenney, Ralph L., and Little, John D. C., A Market Share Theorem, J. Marketing Res. 12 (May 1975): 136-141.
3. Cardozo, Richard N., and Smith, David K., Jr., Applying Financial Portfolio Theory to Product Portfolio Decisions: An Empirical Study, J. Marketing 47 (Spring 1983): 110-119.
4. Cook, Victor J., Jr., Marketing Strategy and Differential Advantage, J. hlarketing 47 (Spring 1983): 68-75.
5. Cook, Victor J., Jr., Understanding Marketing Strategy and Differential Advantage, J. Marketing 49 (Spring 1985): 137-142.
6. Cook, Victor, J., Jr., The Net Present Value of Market Share, J. Marketing 49 (Summer 1985): 49-63.
7. Cook, Victor J. Jr., and Strong, Edward C., Strategic Concepts in MARKSTRAT. Working paper 85-1445-07, A. B. Freeman School of Business, Tulane University, November 1985.
8. Cook, Victor J. Jr., and Nolan, Johannah J., Strategic Planning Tutorials for the

J BUSN RES 1987:15:519-530 V. J. Cook, Jr. and J. R. Page
MARKSTRAT Environment: SONITE ONE and TWO. Working paper 86-1445-05, A. B. Freeman School of Business, Tulane University, July 1986.
9. Corstjens, M., and Weinstein, D., in Marketing Planning Models. A. A. Zoltners, eds., Amsterdam, North-Holland Publishing Company, 1982, p. 141.
10. Day, George S., Strategic Market Planning: The Pursuit of Competitive Advantage, West Publishing Co., St. Paul, Minnesota, 1984.
11. Devinney, Timothy M., and Stewart, David W., A Generalized Investment Portfolio Model. Working paper #83-127, Owen Graduate School of Management, Vanderbilt University, December 1984.
12. Devinney, Timothy M., Stewart, David W., and Shocker, Allan D., A Note on the Application of Portfolio ‘Theory’: A Comment on Cardozo and Smith, 49 (Fall 1985): Journal of Marketing 113-115.
13. Hertz, David D., Risk Analysis in Capital Investment, Harvard Bus. Rev. 42 (January- February 1964): 95-106.
14. Karnani, Aneel, Equilibrium Market Share-A Measure of Competitive Strength, Strategic Management J. 3 (January-March 1982): 43-51.
15. Karnani, Aneel, Impact of Strategic Marketing Decisions on Systematic Risk, ORSAl TIMS Marketing Science Conference, Vanderbilt University, Session SA-2B, March 1985.
16. Larreche, Jean-Claude, and Gatignon, Hubert, Markstrat: A Marketing Strategy Game. The Scientific Press, Palo Alto, Calif., 1977.
17. Larreche, Jean-Claude, and Gatignon, Hubert, Markstrat: A Marketing Strategy Game (Teaching Notes). The Scientific Press, Palo Alto, Calif. 1977.
18. Larreche, Jean-Claude, and Srinivasan, V., STRATPORT: A Model for the Evaluation and Formulation of Business Portfolio Strategies, Management Science 28 (September 1982): 979-1001.
19. Mahajan, Vijay, Wind, Yoram, and Bradford, John, Stochastic Dominance Rules for Product Portfolio Analysis, in TIMS Studies in The Management Sciences: Marketing Planning Models. A. A. Zoltners, ed., North-Holland, Amsterdam, 1982, p. 161.
20. Polli, Rolando, and Cook, Victor J., Validity of the Product Life Cycle, J. Bus. 42 (October 1969): 385-400.
21. Rappaport, Alfred, Selecting Strategies that Create Shareholder Value, Harvard Bus. Rev. 59 (May-June 1981): 139-149.
22. Urban, Glen L., and Hauser, John R., Design and Marketing of New Products, Prentice- Hall, Englewood Cliffs, N.J., 1980, p. 618.
23. Utsey, Marjorie F., A Study of the Achievement of Profit Potential in a Simulated Environment. Unpublished Ph.D. dissertation, Tulane University, New Orleans, La., 1985.
24. Utsey, Marjorie F., and Cook, Victor J., Jr., A Marketing Strategy Paradigm for Case Analysis, in AMA Educator’s Proceedings. Russell W. Belk, et al., eds., American Marketing Association, Chicago, 1984, pp. 96-100.
25. Wind, Yoram, and Mahajan, Vijay, Designing Product and Business Portfolios, Harvard Bus. Rev. 59 (January-February 1981): 155-165.
26. Wind, Yoram, Mahajan, Vijay, and Swire, Donald J., An Empirical Comparison of Standardized Portfolio Models, J. Marketing 47 (Spring 1983): 89-99.
27. Wind, Yoram, and Eliashberg, Jehoshua, The Measurement and Management of Marketing Risk in New Product Growth Markets, ORSA/TIMS Marketing Science Conference, Vanderbilt University, Session SA-2B, 1985.