assessing management techniques for … · r e p o r t t o t h e b u r e a u o f l a n d m a n a g...
TRANSCRIPT

ASSESSING MANAGEMENT TECHNIQUES FOR LOMATIUM COOKII (COOK’S DESERT-PARSLEY)
2017 Report to the Bureau of Land Management, Medford District
Report prepared by Denise E. L. Giles, Erin C. Gray, and Matt A. Bahm Institute for Applied Ecology

Assessing Habitat Management Techniques for Lomatium cookii, 2017 ii
PREFACE
This report is the result of a cooperative project between the Institute for Applied Ecology (IAE) and the Bureau of Land Management. IAE is a non-profit organization whose mission is conservation of native ecosystems through restoration, research and education. IAE provides services to public and private agencies and individuals through development and communication of information on ecosystems, species, and effective management strategies. Restoration of habitats, with a concentration on rare and invasive species, is a primary focus. IAE conducts its work through partnerships with a diverse group of agencies, organizations and the private sector. IAE aims to link its community with native habitats through education and outreach.
Questions regarding this report or IAE should be directed to:
Matt Bahm
Conservation Research Program Director
Institute for Applied Ecology
563 SW Jefferson Avenue
Corvallis, Oregon 97333
phone: 541-753-3099
fax: 541-753-3098
email: [email protected]

Assessing Habitat Management Techniques for Lomatium cookii, 2017 iii
ACKNOWLEDGMENTS
We thank the Medford BLM for their assistance with this study. The following IAE interns and staff
contributed to the 2014-2017 field seasons: Michelle Allen, Sarai Carter, Tara Callaway, Ari
Freitag, Abbie Harold, Liza Holtz, Lucy Keehn, Emma MacDonald, Nadav Mouallem, Sarah
Newman, Meaghan Petix, Cecilia Welch, Connor Whitaker, and Michel Wiman. A special thank
you is extended to the countless volunteers who have helped IAE with our work on this species.
Cover photos: Cook’s desert-parsley (Lomatium cookii) plot at Illinois Forks State Park and close
up of individual Cook’s desert-parsley.
Suggested Citation
Giles, D.E.L., E.C. Gray, and M.A. Bahm. 2017. Assessing management techniques for Lomatium
cookii (Cook’s desert-parsley). Institute for Applied Ecology, Corvallis, Oregon and USDI
Bureau of Land Management, Medford District. viii + 55 pp.

Assessing Habitat Management Techniques for Lomatium cookii, 2017 iv
TABLE OF CONTENTS
PREFACE ......................................................................................................................... II
ACKNOWLEDGMENTS ................................................................................................... III
LIST OF FIGURES ........................................................................................................... VI
LIST OF TABLES ............................................................................................................ VII
EXECUTIVE SUMMARY ............................................................................................... VIII
INTRODUCTION ............................................................................................................. 1
Background ........................................................................................................................................ 1
Goal and Objectives ........................................................................................................................ 3
METHODS ....................................................................................................................... 3
Effects of Herbicide .......................................................................................................................... 3
Unoccupied ...................................................................................................................................... 3
Occupied.......................................................................................................................................... 5
Effects of Fire ..................................................................................................................................... 5
Plant Community and Demography ............................................................................................ 5
Lomatium cookii Density plots ....................................................................................................... 6
Data Analysis ..................................................................................................................................... 6
RESULTS .......................................................................................................................... 7
Effects of Herbicide .......................................................................................................................... 7
Lomatium cookii ............................................................................................................................... 7
Plant Community .......................................................................................................................... 10
Effects of Fire .................................................................................................................................. 17
Plant Community .......................................................................................................................... 20
DISCUSSION ................................................................................................................. 23
Lomatium cookii Response to Habitat Management Treatments ........................................... 23
Prescribed Fire ............................................................................................................................. 23
Herbicide Treatments ................................................................................................................. 23
Plant Community Response to Habitat Management Treatments ......................................... 24
Illinois Forks State Park: ............................................................................................................. 24
French Flat: ................................................................................................................................... 24
LITERATURE CITED ....................................................................................................... 26
APPENDIX A. COORDINATES FOR UNOCCUPIED AND OCCUPIED HABITAT PLOTS AT ILLINOIS FORKS STATE PARK. ..................................................................................... 27
Unoccupied Habitat ....................................................................................................................... 27
Occupied Habitat .......................................................................................................................... 28
APPENDIX B. AERIAL PHOTOS AND SCHEMATICS OF PLOTS IN THE UNOCCUPIED AND OCCUPIED HABITATS AT ILLINOIS FORKS STATE PARK. ............................................ 29

Assessing Habitat Management Techniques for Lomatium cookii, 2017 v
Unoccupied Habitat ....................................................................................................................... 29
Occupied Habitat .......................................................................................................................... 36
APPENDIX C. LOCATIONS OF DENSITY AND DEMOGRAPHY PLOTS AT FRENCH FLAT MIDDLE AND FRENCH FLAT SOUTH. ............................................................................ 37
French Flat Middle ......................................................................................................................... 37
French Flat South ............................................................................................................................ 38
APPENDIX D. SCHEMATIC OF DENSITY AND DEMOGRAPHY PLOTS AT FRENCH FLAT MIDDLE AND FRENCH FLAT SOUTH. ......................................................................................... 39
French Flat Middle ......................................................................................................................... 39
French Flat South ............................................................................................................................ 40
APPENDIX E. NUMBER OF L. COOKII IN EACH DEMOGRAPHIC PLOT AT ILLINOIS FORKS STATE PARK, 2014-2017. ............................................................................................ 41
APPENDIX F. PLANT COMMUNITY DATA (FORBS AND SHRUBS) FROM FORKS STATE PARK IN OCCUPIED AND UNOCCUPIED PLOTS, 2014-2017. ................................................ 43
APPENDIX G. PLANT COMMUNITY DATA (GRAMINOIDS) FROM FORKS STATE PARK IN OCCUPIED AND UNOCCUPIED PLOTS, 2014-2017. ..................................................... 44
APPENDIX H. MEAN COVER OF THE PLANT COMMUNITY BY SPECIES IN OCCUPIED AND UNOCCUPIED PLOTS AT FORKS STATE PARK (2014-2017) ........................................ 46
APPENDIX I. PLANT COMMUNITY DATA BY FUNCTIONAL GROUP FOR BURNED AND UNBURNED PLOTS AT FRENCH FLAT MIDDLE AND FRENCH FLAT SOUTH (2017) ..... 52
APPENDIX J. MEAN COVER OF THE PLANT COMMUNITY BY SPECIES IN BURNED AND UNBURNED PLOTS AT FRENCH FLAT MIDDLE AND FRENCH FLAT SOUTH (2016-2017)53

Assessing Habitat Management Techniques for Lomatium cookii, 2017 vi
LIST OF FIGURES
Figure 1. Lomatium cookii at French Flat. .................................................................................................... 1
Figure 2. Photo of an unoccupied plot at Illinois Forks State Park. In this photo, the 1m x 1m
frames are in the center of each 2m x 2m treatment plot. ...................................................................... 4
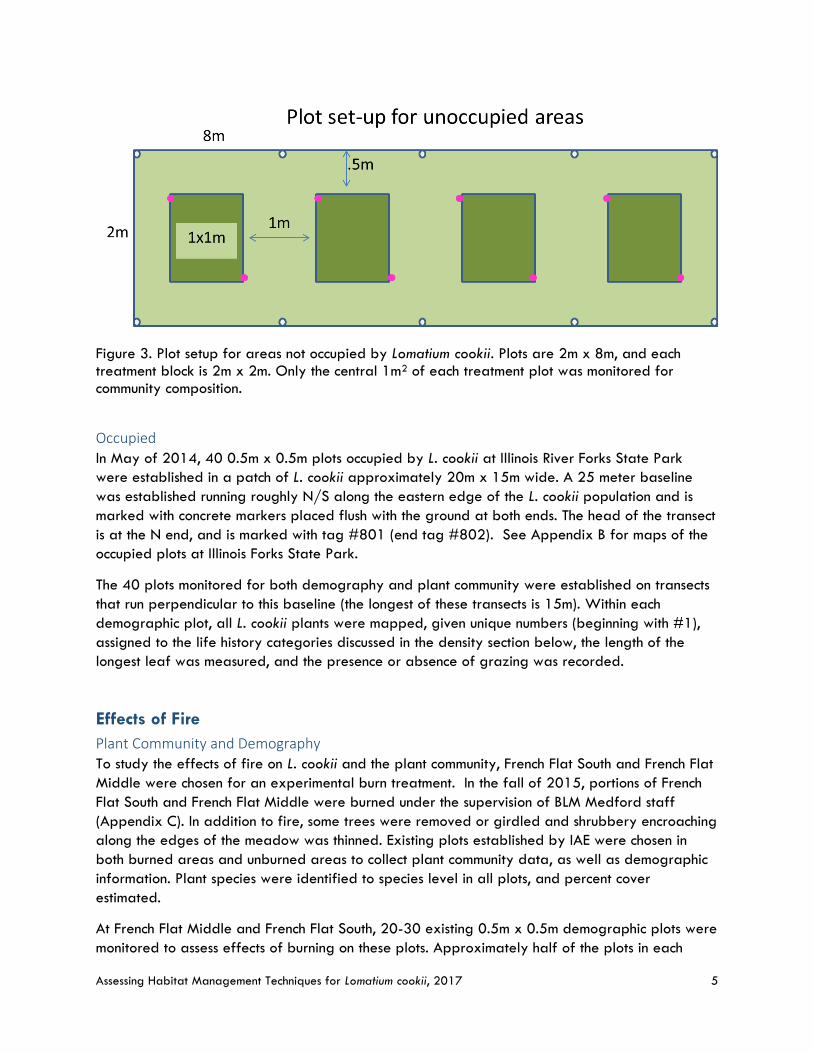
Figure 3. Plot setup for areas not occupied by Lomatium cookii. Plots are 2m x 8m, and each
treatment block is 2m x 2m. Only the central 1m2 of each treatment plot was monitored for
community composition. .................................................................................................................................... 5
Figure 4. Average size of L. cookii in demographic plots at Illinois Forks State Park 2014-2017.
Error bars represent 95% confidence interval. Letters over the 2017 values indicate plant size
that differed significantly. The same letter indicates no difference, but different letters indicate
significance. ....................................................................................................................................................... 9
Figure 5. Average percent cover of forbs by treatment in the occupied habitat. Error bars
represent 95% confidence interval. ............................................................................................................ 11
Figure 6. Average percent cover of graminoids by treatment in the occupied habitat. Error bars
represent 95% confidence interval. ............................................................................................................ 12
Figure 7. Average percent cover of annual and perennial graminoids. Error bars represent 95%
confidence interval. ........................................................................................................................................ 13
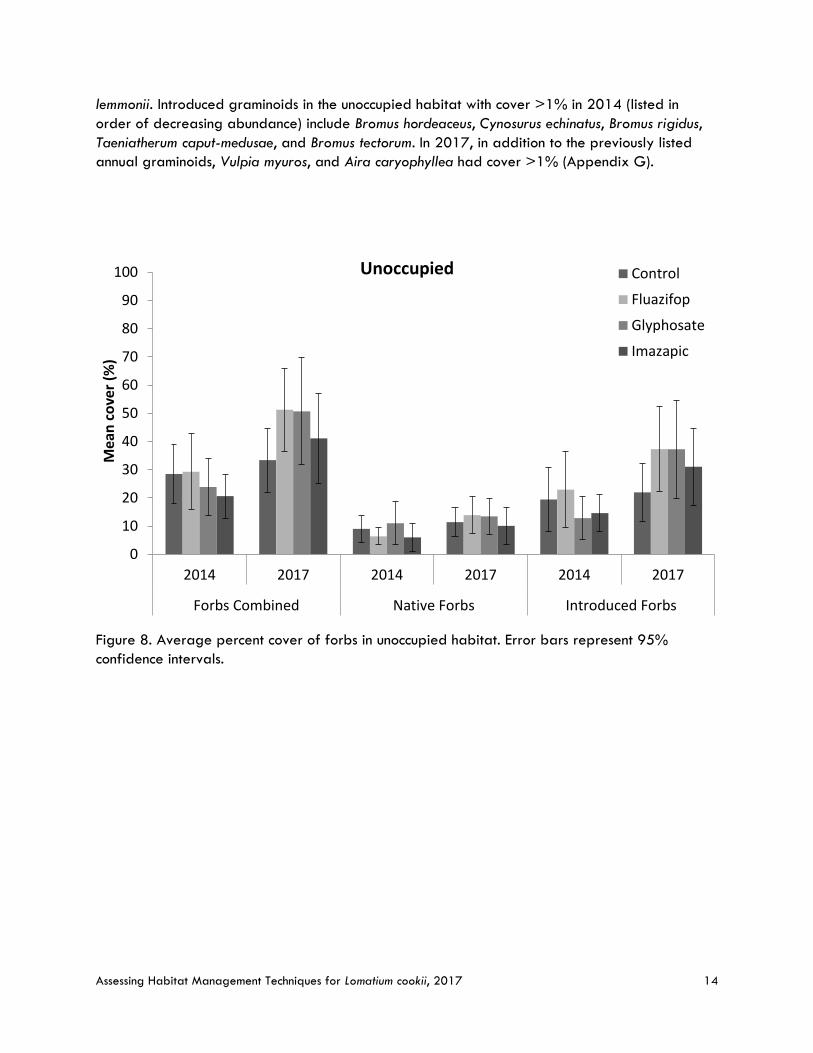
Figure 8. Average percent cover of forbs in unoccupied habitat. Error bars represent 95%
confidence interval. ........................................................................................................................................ 14
Figure 9. Average percent cover of graminoid species in unoccupied habitat. Error bars represent
95% confidence interval. .............................................................................................................................. 15
Figure 10. Average percent cover of annual and perennial graminoids in unoccupied habitat.
Error bars represent 95% confidence interval. ........................................................................................ 16
Figure 11. Density of L. cookii in 2017 in the burned and unburned portions of French Flat Middle
and French Flat South. Error bars represent 95% confidence interval. .............................................. 17
Figure 12. Mean number of plants in each size class at French Flat South and French Flat Middle,
2017. “V” indicates “vegetative” with the number following representing the number of leaves.
“R” indicates “reproductive” with the number following representing the number of umbels. Error
bars represent 95% confidence interval. .................................................................................................. 18
Figure 13. Mean proportion of reproductive L. cooki in burned and unburned plots at French Flat
Middle and French Flat South in 2017. Error bars represent 95% confidence interval. ................. 19
Figure 14. Proportion of plants grazed in the burned and unburned portions of French Flat Middle
and French Flat South in 2017. Error bars represent 95% confidence interval. ............................... 19
Figure 15. Ground cover in burned and unburned plots at French Flat South and French Flat
Middle in 2017. Error bars represent 95% confidence interval. .......................................................... 21
Figure 16. Forb and graminoid cover, by nativity, in burned and unburned plots at French Flat
South and French Flat Middle in 2017. Error bars represent 95% confidence interval. .................. 22

Assessing Habitat Management Techniques for Lomatium cookii, 2017 vii
LIST OF TABLES
Table 1. Herbicide application rates and dates of application at Illinois Forks State Park. ............. 3
Table 2. Total number of plants in each treatment plot, number and percent of original plants
present, and the number of new recruits from 2014-2017 at Illinois Forks State Park. .................... 8
Table 3. Average number of plants in demographic plots by treatment with 95% confidence
intervals. ............................................................................................................................................................. 8

Assessing Habitat Management Techniques for Lomatium cookii, 2017 viii
EXECUTIVE SUMMARY
This document summarizes results from two studies involving habitat management techniques for L.
cookii to support recovery of the species. The studies include 1) an evaluation of herbicide effects
at Illinois Forks State Park, in areas occupied and unoccupied with L. cookii and 2) the effects of
prescribed fire on L. cookii and the surrounding plant community at French Flat Middle and French
Flat South. This information will inform future habitat management activities in sites that may
contribute to the recovery of L. cookii and other associated native plant species.
Effects of Herbicide, Illinois Forks State Park
There were no clear differences in survivorship of L. cookii by treatment at Illinois Forks State Park
in 2015, 2016, and 2017 (up to 3 years post-treatment). Height differed significantly (P<0.001)
between herbicide treatments, where plants in the control treatment were taller than plants
treated with herbicide; there were no differences in height between types of herbicide.
In occupied habitat, mean forb cover increased across all treatments from 12% in 2014 to 28%
in 2017. Native and introduced graminoid cover decreased across all treatment types from
2014 to 2017 (natives: 26% to 10%; introduced: 30% to 7%). This decrease was due in large
part to shifts in hydrology that led to a retreat of Agrostis sp. from pool edges and out of the
plots.
In unoccupied habitat, forb cover increased across all plots from 2014 to 2017, from 26% to
44%. Native forbs remained similar in cover from 2014 to 2017, and introduced forbs increased
across treatments. Total graminoid cover decreased from 26% to 16% from 2014 to 2017, with
decreases occurring in all treatment plots. Native graminoid cover remained low and similar
between 2014 and 2017. The diversity of introduced annual graminoids increased from 2014-
2017. Continued monitoring will be essential to see if the impacts on introduced graminoids
observed in fluazifop and glyphosate treatments continue into the future.
Effects of Fire, French Flat
Density (and population size) of L. cookii at French Flat Middle and French Flat South in 2014 and
2015 were among the lowest recorded at these sites since monitoring began in 1993. While the
cause of this decline is unclear, competition with non-native species, increasing litter and thatch,
disturbance by off-road vehicles and climatic factors may be playing a role. In the fall of 2015,
approximately half of the occupied portion of each meadow was burned under the supervision of
BLM staff.
In 2017, density of L. cookii did not differ between burned and unburned plots at French Flat
Middle and South. Similarly, number of plants in each size/reproductive class did not differ
between burned and unburned plots. Proportion of reproductive plants did not differ significantly
between burned and unburned plots, nor were there effects of treatment on grazing of L. cookii.
The plant community responded similarly to the burn treatment at both sites. There was no
difference between burned and unburned plots of native forb cover in either meadow. Cover of
invasive grasses in both meadows was low (<2%), thus differences between burned and unburned
plots were negligible with respect to total cover.

Assessing Habitat Management Techniques for Lomatium cookii, 2017 1
ASSESSING MANAGEMENT TECHNIQUES FOR LOMATIUM COOKII R E P O R T T O T H E B U R E A U O F L A N D M A N A G E M E N T , M E D F O R D D I S T R I C T
INTRODUCTION
Lomatium cookii (Figure 1), Cook's desert-parsley, is listed as endangered by the State of Oregon
and the U.S. Fish and Wildlife Service (USFWS) (ORBIC 2016). L. cookii is a member of the
Apiaceae (parsley family). The species is endemic to southwestern Oregon in two population
centers, one in Josephine County in the Illinois Valley and one in Jackson County in the Agate
Desert north of the Medford Plains (Kagan
1994). The plants are usually less than 3
dm tall and inconspicuous except when in
flower. Ternately divided leaves feature
many narrow leaflets and creamy yellow
flowers are produced in compound umbels
on leafless stems (Figure 1). Fruits are
flattened and oblong. The species was
originally described by Kagan in 1986
from specimens collected in the Medford
area. The species is closely related to L.
bradshawii, an endangered species found in
the Willamette Valley of western Oregon.
Background
L. cookii was first described in 1981 in the Agate Desert in the Rogue River Valley. Habitats for
the species in this area are characterized by patterned ground in the form of a series of vernal
pools and mounds. L. cookii occupies a seasonally wet zone on the margins of the vernal pools.
The dominant vegetation at Agate Desert consists of annual grasses (Deschampsia danthonioides,
Bromus hordeaceus, Alopecurus saccatus, and Taeniatherum caput-medusae) and herbaceous
annuals and perennials (Lasthenia californica, Plectritis congesta, Collinsia grandiflora, and
Limnanthes flocossa ssp. grandiflora). The largest populations of this species are on lands
managed by The Nature Conservancy and the Medford Airport (Kagan 1994).
The largest federally-owned population of L. cookii occurs in the Illinois Valley at the French Flat
Area of Critical Environmental Concern (ACEC) managed by the Medford District Bureau of Land
Management. Areas around this population were placer-mined for many years. Populations in
this area have been monitored annually since 1993 (Pfingsten et al. 2016). These populations
are often found in moist, grassy meadows dominated by Danthonia californica (Kaye and
Blakeley-Smith 2002). Other associated species at French Flat include Danthonia unispicata,
Figure 1. Lomatium cookii at French Flat.

Assessing Habitat Management Techniques for Lomatium cookii, 2017 2
Deschampsia cespitosa, Camassia quamash, Ranunculus occidentalis, Hesperochiron occidentalis,
Horkelia daucifolia, Isoetes nuttallii, Calochortus uniflorus, and Viola hallii. Trees and shrubs, such
as Pinus ponderosa, Pinus jeffreyi, Arctostaphylos spp., and Ceanothus cuneatus border these grassy
meadows (Mousseax 1993). Populations of L. cookii are also found in the Illinois Valley in grass-
dominated gaps within oak woodland, especially in the Reeves Creek area. These habitats have
upland soils and are on hillsides which are substantially different in character than the wet sites in
the Illinois Valley lowlands. The soils at French Flat are moderately serpentine, which restricts the
growth of many plant species. In contrast, the soils in Reeves Creek and Agate Desert populations
of L. cookii are non-serpentine in origin. In addition to French Flat and Reeves Creek, population
monitoring of L. cookii by IAE is also conducted at the Rough and Ready ACEC and at Indian Hill,
also managed by the Medford District BLM. For more information about these populations see
Pfingsten et al. 2016.
Mining activities continue to threaten L. cookii. Placer gold mining has restricted the population at
French Flat and permanently altered much of the natural hydrologic patterns through the
meadows. Some of the French Flat subpopulations monitored and discussed in this report are
located on BLM managed lands adjacent to the Hillside Placer No. 1 and No. 3 mines owned and
operated by a local resident. A proposed mining plan filed in 1993 would involve destruction of
a significant portion of this subpopulation. Recently, mining plans have been filed with BLM that
will alter habitat immediately adjacent to L. cookii at French Flat ACEC.
L. cookii habitat in the Illinois Valley is threatened not only by invasion of non-native species, and
mining, but also by rural development and abuse by recreational users in the area. At Illinois
Forks State Park, an unofficial trail cuts through one of the populations of L. cookii at the site.
Unoccupied plots close to the river, which were placed adjacent to an existing L. cookii population
were disturbed by recreational users between 2014 and 2015 when a bulldozer (or other heavy
equipment) was used to create a path to the river from the adjacent private property. Because
unoccupied plots were purposefully established in areas without L. cookii, we do not know the
effects of these activities on the L. cookii in this portion of the habitat. French Flat has been
repeatedly damaged by ORV use, where we observed fresh vehicle tracks from 2002-2007.
The 2012 USFWS Recovery Plan for the Rogue and Illinois Valley Vernal Pool and Wet Ecosystems states the following regarding the recovery priority and necessary habitat requirements for the species:
“Recovery priority. Lomatium cookii has a recovery priority number of 2C, based upon a high degree of threat, a high potential for recovery, and a taxonomic classification as a species. The “C” indicates the potential for conflict between the species and construction, development, or other economic activities.” “The primary constituent elements for L. cookii critical habitat include vernal pools, seasonally wet meadows within oak and pine forests, sloped mixed conifer openings, and shrubby plant habitats, the dominant native plant association of these habitats, and intact hydrology and soils that provides for adequate soil moisture. Enhancement and protection of these elements is critical to recovering the species.”

Assessing Habitat Management Techniques for Lomatium cookii, 2017 3
Goal and Objectives
The goal of this project was to develop management techniques for L. cookii to support recovery
of the species. The specific objectives were to:
1. Study the effects of herbicide at sites occupied and unoccupied by L. cookii, and the
surrounding plant community. (Illinois Forks State Park)
2. Study the effects of fire on L. cookii and surrounding the plant community. (French Flat
Middle and French Flat South)
METHODS
Effects of Herbicide To assess herbicide as a potential tool to control annual grasses and other noxious weeds in the
presence of L. cookii, IAE worked with Oregon State Parks and the Medford BLM to conduct
herbicide trials at Illinois River Forks State Park. Management treatments included glyphosate,
imazapic and fluazifop, as well as an untreated control. Plots were sprayed with glyphosate on
7 November 2014 and imazapic on 10 November 2014, fluazifop was sprayed on 9 March
2015. All herbicide applications included a non-ionic surfactant (Table 1).
Treatment plots were monitored by IAE staff prior to treatment application in May 2014, and
post-treatment in May 2015-2017. Treated plots in the areas without L. cookii are 2m x 2m, and
0.5m x 0.5m in the occupied areas. Plant species were identified to species level in all plots, and
percent cover estimated. In the occupied plots, demographic information was recorded for each L.
cookii individual.
Table 1. Herbicide application rates and dates of application at Illinois Forks State Park.
Chemical Trade Name Target species Rate
(oz/gal) Surfactant
(Activator 90) Spray
Volume Time
Fluazifop Fusilade DX Grass specific, post-emergence 0.75 0.64 oz/gal 30 gal/acre
3/9/2015, 2:30 pm
Glyphosate Roundup Custom Broad spectrum, post-emergence 1.28 0.64 oz/gal 30 gal/acre
11/7/14, 3:00 pm
Imazapic Plateau Broad spectrum, pre-emergence 0.16 0.64 oz/gal 30 gal/acre
11/10/14, 1:30 pm
Unoccupied In May 2014, 12 plots were established by IAE in areas not occupied by L. cookii. Plots are 2 x 8
meters (divided into four 2m x 2m treatment squares) marked at the corners with 8 yellow

Assessing Habitat Management Techniques for Lomatium cookii, 2017 4
capped PVC pipes (Figure 3). The northwest corner is marked with the first plot tag in the series
and the opposite corner (southeast) is marked with the next consecutively numbered plot tag.
Four 1-m² plots are marked in the middle of each 2m x 2m plot with nails and hot pink washers in
the northwest (has plot ID tag) and southeast corners (Figure 3). For plot coordinates and
schematics, see Appendix A and Appendix B.
Figure 2. Photo of an unoccupied plot at Illinois Forks State Park. In this photo, the 1m x 1m frames are in the center of each 2m x 2m treatment plot.
Assessing Habitat Management Techniques for Lomatium cookii, 2017 5
Figure 3. Plot setup for areas not occupied by Lomatium cookii. Plots are 2m x 8m, and each treatment block is 2m x 2m. Only the central 1m2 of each treatment plot was monitored for community composition.
Occupied In May of 2014, 40 0.5m x 0.5m plots occupied by L. cookii at Illinois River Forks State Park
were established in a patch of L. cookii approximately 20m x 15m wide. A 25 meter baseline
was established running roughly N/S along the eastern edge of the L. cookii population and is
marked with concrete markers placed flush with the ground at both ends. The head of the transect
is at the N end, and is marked with tag #801 (end tag #802). See Appendix B for maps of the
occupied plots at Illinois Forks State Park.
The 40 plots monitored for both demography and plant community were established on transects
that run perpendicular to this baseline (the longest of these transects is 15m). Within each
demographic plot, all L. cookii plants were mapped, given unique numbers (beginning with #1),
assigned to the life history categories discussed in the density section below, the length of the
longest leaf was measured, and the presence or absence of grazing was recorded.
Effects of Fire
Plant Community and Demography To study the effects of fire on L. cookii and the plant community, French Flat South and French Flat
Middle were chosen for an experimental burn treatment. In the fall of 2015, portions of French
Flat South and French Flat Middle were burned under the supervision of BLM Medford staff
(Appendix C). In addition to fire, some trees were removed or girdled and shrubbery encroaching
along the edges of the meadow was thinned. Existing plots established by IAE were chosen in
both burned areas and unburned areas to collect plant community data, as well as demographic
information. Plant species were identified to species level in all plots, and percent cover
estimated.
At French Flat Middle and French Flat South, 20-30 existing 0.5m x 0.5m demographic plots were
monitored to assess effects of burning on these plots. Approximately half of the plots in each

Assessing Habitat Management Techniques for Lomatium cookii, 2017 6
meadow were burned (Appendix C). Similar to the demographic plots at Illinois Forks, within
each demographic plot, all L. cookii plants were mapped, given unique numbers (beginning with
#1), assigned to the life history categories discussed earlier, and the presence or absence of
grazing was recorded. For details regarding the longer term history of these plots see Pfingsten
et al. 2016.
Lomatium cookii Density plots Thirty to forty density plots have been established at both French Flat Middle and French Flat
South. In the 40m x 0.10m density plots, all L. cookii were counted and assigned to a specific life-
history category, as follows:
S seedling
V1/2 vegetative with 1 or 2 leaves
V3 vegetative with 3 or more leaves
R1 reproductive with 1 umbel
R2 reproductive with 2 umbels
R3 reproductive with 3 or more umbels
Life-history categories were originally developed for Lomatium bradshawii monitoring in the
Willamette Valley (Kaye et al. 2001). The similarities of the life-history characteristics of these
species cause the categories to be applicable to L. cookii as well. Reproductive plants were
segregated by umbel number because studies of L. bradshawii have shown that one-umbel plants
rarely produce seed, while two-umbel plants produce seed on the second umbel, and three umbel
plants may produce many seeds (Kaye and Kirkland 1994).
Data Analysis
We used analysis of variance (ANOVA; R Development Core Team 2009) to test for the response
of mean plant size of L. cookii (2017 only), using herbicide treatment (control, fluazifop,
glyphosate, and imazapic) as predictors. Due to differences found between treatments, pairwise
comparisons were made using the Tukey HSD. To test for differences in survival by herbicide
treatment, we used a General Linear Model (GLM) to look at differences in proportions of
survival from plants that were originally present in 2014 when plots were established. Due to the
high variability seen within the plots, all other comparisons were based off of use of 95%
confidence intervals.

Assessing Habitat Management Techniques for Lomatium cookii, 2017 7
RESULTS
Effects of Herbicide
Lomatium cookii In order to evaluate the treatment effects on L. cookii, the percent survivorship of original plants
and average size were compared by treatment type (Table 2 and Figure 4). Two plots (plots
#831-fluazifop and #812-glyphosate) were not included in analysis due to their proximity to a
heavily used trail (use increased over the course of the study). See Appendix E for more detailed
plot information.
There were no effects of treatment on survivorship of L. cookii in the herbicide plots. In the first
year post-treatment, survivorship in the treatment plots ranged from 78%-92%, and in 2017
survivorship of original plants ranged from 25-55%, which was a sharp decline from previous
years, particularly in the glyphosate and fluazifop plots (Table 2). While in previous years
survivorship was highest in plots treated with fluazifop, in 2017 only 25% of original plants
remained. In each year, new plants were noted in all treatment plots, with the most occurring in
plots treated with glyphosate and imazapic (Table 2).
In 2017, mean plant size (cm) differed significantly between treatment types; plants in the control
treatment were larger than plants in the herbicide treatments (Figure 4, P<0.001). In previous
years (2015 and 2016), there were no differences in plant size between treatment plots (Figure
4). From 2014 to 2016, plant size declined steadily, however this decline was independent of
treatment (Figure 4). In 2017, plant size tended to increase in all treatment types, with the
greatest increase occurring in plants present in the control plots. While plant size also increased
in the herbicide treatment plots, their size did not differ significantly, but did differ from the
larger size in the control plots.

Assessing Habitat Management Techniques for Lomatium cookii, 2017 8
Table 2. Total number of plants in each treatment plot, number and percent of original plants present, and the number of new recruits from 2014-2017 at Illinois Forks State Park.
Total # of plants present in treatment plots
Treatment 2014 2015 2016 2017
Control 49 47 45 31
Fluazifop 25 29 31 25
Glyphosate 56 59 64 68
Imazapic 55 51 50 46
Number and % of original plants present
2014 2015 2016 2017
Control 49 39 80% 31 63% 27 55%
Fluazifop 25 23 92% 19 76% 6 24%
Glyphosate 56 44 79% 38 68% 17 30%
Imazapic 55 43 78% 38 69% 29 52%
Number of new plants in each year
2014 2015 2016 2017
Control - 8 8 6
Fluazifop - 6 7 6
Glyphosate - 15 12 12
Imazapic - 8 5 13
Table 3. Average number of plants in demographic plots by treatment with 95% confidence intervals.
Treatment Average Number of Plants
2014 95%C.I. 2015 95%C.I. 2016 95%C.I. 2017 95%C.I.
Control 4.9 ±3.2 4.7 ±2.5 4.5 ±1.9 3.1 ±1.3
Fluazifop 2.7 ±1.4 3.2 ±1.8 3.4 ±2.3 2.8 ±1.7
Glyphosate 6.2 ±2.4 6.5 ±2.9 7.1 ±3.3 7.6 ±3.5
Imazapic 5.5 ±3.1 5.1 ±2.8 5.0 ±2.5 4.6 ±3.6

Assessing Habitat Management Techniques for Lomatium cookii, 2017 9
Figure 4. Average size (cm) of L. cookii in demographic plots at Illinois Forks State Park, 2014-2017. Error bars represent 95% confidence intervals. Letters above 2017 values represent significant differences between treatments using Tukey’s HSD test (P<0.001).
A
BB B
0
2
4
6
8
10
12
14
16
18
Control Fluazifop Glyphosate Imazapic
Ave
rage
pla
nt
size
(cm
)2014
2015
2016
2017

Assessing Habitat Management Techniques for Lomatium cookii, 2017 10
Plant Community Results are reported separately for the two groups, occupied and unoccupied plots, as the initial
plant community differed between the two areas. The initial composition of areas occupied with
L. cookii generally had less forbs (both native and invasive) and more graminoids, with a large
proportion of the graminoids present classified as native perennials (often Danthonia californica).
Occupied Habitat
Forbs Mean forb cover across all treatments increased from 12% in 2014 to 28% in 2017. All
treatments increased in native forbs from 2014 to 2017 (from 5% to 17%), however there was a
lot of variability between plots (Figure 5). Average cover of introduced forbs remained similar
from 2014 to 2017 (7% and 11%, respectively). Imazapic treatment showed a large (but not
significant) increase from 7%-19% cover; however, forb cover in all of these plots was extremely
variable. Dominant non-native forbs include Hypochaeris radicata and Trifolium dubium. The
dominant native forb species observed was Chloropogon pomeridianum, with most forbs having
average cover <1%. Of the 23 forb species noted in 2014, only 3 had average cover higher
than 1%; 6 of the 29 species noted in 2017 had cover >1% (Appendix F).
Graminoids Graminoid cover decreased in all occupied plots from 2014-2017, from 55% to 17% (Figure 6).
Native and introduced graminoid cover decreased across all treatment types from 2014 to 2017
(natives: 25% to 10%; introduced: 30% to 7%), including the control (Figure 6). From 2014 to
2017, changes in cover of the perennial Agrostis sp. (from 27% to 1%) and Danthonia californica
(from 28% to 10%) were the largest contributors to these decreases (Figure 7).
Native perennial graminoids decreased in cover in all treatments from 2014 to 2017 (24% to
10%). The only native graminoid to have more than 1% average cover was Danthonia californica.
Invasive annual graminoids with >1% cover include Cynosurus echinatus, Taeniatherum caput-
medusae, and Bromus hordeaceus (Appendix G). Introduced perennial graminoids (dominantly
Agrostis sp.) decreased across all treatments (19% to 0.5%) from 2014 to 2017, including the
control (Figure 7).

Assessing Habitat Management Techniques for Lomatium cookii, 2017 11
Figure 5. Average percent cover of forbs by treatment in the occupied habitat. Error bars represent 95% confidence intervals.
0
10
20
30
40
50
60
70
80
90
100
2014 2017 2014 2017 2014 2017
Forbs Combined Native Forbs Introduced Forbs
Mea
n c
ove
r (%
)Occupied Control
Fluazifop
Glyphosate
Imazapic

Assessing Habitat Management Techniques for Lomatium cookii, 2017 12
Figure 6. Average percent cover of graminoids by treatment in the occupied habitat. Error bars represent 95% confidence intervals.
0
10
20
30
40
50
60
70
80
90
100
2014 2017 2014 2017 2014 2017
Graminoids Combined Native Graminoids Introduced Graminoids
Mea
n c
ove
r (%
)
Occupied Control
Fluazifop
Glyphosate
Imazapic

Assessing Habitat Management Techniques for Lomatium cookii, 2017 13
Figure 7. Average percent cover of annual and perennial graminoids. Error bars represent 95%
confidence intervals.
Unoccupied Habitat
Forbs Forb cover increased across all plots from 2014 to 2017, from 26% to 44%. This was following
a decrease from 2014 to 2016 (Appendix F.). This increase was due to an increase in non-native
forbs across all treatment plots, including the control (Figure 8). The largest increases from 2014
to 2017 occurred in plots treated with fluazifop and glyphosate (from 29% to 51%, and 23%-
51% respectively). Native forbs remained similar in cover from 2014 to 2017 with no clear
treatment effects. Similar to the occupied plots, a total of 47 forb species were noted in 2017, 30
native and 17 introduced. In 2017, four native forb species had cover higher than 1% including
Madia spp., Trifolium variegatum, Chlorogalum pomeridianum, and Camassia quamash (Appendix
F). Dominant introduced forbs include Hypochaeris radicata and Torilis arvensis.
Graminoids Total graminoid cover decreased from 26% to 16% from 2014 to 2017, with decreases
occurring in all treatment plots (Figure 10). The largest decreases occurred in plots treated with
fluazifop (from 27% to 14%) and glyphosate (from 27% to 10%); this decrease was due to
decreases seen in introduced graminoids in those treatment plots. On average, native graminoid
cover remained low (<5%) and similar between 2014 and 2017, with high variability between
plots (Figure 10). The dominant native graminoid in the unoccupied plots was Achnatherum
0
10
20
30
40
50
60
70
80
90
100
2014 2017 2014 2017 2014 2017
Native Perennial Graminoids Introduced Annual Graminoids Introduced Perennial Graminoids
Mea
n c
ove
r (%
)Occupied Control
Fluazifop
Glyphosate
Imazapic
Assessing Habitat Management Techniques for Lomatium cookii, 2017 14
lemmonii. Introduced graminoids in the unoccupied habitat with cover >1% in 2014 (listed in
order of decreasing abundance) include Bromus hordeaceus, Cynosurus echinatus, Bromus rigidus,
Taeniatherum caput-medusae, and Bromus tectorum. In 2017, in addition to the previously listed
annual graminoids, Vulpia myuros, and Aira caryophyllea had cover >1% (Appendix G).
Figure 8. Average percent cover of forbs in unoccupied habitat. Error bars represent 95%
confidence intervals.
0
10
20
30
40
50
60
70
80
90
100
2014 2017 2014 2017 2014 2017
Forbs Combined Native Forbs Introduced Forbs
Mea
n c
ove
r (%
)
Unoccupied Control
Fluazifop
Glyphosate
Imazapic

Assessing Habitat Management Techniques for Lomatium cookii, 2017 15
Figure 9. Average percent cover of graminoid species in unoccupied habitat. Error bars represent
95% confidence intervals.
0
10
20
30
40
50
60
70
80
90
100
2014 2017 2014 2017 2014 2017
Graminoids Combined Native Graminoids Introduced Graminoids
Mea
n c
ove
r (%
)Unoccupied Control
Fluazifop
Glyphosate
Imazapic

Assessing Habitat Management Techniques for Lomatium cookii, 2017 16
Figure 10. Average percent cover of annual and perennial graminoids in unoccupied habitat.
Error bars represent 95% confidence intervals.
0
10
20
30
40
50
60
70
80
90
100
2014 2017 2014 2017 2014 2017
Native Perennial Graminoids Introduced Annual Graminoids Introduced Perennial Graminoids
Mea
n c
ove
r (%
)Unoccupied Control
Fluazifop
Glyphosate
Imazapic

Assessing Habitat Management Techniques for Lomatium cookii, 2017 17
Effects of Fire
Lomatium cookii Density
In 2017, density of L. cookii did not differ between burned and unburned plots at French Flat
Middle and South (Figure 11). Mean density in burned and unburned plots at French Flat South
was 6.6 vs. 7.9 m-2, respectively. At French Flat Middle, mean density in burned vs. unburned
plots was 5.2 vs. 7.0 m-2. Similarly, number of plants in each size/reproductive class did not
differ between burned and unburned plots, at both sites (Figure 12). At French Flat South, there
tended to be more vegetative plants in unburned plots, but the variability was so high within these
plots that differences were not significant. Similar to in 2016, size class “V3” (vegetative plants
with 3 or more leaves) were the most abundant representing roughly half of the plants in the
population. At both sites, seedlings were very rare (Figure 12). Proportion of reproductive plants
did not differ significantly between burned and unburned plots at either site (French Flat South:
0.34 vs. 0.23 respectively, French Flat Middle: 0.25 vs. 0.18 respectively; Figure 13). Across all
plots, grazing impacted 20% of all plants at French Flat South and 40% of all plants at French
Flat Middle. At both sites, grazing did not differ in burned vs. unburned plots (Figure 14).
Figure 11. Density of L. cookii in 2017 in the burned and unburned portions of French Flat Middle and French Flat South. Error bars represent 95% confidence intervals.
0
2
4
6
8
10
12
14
16
French Flat South French Flat Middle
Mea
n d
ensi
ty o
f p
lan
ts/m
2
Burned
Unburned

Assessing Habitat Management Techniques for Lomatium cookii, 2017 18
Figure 12. Mean number of plants in each size class at French Flat South and French Flat Middle, 2017. “V” indicates “vegetative” with the number following representing the number of leaves. “R” indicates “reproductive” with the number following representing the number of umbels. Error bars represent 95% confidence intervals.
0
2
4
6
8
10
12
14
16
Seedling V2 V3 R1 R2 R3
Mea
n #
of
pla
nts
in e
ach
si
ze/r
epro
du
ctiv
e cl
ass
French Flat SouthBurned
Unburned
0
2
4
6
8
10
12
14
16
Seedling V2 V3 R1 R2 R3
Mea
n #
of
pla
nts
in e
ach
si
ze/r
epro
du
ctiv
e cl
ass
French Flat MiddleBurned
Unburned

Assessing Habitat Management Techniques for Lomatium cookii, 2017 19
Figure 13. Mean proportion of reproductive L. cookii in burned and unburned plots at French Flat Middle and French Flat South in 2017. Error bars represent 95% confidence intervals.
Figure 14. Proportion of plants grazed in the burned and unburned portions of French Flat Middle and French Flat South in 2017. Error bars represent 95% confidence intervals.
0
0.1
0.2
0.3
0.4
0.5
0.6
0.7
French Flat South French Flat Middle
Pro
po
rtio
n o
f re
pro
du
ctiv
e p
lan
ts
Burned
Unburned
0
0.1
0.2
0.3
0.4
0.5
0.6
0.7
French Flat South French Flat Middle
Pro
po
rtio
n o
f gr
azed
pla
nts
Burned
Unburned

Assessing Habitat Management Techniques for Lomatium cookii, 2017 20
Plant Community
In the second year of monitoring post-burn, the burned plots tended to have less litter cover than
unburned plots at both French Flat South (22% vs. 53%) and French Flat Middle (49% vs. 66%;
Figure 15). The difference observed in 2017 was not as apparent as in 2016 at French Flat
South (14% vs. 51%), and at French Flat Middle (6% vs. 45%). Similar to in 2016, bare ground
cover was higher in the burned plots at French Flat South (40% vs. 18%), whereas at French Flat
Middle, there was no difference in bare ground cover in the burned vs unburned plots, instead
Rock/Gravel cover tended to be greater in burned plots (Figure 15).
The plant community responded similarly to the burn treatment at both sites. There was no
difference between burned and unburned plots on the cover of native forb species in either
meadow (Figure 16). Native graminoid cover tended to be less in the burned plots at both sites
with cover of 31% vs. 19% at French Flat South, and 26% vs. 17% at French Flat Middle (Figure
16). Cover of invasive grasses in both areas was low (<2%), thus differences between burned
and unburned plots are negligible with respect to total cover. Similarly, introduced forbs were
only present in the burned plots at French Flat Middle and covered less than 1% in total.

Assessing Habitat Management Techniques for Lomatium cookii, 2017 21
Figure 15. Ground cover in burned and unburned plots at French Flat South and French Flat
Middle in 2017. Error bars represent 95% confidence intervals.
0
10
20
30
40
50
60
70
80
90
100
Bare ground Litter Rock/Gravel
Me
an C
ove
r (%
)
French Flat South Unburned
Burned
0
10
20
30
40
50
60
70
80
90
100
Bare ground Litter Rock/Gravel
Me
an C
ove
r (%
)
French Flat MiddleUnburned
Burned

Assessing Habitat Management Techniques for Lomatium cookii, 2017 22
Figure 16. Forb and graminoid cover, by nativity, in burned and unburned plots at French Flat South and French Flat Middle in 2017. Error bars represent 95% confidence intervals.
0
10
20
30
40
50
60
70
80
90
100
Native Forb Introduced Forb Native Graminoid Introduced Graminoid
Me
an C
ove
r (%
)French Flat South Unburned
Burned
0
10
20
30
40
50
60
70
80
90
100
Native Forb Introduced Forb Native Graminoid Introduced Graminoid
Me
an C
ove
r (%
)
French Flat Middle Unburned
Burned

Assessing Habitat Management Techniques for Lomatium cookii, 2017 23
DISCUSSION
Lomatium cookii Response to Habitat Management Treatments
Prescribed Fire Since 2014, densities at both French Flat Middle and French Flat South have been among some of
the lowest recorded at these sites since monitoring began in 1993. Competition from other
(introduced) species, changes in soil pH and composition from needle and litter cast, encroachment
by shrubby and woody species, as well as climatic and other factors at French Flat may be
contributing to these declines. While burned plots had slightly lower densities of L. cookii than
unburned plots in the first season, this difference was not statistically significant. In the second
year post-burn, differences between burned and unburned plots were not significant at either
site. This suggests that burning could be a valuable management tool in occupied habitat, and
while it may not positively impact the density of L. cookii, it isn’t detrimental to this rare species
either. It was predicted that there would be increases in seedling recruitment and potentially an
increase in reproductive effort into the future in the burned plots. In 2017 we saw that while
burned plants had slightly higher proportions of reproductive plants, these differences were not
significant. Likewise, seedling recruitment did not differ between treatments, though the number
of recruits was relatively small in both treatments. Continued monitoring will be essential to see if
there is a lag-time in effects of the fire treatment on L. cookii density, reproductive effort, and
recruitment.
Additionally, expansion of the population into the newly cleared meadow edges is anticipated,
though it is possible that seed addition (or transplanting) as well as litter removal of Pinus (and
less so Quercus, Ceanothus and Arctostaphylos) may be recommended to accelerate the
colonization of the newly created meadow edges at both French Flat South and Middle, and to
increase connectivity between the two populated areas.
Invasive forb cover was low in all plots at French Flat (<1%), however, the presence of non-native
forb species only in burned plots highlights that management in this ACEC should consider early
detection and control of weedy species.
During monitoring of the L. cookii populations at French Flat in the recent past, an increase in the
presence of T. caput-medusae into the occupied habitat at French Flat Middle and French Flat
South has been noted. The presence of this weed species is particularly alarming, as the meadows
of the French Flat ACEC are otherwise dominated by native species. Aggressive control of this
invasive species is recommended.
Herbicide Treatments At Illinois Forks State Park, no significant differences were observed between survivorship or
recruitment between treated and control plots. Additionally, recruitment was noted in all plots.
Although none of the treatments resulted in satisfactory changes in the targeted non-native
species, the recruitment of new L. cookii individuals at least shows that the treatments did not
appear to do harm. Height was found to be statistically greater in control plots than in all plots
treated with herbicide, and future monitoring will enable us to see if these herbicide impacts
continue and what they mean for fitness of this species. These results are encouraging from a

Assessing Habitat Management Techniques for Lomatium cookii, 2017 24
land management perspective, as it indicates that careful, appropriate, and well-timed habitat
management can be performed in L. cookii occupied populations for the control of some
troublesome species.
Plant Community Response to Habitat Management Treatments
Illinois Forks State Park: At Illinois Forks State Park in the unoccupied (and weedy) habitat, there were visual differences
between the herbicide-treated plots even in the second year post-treatment, and in 2017 these
differences were detected in a portion of the plant community composition. While there was a
decline in graminoids across all treatments (including the control), the decline in introduced
graminoids in the fluazifop and glyphosate treated plots was greater than that in the control.
This decline was largely represented by declines in cover of introduced annual grasses. Previous
studies have shown that fall application of imazapic (pre-emergent herbicide) and spring
application of fluazifop (grass-specific herbicide), alone and in combination, reduced exotic
annual grasses for two years after treatment (Menke and Kaye 2016). Most changes in plant
community composition observed in 2017 in both occupied and unoccupied habitat occurred
across all treatments, including the controls. Because these vegetation changes were observed
even in the controls, these changes could be in part due to annual (and seasonal) differences
between water levels, or other climatic factors in this ephemeral vernal pool environment. For
example, the decrease in Agrostis sp. in the occupied plots is likely due to the retreat of the
species from the vernal pool edge; Agrostis sp. had encroached into the pool area during the
exceptionally dry season of 2013. Additionally, our monitoring occurred in the spring (May) of
each year, thus we may not have detected changes to the annual grass community in other parts
of the year. For example, T. caput-medusae germinates in the early fall, and it is possible that
due to the timing of our monitoring we did not fully detect changes in this species.
Recreational use at the Illinois Forks State Park has increased, and two of our plots were
eliminated from analysis due to increased traffic over the course of this study. In 2013, a disc-golf
course was established at the site, and while the course does not pass through L. cookii habitat, an
unofficial trail has been established leading through the population towards the northeast. In
recent years, a new picnic structure was constructed and bathroom facilities were upgraded.
Development on private property adjacent to the park may also have unknown effects on the
plant community and local hydrology.
French Flat: At French Flat, in the area occupied with L. cookii, cover of introduced grasses were so low that
we were not able to distinguish any effects of the fire on these problematic species in our
community data. However, invasive annual grasses (in particular T. caput-medusae) are becoming
more common, and encroaching from the edges of the meadow (and along the road) into the
portions of the meadow occupied by L. cookii. Currently, these patches are small and uncommon
enough that the species is only rarely detected in our monitoring, which focuses on the occupied
habitat. While native graminoid cover was lower in the first year post-fire at both French Middle
and French Flat South, this was mostly related to decreases in the size of bunches of Danthonia

Assessing Habitat Management Techniques for Lomatium cookii, 2017 25
spp. which continued to rebound in 2017. The longer-term effects of burning on T. caput-medusae
and other invasive species at this otherwise relatively pristine location can inform future
management actions.
At Illinois Forks State Park, in occupied habitat, plots have had a general shift (independent of
treatment) away from perennial graminoids towards more annual grasses (both native and
invasive). Continued habitat monitoring at French Flat will allow us to see if these changes are also
occurring at French Flat, and to detect longer-term responses to burning treatments.

Assessing Habitat Management Techniques for Lomatium cookii, 2017 26
LITERATURE CITED
Kagan, J. 1986. A new species of Lomatium (Apiaceae), from southwestern Oregon. Madroño
33 (1): 71-75.
Kagan, J. 1994. Habitat management plan for Lomatium cookii (Cook's desert-parsley) in the
Illinois Valley, Josephine County, OR. Oregon Natural Heritage Program. Portland,
Oregon 97210.
Kaye, T.N. and M. Blakeley-Smith. 2002. Vegetation survey of French Flat ACEC, Medford
District, BLM. Institute for Applied Ecology, Corvallis, Oregon and USDI Bureau of Land
Management, Medford District.
Kaye, T.N. and M. Kirkland. 1994. Population biology of Lomatium bradshawii. II. Sexual
expression, breeding system, and insect interactions. Unpub. Cooperative Challenge Cost
Share report, Oregon Department of Agriculture, Plant Conservation Biology Program and
Eugene District, BLM.
Knight, L. 1992. Baseline monitoring of Lomatium cookii. Bureau of Land Management, Medford
District. Medford, Oregon.
Menke, C. and T. N. Kaye. 2016. Weed management effectiveness testing in areas with Tygh
Valley Milkvetch. Oregon Department of Transportation. iii + 15pp.
Mousseax, M. 2004. French Flat. Kalmiopsis, Vol. 11:46-53.
Pfingsten, I.A., T.N. Kaye, and D.E.L. Giles. 2016. Lomatium cookii population monitoring in the
Illinois Valley, Josephine County, Oregon. Institute for Applied Ecology, Corvallis, Oregon
and USDI Bureau of Land Management, Medford District. ix + 44pp.
Oregon Biodiversity Information Center. 2016. Rare, Threatened and Endangered Species of
Oregon. Institute for Natural Resources, Portland State University, Portland, Oregon. 130
pp.
US FWS. 2012. Recovery Plan for Rogue and Illinois Valley Vernal Pool and Wet Meadow
Ecosystems. Region 1, Portland, Oregon. xvii + 240pp.

Assessing Habitat Management Techniques for Lomatium cookii, 2017 27
APPENDIX A. COORDINATES FOR UNOCCUPIED AND OCCUPIED HABITAT PLOTS AT ILLINOIS FORKS STATE PARK.
Unoccupied Habitat
River/ Road
Block tag #s NW/SE corners Meter sq. Plot tag# Coordinates of NW corner tag (NAD 83)
Road 901/902 903 904 905 906 42.15844011 -123.65429099
Road 907/908 909 910 911 912 42.1582578 -123.65404523
Road 913/914 915 916 917 918 42.15818086 -123.65393442
Road 919/920 21 22 23 24 42.15805706 -123.65332036
Road 925/926 927 928 929 930 42.15771742 -123.65269465
Road 931/932 933 934 935 936 42.15699775 -123.65173870
Road 937/938 939 940 941 942 42.15760075 -123.65262156
River 943/944 945 946 947 948 42.15576972 -123.65672392
River 949/950 951 952 953 954 42.15575723 -123.65665460
River 955/956 963 964 965 966 42.15552061 -123.65664622
River 961/962 963 964 965 966 42.15518818 -123.65698258
River 967/968 969 970 971 972 42.15531668 -123.65685635 1 The occupied plots can be found near Plots 901/902. The 25m baseline runs roughly North-South from #801 to
#802 and is marked with concrete markers on both ends.

Assessing Habitat Management Techniques for Lomatium cookii, 2017 28
Occupied Habitat
Plot# Treatment Transect #/Baseline
Meter
Location of Demography
Plot (m)
803 Control 843/21.5m 5.45
804 Fluazifop 843/21.5m 6.5
806 Imazapic 844/20.5m 4.6
807 Glyphosate 844/20.5m 5.6
808 Fluazifop 844/20.5m 7.5
809 Imazapic 845/19.5m 5.3
810 Control 845/19.5m 7.1
811 Imazapic 846/ 18.5m 6.15
812 Glyphosate 846/ 18.5m 7.4
813 Control 846/ 18.5m 6
814 Fluazifop 847/17.5m 15.15
815 Glyphosate 847/17.5m 7
816 Imazapic 847/17.5m 8.5
817 Control 848/16.5m 5.9
818 Glyphosate 848/16.5m 6.7
819 Fluazifop 848/16.5m 7.7
820 Glyphosate 849/ 15.5m 9.7
821 Control 849/ 15.5m 6.6
822 Imazapic 849/ 15.5m 7.8
823 Glyphosate 849/ 15.5m 9
824 Fluazifop 850/14.5 10.1
825 Control 850/14.6 7.8
826 Glyphosate 850/14.7 9.8
827 Fluazifop 850/14.8 10.85
828 Imazapic 850/14.9 13
829 Imazapic 851/13.5m 1.4
830 Fluazifop 851/13.5m 7.3
831 Fluazifop 851/13.5m 10.8
832 Control 852/13m 3.9
833 Glyphosate 852/13m 8.3
834 Imazapic 853/12.5m 4.4
835 Fluazifop 854/12m 3.5
836 Glyphosate 854/12m 5
837 Control 854/12m 7.3
838 Imazapic 855/11.5m 5.6
839 Control 856/11m 3.25
840 Fluazifop 856/11m 13.1
841 Glyphosate 858/9.5m 5.8
842 Imazapic 859/8.5m 3.7
401 Control 859/8.5m 5.9

Assessing Habitat Management Techniques for Lomatium cookii, 2017 29
APPENDIX B. AERIAL PHOTOS AND SCHEMATICS OF PLOTS IN THE UNOCCUPIED AND OCCUPIED HABITATS AT ILLINOIS FORKS STATE PARK.
Unoccupied Habitat There are a total of 12 macroplots, 7 near the entrance road to the park and 5 to the west closer
to the Illinois River. The baseline marking the occupied plots can be found near Plot 901/902.
GPS points are marked at opposite corners for each plot.
Overview of plots near the road.

Assessing Habitat Management Techniques for Lomatium cookii, 2017 30
Overview of plots near the river.

Assessing Habitat Management Techniques for Lomatium cookii, 2017 31
Schematic of macroplots #901, #907 and #913, as well as general location of occupied plots.

Assessing Habitat Management Techniques for Lomatium cookii, 2017 32
Schematic of macroplots #919, #925 and #937 in the unoccupied area.

Assessing Habitat Management Techniques for Lomatium cookii, 2017 33
Schematic of macroplot #931.

Assessing Habitat Management Techniques for Lomatium cookii, 2017 34
Schematic of macroplots #943, #949 and #955.

Assessing Habitat Management Techniques for Lomatium cookii, 2017 35
Schematic of macroplots #961 and #967.

Assessing Habitat Management Techniques for Lomatium cookii, 2017 36
Occupied Habitat There are 40 0.5mx0.5m plots established along 15m transects that run perpendicular to the 25m
baseline (#801-802). Location along the baseline, and location of the demography plot(s) along
the transects are recorded in the following table. The perpendicular transects are marked at
both ends with tagged 18” PVC, capped with IAE labels, and pounded into the ground with ~3-
6” exposed. The placement of the perpendicular transects and the location of the demographic
plot (s) along these transects were selected using a random number generator. If the randomly
selected target location did not have at least three L. cookii, the next closest suitable area along
the transect (with at least three L. cookii) was selected1. Demographic plots are marked with nails
and (hot pink) washers on opposite corners (NE – with tag and SW).
Schematic of plots established in the occupied habitat. In this diagram, white = imazapic, yellow
= control , red =glyphosate and blue/green = fluazifop .
1 Due to the limited size of the population, one to three plots in each treatment have only one or two plants instead of the targeted minimum of three plants.

Assessing Habitat Management Techniques for Lomatium cookii, 2017 37
APPENDIX C. LOCATIONS OF DENSITY AND DEMOGRAPHY PLOTS AT FRENCH FLAT MIDDLE AND FRENCH FLAT SOUTH.
French Flat Middle Established in 2013.
2013 New Plot
# Side of Tape
Location on Baseline (m)
End Rebar at
(m)
End Rebar Tag
2013 Last Plant Found at (m)
Demog. Tag
Demog. Plot Location (NE
Corner) Demog. Plot
Location (End)
165 W 2.8 30 166 25.95 33 11.43 10.9
154 W 6.5 37 153 34 1 11.2 10.75
155 E 6.5 37 156 26.5 3 18.05 18.55
161 E 9.1 40 162 35.2 8 23.25 23.75
163 E 9.7 40 164 39.55 7 15.5 16
163 E 9.7 40 164 38.05 10 33.25 33.75
28 W 15 37 29 35.7 876 18.55 19.05
167 E 17.5 40 166 38.05 - - -
30 E 19 39.3 31 35.1 - - -
33 W 22 40 34 28.1 877 23.45 23.95
169 W 25 40 170 38.7 37 22.24 21.71
171 E 27.1 33.5 172 33 38 2.4 2.9
199 W 31 30 200 29.3 - - -
35 E 35 40 36 38.6 - - -
173 E 36.6 40 174 36.6 874 20.5 30
173 E 36.6 40 174 36.6 875 11.2 11.7
175 W 40.2 35 176 31.85 167 23.45 23.95
158 W 43.1 30 157 20.6 18 13.2 12.7
159 E 43.5 30 160 28.25 28 5.2 5.7
177 E 46.6 35.5 178 33.9 29 5.1 5.6
179 E 55.1 15.4 180 13.7 31 4.75 5.25
181 W 56 20.4 182 19 - - -
183 E 60 11.3 184 11.05 - - -
185 E 62 10.8 186 9.7 - - -
187 W 67 9.9 188 6.7 - - -
189 E 72 15 190 14.9 168 6.5 7
37 W 74 16 38 6.9 - - -
191 W 82 15.5 192 11.4 169 2.5 2
193 W 86 10.5 194 3.5 - - -
195 E 89 21.4 196 19.5 170 - -
197 W 95 15 198 10.5 - - -
39 W 98 15 40 8.7 - - -

Assessing Habitat Management Techniques for Lomatium cookii, 2017 38
French Flat South Established in 2012.
2012
New Plot
#
Side of
Tape
Location on
Baseline (m)
End
Rebar at
(m)
End
Rebar
Tag
2012 Last Plant
Found at (m)
Demog.
Tag
Demog. Plot
Location (NE
Corner)
Demog. Plot
Location (End)
362 E 13 23 363 9.3 - - -
364 W 27 30 365 10.4 - - -
366 W 30 33 367 6.9 - - -
707 W 36 21 708 15.9 329 10.5 11 709 W 38 21 710 15.8 330 6.5 7
711 W 42 21 712 12.7 331 4 4.5
749 E 45 40 750 23.6 353 15.5 15
713 E 52 37 714 25.8 332 17.5 17
741 E 57 35 742 27.1 352 20.5 20
743 E 59 40 744 30.1 354 21.5 21 753 E 61 36 754 31.8 357 23 22.5
745 W 65 39 746 23.9 361 13.5 14
747 E 70 40 748 32.1 360 8.5 8
751 E 72 40 752 22.8 355 5.5 5
725 W 79 40 726 11.8 338 3 3.5
715 E 81 40 716 30.4 333 11.5 11
717 W 94 40 718 28.7 334 13.5 14
719 E 95 40 720 30.9 335 19 18.5
721 E 97 40 722 30.6 336 15.5 15
723 W 99 32 724 31.0 337 16 16.5
727 W 107 28 728 24.6 339 13 13.5
701 E 109 40 702 27.2 326 24.5 24
703 E 111 40 704 28.3 327 23 22.5
705 W 116 32 706 23.0 328 19 19.5
729 W 119 33 730 22.8 340 24 24.5
755 E 125 40 756 27 356 16.5 16
731 E 126 40 732 19.1 341 5.5 5
733 W 128 35.5 734 29.2 342 20 20.5
735 E 129 40 736 23.6 343 9 8.5
737 W 136 40 738 31.5 344 15 15.5
757 W 142 33 758 32.8 358 5 5.5
759 W 144 34 760 32.6 359 9.5 10
739 W 154 40 740 32.8 345 18 18.5

Assessing Habitat Management Techniques for Lomatium cookii, 2017 39
APPENDIX D. SCHEMATIC OF DENSITY AND DEMOGRAPHY PLOTS AT FRENCH FLAT MIDDLE AND FRENCH FLAT SOUTH.
French Flat Middle
Demography and density plots were established in 2013. Baseline transect is 100m with a
bearing of 034° (northeast). Last plants located on density plots are indicated by red crosses. Demography plots are indicated by blue squares and are not located along the baseline transect as shown here. The shaded areas were burned in the fall of 2015.

Assessing Habitat Management Techniques for Lomatium cookii, 2017 40
French Flat South
Demography and density plots were established in 2012. Baseline transect is 157m with a bearing due south. Last plants located on density plots are indicated by red crosses. Demography plots are indicated by blue squares. The shaded areas were burned in the fall of 2015.

Assessing Habitat Management Techniques for Lomatium cookii, 2017 41
APPENDIX E. NUMBER OF L. COOKII IN EACH DEMOGRAPHIC PLOT AT ILLINOIS FORKS STATE PARK, 2014-2017.
Treatment1 Plot # 2014 2015 2016 2017
CONTROL TOTAL 49 47 45 31
Control 401 3 3 3 3
Control 803 3 4 5 5
Control 810 17 15 12 1
Control 813 1 1 1 1
Control 817 3 3 3 3
Control 821 12 7 6 7
Control 825 3 3 4 5
Control 832 3 3 3 3
Control 837 2 2 2 2
Control 839 2 6 6 1
FLUAZIFOP TOTAL 25 29 31 50
Fluazifop 804 3 6 10 9
Fluazifop 808 1 1 1 1
Fluazifop 814 2 3 2 2
Fluazifop 819 1 1 1 1
Fluazifop 824 1 1 1 1
Fluazifop 827 4 4 3 4
Fluazifop 830 3 3 3 4
(Fluazifop) 831 17 27 27 25
Fluazifop 835 8 9 9 1
Fluazifop 840 2 1 1 2
GLYPHOSATE TOTAL 56 59 64 68
Glyphosate 807 4 3 3 3
(Glyphosate) 812 17 20 14 0
Glyphosate 815 8 10 16 13
Glyphosate 818 5 8 8 8
Glyphosate 820 5 4 5 6
Glyphosate 823 12 14 14 14
Glyphosate 826 11 9 7 14
Glyphosate 833 8 9 8 8
Glyphosate 836 2 1 2 2
Glyphosate 841 1 1 1 0

Assessing Habitat Management Techniques for Lomatium cookii, 2017 42
Treatment1 Plot # 2014 2015 2016 2017
IMAZAPIC TOTAL 55 51 50 46
Imazapic 806 1 1 2 1
Imazapic 809 12 10 8 0
Imazapic 811 3 3 4 3
Imazapic 816 9 11 10 9
Imazapic 822 7 5 5 6
Imazapic 828 1 1 1 1
Imazapic 829 3 3 3 2
Imazapic 834 15 13 13 19
Imazapic 838 1 1 1 1
Imazapic 842 3 3 3 4
1Plots in parentheses were not included in analysis in 2017.

Assessing Habitat Management Techniques for Lomatium cookii, 2017 43
APPENDIX F. PLANT COMMUNITY DATA (FORBS AND SHRUBS) FROM FORKS STATE PARK IN OCCUPIED AND UNOCCUPIED PLOTS, 2014-2017.
Total Forbs Native Forbs Introduced Forbs Tree/Shrub
2014 Avg. 95%C.I. Avg. 95%C.I. Avg. 95%C.I. Avg. 95%C.I. Unoccupied
control 28.5 5.2 9.0 2.6 19.4 5.0 0.1 0.2 fluazifop 29.3 10.4 6.3 4.8 22.9 11.4 0.4 0.1
glyphosate 23.8 13.5 11.0 3.1 12.8 13.6 0.1 0.8 imazapic 20.6 10.1 6.0 7.5 14.6 7.5 0.0 0.1
Occupied control 13.8 4.1 6.8 1.9 7.0 4.0 5.5 2.7
fluazifop 11.9 6.8 3.9 4.6 8.1 6.1 0.1 10.8 glyphosate 14.5 6.9 4.3 1.7 10.2 7.3 0.0 0.2
imazapic 9.4 12.5 7.2 2.0 2.3 12.8 0.0 0.0 2015
Unoccupied control 28.0 6.4 7.7 2.3 20.4 6.4 0.0 0.2
fluazifop 42.2 11.7 5.1 4.3 37.1 10.9 0.4 0.0 glyphosate 14.1 15.8 11.1 1.6 3.0 15.9 0.1 0.8
imazapic 23.4 7.6 2.0 7.5 21.4 1.3 0.0 0.2 Occupied 11.0 1.1 11.0 0.0
control 12.0 3.2 6.3 1.6 5.7 2.7 7.5 3.7 fluazifop 23.4 3.8 7.1 2.8 16.4 3.4 0.2 14.7
glyphosate 8.6 8.7 7.2 2.4 1.4 7.5 0.0 0.4 imazapic 13.9 2.2 8.0 2.2 5.9 0.8 0.0 0.0
2016 Unoccupied
control 26.7 5.5 8.3 2.6 18.5 5.2 0.0 0.3 fluazifop 42.5 7.0 9.7 4.3 32.8 6.9 0.6 0.0
glyphosate 26.0 10.7 14.1 4.4 11.9 11.8 0.3 1.1 imazapic 32.9 9.1 6.1 7.9 26.8 4.9 0.0 0.5
Occupied control 13.4 2.7 6.3 1.3 7.0 2.2 7.5 3.7
fluazifop 11.0 4.0 4.2 2.4 6.8 4.2 0.1 14.7 glyphosate 11.2 5.7 5.6 1.1 5.6 5.9 0.1 0.2
imazapic 13.3 5.9 7.2 2.0 6.1 4.5 0.0 0.1 2017
Unoccupied control 33.4 7.8 11.4 3.0 22.0 7.1 0.0 0.5
fluazifop 51.2 11.3 13.9 5.1 37.3 10.2 1.1 0.0 glyphosate 50.7 14.6 13.4 6.4 37.2 14.9 0.0 2.1
imazapic 41.1 18.9 10.1 6.4 31.0 17.3 0.0 0.0 Occupied
control 26.2 5.7 15.7 3.9 10.6 5.1 6.0 2.9 fluazifop 20.3 11.5 12.2 6.6 8.1 10.3 0.0 11.8
glyphosate 34.8 5.3 21.1 3.2 13.7 4.5 0.0 0.0 imazapic 32.1 15.2 19.3 10.5 12.8 14.6 0.0 0.0

Assessing Habitat Management Techniques for Lomatium cookii, 2017 44
APPENDIX G. PLANT COMMUNITY DATA (GRAMINOIDS) FROM FORKS STATE PARK IN OCCUPIED AND UNOCCUPIED PLOTS, 2014-2017.
Graminoids Combined Native Graminoids
Introduced Graminoids
Native Perennial Graminoids
Introduced Annual Graminoids
Introduced Perennial Graminoids
Mean Cover 95% C.I.
Mean Cover 95% C.I.
Mean Cover 95% C.I.
Mean Cover 95% C.I.
Mean Cover 95% C.I.
Mean Cover 95% C.I.
2014 Unoccupied Control 25.3 4.1 3.3 2.4 22.0 3.9 3.3 2.4 21.5 3.9 0.5 0.4
Fluazifop 27.0 8.8 1.2 5.7 25.8 8.1 1.2 5.7 25.8 8.3 0.0 1.0
Glyphosate 27.0 6.9 4.5 2.0 22.5 7.4 4.5 2.0 22.5 7.4 0.0 0.0
Imazapic 28.0 8.8 1.8 7.3 26.3 7.2 1.8 7.3 25.3 7.2 0.9 0.0
Occupied Control 47.0 7.0 26.7 6.1 20.3 6.3 26.7 6.1 9.9 3.6 10.3 7.7
Fluazifop 58.7 14.0 28.6 10.7 30.2 11.0 28.6 10.7 10.4 7.3 19.8 11.9
Glyphosate 56.3 13.1 19.5 13.6 36.8 11.6 19.5 13.6 8.1 7.0 28.7 15.6
Imazapic 59.7 15.2 28.1 12.1 31.5 13.7 28.1 12.1 11.5 5.7 20.0 17.6
2015 Unoccupied Control 32.4 5.1 2.1 1.1 30.3 5.0 2.1 1.1 30.0 5.0 0.3 0.2
Fluazifop 7.9 8.8 0.8 3.3 7.1 9.4 0.8 3.3 7.1 9.5 0.0 0.7
Glyphosate 2.0 6.9 1.0 1.1 1.0 7.1 1.0 1.1 1.0 7.1 0.0 0.0
Imazapic 22.0 1.6 2.0 1.6 20.0 0.6 2.0 1.6 19.8 0.6 0.3 0.0
Occupied
0.5
Control 32.1 6.3 11.7 4.3 20.4 3.9 11.7 4.3 17.5 3.8 2.9 1.6
Fluazifop 13.9 14.1 10.4 7.8 3.5 12.1 10.4 7.8 1.7 12.8 1.8 4.9
Glyphosate 1.1 7.8 0.7 7.8 0.4 1.7 0.7 7.8 0.4 1.3 0.1 1.6
Imazapic 24.6 1.0 18.3 0.6 6.4 0.4 18.3 0.6 1.7 0.4 4.7 0.0

Assessing Habitat Management Techniques for Lomatium cookii, 2017 45
Graminoids Combined Native Graminoids
Introduced Graminoids
Native Perennial Graminoids
Introduced Annual Graminoids
Introduced Perennial Graminoids
Mean Cover 95% C.I.
Mean Cover 95% C.I.
Mean Cover 95% C.I.
Mean Cover 95% C.I.
Mean Cover 95% C.I.
Mean Cover 95% C.I.
2016
Unoccupied Control 23.4 4.6 1.9 1.0 21.4 4.6 1.9 1.0 21.4 4.6 0.0 0.0
Fluazifop 8.3 7.6 0.8 3.2 7.5 7.7 0.8 3.2 7.5 7.7 0.0 0.0
Glyphosate 4.1 6.0 0.3 1.2 3.8 6.2 0.3 1.2 3.8 6.2 0.0 0.0
Imazapic 24.0 1.5 1.9 0.5 22.1 1.6 1.9 0.5 22.1 1.6 0.0 0.0
Occupied Control 26.9 4.0 8.3 2.4 18.6 3.2 8.3 2.4 17.1 3.2 1.5 0.8
Fluazifop 8.1 10.0 3.3 5.2 4.8 9.9 3.3 5.2 4.0 9.9 0.8 2.9
Glyphosate 3.5 2.9 0.8 2.1 2.7 2.5 0.8 2.1 2.4 2.8 0.3 0.6
Imazapic 13.4 1.3 9.4 0.8 4.0 1.4 9.4 0.8 3.2 1.5 0.8 0.4
2017 Unoccupied Control 20.4 2.6 1.1 1.2 19.3 2.4 1.1 1.2 19.3 2.4 0.0 0.0
Fluazifop 14.3 5.4 1.6 1.2 12.8 4.9 1.6 1.2 12.8 4.9 0.0 0.0
Glyphosate 10.5 4.4 1.3 2.9 9.1 4.6 1.3 2.9 9.1 4.6 0.0 0.0
Imazapic 20.6 3.8 2.5 2.0 18.1 3.4 2.5 2.0 18.1 3.4 0.0 0.0
Occupied Control 21.0 3.7 13.4 3.8 7.7 2.2 13.4 3.8 6.9 2.3 0.7 0.4
Fluazifop 13.6 8.9 5.9 8.7 7.7 4.6 5.9 8.7 7.2 4.7 0.5 0.8
Glyphosate 13.1 3.6 5.3 3.1 7.8 4.1 5.3 3.1 7.1 4.3 0.7 0.6
Imazapic 23.1 5.0 17.4 4.0 5.7 5.1 17.4 4.0 5.5 5.3 0.2 1.0

Assessing Habitat Management Techniques for Lomatium cookii, 2017 46
APPENDIX H. MEAN COVER OF THE PLANT COMMUNITY BY SPECIES IN OCCUPIED AND UNOCCUPIED PLOTS AT FORKS STATE PARK (2014-2017)
Species with 0.0 in italics indicates that the species was present with an average values <0.1% cover.
2014 2015 2016 2017
OCCUPIED: Y N Y N Y N Y N
Duration Native/Invasive Species GROUND COVER:
Litter grass - - 70.3 77.8 61.0 73.4 50.1 76.0
Litter oak - - 29.4 22.2 39.1 26.6 49.6 24.0
Bare ground 1.1 4.3 2.8 7.1 1.6 9.7 2.3 3.2
Litter 95.8 95.9 87.8 92.0 75.3 78.1 90.3 92.1
Moss 2.2 3.1 7.7 2.8 15.9 8.5 7.4 3.4
Rock 3.8 2.4 6.5 3.7 9.6 8.0 18.2 5.3
GRAMINOIDS:
Perennial Native Achnatherum lemmonii 0.6 2.4 0.4 1.4 0.3 1.2 0.5 1.5
Perennial Invasive Agrostis sp. 19.7 0.3 2.3 0.1 0.8 0.0 0.5 0.0
Annual Invasive Aira caryophyllea 0.4 0.9 0.3 1.4 1.3 3.4 1.5 2.4
Annual Invasive Avena fatua 0.0 0.0 0.0 0.0 0.0 0.0 0.0 0.0
Annual Invasive Briza minor 0.1 0.0 0.4 0.3 0.1 0.0 0.7 0.0
Annual Invasive Bromus hordeaceus 1.0 13.0 0.4 6.8 0.5 4.6 0.6 4.6
Annual Invasive Bromus rigidus 0.5 4.5 1.1 1.8 0.7 1.7 1.0 2.1
Perennial Native Bromus sp. 0.0 0.0 0.0 0.0 0.0 0.0 0.0 0.0
Annual Invasive Bromus tectorum 0.0 1.2 0.0 0.7 0.0 0.8 0.0 1.1
Perennial Native Carex sp. 0.2 0.0 0.0 0.0 0.0 0.0 0.0 0.0
Perennial Invasive Cynosurus cristatus 0.0 0.0 0.0 0.0 0.0 0.0 0.0 0.0
Annual Invasive Cynosurus echinatus 1.7 1.6 0.4 0.0 0.7 0.3 0.1 0.1

Assessing Habitat Management Techniques for Lomatium cookii, 2017 47
2014 2015 2016 2017
OCCUPIED: Y N Y N Y N Y N
Duration Native/Invasive Species Perennial Native Danthonia californica 24.4 0.1 9.8 0.0 5.0 0.0 7.3 0.1
Perennial Native Danthonia unispicata 0.0 0.0 0.0 0.0 0.0 0.0 0.0 0.0
Perennial Invasive Festuca roemeri 0.0 0.1 0.1 0.1 0.0 0.0 0.0 0.0
Perennial Native Festuca sp. 0.3 0.1 0.0 0.0 0.0 0.0 0.0 0.0
Perennial Native Isoetes nuttallii 0.0 0.0 0.0 0.0 0.1 0.0 0.9 0.0
Perennial Native Juncus sp. 0.2 0.0 0.0 0.0 0.0 0.0 0.5 0.0
Perennial Native Luzula sp. 0.0 0.0 0.0 0.0 0.0 0.0 0.0 0.0
Annual Invasive Poa bulbosa 0.0 0.0 0.0 0.0 0.0 0.0 0.2 0.7
Perennial Native Poa secunda 0.0 0.0 0.0 0.0 0.0 0.0 0.1 0.0
Annual Invasive
Taeniatherum caput-medusae 6.3 1.9 2.8 1.2 3.2 0.8 2.6 0.5
Annual Invasive Vulpia myuros 0.0 0.7 0.1 2.3 0.1 2.1 0.4 3.4
TREE/SHRUB:
Perennial Native Ceanothus cuneatus 0.0 0.1 0.0 0.1 0.0 0.1 0.0 0.3
Perennial Native Cercocarpus sp. 0.0 0.0 0.0 0.0 0.0 0.0 0.0 0.0
Perennial Native Quercus garryana 0.0 0.0 0.1 0.0 0.0 0.0 0.0 0.0
Perennial Native
Toxicodendron diversilobum 1.4 0.0 1.9 0.0 1.9 0.1 1.5 0.0
FORBS: Perennial Native Allium sp. 0.1 0.1 0.8 0.5 1.0 0.6 2.5 0.4
Perennial Native Brodiaea sp. 0.0 0.0 0.0 0.0 0.0 0.0 0.0 0.0
Annual Native Calandrinia ciliata 0.0 0.0 0.0 0.0 0.0 0.0 0.0 0.1
Perennial Native Calochortus uniflorus 0.0 0.0 0.2 0.0 0.2 0.0 0.1 0.0
Perennial Native Camassia quamash 1.1 0.1 0.9 0.2 0.8 0.1 1.8 0.0
Annual Native Cardamine oligosperma 0.0 0.0 0.0 0.0 0.0 0.0 0.0 0.0
Annual Native Castilleja tenuis 0.0 0.1 0.0 0.1 0.0 0.1 0.0 0.1

Assessing Habitat Management Techniques for Lomatium cookii, 2017 48
2014 2015 2016 2017
OCCUPIED: Y N Y N Y N Y N
Duration Native/Invasive Species Annual Invasive Centaurea cyanus 0.0 0.0 0.0 0.1 0.0 0.1 0.0 0.1
Annual Invasive Centaurium erythraea 0.0 0.0 0.0 0.0 0.0 0.0 0.0 0.0
Perennial Native Cerastium arvense 0.0 0.0 0.1 0.1 0.1 0.8 0.1 0.3
Perennial Invasive Cerastium glomeratum 0.0 0.2 0.0 0.2 0.0 0.0 0.0 0.0
Perennial Native
Chlorogalum pomeridianum 1.5 2.0 1.4 2.3 1.0 2.4 2.1 2.4
Annual Native Clarkia spp. 0.1 0.3 0.5 0.8 0.2 0.7 0.3 0.4
Perennial Invasive Crepis sp. 0.0 0.0 0.0 0.1 0.0 0.0 0.0 0.0
Annual Invasive Daucus pusillus 0.6 1.3 0.5 0.3 0.3 1.0 0.3 0.9
Perennial Native Dichelostemma sp. 0.0 0.0 0.0 0.0 0.0 0.1 0.0 0.1
Perennial Invasive Dipsacus fullonum 0.0 0.0 0.0 0.0 0.0 0.0 0.0 0.0
Perennial Native Dodecatheon sp. 0.0 0.0 0.0 0.0 0.0 0.0 0.0 0.0
Annual Native Epilobium spp. 0.0 0.0 0.0 0.0 0.0 0.0 0.0 0.0
Perennial Native Eriogonum sp. 0.0 0.0 0.0 0.0 0.0 0.0 0.0 0.0
Perennial Native Eriophyllum lanatum 0.0 0.0 0.0 0.0 0.0 0.0 0.0 0.0
Annual Invasive Erodium cicutarium 0.0 0.0 0.0 0.1 0.0 0.2 0.0 0.0
Annual Native Eschscholzia californica 0.0 0.3 0.0 0.2 0.0 0.3 0.0 0.3
Annual Invasive Galium parisiense 0.3 0.3 0.7 0.3 0.5 0.3 0.4 0.3
Annual Invasive Geranium dissectum 0.4 0.2 0.5 0.1 0.3 0.2 0.6 0.3
Perennial Invasive Geranium molle 0.0 0.0 0.0 0.0 0.0 0.0 0.0 0.0
Annual Native Githopsis specularioides 0.0 0.0 0.0 0.1 0.0 0.0 0.0 0.0
Annual Invasive Gnaphalium sp. 0.0 0.0 0.0 0.0 0.0 0.0 0.0 0.0
Perennial Invasive Hypericum perforatum 0.0 0.0 0.0 0.0 0.0 0.0 0.0 0.0
Perennial Invasive Hypochaeris radicata 0.5 7.0 3.4 14.9 3.3 15.1 5.7 21.8
Annual Invasive Lactuca sp. 0.0 0.0 0.0 0.1 0.0 0.1 0.0 0.0

Assessing Habitat Management Techniques for Lomatium cookii, 2017 49
2014 2015 2016 2017
OCCUPIED: Y N Y N Y N Y N
Duration Native/Invasive Species Annual Invasive Lamium purpureum 0.0 0.0 0.0 0.0 0.0 0.0 0.0 0.0
Annual Native Lathyrus nevadensis 0.1 0.0 0.2 0.0 0.0 0.0 0.3 0.0
Annual Native Limnanthes gracilis 0.2 0.0 0.2 0.0 0.9 0.1 3.5 0.2
Annual Native Linanthus bicolor 0.0 0.1 0.1 0.2 0.2 0.9 0.7 1.6
Annual Native Lithophragma parviflorum 0.0 0.0 0.0 0.0 0.0 0.0 0.0 0.0
Perennial Native Lomatium cookii 1.4 0.0 1.8 0.0 0.7 0.0 1.1 0.0
Annual Native Lotus micranthus 0.0 0.4 0.0 0.2 0.0 0.3 0.2 0.5
Annual Native Lotus unifoliolatus 0.0 0.3 0.0 0.3 0.0 0.3 0.0 0.6
Annual Native Lupinus bicolor 0.1 1.3 0.0 0.2 0.0 1.1 0.2 2.0
Annual Native Madia spp. 0.1 2.2 0.0 1.3 0.0 1.1 0.0 2.2
Annual Invasive Micropus californicus 0.1 0.2 0.1 0.2 0.1 0.3 0.2 0.5
Annual Native Mimulus sp. 0.0 0.0 0.0 0.0 0.0 0.0 0.2 0.0
Annual Invasive Moenchia recta 0.0 0.0 0.0 0.0 0.0 0.0 0.0 0.0
Perennial Native Moehringia sp. 0.0 0.0 0.0 0.0 0.0 0.0 0.0 0.0
Annual Invasive Myosotis discolor 0.1 0.1 0.4 0.3 0.3 0.1 0.1 0.0
Annual Native Navarretia sp. 0.0 0.0 0.1 0.0 0.1 0.0 0.0 0.1
Annual Native Nemophila sp. 0.0 0.0 0.0 0.0 0.0 0.0 0.0 0.0
Annual Native Orobanche uniflora 0.0 0.0 0.0 0.0 0.0 0.0 0.0 0.0
Annual Native Pectocarya pusilla 0.0 0.0 0.0 0.0 0.0 0.0 0.0 0.0
Annual Invasive Peplis portula 0.0 0.0 0.0 0.0 0.0 0.0 0.0 0.0
Annual Native Plagiobothrys sp. 0.0 0.0 0.0 0.0 0.0 0.1 0.0 0.0
Perennial Invasive Plantago lanceolata 0.0 0.2 0.0 0.1 0.0 0.1 0.0 0.1
Annual Native Plectritis congesta 0.0 0.0 0.0 0.0 0.0 0.0 0.0 0.0
Annual Native Ranunculus occidentalis 0.2 0.0 0.3 0.0 0.1 0.0 0.2 0.0
Perennial Invasive Rumex acetosella 0.0 0.4 0.0 0.2 0.0 0.0 0.0 0.0

Assessing Habitat Management Techniques for Lomatium cookii, 2017 50
2014 2015 2016 2017
OCCUPIED: Y N Y N Y N Y N
Duration Native/Invasive Species Annual Invasive Scleranthus annuus 0.2 0.4 0.3 0.2 0.1 0.0 0.2 0.0
Perennial Native Spiranthes sp. 0.0 0.0 0.1 0.0 0.0 0.0 0.0 0.0
Annual Native Thysanocarpus curvipes 0.0 0.1 0.0 0.0 0.0 0.1 0.0 0.1
Annual Native Tonella tenella 0.0 0.0 0.0 0.0 0.0 0.0 0.0 0.0
Annual Invasive Torilis arvensis 0.9 2.1 0.1 0.2 0.1 0.8 0.1 0.1
Annual Native Trifolium albopurpureum 0.0 0.0 0.1 0.0 0.2 0.0 0.0 0.1
Annual Native Trifolium bifidum 0.0 0.0 0.0 0.0 0.0 0.0 0.1 0.0
Annual Invasive Trifolium dubium 3.6 5.0 1.2 3.0 1.4 3.8 5.2 7.5
Annual Native Trifolium microcephalum 0.3 0.7 0.1 0.1 0.1 0.2 0.7 0.4
Annual Invasive Trifolium subterraneum 0.0 0.0 0.0 0.0 0.0 0.0 0.0 0.0
Annual Native Trifolium variegatum 0.0 0.0 0.0 0.0 0.0 0.0 1.8 0.0
Annual Native Trifolium willdenovii 0.1 0.0 0.1 0.0 0.0 0.0 0.4 0.0
Annual Native Trifolium wormskioldii 0.0 0.0 0.0 0.0 0.0 0.0 0.0 0.0
Annual Invasive Valerianella locusta 0.0 0.0 0.0 0.0 0.1 0.0 0.0 0.1
Perennial Native Veronica americana 0.0 0.0 0.0 0.0 0.0 0.0 0.0 0.0
Annual Invasive Vicia sativa 0.2 0.0 0.1 0.2 0.0 0.1 0.0 0.1
Perennial Native Viola hallii 0.1 0.0 0.2 0.0 0.1 0.0 0.3 0.0
Count of Species:
Introduced Graminoid Species 10 12 10 12 9 10 11 9
Native Graminoid Species 5 5 4 2 8 3 6 6
Total Graminoid Species 15 17 14 14 17 13 17 15
Introduced Forb 13 16 13 24 15 22 15 17
Native Forb Species 23 25 23 25 26 30 29 30

Assessing Habitat Management Techniques for Lomatium cookii, 2017 51
2014 2015 2016 2017
OCCUPIED: Y N Y N Y N Y N
Duration Native/Invasive Species
Total Forb 36 41 36 49 41 52 44 47
Count of species with values >1%
Invasive Graminoid Species 4 5 3 5 2 4 3 5
Native Graminoid species 1 1 1 1 1 1 1 1
Native Forb Species 3 3 2 2 1 3 6 4
Invasive Forb 1 4 2 2 2 3 2 2
Total Forb 4 7 4 4 3 6 8 6

Assessing Habitat Management Techniques for Lomatium cookii, 2017 52
APPENDIX I. PLANT COMMUNITY DATA BY FUNCTIONAL GROUP FOR BURNED AND UNBURNED PLOTS AT FRENCH FLAT MIDDLE AND FRENCH FLAT SOUTH (2017)
Native Forb Cover Invasive Forb Cover
Native Graminoid Cover
Introduced Graminoid Cover
Annual Introduced Graminoid Cover
Perennial Introduced Graminoid Cover
Mean 95% CI Mean 95% CI Mean 95% CI Mean 95% CI Mean 95% CI Mean 95% CI
French Flat Middle 8.92 3.01 0.01 0.01 20.59 8.65 0.34 0.23 0.29 0.22 0.05 0.10
Unburned 8.93 4.15 0.00 0.00 26.65 15.71 0.10 0.14 0.10 0.14 0.00 0.00
Burned 8.92 4.32 0.02 0.02 16.55 9.82 0.50 0.34 0.42 0.34 0.08 0.16
French Flat South 12.49 1.68 0.00 0.00 24.89 6.81 1.36 1.51 0.14 0.14 1.22 1.44
Unburned 13.91 2.62 0.00 0.00 31.09 10.69 1.26 1.50 0.16 0.28 1.10 1.41
Burned 11.24 2.04 0.00 0.00 19.48 8.10 1.44 2.56 0.12 0.12 1.32 2.44

Assessing Habitat Management Techniques for Lomatium cookii, 2017 53
APPENDIX J. MEAN COVER OF THE PLANT COMMUNITY BY SPECIES IN BURNED AND UNBURNED PLOTS AT FRENCH FLAT MIDDLE AND FRENCH FLAT SOUTH (2016-2017)
Year Duration Nativity Growth Form 2016 2017
SITE
FF MIDDLE FF SOUTH FF MIDDLE FF SOUTH
BURNED (Y/N)
N Y N Y N Y N Y
Bare ground
24.5 28.4 23.9 57.2 16.3 14.5 18.4 40.7
Litter
49.4 12.7 51.6 13.8 66.9 49.2 53.4 21.7
Rock/Gravel
25.9 44.8 14.3 26.3 18.8 45.4 28.6 25.2
Moss
2.1 12.5 4.3 4.3 3.9 6.4 4.3 4.6
Big rock
0.6 0.3 0.0 0.6 0.0 0.5 0.0 0.5
Agoseris heterophylla Annual Native Forb 0.0 0.0 0.0 0.1 0.0 0.0 0.0 0.0
Agrostis sp. Unknown Introduced Graminoid 0.0 0.0 0.0 0.0 0.0 0.0 0.0 0.0
Aira caryophyllea Annual Introduced Graminoid 0.0 0.1 0.0 0.0 0.1 0.1 0.0 0.1
Allium sp. Perennial Native Forb 3.5 2.5 3.6 5.2 1.9 1.0 2.6 3.2
Apocynum sp. Perennial Native Forb 0.0 0.1 0.0 0.5 0.0 0.0 0.0 0.0
Arctostaphylos sp. Perennial Native Tree/Shrub 0.0 0.0 0.0 0.0 0.0 0.0 0.0 0.0
Bromus hordeaceus Annual Introduced Graminoid 0.0 0.0 0.0 0.0 0.0 0.2 0.2 0.0
Bromus rigidus Perennial Introduced Graminoid 0.0 0.0 0.2 0.5 0.0 0.0 1.0 1.3
Bromus tectorum Annual Introduced Graminoid 0.0 0.0 0.0 0.0 0.0 0.0 0.0 0.0
Calochortus uniflorus Perennial Native Forb 1.6 0.4 1.7 0.6 2.1 0.6 2.1 0.8
Camassia sp. Perennial Native Forb 0.2 0.2 0.1 0.2 0.0 0.0 0.1 0.4
Carex tumulicola Perennial Native Graminoid 0.5 0.3 0.1 0.2 0.1 0.3 1.0 0.9
Castilleja attenuata Annual Native Forb 0.0 0.0 0.0 0.0 0.0 0.0 0.0 0.0
Castilleja rubicundula Annual Native Forb 0.0 0.1 0.0 0.0 0.0 0.0 0.0 0.0
Ceanothus cuneatus Perennial Native Tree/Shrub 0.0 0.3 0.0 0.0 0.0 0.0 0.0 0.0
Cerastium glomeratum Perennial Native Forb 0.0 0.8 0.0 0.0 0.0 0.2 0.0 0.0
Cercocarpus ledifolius Perennial Native Tree/Shrub 0.0 0.0 0.0 0.0 0.0 0.0 0.0 0.0
Chlorogalum sp. Perennial Native Forb 0.0 0.0 0.0 0.0 0.0 0.0 0.0 0.0
Clarkia gracilis Annual Native Forb 0.0 0.1 0.0 0.3 0.5 1.1 0.9 0.1
Claytonia sp. Annual Native Forb 0.0 0.0 0.0 0.0 0.0 0.0 0.0 0.0
Collomia heterophylla Annual Native Forb 0.0 0.0 0.0 0.0 0.0 0.0 0.0 0.0
Cynosurus echinatus Annual Introduced Graminoid 0.0 0.0 0.0 0.0 0.0 0.0 0.0 0.0
Danthonia californica/unispicata Perennial Native Graminoid 30.6 10.4 30.6 13.3 23.6 14.1 28.1 17.1
Daucus pusillus Perennial Native Forb 0.0 0.0 0.0 0.0 0.0 0.0 0.0 0.0

Assessing Habitat Management Techniques for Lomatium cookii, 2017 54
Year Duration Nativity Growth Form 2016 2017
SITE
FF MIDDLE FF SOUTH FF MIDDLE FF SOUTH
Deschampsia cespitosa Perennial Native Graminoid 1.9 1.2 0.1 0.0 1.0 1.1 0.0 0.0
Elymus glaucus Perennial Native Graminoid 0.1 0.1 0.0 0.0 0.0 0.0 0.0 0.0
Epilobium brachycarpum Annual Native Forb 0.1 0.2 0.2 0.1 0.3 0.1 0.6 0.3
Epilobium rigidum Perennial Native Forb 0.4 0.1 0.2 0.0 0.0 0.0 0.0 0.0
Festuca roemeri Perennial Native Graminoid 0.0 0.0 0.0 0.0 0.0 0.0 0.0 0.0
Galium aparine Annual Native Forb 0.0 0.0 0.0 0.0 0.0 0.0 0.0 0.0
Galium parisiense Annual Introduced Forb 0.0 0.0 0.0 0.0 0.0 0.0 0.0 0.0
Geranium dissectum Annual Introduced Forb 0.0 0.0 0.0 0.0 0.0 0.0 0.0 0.0
Gnaphalium sp. Annual Introduced Forb 0.0 0.0 0.0 0.0 0.0 0.0 0.0 0.0
Gratiola sp. Unknown Unknown Forb 0.0 0.0 0.0 0.0 0.0 0.0 0.3 0.0
Hesperochiron californicus Perennial Native Forb 1.2 0.1 0.1 0.1 0.9 0.5 0.4 0.5
Horkelia daucifolia Perennial Native Forb 0.0 0.5 1.3 0.5 0.1 0.2 0.6 0.3
Hypericum perforatum Perennial Introduced Forb 0.0 0.0 0.0 0.0 0.0 0.0 0.0 0.0
Hypochaeris radicata Perennial Introduced Forb 0.0 0.0 0.0 0.0 0.0 0.0 0.0 0.0
Isoetes sp. Perennial Native Graminoid 0.5 0.2 0.1 0.1 1.2 0.9 0.8 0.7
Juncus sp. Perennial Native Graminoid 0.0 0.0 0.5 0.0 0.5 0.1 0.6 0.0
Lathyrus nevadensis Perennial Native Forb 0.0 0.0 0.0 0.0 0.0 0.0 0.0 0.0
Limnanthes gracilis Annual Native Forb 0.0 0.0 0.0 0.0 0.0 0.0 0.0 0.0
Linanthus bicolor Annual Native Forb 0.0 0.1 0.0 0.2 0.3 0.4 0.0 0.1
Lomatium cookii Perennial Native Forb 0.7 0.5 0.8 0.9 1.4 0.9 1.1 1.0
Lotus micranthus Annual Native Forb 0.0 0.0 0.0 0.0 0.0 0.0 0.1 0.0
Lotus unifoliolatus Annual Native Forb 0.2 0.1 0.1 0.1 0.4 0.1 0.3 0.1
Lupinus bicolor Annual Native Forb 0.0 0.0 0.0 0.0 0.0 0.0 0.0 0.0
Luzula comosa Perennial Native Graminoid 0.1 0.0 0.1 0.0 0.1 0.0 0.1 0.0
Madia sp. Annual Native Forb 1.1 0.6 2.1 1.9 0.4 0.6 2.0 2.6
Micropus californicum Annual Native Forb 0.0 0.0 0.0 0.0 0.0 0.1 0.0 0.3
Mimulus sp. Annual Native Forb 0.0 0.4 0.1 0.0 0.0 1.5 0.5 0.0
Montia linearis Annual Native Forb 0.0 0.0 0.0 0.0 0.0 0.0 0.0 0.0
Myosotis discolor Annual Introduced Forb 0.0 0.0 0.0 0.0 0.0 0.0 0.0 0.0
native fescue perennial Perennial Native G 0.0 0.0 0.0 0.0 0.0 0.0 0.0 0.0
Navarretia intertexta Annual Native Forb 0.0 0.0 0.4 0.4 0.1 0.2 0.2 0.3
Nemophila sp. Annual Native Forb 0.0 0.0 0.0 0.0 0.0 0.1 0.0 0.0
Panicum sp. Perennial Introduced Graminoid 0.0 0.1 0.0 0.0 0.0 0.1 0.0 0.0

Assessing Habitat Management Techniques for Lomatium cookii, 2017 55
Year Duration Nativity Growth Form 2016 2017
SITE
FF MIDDLE FF SOUTH FF MIDDLE FF SOUTH
Pectocarya pusilla Annual Native Forb 0.0 0.2 0.1 0.0 0.0 0.6 0.1 0.1
Lythrum portula Annual Introduced Forb 0.0 0.0 0.0 0.0 0.0 0.0 0.0 0.0
Perennial Brome Perennial Unknown Graminoid 0.0 0.1 0.0 0.3 0.1 0.3 0.0 0.1
Perideridia sp. Annual Native Forb 0.0 0.0 0.0 0.0 0.0 0.0 0.1 0.0
Plagiobothrys sp. Annual Native Forb 0.0 0.0 0.0 0.0 0.0 0.0 0.0 0.0
Poa bulbosa Annual Introduced Graminoid 0.0 0.0 0.0 0.0 0.0 0.0 0.0 0.0
Poa compressa Perennial Introduced Graminoid 0.0 0.0 0.0 0.0 0.0 0.0 0.1 0.0
Poa secunda Perennial Native Graminoid 0.0 0.0 0.5 1.0 0.1 0.2 0.5 0.8
Quercus garryana Perennial Native Tree/Shrub 0.0 0.0 0.0 0.0 0.0 0.0 0.0 0.0
Ranunculus occidentalis Annual Native Forb 0.3 0.3 1.0 1.3 0.0 0.2 2.0 1.2
Saxifrage sp. Perennial Native Forb 0.0 0.0 0.0 0.0 0.0 0.0 0.0 0.0
Scleranthus annuus Annual Introduced Forb 0.0 0.0 0.0 0.0 0.0 0.0 0.0 0.0
Stipa lemmonii Perennial Native Graminoid 0.0 0.0 0.0 0.0 0.0 0.0 0.0 0.0
Taeniatherum caput-medusae Annual Introduced Graminoid 0.0 0.0 0.0 0.0 0.0 0.1 0.0 0.0
Thysanocarpus curvipes Annual Native Forb 0.0 0.0 0.0 0.0 0.0 0.0 0.0 0.0
Torilis arvensis Annual Introduced Forb 0.0 0.0 0.0 0.0 0.0 0.0 0.0 0.0
Trifolium dubium Annual Introduced Forb 0.0 0.0 0.0 0.0 0.0 0.0 0.0 0.0
Trifolium microcephalum Annual Native Forb 0.0 0.0 0.0 0.0 0.0 0.0 0.0 0.0
Trifolium variegatum Annual Native Forb 0.0 0.0 0.1 0.1 0.0 0.0 0.3 0.0
Trifolium willdenovii Annual Native Forb 0.0 0.0 0.0 0.0 0.0 0.0 0.0 0.0
Valerianella locusta Annual Introduced Forb 0.0 0.0 0.0 0.0 0.0 0.0 0.0 0.0
Vicia sativa Annual Introduced Forb 0.0 0.0 0.0 0.0 0.0 0.0 0.0 0.0
Viola hallii Perennial Native Forb 0.3 0.1 0.0 0.0 0.5 0.8 0.0 0.0
Vulpia bromoides Annual Introduced Graminoid 0.0 0.0 0.0 0.0 0.0 0.0 0.0 0.0
Zigadenus venenosus Annual Native Forb 0.0 0.0 0.1 0.0 0.1 0.0 0.0 0.0