assessing effectiveness of light rail transit systems: an...
TRANSCRIPT
Assessing Effectiveness of Light Rail Transit Systems: An Application of Malcolm Baldrige National Quality Award Criteria
Burton V. Dean and Taeho Park, San Jose State University
Light rail transit (LRT) has recently become an attractive urban transit system alternative in the United States. To enhance this momentum of increasing public acceptability, LRT quality and performance should be continuously improved by implementing principles of total quality management and closely monitored through the use of systematic evaluation methods. A structure and framework for conducting an internal assessment of quality and performance of an LRT system using the Malcolm Baldrige National Quality Award (MBNQA) criteria are presented. This approach is applied in an LRT case study as a self-assessment of LRT operations in the Santa Clara County Transit District (SCCTD). The self-assessment examination form was developed using the 1994 MBNQA examination criteria. The majority of SCCTD Quality Council members reported that the MBNQA criteria-based self-assessment methodology was a useful tool for evaluating the status of quality and performance of LRT operations, as well as for suggesting areas for improvement.
I ight rail transit (LRT) is a medium-capacity, streetcar-type transit system that is electrically
-J powered f rom overhead wires and runs along steel tracks wi th steel wheels. LRT operates on city streets and highways wi th either exclusive or shared rights-of-way. Starting in 1872 in Hanover, Germany,
many European and Asian countries have adopted LRT as their public urban transportation systems. Although U.S. cities began using electric streetcars in the late 1800s and the early 1900s, LRT in the U.S. had disappeared by the 1960s in favor of automobiles and buses. However, LRT has recently become an attractive urban transit system alternative in the United States owing to its greater flexibility (or mobility) than trains, better cost-effectiveness than cars, better movability than buses in a heavy traffic urban environment, lower construction costs than rapid transit systems, and alleviation of air pollution problems. To enhance this momentum of increasing public acceptability, LRT quality and performance should be continuously improved by implementing principles of total quality management (TQM) and closely monitored through the use of systematic evaluation methods.
Takyi et al. (1) emphasized that the benefits f rom implementing T Q M in transit environments wi l l vary depending on the specific objectives to be achieved, the procedures used in applying the concepts, the support provided by top and middle management, and the level of understanding of and expectation f rom the T Q M program. Examples of favorable results f rom recent T Q M applications in transit systems are seen in Toronto and Cleveland. The Toronto Transit Commission, within a year of implementing its T Q M program in
315

316 SEVENTH NATIONAL CONFERENCE ON LIGHT RAIL TRANSIT
1991, was able to reduce employee discourtesy complaints, complaints about vehicle operation, service delays, and door operation problems by 26 percent, 19 percent, 55 percent, and 22 percent, respectively. The quality improvement program estabhshed in 1989 at the Greater Cleveland Regional Transit Authority saved $500,000 in energy costs for 2 years. Although Oswald and Burati (2) demonstrated that T Q M can be used in the highway construction sector, Takyi et al. (1) found very few applications of T Q M in the public sector, particularly in the transit industry. In addition, a recent issue of Research Results Digest of the Transit Cooperative Research Program (3) also reported that "to date, only a few (transit) agencies have introduced innovative TQM-based practices."
Fielding (4) addressed the need for an effective transit performance evaluation method in the United States: " . . . the evaluations mandated by federal, state, and local legislation in the United States are deficient. . . . " He provided four components required for performance evaluation of public enterprise: dimensions that represent the objectives that motivated public intervention, indicators that translate objectives into quantitative measures, an information system that gathers appropriate data in a consistent manner to provide cross-sectional and time-series statistics, and an incentive system that rewards managers for improving performance. He also stated that performance reports should be reviewed by a performance committee that includes employee representatives.
Examining the Malcolm Baldrige National Quality Award (MBNQA) criteria used as a quaHty and performance assessment tool reveals that the seven categories of the criteria are representative of Fielding's components: leadership, information and analysis, strategic quality planning, himian resource development and management, quality assurance of programs and services, quality results, and customer satisfaction (5).
The M B N Q A criteria were originally developed to serve as a basis for giving Malcolm Baldrige National Quality Awards annually to recognize U.S. companies for business excellence and quality achievement (5). The M B N Q A criteria are designed to provide a comprehensive and structured approach to systematically assess manufacturing or service firms. Although the criteria had a strong bias toward manufacturing at the beginning, they are continuously improved through revisions based on suggestions and comments, and changes in thinking about quality systems.
The importance of quality in the service industry has been well recognized (6). Since 1990 there have been five M B N Q A winners in the service category: Federal Express Corporation (1990), A T & T Universal Card Services (1992), the Ritz-Carlton Hotel Company (1992), A T & T Consumer Communications Services
(1994), and GTE Directories Corporation (1994). The benefits f rom quality improvement programs revealed by the M B N Q A winners are numerous. For example. Quality Action Team (QAT), an employee involvement program at Federal Express Corporation, has saved $27 million in the personnel division for 4 years, $1.5 mil-Hon in recovered revenue by a computer automation QAT, and $462,000 in saved overtime payments in 6 months by a payroll QAT. Furthermore, across the United States, in corporations, government agencies, school systems, and nonprofit groups, organizations are discovering the value of using the M B N Q A criteria as a do-it-yourself quality assessment tool ki t to assess and improve quality (7).
This paper develops a structure and framework for conducting an internal assessment of quality and performance of an LRT system f rom a management perspective, using the M B N Q A criteria. The methodology is applied in an LRT case study, as a self-assessment of the LRT operations of the Santa Clara County Transit District.
MALCOLM BALDRIGE QUALITY AWARD CRITERIA AND APPLICATIONS
In confronting major foreign competition in its products and services, both U.S. industry and government have responded to increasing challenges in the global marketplace (8). The demand for continuous improvement of quality and productivity evoked national efforts to restore world leadership to the United States again, resulting in the initiation of a national quality award in 1987, the M B N Q A . Annual awards are given under the auspices of the Malcolm Baldrige National Quality Improvement Act. The purpose is fourfold: to stimulate U.S. companies to achieve excellence in business and quality achievement; to recognize outstanding companies to serve as a model for other companies; to establish guidelines that business, governmental, and other organizations can use to evaluate and improve their own quality efforts; and to share information of winning companies on successful quality and productivity improvement strategies and the benefits derived f rom implementation of these strategies (9).
Award applications are reviewed and evaluated on the basis of seven M B N Q A criteria categories (5):
1. Leadership: Senior executive leadership must be a driver for achieving organizations' common goals of customer satisfaction and retention and market share gains through quality and productivity improvement. This category examines the senior executives' personal leadership and involvement in creating and sustaining a customer focus and clear and visible quality values.

DEAN AND PARK 317
Also examined is how the quality values are integrated into the company's management system, including how the company addresses its public responsibilities and corporate citizenship.
2. Information and analysis: A company's information system is very important for fact-based management and operations and for benchmarking processes. This category examines the scope, management, and use of data and information to maintain a customer focus, to drive quality excellence, and to improve operational and competitive performance.
3. Strategic quality planning: Strategic quality planning is necessary to understand customer and operational requirements, to ensure effective and efficient deployment of the requirements at all levels of an organization, and to make the best use of resources. This category examines the company's plarming process and how all key quality and operational performance requirements are integrated into overall business planning.
4. Human resource development and management: Effective human resource development and management should be tied into a company's strategic direction so that high performance workplace practices become part of an organizational strategy. This category encompasses how well human resource plaiming is developed to empower employees and cotmected with strategic directions, and how a company's job design, compensation, education and training, and recognition programs can stimulate all employees to work in efficient and productive ways.
5. Management of process quality: Continuous improvement of quality in processes of operations and ser
vices is critical in meeting or exceeding customers' needs. Key elements of process management, including management of day-to-day operations, continuous improvement of quality and operational performance, and quality assessment are examined to ensure that customer requirements and expectations are met. Actions and plans for improving supplier quality are also part of the examination in this category.
6. Quality and operational results: This category focuses on the company's achievement levels and improvement trends in quality, company operational performance, and supplier quality. Also examined are current quality operational performance levels relative to those of competitors.
7. Customer focus and satisfaction: The company's relationships wi th customers, its knowledge of customer requirements, and the key quality factors that drive market competitiveness are measured. Also examined are methods of determining levels of customer satisfaction and retention.
The M B N Q A framework in Figure 1 presents dynamic relationships among the above seven categories (5). The framework is composed of four basic connected and integrated elements: driver, system, goals, and measures of progress. In the 1994 criteria, there are 28 "examination items" under the seven categories and 91 areas to address. Examination items, the main subcategories of the examination category, are given a point value. The number of items in each examination category varies f rom two to six. Each examination item
Senior Executive Leadership
LO
^^i tem^
Management ofProcesj
Quality 5,0
Human Resource
Development and
Management 4.0
Strategic Quality Planmng
Information I J and Analysis ^ 2.0
/
\
Customer Focus and Satisfaction
7.0
Quality and Operational
Results 6A
' Customer Satisfaaion
' Customer Satisfaction Relative to Competitors
* Customer Retention ' Market Share Gain
Measures of Progress
• Product & Service Quality
• Productivity Improvement
•Waste Reduction/ Elimination
• Supplier Quality
FIGURE 1 Framework of dynamic relationships among MBNQA criteria (5).

318 SEVENTH NATIONAL CONFERENCE ON LIGHT RAIL TRANSIT
consists of a set of "areas to address" that require the M B N Q A applicants to submit specific information.
M B N Q A applications are scored on a three-dimensional scoring system: approach, referring to specific tools and techniques a company uses to improve its quality; deployment, referring to the extent of the implementation of the company's approaches throughout all relevant areas in the organization; and results, referring to the outcomes in accomplishing the purposes addressed in the examination items. A scoring guideline to be used in assigning item scores for these three dimensions is provided to M B N Q A examiners.
Although the M B N Q A criteria were designed to be used to make annual awards and to provide information about quality and operational performance to applicants, they have also been used as an effective self-assessment tool in many organizations (7,10). For instance. Digital Equipment, Inc., has not reapplied for the M B N Q A since its original application in 1988; however, the company continues to use the M B N Q A criteria for assessing the status of its quality. Varian Associates, Inc., has also used the Baldrige criteria as a basis for evaluating its quality system and was planning at the time of this study to apply for a 1995 M B N Q A Award. Although relatively few organizations have sought the M B N Q A , many want to learn how well they are performing and how they can improve their quality and productivity and prefer an inexpensive means, such as an M B N Q A criteria-based self-assessment (11). A Quality Progress 1995 survey (12) has also verified that the M B N Q A criteria are being used by many firms primarily to obtain information on how to achieve business excellence, and the criteria's usefulness has met or exceeded many users' expectations.
There are several different approaches to using the M B N Q A criteria as a company's self-assessment tool: as a source of examiners (internal or external examiners), as assessment criteria (the Baldrige criteria with or without modification), and as a basis for internal awards. Although many companies such as McDonnell-Douglas and National Car Rental use the M B N Q A criteria without modification. Control Data expanded the M B N Q A criteria to structure the Control Data Quality Award with 11 categories. State (e.g., Minnesota) and company (e.g., I B M , Intel, and Honeywell) quality awards based on the M B N Q A criteria have been established to promote awareness of quality and to subsequently improve quality and productivity (7).
SYSTEMS DESCRIPTION OF THE SANTA CLARA COUNTY TRANSFT DISTRICT
The California Santa Clara County light rail transit system is an updated version of San Jose's streetcar system.
which had overhead electric wires and steel wheels running along street tracks. The system is one of the longest light rail lines built in the past 50 years in the United States and is the first financed in part by the 5 cent federal gas tax. I t started with 9 mi of light rail, f rom Santa Clara through downtown San Jose, which were completed in June 1988. The entire 20-mi line was completed in Apr i l 1991 and has 33 stations. The main objective of building this light rail system is to move Santa Clara County into the future wi th an alternative means of transportation that can comfortably and swiftly carry many more people per traffic lane without creating traffic jams and air pollution.
Most commute day trips originate f rom the housing areas at the southern end of the line. Passengers may park free at one of the nine LRT stations with park-and-ride lots or take feeder buses to the stations. For bicyclists, bike storage lockers are available. Tickets are purchased f rom a self-service vending machine, and passengers enter the vehicle f rom a boarding platform. At destination stops, passengers may board feeder buses or special shuttles to travel farther. The current LRT system has 50 light rail vehicles (LRVs) and 6 trolleys, wi th 34 cars in service each day.
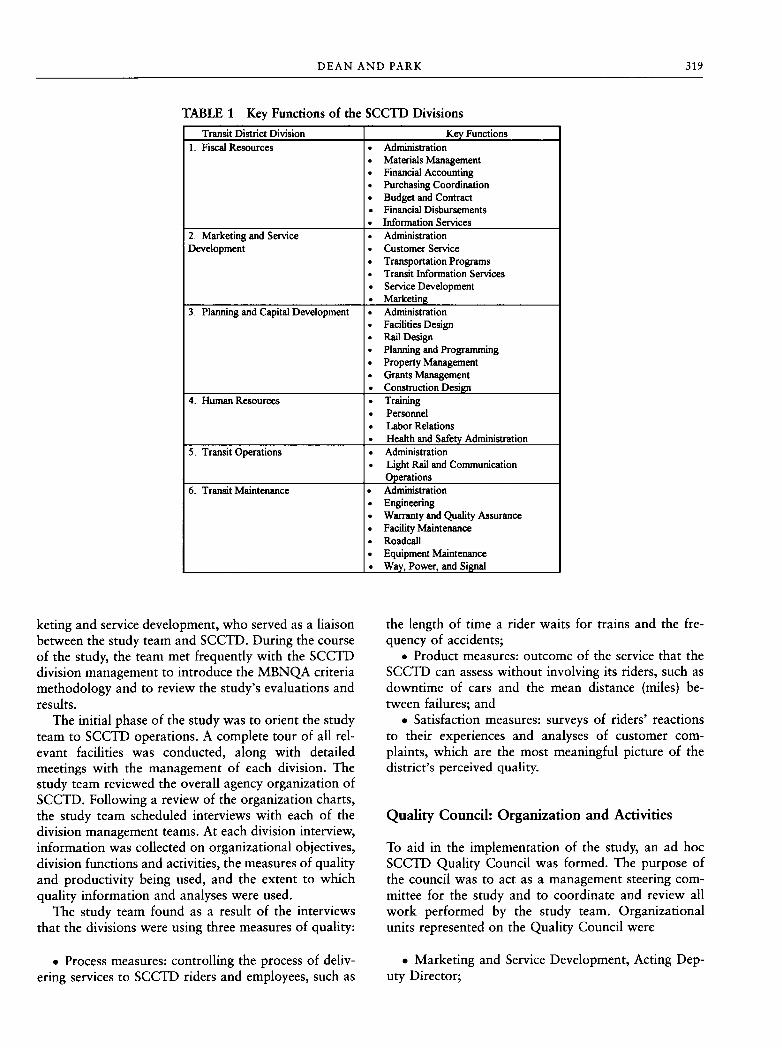
On January 1, 1995, the Santa Clara County Transit District (SCCTD) was separated f rom the Santa Clara County Transportation Agency and combined wi th the Congestion Management Agency to form an independent organization. SCCTD is composed of a 12-member board of directors, an independent general counsel team providing legal consultations, a general manager, and an assistant general manager. SCCTD consists of six divisions (Fiscal Resources, Marketing and Service Development, Planning and Capital Development, Human Resources, Transit Operations, and Transit Maintenance) and the Congestion Management Agency. Employees in the SCCTD number approximately 2,000. Each division processes two operations: bus and light rail transit. The systems description presented below is limited to SCCTD's light rail operation. Table 1 describes the key functions of the SCCTD divisions.
CASE STUDY: APPLYING THE M B N Q A CRITERIA IN S C C T D
Organization and Structure of Case Study
This study was organized using the systems approach, as shown in Figure 2, to test the effectiveness of the M B N Q A criteria in the SCCTD (13). The study team met wi th the SCCTD director to describe the study's objectives and to obtain recommendations on the approach to be followed. The SCCTD director requested the study team to work closely wi th the director of mar-
DEAN AND PARK 319
TABLE 1 Key Functions of the SCCTD Divisions Transit District Division Key Functions
1. Fiscal Resources • Administration • Materials Management • Financial Accounting • Purchasing Coordination • Budget and Contract • Financial Disbursements • Information Services
2. Marketing and Service Development
• Administration • Customer Service • Transportation Programs • Transit Information Services • Service Development • Marketing
3. Planning and Capital Development • Administration • Facilities Design • Rail Design • Planning and Programming • Property Management • Grants Management • Construction Design
4. Human Resources • Training • Personnel • Labor Relations • Health and Safety Administration
S. Transit Operations • Administration • Light Rail and Communication
Operations 6. Transit Maintenance • Administration
• Engineering • Warranty and Quality Assurance • Facility Maintenance • Roadcall • Equipment Maintenance • Way, Power, and Signal
keting and service development, who served as a liaison between the study team and SCCTD. During the course of the study, the team met frequently with the SCCTD division management to introduce the M B N Q A criteria methodology and to review the study's evaluations and results.
The initial phase of the study was to orient the study team to SCCTD operations. A complete tour of all relevant facilities was conducted, along with detailed meetings with the management of each division. The study team reviewed the overall agency organization of SCCTD. Following a review of the organization charts, the study team scheduled interviews with each of the division management teams. At each division interview, information was collected on organizational objectives, division functions and activities, the measures of quality and productivity being used, and the extent to which quality information and analyses were used.
The study team found as a result of the interviews that the divisions were using three measures of quality:
the length of time a rider waits for trains and the frequency of accidents;
• Product measures: outcome of the service that the SCCTD can assess without involving its riders, such as downtime of cars and the mean distance (miles) between failures; and
• Satisfaction measures: surveys of riders' reactions to their experiences and analyses of customer complaints, which are the most meaningful picture of the district's perceived quality.
Quality Council: Organization and Activities
To aid in the implementation of the study, an ad hoc SCCTD Quality Council was formed. The purpose of the council was to act as a management steering committee for the study and to coordinate and review all work performed by the study team. Organizational units represented on the Quality Council were
• Process measures: controlling the process of delivering services to SCCTD riders and employees, such as
• Marketing and Service Development, Acting Deputy Director;

320 SEVENTH N A T I O N A L CONFERENCE O N L I G H T R A I L T R A N S I T
Fonn 1 quility steering council (or, team) composed of senior and top management in an organization.
Review and analyze the Baldrige criteria and assessment process.
Develop a form for self-assessment based on the Baldrige criteria, an assessment procedure, and a scoring stnicture.
Refine the self-assessment form, assessment procedure, and scoring stnicture, if necessary.
Complete the self-assessment form and provide necessary evidence and documentation for the assessment.
Assess and score the quality and performance of participating divisions or departments.
Analyze strengths and uteaknesses based on the assessment scores and their comparison with previous ones, if possible.
Develop a plan for removing weaknesses and for maintaining or fiirther improving strengths.
Implement the quality improvement plan.
FIGURE 2 Procedure for applying Baldrige criteria to internal assessment of an organization.
• Human Resources, Deputy Director; • Way, Power, and Signal, Superintendent; • Transit Administration, Assistant Director—Tran
sit Operations; • Fiscal Resources, Deputy Director; • Maintenance Operations, Manager; • Light Rail Operations, Manager; • Equipment Maintenance, Manager; and • Planning and Capital Development, Director.
Three Quality Council workshops were held:
• Workshop 1: The objectives and plans for the case study were introduced to Quality Council members. They reviewed the M B N Q A process and its criteria. The procedures in applying the M B N Q A criteria to self-assessment for the LRT operation were discussed.
• Workshop 2: A draft of the Baldrige criteria-based examination form developed by the study team was reviewed by the Quality Council. The council agreed to use the 1994 M B N Q A criteria scores for the examination items without any modification. In this case study, as a demonstration project, examination items were as
signed for self-assessment to the council members responsible for the corresponding areas of management.
• Workshop 3: Results of the Baldrige criteria application were reviewed and discussed. Comments and suggestions were made on the examination form developed during this case study, the scores of individual examination items, the assessment procedure, and the resources required for the self-assessment. In addition, comparisons of 1994 and 1995 M B N Q A criteria were discussed (5).
Development of an MBNQA Criteria-Based Self-Assessment Form
After analyzing the operations of the SCCTD LRT system, the study team developed an internal assessment form and a scoring system based on the 1994 Baldrige examination criteria. The Quality Council agreed to use the same examination categories, items, and weighted scores as the 1994 M B N Q A evaluation.
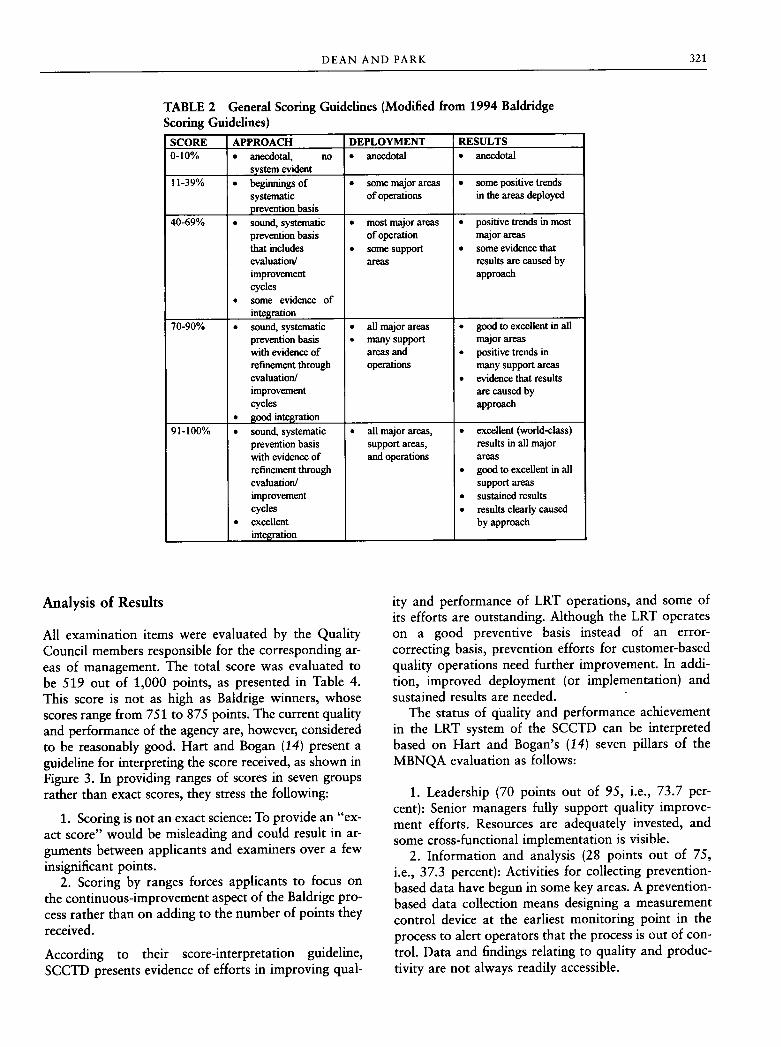
In the Baldrige examination process, examiners score items on the basis of guidelines of relevant evaluation dimensions among approach, deployment, and results. [Refer to the scoring guidelines of the National Institute of Standards and Technology (5).] For example, although Item 1.1, Senior Executive Leadership, is evaluated considering approach and deployment. Item 7.5, Customer Satisfaction Results, has only one evaluation dimension, results. Each item has at least one examination area to be evaluated. The scoring guidelines presented in Table 2 are based on the 1994 Baldrige scoring guidelines, which separate approach f rom deployment.
Each category in the examination form is composed of three sections: objectives, terms and notes, and assessment items. Each assessment item has two subsections: the first subsection describes the item, and the second subsection lists detailed areas to be examined. Examination areas contain the dimensions in which they must be evaluated on the basis of evidence and documents submitted. Table 3 presents an example (i.e., the first item of Category V) of the structure of the examination form used in this study.
After reviewing evidence and documents provided for all examination areas relating to each item, the Baldrige examiners determine the score of the item on the basis of the scoring guideline. The examination process used in this study is slightly different f rom that of the Baldrige examination in that each examination area in an item is evaluated separately in using dimensions associated wi th it . Percentages assigned to all examination areas in the item are combined to yield a single score. A scoring calculation format is provided in the examination form, as presented in Table 3.
DEAN AND PARK 321
TABLE 2 General Scoring Guidelines (Modified from 1994 Baldridge Scoring Guidelines)
SCORE APPROACH DEPLOYMENT RESULTS 0-10% • anecdotal, no
system evident • anecdotal • anecdotal
11-39% • beginnings of systematic prevention basis
• some major areas of operations
• some positive trends in the areas deployed
40-69% • soimd, systematic prevention basis that includes evaluation/ improvement cycles
• some evidence of integration
• most major areas of operation
• some support areas
• positive trends in most major areas
• some evidence that results are caused by approach
70-90% • soimd, systematic prevention basis with evidence of refinement through evaluation/ improvement cycles
• good integration
• all major areas • many support
areas and operations
• good to excellent in all major areas
• positive trends in many support areas
• evidence that results are caused by approach
91-100% • sound, systematic prevention basis with evidence of refinement through evaluation/ improvement cycles
• excellent integration
• all major areas, support areas, and operations
• excellent (world-class) results in all major areas
• good to excellent in all support areas
• sustained results • results clearly caused
by approach
Analysis of Results
A l l examination items were evaluated by the Quality Council members responsible for the corresponding areas of management. The total score was evaluated to be 519 out of 1,000 points, as presented in Table 4. This score is not as high as Baldrige winners, whose scores range from 751 to 875 points. The current quality and performance of the agency are, however, considered to be reasonably good. Hart and Bogan (14) present a guideline for interpreting the score received, as shown in Figure 3. In providing ranges of scores in seven groups rather than exact scores, they stress the following:
1. Scoring is not an exact science: To provide an "ex-aa score" would be misleading and could result in arguments between applicants and examiners over a few insignificant points.
2. Scoring by ranges forces applicants to focus on the continuous-improvement aspect of the Baldrige process rather than on adding to the number of points they received.
According to their score-interpretation guideline, SCCTD presents evidence of efforts in improving qual
ity and performance of LRT operations, and some of its efforts are outstanding. Although the LRT operates on a good preventive basis instead of an error-correcting basis, prevention efforts for customer-based quality operations need further improvement. In addition, improved deployment (or implementation) and sustained results are needed.
The status of quality and performance achievement in the LRT system of the SCCTD can be interpreted based on Hart and Bogan's (14) seven pillars of the M B N Q A evaluation as follows:
1. Leadership (70 points out of 95, i.e., 73.7 percent): Senior managers ful ly support quality improvement efforts. Resources are adequately invested, and some cross-functional implementation is visible.
2. Information and analysis (28 points out of 75, i.e., 37.3 percent): Activities for collecting prevention-based data have begun in some key areas. A prevention-based data collection means designing a measurement control device at the earliest monitoring point in the process to alert operators that the process is out of control. Data and findings relating to quality and productivity are not always readily accessible.

322 SEVENTH N A T I O N A L CONFERENCE O N L I G H T R A I L T R A N S I T
TABLE 3 Example of the Structure of Examination Form Using the First Item of Category V
V. MANAGEMENT OF PROCESS QUALITY V. l . Objectivei V.2. Terms and Notes V.3. Assessment Areas to Address V.3.1. Design and Introduction of Quality Services
Concerns: What to look for regarding: • Existence of procedures to translate customer requirements into operations/service
requirements. Approach Score: %
Evidence/Documentation:_ Comments/Sugjtested Action:
Deployment Score: % Evidence/Documentation: Comments/Suggested Action:
Existence of an appropriate operational performance plan. Approach Score: % Deployment Score: % Adequate reflection of operations/service quality requirements into the overall long-and short-term operatiort/procurement/service planning processes. Approach Score: % Deployment Score: •/. Proper coordination and integration of the operation/procurement/service planning processes to include all phases of the operations, procurement, and direct customer services. Approach Score: •/• Deployment Score: •/. Consistent and systematic review/evaluation process for the operation and service performance, and part supplier quality and delivery capability. Approach Score: % Deployment Score: %
Average Scores: Approach (A) Deployment (D) _
Score for this item: 40 pts i (A + D) / 2:.
V.
j t s .
3. Strategic quality planning (27 points out of 60, i.e., 45.1 percent): Senior management starts to get involved and a few fundamental processes are restructured. However, SCCTD's LRT system needs to plan and develop projects and programs to increase rider-ship. Quality is also still mostly a defensive posture, focused primarily on internal processes and on the elimination of occurring problems, not on aggressively identifying and planning to meet customer needs. These results imply that the SCCTD needs to restructure its fundamental processes to achieve better customer satisfaction through increasing ridership and quaUty of LRT operations. Since senior SCCTD managers fully support quality improvement efforts as identified in the leadership evaluation, this restructuring would, once initiated, be strongly supported by SCCTD top management.
4. Human resource development and management (108 points out of 150, i.e., 72.0 percent): Human resource management plans take quality improvement
process requirements into account. As a result of the SCCTD's staff development programs, most managers and many employees have been trained in aspects of total quality management. The team approach has been used to improve quaHty and productivity, and significant resources have been dedicated to training. Employee survey and analysis reports show an increase in employees' involvement and an improvement in their work attitudes.
5. Management of process quality (57 points out of 140, i.e., 40.7 percent): Customer needs are reflected in service design. Cycles of evaluation and improvement are in place but not widely deployed throughout SCCTD. There is some integration of prevention and correction.
6. Quality and operational results (116 points out of 180, i.e., 64.4 percent): Quality improvement systems in many areas of operations and many support functions are strongly integrated. Trends in vendor quality show strong improvement.

DEAN AND PARK 323
TABLE 4 Quality Scores of Examination Items Evaluated by Quality Council Members
1.0 Leadership 70/95 pts 1.1 Senior Executive Leadership 1.2 Management for Quality 1.3 Public Responsibility and Corporate Citizenship
35 /45 pts 20 /25 pts 15 /25 pts
2.0 Information and Analysis 28 /7S pts 2.1 Scope and Management of Quality and Performance Data and
Information 2.2 Competitive Comparison and Benchmarking 2.3 Analysis and Uses of Assessing Unit-Level Data
7/15 pts
7 /20 pts 14 /40 pts
3.0 Strateeic Quality Plannins 27 /60 pts 3.1 Strategic Quality and Assessing Unit Performance Planning
Process 3.2 Quality and Performance Plans
14 /35 pts
13 /25 pts
4.0 Human Resource Development and Management 108 /150 pts 4.1 Human Resource Planning and Management 4.2 Employee Involvement 4.3 Employee Education and Training 4.4 Employee Performance and Recognition 4.5 Employee Well-Being and Satisfaction
20 /20 pts 30 /40 pts 40 /40 pts 9 / 25 pts 9 / 25 pts
5.0 Management of Process Quality 57 /140 pts 5.1 Design and Introduction of Quality Services 5.2 Process Management: Operation/Service Process 5.3 Process Management: Business and Support Service Processes 5.4 Supplier Quality 5.5 Quality Assurance
18/40 pts 18/35 pts 14 / 30 pts 2 / 20 pts 5 /15 pts
6.0 Quality and Operational Results 116 /180pts 6.1 Operation and Service Quality Results 6.2 Agency Operational Results 6.3 Business and Support Service Results 6.4 Supplier Quality Results
11/70 pts 50 /50 pts 23 /25 pts 32 /35 pts
7.0 Customer Focus and Satisfaction 113 /300 pts 7.1 Customer Expectations: Current and Future 7.2 Customer Relationship Management 7.3 Commitment to Customers 7.4 Customer Satis&ction Determination 7.5 Customer Satisfaction Results 7.6 Customer Satisfaction Comparison
17/35 pts 40 /65 pts 8 /15 pts 16 /30 pts 23 / 85 pts 9 /70 pts
TOTAL POINTS 519/1000 pts
7. Customer focus and satisfaction (113 points out of 300, i.e., 37.7 percent): Information f rom some riders is gathered and analyzed. Management takes some quality improvement actions on the basis of findings. However, nonriders are not adequately surveyed. Internal customer satisfaction information should be collected and analyzed throughout SCCTD.
Suggestions for Improvement
At the third Quality Council Workshop, an evaluation questionnaire was distributed to obtain the members'
opinions and suggestions on the Baldrige criteria appfi-cation to the LRT system of SCCTD. Table 5 presents the questionnaire and a summary of survey results.
Overall, the evaluation responses to the M B N Q A criteria-based internal assessment process indicate that the M B N Q A criteria could be used as an internal assessment tool wi th appropriate modification. However, the Quality Council members were concerned about their ability to easily provide accurate scores in the M B N Q A evaluation areas. They also mentioned that the scoring system was neither fully explained nor easy to justify, and there seemed to be much room for personal interpretation and difference in scoring f rom one evaluator

324 SEVENTH NATIONAL CONFERENCE ON LIGHT RAIL TRANSIT
Range VII (876 to 1000 points)
Range VI (751 to 875 points)
Range V (626 to 750 points)
Range IV (501 to 625 points)
Range III (376 to 500 points)
Range II (251 to 375 points)
Range I (0 to 250 points)
Outstanding, sustained effort and results in all categories, throughout organization. Excellent integration. World leadeis No winners from this range
Effective efforts in all categories, world class in some. Good int^ration and good to excellent results. Fully deployed. Industry and national leaders. All MBNQA wirmers scored in this range.
Evidence of effective effort in most categories, outstanding in several. Strength in deployment and results, but some efforts lack maturity.
Evidence of efforts in many categories, some outstanding. Good prevention basis, but efforts lack maturity. Need further deployment and sustained results.
Some effort in several categories, but poor integration, little preventive basis
Only slight evidence of effort in any category. Quality receives low priority.
Virtually no evidence of attention to quality in any category.
FIGURE 3 MBNQA scoring ranges: what they mean (14).
to another. (Intensive M B N Q A training was not provided to the Quality Council during the case study.)
The Quality Council made the following key suggestions for improvement:
1. Criteria, scores, and weights require modifications for use by public agencies, including LRT systems. For example, the definition of a competitor is not appropriate for all public agencies.
2. Current assessment procedures, which are more oriented to products and profits, are less suitable for service- and nonprofit-oriented organizations such as SCCTD.
3. Planning, scheduling, and organizing services provided to customers should be weighted more. Two different concepts should be included: doing right jobs versus doing jobs right.
4. Improving efficiency may result in a loss of riders. Frequently, greater efficiency is achieved by reducing less needed or more costly LRT operation schedules in terms of a greater number of vehicles attached and running together, and less frequent operational times. However, this gained efficiency resulted in reduced ridership.
5. Some examination items and areas to address are redundant. For example. Examination Items 4.4 and 4.5 may be combined.
CONCLUDING REMARKS
This paper developed a structure and framework for conducting an internal assessment of quality and performance of an LRT system using the M B N Q A criteria. This approach is applied in an LRT case study, as a self-assessment of the 1994 LRT operations of SCCTD. Self-assessment examination forms and procedures were developed using the 1994 M B N Q A criteria. A newly formed ad hoc committee, the SCCTD Quality Council, used the forms and procedures to assess the quality and performance of SCCTD's LRT operation.
SCCTD's LRT operation obtained a total score of 519 out of a possible 1,000 points, using a self-assessment procedure performed by Quafity Council members. Compared wi th Baldrige winners, whose scores range f rom 751 to 875 points, the current quality and performance of SCCTD are reasonably good. The SCCTD LRT evaluation presented evidence of specific efforts under way for improving quality and performance of LRT operations, and some efforts are outstanding. Although its LRT operates on a sound error-preventive basis, SCCTD should further improve operations to achieve higher customer-based quality performance. On the basis of percentage of achievement in seven categories compared with the fu l l scores. Categories 2 (information and analysis) and 7 (customer focus and satisfaction) require the most improvement.
The current M B N Q A criteria do not explicitly consider the role of unions in enhancing quality and performance. Because unions are an important aspect of LRT systems, i t may be desirable to enlarge on this function in subsequent M B N Q A criteria modifications. Furthermore, it is necessary for employee representatives to be involved in self-assessment processes of LRT systems.
According to comments and suggestions made by the Quality Council, examination criteria and scores assigned to the examination items in the self-assessment kit developed by the study team need modifications because of SCCTD's special nature as a government agency. Quality Council training on the format and questions contained in the self-assessment kit should also be implemented. Overall, the Quality Council be-heves that the M B N Q A criteria and assessment procedures are a useful tool in measuring SCCTD quality and productivity. Similar results have been found in the general case of T Q M methods and techniques (15). This study extends the previous studies of the use of M B N Q A criteria in over 30 firms to the case of a public transit agency (16).
According to recent survey results, as obtained f rom a sample of 103 public transit organizations, whereas some transit system CEOs have made commitments to T Q M since the late 1980s, most foundations for T Q M

D E A N A N D PARK 325
TABLE 5 Results
Quality Council Evaluation Questions and Summary of
A. Survey Questions.
(1) Are the MBNQA evaluation areas that you responded to appropriate to the agency? Yes: No: I f no, please indicate which evaluation(s) were not appropriate and why.
(2) Do you think the MBNQA criteria cover all activities of the agency? Yes: No: I f no, please list criteria to be added.
(3) Are the scoring weights for the MBNQA criteria appropriate to the agency? Yes: No: I f no, please suggest any changes.
(4) Were you able to easily provide accurate scores in the MBNQA evaluation areas? Yes: No: I f no, please make any comments or suggestions.
(5) Do you think MBNQA criteria and assessment process are helpful in assisting the agency to improve the quality and/or operational productivity?
Yes: No: I f no, please make any comments.
(6) In your opinion, should the agency utilize the MBNQA assessment process to improve its quality and productivity? Yes: No: I f yes, how would you implement it?
(7) How would you evaluate the MBNQA criteria in assessing quality and productivity of the agency?
Excellent Poor 5 4 3 2 1
B. Summary of Survey Resuks.
Question No.
Yes
5 (72%) 5(72%) 4 (57%) 2 (28%) 5 (72%) 4 (57%)
No
1 (14%) 2 (28%) 3 (43%) 5 (72%) 1 (14%) 3 (43%)
Not Answered
1 (14%)
1 (14%)
Scale Excellent Poor
5 4 3 2 1 Reply No. 1 4 2
are not yet in place (3). For example, transit governing boards are not actively involved in quality, quality coordinators or facilitators have generally not been designated to manage and support quality, transit employees are not yet sufficiently trained in tools and techniques for problem solving and conflict resolution, and quality programs do not appear to be very rigorous (3). Consequently, the use of the M B N Q A criteria-based self-assessment tool would be a driver to properly ident i fy the status of performance and quality of a public transit agency.
Extensions of this research would include recalibra-tion of M B N Q A criteria in consideration of suggestions by the SCCTD Quality Council, and then its reappli-cation to the SCCTD LRT system. To investigate possible deployment of the M B N Q A criteria-based assess
ment tool to other LRT systems, these LRT systems would also need to modify the criteria to satisfy their own needs, as is done in other industry sectors (20).
ACKNOWLEDGMENT
We acknowledge and appreciate the contributions of Rod Diridon, Executive Director, International Institute for Surface Transportation Policy Studies (IISTPS), who provided the impetus in undertaking this study, and the staff of SCCTD, who provided the information and assistance necessary to conduct this study. We also appreciate the comments provided by the two anonymous reviewers of this paper. Finally, as IISTPS Research Associates, we appreciate the assistance given by the

326 SEVENTH N A T I O N A L CONFERENCE O N L I G H T R A I L T R A N S I T
IISTPS Office and the peer reviews provided by the nSTPS Board of Trustees Research Committee in the preparation of this paper.
REFERENCES
1. Takyi, I. K. , K. Obeng, and L Ugboro. Total Quality Management for Public Transit Systems. Transportation Quarterly, Vol. 47, No. 2, 1993, pp. 167-183.
2. Oswald, T. H . , and J . L . Burati. Can Total Quality Management Work in the Public Construction Arena? Transportation Research Record 1340, T R B , National Research Council, Washington, D .C . , 1992, pp. 40-47.
3. Total Quality Management in Public Transportation. T C R P Research Results Digest, T R B , National Research Council, Oct. 1994.
4. Fielding, G. J . Transportation Performance Evaluation in the U.S.A. Transportation Research A, Vol. 26, No. 6, 1992, pp. 483-491.
5. National Institute of Standards and Technology. Malcolm Baldrige National Quality Award Assessment. U.S. Department of Commerce, Washington, D . C . , 1994 and 1995.
6. Scanlon, P., and J . T. Hogan. Quality Management for the Service Industry. Quality Progress, Vol. 16, No. 5, May 1983, pp. 18-23.
7. George, S. The Baldrige Quality System: The Do-It-Yourself Way To Transform Your Business. John Wiley and Sons, Inc., New York, 1992.
8. Evans, J . R., and W. M . Lindsay. The Management and Control of Quality (2nd ed.). West PubUshing Company, St. Paul, Minn., 1993.
9. Steeples, M. M . The Corporate Guide to the Malcolm Baldrige National Quality Award. 1992.
10. Marconi, J . The Malcolm Baldrige National Quality Award Self-Assessment Workbook. Goal/QPC, 1994.
11. Reimann, C. W., and H . S. Hertz. Understanding the Important Differences Between the Malcolm Baldrige National Quality Award and ISO 9000 Registration. Pro-duction and Operations Management, Vol. 3, No. 3, 1994, pp. 171-185.
12. Bemowski, K. , and B. Stratton. How Do People Use the Baldrige Award Criteria. Quality Progress, Vol. 28, No. 5, 1995, pp. 43-47.
13. Churchman, C. W. The Systems Approach. Dell Publishing Co., New York, 1983.
14. Hart, C . W. L . , and C. E . Bogan. The Baldrige: What It Is, How It's Won, How To Use It To Improve Quality in Your Company. McGraw-Hill, Inc., New York, 1992.
15. Sashkin, M. , and K. J . Kiser. Putting Total Quality Management to Work. Berrett-Koehler Publishers, 1993.
16. Spechler, J . W. Managing Quality in America's Most Admired Companies. Berrett-Koehler, 1993.