assessing current dairy farm management …dairyasia.org/file/kpipresentation_john moran.pdf · 1...
TRANSCRIPT

1
ASSESSING CURRENT DAIRY FARM
MANAGEMENT USING
KEY PERFORMANCE INDICATORS
John Moran
Coordinator, Asian Dairy Network, APHCA
& Profitable Dairy Systems
Kyabram, Victoria
AUSTRALIA
Website: www.profitabledairysystems.com.au
Apr 2012

2
TOPICS COVERED
• This presentation is specifically about on-farm measures of cow and herd performance
• Key farm management activities
• Diagnosing farm profitability – 10 KPI’s of profitability
• 6 for feeding management
• 4 for herd management
• Detail of some KPI’s – Optimum stocking capacities
– Some dairy herd dynamics
– % productive cows in the herd
– Pattern of milk production
– Heifer rearing
– Principles of feeding milking cows
• Cow milk yields
• Indonesian dairy GAP glossy brochure • Assessing current management
• Grading farmer skills

3
FARM MANAGEMENT ACTIVITIES

4
HOW PROFITABLE IS YOUR FARM?
Profit doesn’t just happen; it must be planned for
Many good indicators of the profitability of your farm
More than half the costs on your farm are feed related
Increasing profit and be achieved by:
Reducing these feed costs
Improving the efficiency of converting feed to milk
Improving herd performance through better feeding
The following 10 questions can be asked on any farm
These are the Key Performance Indicators we should all use

5
DIAGNOSING FARM PROFITABILITY 1
Feeding management
1. Stocking capacity: Is the farm carrying too many stock for
the available forage supplies?
2. On-farm forage production: How much of the farm’s
annual forage requirements must be purchased?
3. Forage quality: Is the forage being harvested or purchased
at its optimal quality for milking cows?
4. Concentrate feeding program: What is the quality of the
concentrates being fed and how much is allocated per milking
cow?
5. Total feed costs: Are the forages and concentrates costing
too much per unit of feed energy or protein?
6
DIAGNOSING FARM PROFITABILITY 2
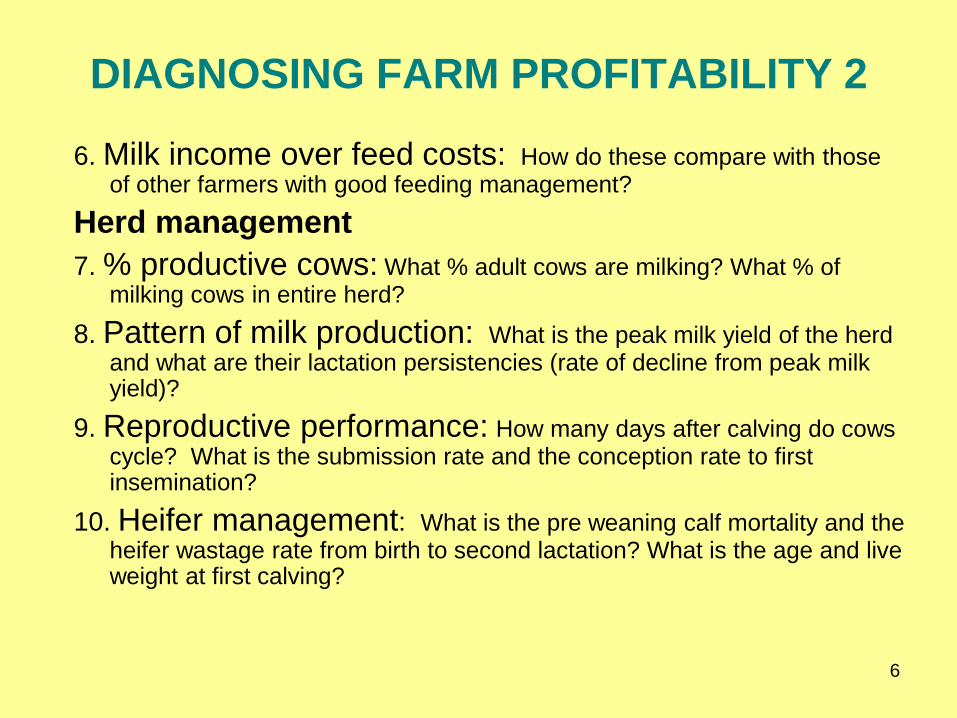
6. Milk income over feed costs: How do these compare with those of other farmers with good feeding management?
Herd management
7. % productive cows: What % adult cows are milking? What % of milking cows in entire herd?
8. Pattern of milk production: What is the peak milk yield of the herd and what are their lactation persistencies (rate of decline from peak milk yield)?
9. Reproductive performance: How many days after calving do cows cycle? What is the submission rate and the conception rate to first insemination?
10. Heifer management: What is the pre weaning calf mortality and the heifer wastage rate from birth to second lactation? What is the age and live weight at first calving?
7
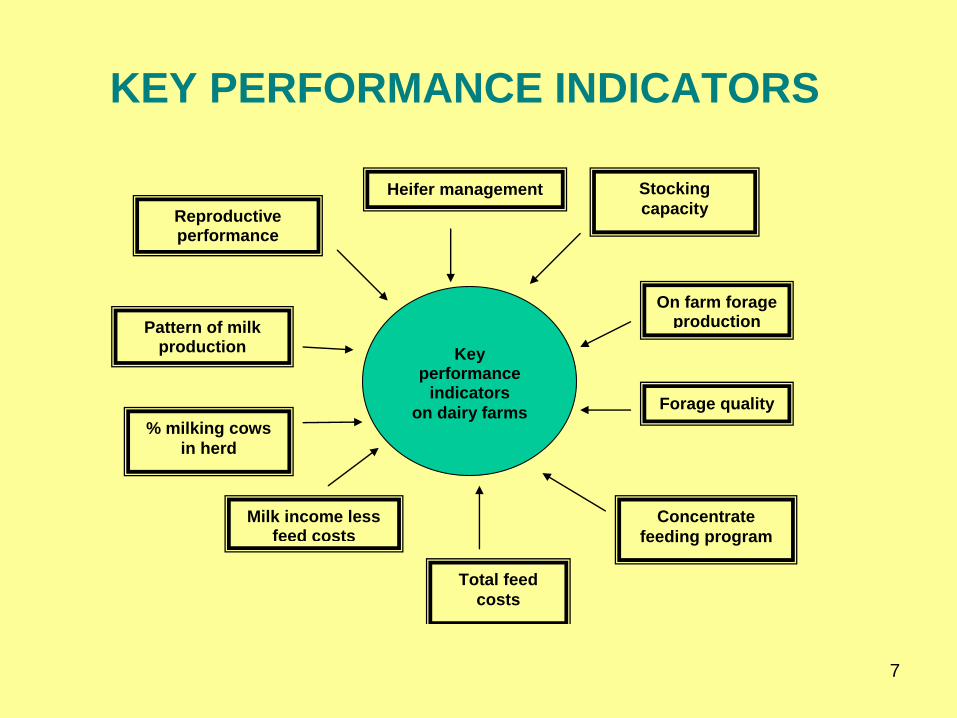
KEY PERFORMANCE INDICATORS
Key
performance indicators
on dairy farms
Heifer management Stocking
capacity
On farm forage production
% milking cows
in herd
Concentrate
feeding program
Reproductive performance
Pattern of milk production
Milk income less feed costs
Forage quality
Total feed
costs

8
OPTIMUM STOCKING CAPACITIES
Annual forage requirements for each animal type
Milking cow: 13,750 kg fresh or 2.06 t DM (71% of total)
Dry cow: 2700 kg fresh or 0.40 t DM (14% of total)
Heifer: 2920 kg fresh or 0.44 t DM (15% of total)
Adult milking cow unit: 19,3750 kg fresh or 2.91 t DM
Typical farm should run no more than 7 to 8 cows per ha forage
Quality of forage management Poor Typical Good
Forage yield
t DM/ha/yr
t fresh/ha/yr
10
67
20
130
30
200
Milking units/ha forage 3.4 6.9 10.3
Adult cows/ha forage 4.0 8.1 12.1

9
OPTIMUM STOCKING CAPACITIES 1
To calculate the optimum stocking capacity:
1. Assess farm forage management as poor v typical v good;
10 v 20 v 30 t DM/ha/yr with 15% DM content,
67 v 130 v 200 t fresh forage/ha/yr
2. Excess forage is conserved for dry season feeding
3. Adult cow milking unit is 1 cow & 20% of replacement heifer
4. 75% adult cows milking at any one time
5. Forage feeding program is
Milking cows: 50 kg fresh (7.5 kg DM)/cow/day for 270 d
Dry cow: 30 kg fresh (4.5 kg DM)/cow/day for 90 d
Heifer: 20 kg fresh (3.0 kg DM)/cow/day for 24 mth
6. Concentrates and purchased forage provide balance for target milk yield, hence not
included in calculations

10
% PRODUCTIVE COWS IN HERD
Not all stock in any dairy herd generate income
Milking cows generate daily income
Dry cows do not & neither do heifers and calves
It is then desirable to have as many milking cows as possible
% milking cows in adult herd (including first calf heifers)
Depends on calving rate, calving interval, lactation length
74%; maximum
60-74%; acceptable
50-59%; below average
40- 49%; not good
% milking cows in entire herd (incl calves & growing heifers)
Depends on calf/heifer mortality, age @ 1st calving, calving interval
48%, maximum
40-48%; acceptable
35-39%; below average
30-34%; not good

11
PATTERN OF MILK PRODUCTION
The 2 major factors influencing total lactation yield are:
Peak lactation (within 6-8 weeks post calving)
Rate of decline from peak (or lactation persistency)
Persistency quantifies average rate of decline in yield
In % per month from peak yield
The higher the number the faster the rate of decline
So the less milk produced
In Asia, 8% per month is achievable on well managed farms
But 8-12% is more realistic
For 300 d lactation, total (& average) lactation yields:
15 L/d peak & 8% persistency; 2980 L total (or 9.9 L/d average)
15 L/d peak & 12% persistency; 2330 L total (or 7.8 L/d average)
20 L/d peak & 8% persistency; 3970 L total (or 13.2 L/d average)
See graph of lactation curves on following page

Milk yields each month for cows varying in
peak yield and persistency Legend shows peak yield (L/d) and persistency (% decline/mth)
12

13
PERSISTENCY OF LACTATION
Peak yield
(L/d)
Persistency
(%/mth)
Monthly milk
decline
(L/d)
Full lact yield
(L)
Average milk
yield
(L/d)
15 8 1.2 2980 9.9
10 1.5 2650 8.9
12 1.8 2330 7.8
20 8 1.6 3970 13.2
10 2.0 3540 11.8
12 2.4 3110 10.4
25 8 2.0 4960 16.6
10 2.5 4420 14.8
12 3.0 3885 13.0
Effect of peak yield and persistency on total and average
milk yields

14
KPI’s FOR HEIFER REARING
Herd A B
Calving interval (m) 12 18
Calving rate (%) 85 65
Still born calves (%) 2 5
Calf mortality from 0-24 m (%) 8 20
Non pregnant heifers (%) 5 10
Heifer calves born (%) 36 15
• Data for two herds with differing performance
• Herd A supplies 36% heifers
– enough for higher culling rates, hence better genetic progress
• Herd B supplies only 15% heifers
– insufficient to maintain herd numbers, let alone have genetic progress

15
MATHEMATICS OF HEIFER REARING
• Assuming cows remain in milking herd for 5 years, 20-25% should be replaced every year
• What are the KPI’s to ensure such replacement rate?
• Depends on:
– No of milking cows that conceive
– Those that produce a live calf
– Those that are heifers
– Those that survive until calving
– Those that conceive as maiden heifers
– Those suitable for milking cows
• Key factors are:
– High age at first calving (>30 m) & long inter calving intervals (>15 m)
– High calf mortality (> 10-15% ++)

Milk yield
(kg/cow/day)
Adequacy of dairy production system
5 Very poor feeding and herd management and low genetic
merit cows
eg Indian buffalo farmers in Malaysia 7
9 Typical of many SE Asian smallholder and government
farms, even with high grade Friesians
11 Gradual progression with grade and crossbred Friesian
type cows to improved feeding, herd, young stock and
shed management.
Milk yields of 15 kg/day are considered acceptable by
many dairy advisers.
13
15
17
19
20 Potential level in lowland humid tropics following improved
management of body condition throughout lactation
25 High genetic merit cows in tropical highlands or lowland
dry tropics with good overall management
30 Peak milk yields in herds with 25 kg/cow/day rolling herd
averages
35 Unrealistic in SE Asia except where all major constraints
to milk production have been overcome 16
COW MILK YIELDS: A GUIDE TO CURENT FARM MANAGEMENT •Range in rolling herd average milk yields on tropical SE Asian dairy farms

COW MILK YIELDS: OTHER FACTORS TO CONSIDER
• It is important to differentiate between rolling herd averages and peak milk yields
• Should also consider milk composition as indicators of feeding management:
– low milk fat can indicate possible subclinical rumen acidosis
– high milk protein can indicate good dietary energy intake
– however milk lactose levels are fairly constant
• Excessive body condition is indicative of low protein diets, due to:
– inability of cow to partition nutrients from body reserves to milk synthesis
– poor fertility as cows cannot easily cycle hence conceive
• Very poor body condition is indicative of low energy intake as:
– High genetic merit cows preferentially partition body reserves to milk synthesis
– Cows will not cycle due to excessive weight loss
• Herd dynamics can also indicate adequacy of dairy farm management
– Excessive number of dry non-pregnant cows can indicate very poor farm management
– Low percentage of lactating adult cows can also indicate poor farm management
17

18
PRINCIPLES OF FEEDING MILKING COWS
• In all dairy feeding systems, the golden rules are:
1. Feed sufficient quality forages first
2. Supplement with concentrates which are
3. Formulated to overcome specific nutrient deficiencies
4. To achieve target milk yields
• The usual “bottom line”
– Feed fewer cows better

19

20

21

22

23
IMPORTANCE OF FARM MANAGEMENT
Dairy stock require high level of farm management to
grow well, remain healthy & become productive milking
cows
Poor management before and after 1st calving can lead to
Low growth rates
Delayed breeding
Stock diseases
Even stock deaths
It is important to assess current management
Six categories of farm management practices
Many of these assessments may be subjective

24
SIX FARM MANAGEMENT PRACTICES
Assessing
current management
skills
Feed production
Feeding management
Herd management
Milking management
Housing
General farm management

25
1. FEED PRODUCTION
Size of forage area (in m2)
Types of forages grown (grass, legume, cash crop byproducts)
Quality of forage at harvest
Fertiliser management (manure, inorganic)
Forage harvest interval in wet & dry seasons (days)
Fodder conservation practices (silage, hay)
Year round supplies of fodder
Number of stock on farm (cows, heifers, calves)
Stocking capacity (too high, optimum or too low)
Proportion of forages from home grown supplies
Proportion of forages sources off farm
Types of forages sourced off farm

26
2. FEEDING MANAGEMENT
Does each animal have feeding trough and water trough
Access to ad lib clean water
Typical daily allocation of fresh forages (kg fresh/milking cow/d)
Forage preparation (wilted, chopped)
Hand or machine chopped
Types of concentrates fed (formulated, by products)
Knowledge of energy/protein contents
Vitamin/minerals or other additives
Allocation of concentrates (kg fresh/milking cow/d)
Measures of cow milk yield (peak, current yield, days in milk)
Pattern of milk prod (decline from peak)
Body condition (at calving, mating, drying off)
Cow live weights (mating, pre calving)
Target weights and condition scores

27
3. HERD MANAGEMENT A
Milk fed calves (colostrum, kg milk/d, weaning age, calf mortality)
Source of milk (whole milk, calf milk replacer)
Treatment for scours (antibiotics, electrolytes)
Calf pens (type, cleanliness)
Weaned heifers (conc feeding, mating age, weight at 1st calving)
Visual assessment of condition of young stock
Disease mant (vaccn, vet support and protocols, drug storage)
Breeding mant (heat detection, preg testing, calving interval, conception rate,
selection of sires)
Lameness (locomotion test)
Access to free exercise area
Mastitis (incidence, routine CMT, management & control)
Heat stress (resp rate, outdoor access at night)
28
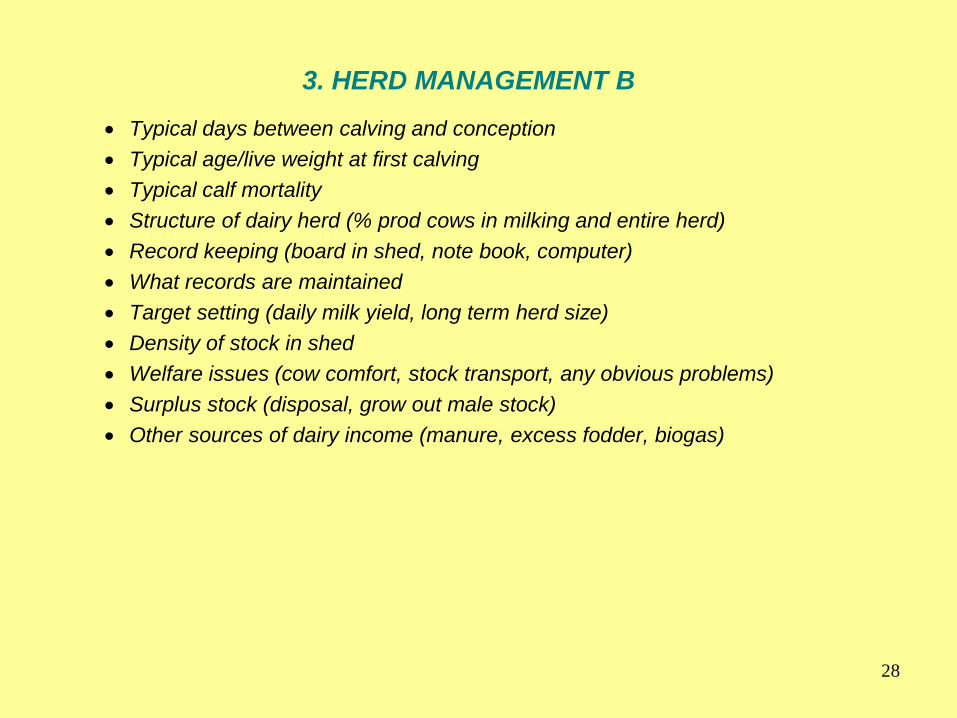
3. HERD MANAGEMENT B
Typical days between calving and conception
Typical age/live weight at first calving
Typical calf mortality
Structure of dairy herd (% prod cows in milking and entire herd)
Record keeping (board in shed, note book, computer)
What records are maintained
Target setting (daily milk yield, long term herd size)
Density of stock in shed
Welfare issues (cow comfort, stock transport, any obvious problems)
Surplus stock (disposal, grow out male stock)
Other sources of dairy income (manure, excess fodder, biogas)
29
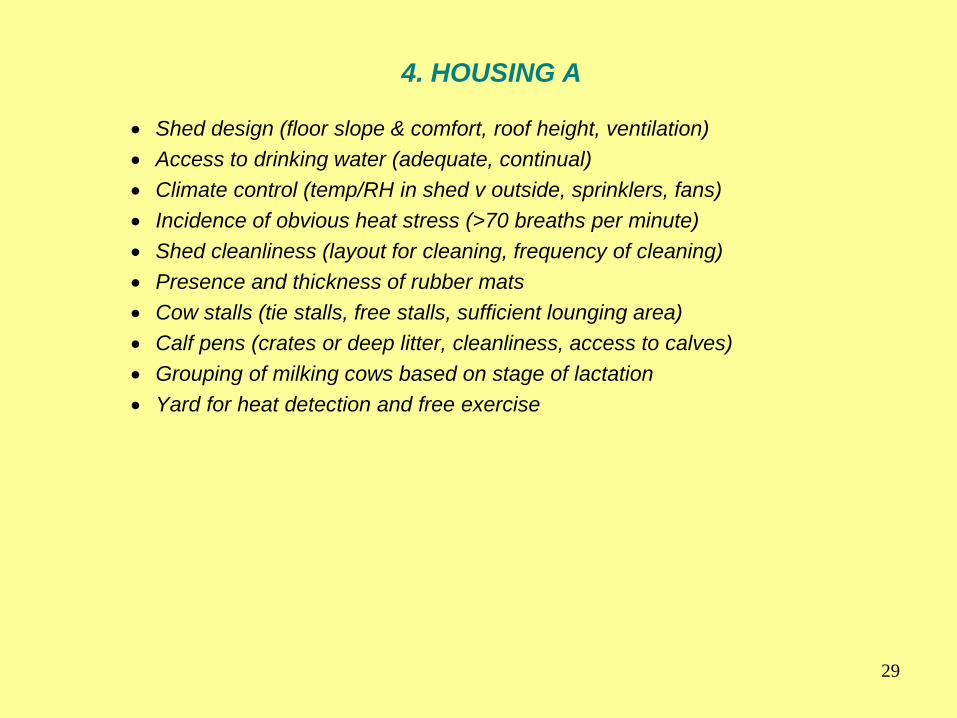
4. HOUSING A
Shed design (floor slope & comfort, roof height, ventilation)
Access to drinking water (adequate, continual)
Climate control (temp/RH in shed v outside, sprinklers, fans)
Incidence of obvious heat stress (>70 breaths per minute)
Shed cleanliness (layout for cleaning, frequency of cleaning)
Presence and thickness of rubber mats
Cow stalls (tie stalls, free stalls, sufficient lounging area)
Calf pens (crates or deep litter, cleanliness, access to calves)
Grouping of milking cows based on stage of lactation
Yard for heat detection and free exercise

30
4. HOUSING B
Pen layout in shed (young stock, isolation/hospital pen)
Location of milk fed calves pens (away from adult cows)
Feed storage (separate to stock, bird/insect/vermin proof)
Chopper for forages & mixer for concentrates
Services (electricity, water, hot water)
Effluent disposal (pit, frequency of emptying)
Staff facilities (space/furniture for relaxing, lockable drug storage)

31
5. MILKING MANAGEMENT
Separate milking area (good layout for machine milking)
Cleanliness of milking area
Hand milking (personal hygiene, milking method, milk bucket)
Machine milking (cleanliness, replacement of rubber liners)
Milk storage (milk cooler, stored in cool location)
Milking hygiene (hot water, soap, sanitisers, stored upside down)
Milk quality (Fat%, SNF or protein%,TPC, grade)
Milk return (market outlets, ?/kg, relative to highest return)

32
6. GENERAL FARM MANAGEMENT
Record keeping & office space
Extent of record keeping (milk yields, farm inputs, labour)
Systematic record keeping (accessibility, referred to in future)
Extent of financial records (referred to in future, creditors)
Knowledge of cost of production
Knowledge of lactation cycle and persistency of milk production
Short, medium, long term plans for farm
Making good use of service providers (free, aware of potential)
Efficiency of utilising employed and family labour
Communication with paid labour
Milk marketing (member of local coop)
Considered value adding
Subjective assessment of farm mant skills

33
GRADING FARMER SKILLS
To provide framework for assessing suitability of farmer to receive imported stock.
This was developed in Central Java in Nov 2008
Farmers graded as good v average v poor
Objective criteria:
Milk yield/cow, kg/d (>12, 10-12, <10)
Milk return, Rp/kg (>3000, 2500-3000, <2500)
Fresh forage fed in wet season, kg/d(>30, 20-30, <20)
Record keeping (daily milk yield, AI, vet visit, vaccn, predicted calving date) writes down, good; remembers, average; forgets, poor.
Subjective criteria:
Cow shed (size, ventilation, floor, hygiene, manure pit)
Herd management (cow weight & condition, health, young stock weight for age & condition, calving interval)
Milking management (equipment, hygiene, post harvest handling)