assessing biodiversity in forests using very high-resolution images and unmanned aerial vehicles
TRANSCRIPT
Assessing biodiversity in forests using very high-
resolution images and unmanned aerial vehicles
Stephan Getzin1*, Kerstin Wiegand1 and Ingo Schoning2
1Department of Ecosystem Modelling, Faculty of Forest Sciences and Forest Ecology, University of Goettingen,
Buesgenweg 4, 37077 Goettingen, Germany; and 2Institute of Ecology, Friedrich Schiller University Jena,
Dornburger Str. 159, 07743 Jena, Germany
Summary
1. Structural diversity and niche differences within habitats are important for stabilizing species
coexistence. However, land-use change leading to environmental homogenization is a major cause
for the dramatic decline of biodiversity under global change. The difficulty in assessing large-scale
biodiversity losses urgently requires new technological advances to evaluate land-use impact on
diversity timely and efficiently across space.
2. While cost-effective aerial images have been suggested for potential biodiversity assessments in
forests, correlation of canopy object variables such as gaps with plant or animal diversity has so far
not been demonstrated using these images.
3. Here, we show that aerial images of canopy gaps can be used to assess floristic biodiversity of the
forest understorey. This approach is made possible because we employed cutting-edge unmanned
aerial vehicles and very high-resolution images (7 cm pixel)1) of the canopy properties. We demon-
strate that detailed, spatially implicit information on gap shape metrics is sufficient to reveal strong
dependency between disturbance patterns and plant diversity (R2 up to 0Æ74). This is feasible
because opposing disturbance patterns such as aggregated and dispersed tree retention directly cor-
respond to different functional and dispersal traits of species and ultimately to different species
diversities.
4. Our findings can be used as a coarse-filter approach to conservation in forests wherever light
strongly limits regeneration and biodiversity.
Key-words: biodiversity, coarse-filter approach, forest understorey, gap shape complexity
index, unmanned aerial vehicles
Introduction
The devastating loss of biodiversity requires sustained invest-
ment in coherent biodiversity monitoring and its integration
into broad-scale land-use planning (Butchart et al. 2010). At
the same time, surveying methods need to be cost-effective to
provide a framework of practical feasibility (Gardner et al.
2008).
While it is known that land-use change is the most promi-
nent driver of current global changes in biodiversity (Sala
et al. 2000), the response of biodiversity to varying land-use
intensities is so far little understood (Fischer et al. 2010).
This is particularly true for the temperate forest biome with
timber-oriented management, often leading to simplified,
species-poor forest structure and in combination with climate
change increasing susceptibility to insect attacks, fire disasters
and storm events (van Vuuren, Sala & Pereira 2006; Lindner
et al. 2010).
Empirical and theoretical studies have shown that tree thin-
ning and resultant changes in canopy gap structure strongly
affect woody regeneration and biodiversity of understorey
plants (Whitney & Foster 1988; Coates et al. 2003). Hence,
management prescriptions that increase within-stand variabil-
ity can provide important habitat features across multiple
scales to enhance biodiversity in forests (Wilson & Puettmann
2007). Creating spatially variable sizes and shapes of forest
gaps at the local plot scale thus bears the potential to optimize
land-use intensities in favour of high biodiversity. This causal
link between so-called ‘higher-level’ structures and dependent
‘lower-level’ processes is also well known from landscape-scale
analysis where habitat fragmentation such as the shape com-
plexity of larger forest patches may be related to biodiversity
(Saura & Carballal 2004). For example, it has been shown for*Correspondence author. E-mail: [email protected]
Correspondence site: http://www.respond2articles.com/MEE/
Methods in Ecology and Evolution 2012, 3, 397–404 doi: 10.1111/j.2041-210X.2011.00158.x
� 2011 The Authors. Methods in Ecology and Evolution � 2011 British Ecological Society
the tropics that the degree of patch convolution is positively
correlated with woody plant species diversity (Galanes &
Thomlinson 2009).
Remote sensing based on satellite or aerial images is ideal to
identify and functionally link the spatial configuration of forest
patches to biodiversity at the coarse landscape scale because
the resolution of such images is sufficient to correlate diversity
with shape metrics of larger patches (Newton et al. 2009).
However, at the local plot scale, the resolution of image sensors
is commonly not high enough to permit very accurate spatial
quantifications of fine-scale canopy objects. For example, with
conventional aerial or satellite images, it is hardly possible to
correctly record small gaps of <10 or 20 m2 size (Fujita et al.
2003; Turner et al. 2003). This is probably the reason why so
far no study has yet successfully correlated plant or animal
diversity of the forest understoreywith canopy gaps as detected
in aerial images. We consider this as a major research gap
because such fine-scale correlations with biodiversity are a cru-
cial key for assessing specific land-use intensities in managed
forests. This is because actual tree thinning as a disturbance
happens at the fine scale within continuous areas or large
patches of forest.
Investigating the hypothesis that gap information on aerial
images can be principally used for the ecological assessment of
plant diversity in forests is a major scientific achievement for
the following reasons:
1. Airborne imagery reflects two-dimensional measures of
gap distribution in horizontal space. Such indirect optical
approaches ‘hold the promise of not only getting better esti-
mates of species distributions and richness levels, but of also
shedding light on the processes underlying them’ (Turner
et al. 2003). For example, the spatial characteristics of gaps
determine the balance of neighbourships between different
plant functional types (clonal spread vs. seed dispersal;
shade-tolerant vs. shade-intolerant species) or between inva-
der and native species (Koukoulas & Blackburn 2004; Li,
Bogaert &Nijs 2005).
2. Aerial images are very cost-effective and therefore
routinely used by most forest administrations for recurrent
monitoring purposes of large areas. This makes them particu-
larly suitable for practical decision support (Morgan, Gergel
& Coops 2010; Pasher & King 2010). While expensive 3D
airborne laser scanning can be used to predict biodiversity in
forests (Turner et al. 2003), the cost-saving concept of a
coarse-filter approach (Beier & Brost 2010) is more
competitive when a minimum set of explanatory variables is
used, such as with 2D images (Gardner et al. 2008; Proulx &
Parrott 2008).
3. Since the emergence of digital photography, airborne
optical image sensors are subject to rapid improvement in
resolution. Consequently, path-breaking methodologies and
results from pilot studies using very high-resolution images
will be applicable to monitoring processes in the very near
future (Clark et al. 2004;Morgan, Gergel &Coops 2010).
4. As a new technology itself, unmanned aerial vehicles
(UAV) will soon be an important commercial tool for
monitoring purposes. So far, ‘we have only seen the tip of the
iceberg of what is achievable’; however, ‘unmanned aircraft
begin to take on almost any traditional role that is performed
by a piloted aircraft’ (Stafford 2007). UAV applications in
surveys have a number of advantages over established
remote-sensing methods. They provide extremely fine sub-25-
cm resolutions and thus allow the identification of previously
undetected object details, and images are rarely affected by
cloud cover because flying altitudes are usually low, flight
missions can be timed very flexibly, and owing to low fixed
charges, they are very cost-effective (Dunford et al. 2009;
Rango et al. 2009;Watts et al. 2010).
Until now, UAV applications in ecology are still rare. In the
following, we demonstrate how high-resolution images and
unmanned aircraft may be used to assess understorey biodiver-
sity in forests.
Materials and methods
STUDY SITES
Our study sites were located within beech-dominated deciduous and
mixed deciduous ⁄ coniferous forests of the so-called Biodiversity
Exploratories in Germany. These exploratories are long-term
research platforms to investigate the effects of varying land-use inten-
sities on functional biodiversity response (Fischer et al. 2010). We
selected 20 1-ha plots of mature and mainly single-layered stands in
the exploratory ‘Hainich-Dun’ in central Germany and similarly 16
plots in the ‘Schwabische Alb’ about 300 km away in south-western
Germany. These exemplary study plots represent different land-use
intensities such as unmanaged near-natural (N = 13), selection-cut-
ting (N = 6) and traditionally managed age-class forest (N = 17)
with varying thinning patterns.Mean annual precipitation in theHai-
nich is 500–800 mm and in the Alb 700–1000 mm. Soils of the Hai-
nich have a loamy texture and are dominated by Luvisols and
Stagnosols on loess. Soils of the Alb are rich in clay and are domi-
nated by Cambisols and Leptosols on limestone. Our chosen study
sites were located on relatively level topography with only a few plots
in the Schwabische Alb having somemoderate slopes.
Within each plot, we recorded the vascular plants (herbs, grasses,
ferns, woody plants £1Æ5 m) in seven randomly spread 10 · 10 m2
subplots. Random spreading of subplots was performed to account
for various local light conditions within the 1-ha plot and thus to get a
representative sample of shade-tolerant and light-demanding species.
The plant data were used to correlate species richness, Shannon index
(H), Shannon evenness (E) and beta diversity (bsim) of understoreyplants in each 1-ha plot with canopy objects from aerial image analy-
sis. Thereby, Shannon evenness was calculated as E = H ⁄Hmax with
H being the observed species diversity and Hmax the species diversity
under conditions of maximal equitability (Krebs 1994). Beta diversity
was calculated as 1)Simpson’s similarity index (bsim = 1)Ssim). This
measure was chosen because bsim performed best overall out of 24
tested indices of beta diversity (Koleff, Gaston & Lennon 2003). The
four measures of biodiversity are commonly used in ecological sur-
veys and should thus be suitable for comparative studies.
AERIAL IMAGES
Very high-resolution RGB images (�7 cm pixel)1) were taken at
the end of the summer in 2008 and 2009 with the UAV ‘Carolo
P200’ above the centres of the 1-ha forest plots at flying altitudes of
398 S. Getzin, K. Wiegand & I. Schoning
� 2011 The Authors. Methods in Ecology and Evolution � 2011 British Ecological Society, Methods in Ecology and Evolution, 3, 397–404
�250 m (Figs 1 and 2; Figs S1 and S2 in Supporting information).
This state-of-the-art UAV was recently developed by the Institute of
Aerospace Systems ⁄TU Braunschweig in conjunction with the
Andromeda-Project (Chmara 2010). The UAV has a wing span of
2 m and weighs 6 kg. It can fly automatically along any predefined
spline-based trajectory for a time span of 60 min and makes every
3-s an image. All images were orthorectified based on data record-
ing of the internal UAV orientation, GPS position and a digital ter-
rain model. Orthophotos were converted into binary images, and
gap polygons were manually segmented to create shapefiles (a geo-
spatial vector data format digitized with ArcGIS-9.3 software) as
accurate as possible.
VARIABLE SELECTION
Owing to the very high-resolution image, we were able to segment
small gaps of a minimal size of up to 1 · 1 m2. Inclusion of such gap
properties is a prerequisite for any analysis of the potential impor-
tance of smallest gaps for driving understorey plant diversity. For
each gap, we calculated eight different patch (gap) metrics that are
predominantly used in landscape-scale analyses for correlations with
biodiversity and in forest applications. The first three gapmetrics area
(A), perimeter (P) and perimeter ⁄ area ratio (P ⁄A) are very basic mea-
sures. Then, circularity (C) was calculated as 4pA ⁄P2, with values of
1Æ0 describing a perfect circle and values approaching 0Æ0 indicating
increasingly elongated shapes. The gap shape complexity index
(GSCI) ¼ P=ffiffiffiffiffiffiffiffiffi
4pAp
is an important measure of forest gaps (Koukou-
las &Blackburn 2004). It is the ratio of a gap’s perimeter to the perim-
eter of a circular gap of the same area. A value of 1Æ0 describes a
perfect circle while increasing values indicate increasing shape com-
plexity. For example, values of 1Æ40 and 2Æ60 have 40% and 160%
complexity, respectively. The last three gapmetrics are the patch frac-
tal dimension (PFD) = 2ln (P) ⁄ ln (A) (Moser et al. 2002), the fractal
dimension (FD) = 2ln (P ⁄ 4) ⁄ ln(A) (Salvador-Van Eysenrode et al.
1998) and the fractal dimension index (FDI) ¼ 2 lnðP=ffiffiffiffiffiffi
4ppÞ= lnðAÞ
(Saura & Carballal 2004). These three metrics are nonlinearly related,
and especially for small gaps with A < 10 m2, PFD may attain
higher values than FDI that, in turn, attains higher values than FD.
Thus, all eight patch metrics emphasize different nuances of two-
dimensional gap properties that may be potentially important for
linking image-detected higher-level structures to dependent lower-
level processes of the biota.
For each patch metric, we calculated the total sum (Tot), mean
(M), median (Mdn), standard deviation (SD) and coefficient of varia-
tion (CV) for all segmented polygons including the smallest 1-m2
gaps. We also calculated these same statistics once for only the 10
largest gaps (measured by area), once for the nine, eight, seven and so
on largest gaps. This gives a total of 50 variables per patch metric.
For the two largest gaps, we skipped the median, and for the single
largest gap, we just used the patch metric as such. For example, the
abbreviated gap variable ‘Mdn_GSCI_3’ is the median of the gap
shape complexity index of the three largest gaps of a 1-ha plot. All 50
variables of all patchmetrics were applied to all 1-ha plots.
The direct relationship between understorey light and biodiversity
may be affected e.g. by soil condition (Lalanne et al. 2010). Therefore,
we included the four additional covariates pH, bulk density (BD),
organic carbon concentration (OC) and organic carbon stock
(C_stock) in subsequent analyses to judge their relative importance
for the biodiversity assessment based on aerial image analysis. Soil
samples were taken approximately at the centre of each 1-ha plot (for
details see Fischer et al. 2010; Data S3 in Supporting Information).
The soil data used in this analysis originate from the upper 10 cm
because this layer is most influential on understorey vegetation such
as herbs, grasses or ferns. The four soil parameters were measured as
continuous variables with e.g. OC measured in g kg)1 or C_stock in
kg m)2.
STATIST ICAL ANALYSES
Several statistical analyses were applied to evaluate the dependency
between image-based variables (or soil covariates) and understorey
biodiversity. In Analysis 1, we used all gap variables based on the
eight patch metrics for linear correlations with biodiversity as mea-
sured by Pearson’s r. This initial data screening allowed us to get an
overview on the systematic importance of certain patch metrics for
correlation with understorey diversity. To avoid the likelihood that
our meaningful R2 values ‡ 0Æ25 could have arisen just by chance, we
tested the significance of each correlation coefficient using 9999 per-
mutations following the procedure by Legendre & Legendre (1998).
Following Møller & Jennions (2002), we have chosen a value of R2
‡ 0Æ25 as ‘meaningful’ because a predictor variable causes a large
effect if 25% ormore of the variance is explained.
In Analysis 2, we used at first only the gap variables with highest
correlation with biodiversity for univariate linear regressions.
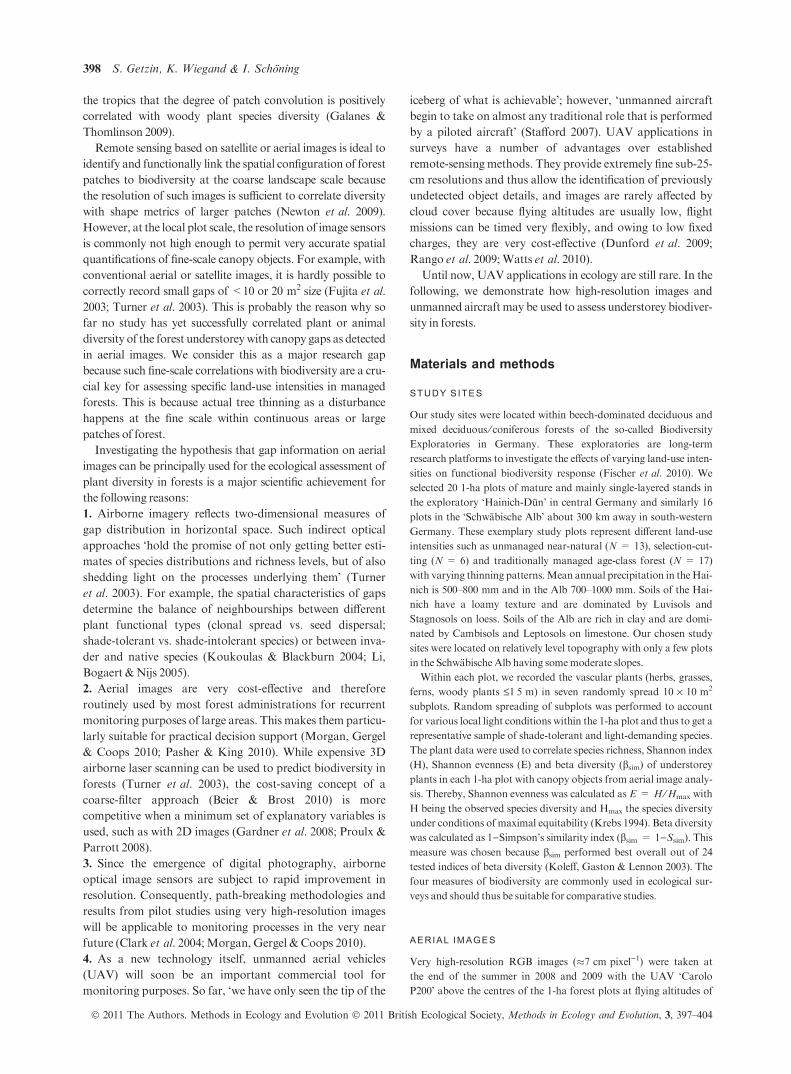
Fig. 1. Start of the unmanned aerial vehicle Carolo P200. Initially,
the UAV gets manually started. Once it has reached the desired
height, it can fly automatically along any predefined spline-based tra-
jectory.
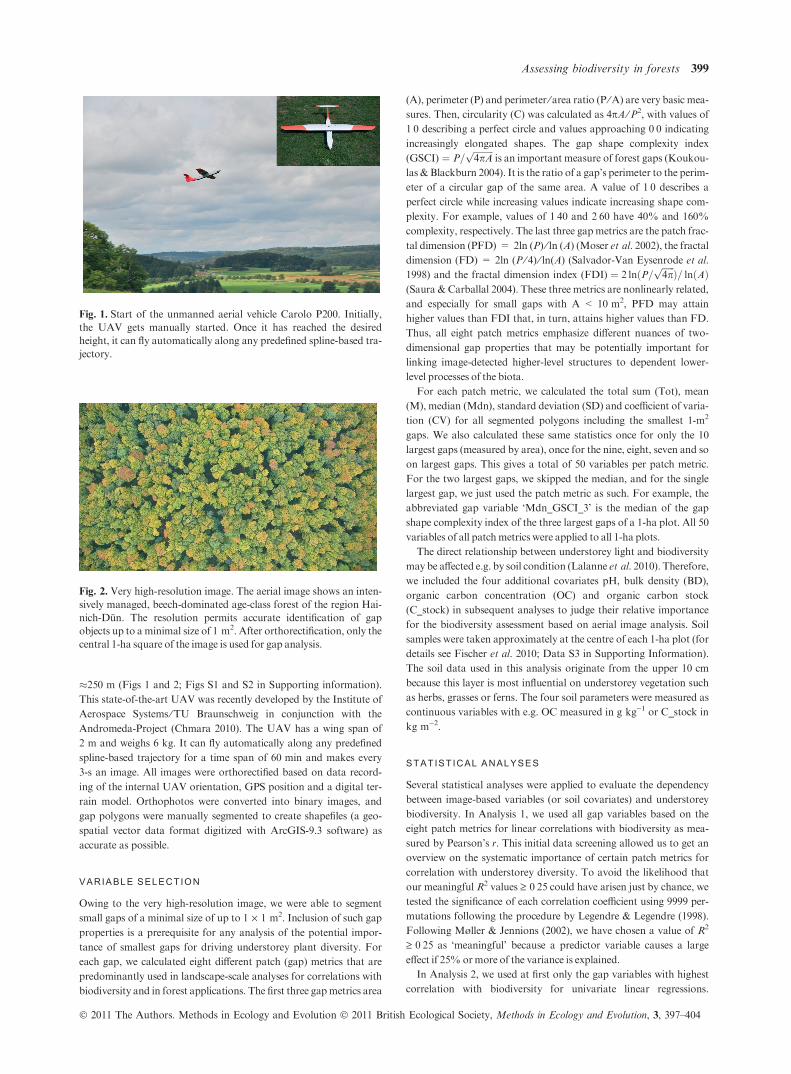
Fig. 2. Very high-resolution image. The aerial image shows an inten-
sively managed, beech-dominated age-class forest of the region Hai-
nich-Dun. The resolution permits accurate identification of gap
objects up to aminimal size of 1 m2. After orthorectification, only the
central 1-ha square of the image is used for gap analysis.
Assessing biodiversity in forests 399
� 2011 The Authors. Methods in Ecology and Evolution � 2011 British Ecological Society, Methods in Ecology and Evolution, 3, 397–404
Afterwards, multiple linear regressions were fitted to judge the rela-
tive importance of soil covariates for modelling our four biodiversity
measures species richness, Shannon H, evenness E and beta diversity
bsim. For this purpose, our single most important gap variable and
the four soil covariates pH, bulk density, organic carbon concentra-
tion and organic carbon stock were simultaneously forced into step-
wise forward regression modelling in the form of
Y = B0 + B1 · X1 +B2 · X2 + B3 · X3 + B4 · X4 + B5 · X5
+ E. The outcome of stepwise inclusion of the five variables is based
on goodness-of-fitmeasures (multipleR2).
In Analysis 3, we investigated whether ‘region’ as a covariate does
have a significant effect on the image-based assessment of biodiversity
given that one and the same gap variable is used for the combined
data of the regions Alb and Hainich together. This was tested with
analysis of covariance (ancova) where we took the best image-based
predictor, showing strongest correlation with biodiversity as continu-
ous variable and region as a factor with the two categorical levels Alb
andHainich.
All statistical analyses were performed using R-2.11 software
(http://www.R-project.org/).
Results
In Analysis 1, we searched for a single best predictor variable
to evaluate biodiversity based on linear correlations with gap
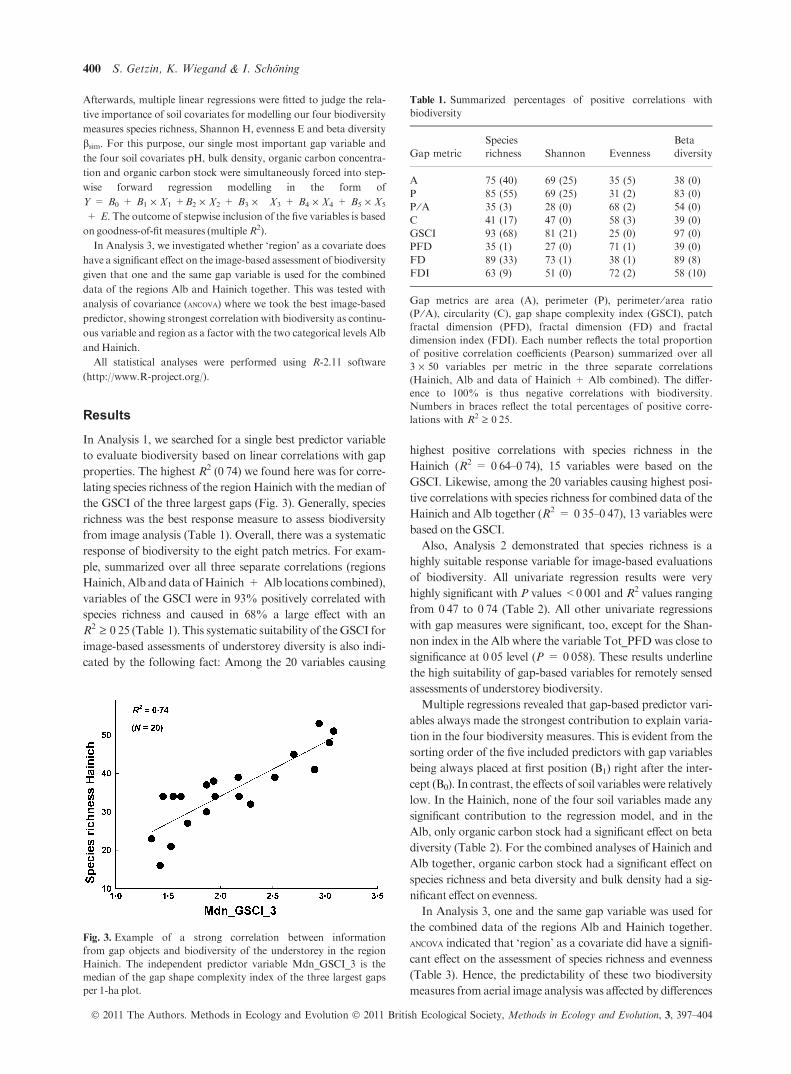
properties. The highest R2 (0Æ74) we found here was for corre-
lating species richness of the regionHainich with themedian of
the GSCI of the three largest gaps (Fig. 3). Generally, species
richness was the best response measure to assess biodiversity
from image analysis (Table 1). Overall, there was a systematic
response of biodiversity to the eight patch metrics. For exam-
ple, summarized over all three separate correlations (regions
Hainich, Alb and data ofHainich + Alb locations combined),
variables of the GSCI were in 93% positively correlated with
species richness and caused in 68% a large effect with an
R2 ‡ 0Æ25 (Table 1). This systematic suitability of theGSCI for
image-based assessments of understorey diversity is also indi-
cated by the following fact: Among the 20 variables causing
highest positive correlations with species richness in the
Hainich (R2 = 0Æ64–0Æ74), 15 variables were based on the
GSCI. Likewise, among the 20 variables causing highest posi-
tive correlations with species richness for combined data of the
Hainich and Alb together (R2 = 0Æ35–0Æ47), 13 variables werebased on theGSCI.
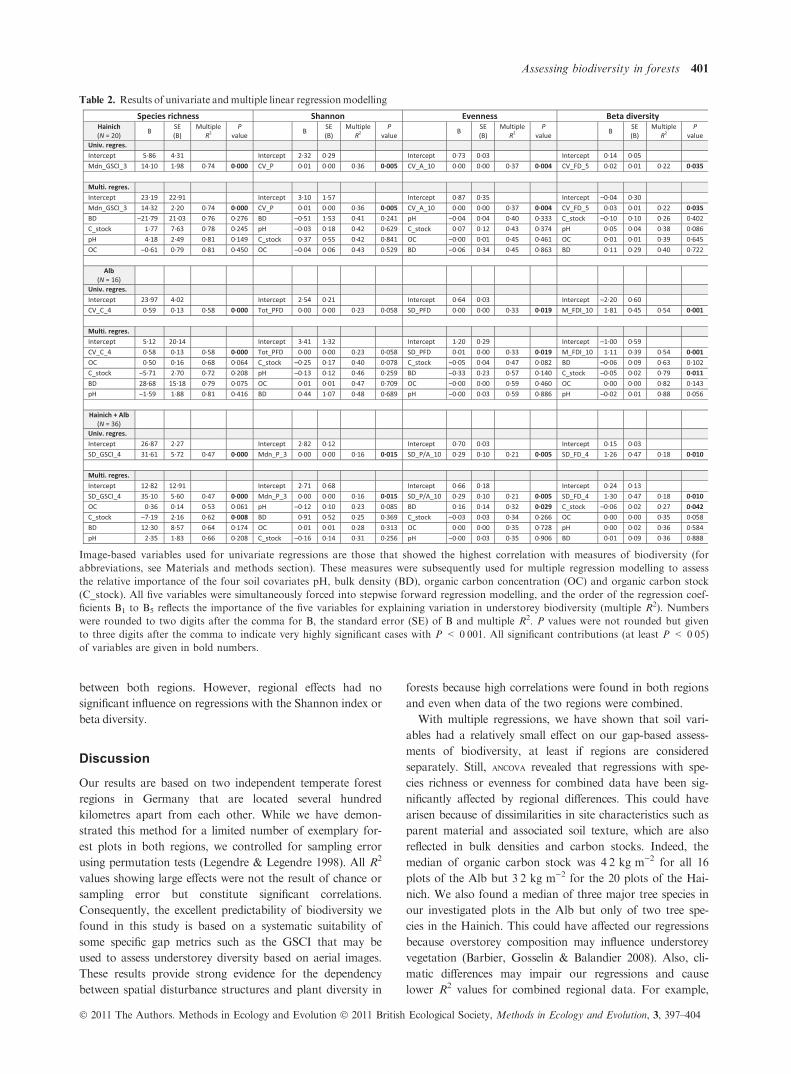
Also, Analysis 2 demonstrated that species richness is a
highly suitable response variable for image-based evaluations
of biodiversity. All univariate regression results were very
highly significant with P values <0Æ001 and R2 values ranging
from 0Æ47 to 0Æ74 (Table 2). All other univariate regressions
with gap measures were significant, too, except for the Shan-
non index in the Alb where the variable Tot_PFD was close to
significance at 0Æ05 level (P = 0Æ058). These results underlinethe high suitability of gap-based variables for remotely sensed
assessments of understorey biodiversity.
Multiple regressions revealed that gap-based predictor vari-
ables always made the strongest contribution to explain varia-
tion in the four biodiversity measures. This is evident from the
sorting order of the five included predictors with gap variables
being always placed at first position (B1) right after the inter-
cept (B0). In contrast, the effects of soil variables were relatively
low. In the Hainich, none of the four soil variables made any
significant contribution to the regression model, and in the
Alb, only organic carbon stock had a significant effect on beta
diversity (Table 2). For the combined analyses of Hainich and
Alb together, organic carbon stock had a significant effect on
species richness and beta diversity and bulk density had a sig-
nificant effect on evenness.
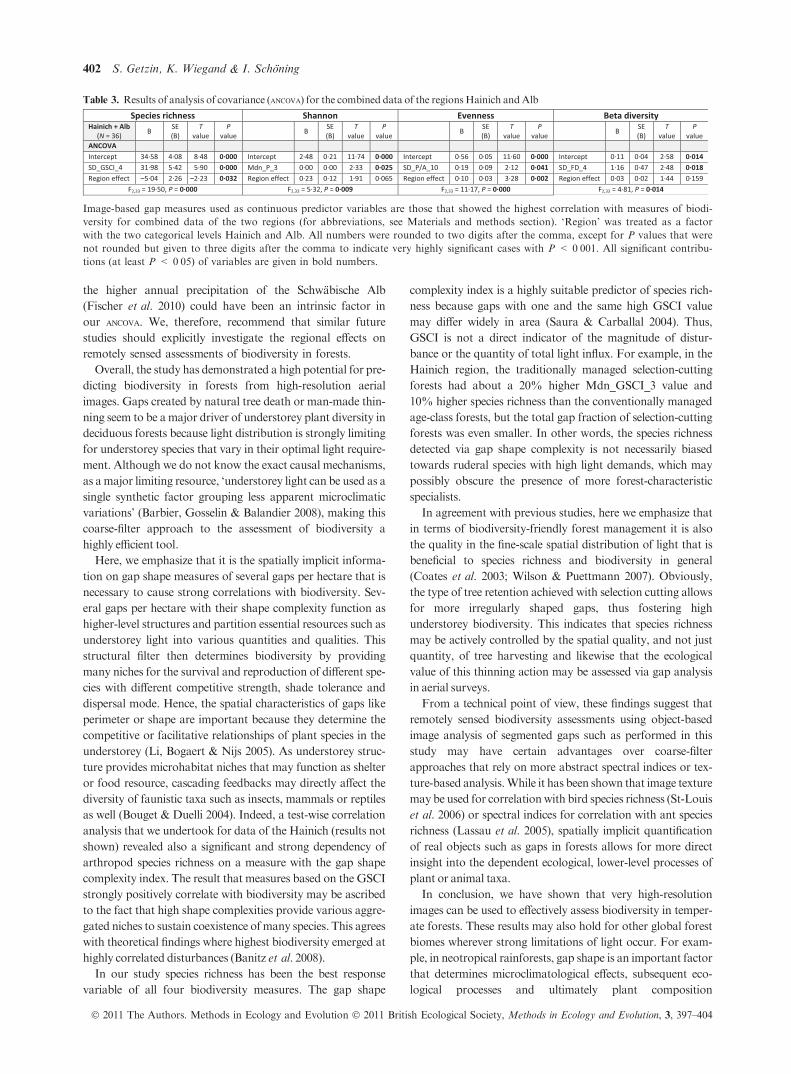
In Analysis 3, one and the same gap variable was used for
the combined data of the regions Alb and Hainich together.
ancova indicated that ‘region’ as a covariate did have a signifi-
cant effect on the assessment of species richness and evenness
(Table 3). Hence, the predictability of these two biodiversity
measures from aerial image analysis was affected by differences
Fig. 3. Example of a strong correlation between information
from gap objects and biodiversity of the understorey in the region
Hainich. The independent predictor variable Mdn_GSCI_3 is the
median of the gap shape complexity index of the three largest gaps
per 1-ha plot.
Table 1. Summarized percentages of positive correlations with
biodiversity
Gap metric
Species
richness Shannon Evenness
Beta
diversity
A 75 (40) 69 (25) 35 (5) 38 (0)
P 85 (55) 69 (25) 31 (2) 83 (0)
P ⁄A 35 (3) 28 (0) 68 (2) 54 (0)
C 41 (17) 47 (0) 58 (3) 39 (0)
GSCI 93 (68) 81 (21) 25 (0) 97 (0)
PFD 35 (1) 27 (0) 71 (1) 39 (0)
FD 89 (33) 73 (1) 38 (1) 89 (8)
FDI 63 (9) 51 (0) 72 (2) 58 (10)
Gap metrics are area (A), perimeter (P), perimeter ⁄ area ratio
(P ⁄A), circularity (C), gap shape complexity index (GSCI), patch
fractal dimension (PFD), fractal dimension (FD) and fractal
dimension index (FDI). Each number reflects the total proportion
of positive correlation coefficients (Pearson) summarized over all
3 · 50 variables per metric in the three separate correlations
(Hainich, Alb and data of Hainich + Alb combined). The differ-
ence to 100% is thus negative correlations with biodiversity.
Numbers in braces reflect the total percentages of positive corre-
lations with R2 ‡ 0Æ25.
400 S. Getzin, K. Wiegand & I. Schoning
� 2011 The Authors. Methods in Ecology and Evolution � 2011 British Ecological Society, Methods in Ecology and Evolution, 3, 397–404
between both regions. However, regional effects had no
significant influence on regressions with the Shannon index or
beta diversity.
Discussion
Our results are based on two independent temperate forest
regions in Germany that are located several hundred
kilometres apart from each other. While we have demon-
strated this method for a limited number of exemplary for-
est plots in both regions, we controlled for sampling error
using permutation tests (Legendre & Legendre 1998). All R2
values showing large effects were not the result of chance or
sampling error but constitute significant correlations.
Consequently, the excellent predictability of biodiversity we
found in this study is based on a systematic suitability of
some specific gap metrics such as the GSCI that may be
used to assess understorey diversity based on aerial images.
These results provide strong evidence for the dependency
between spatial disturbance structures and plant diversity in
forests because high correlations were found in both regions
and even when data of the two regions were combined.
With multiple regressions, we have shown that soil vari-
ables had a relatively small effect on our gap-based assess-
ments of biodiversity, at least if regions are considered
separately. Still, ancova revealed that regressions with spe-
cies richness or evenness for combined data have been sig-
nificantly affected by regional differences. This could have
arisen because of dissimilarities in site characteristics such as
parent material and associated soil texture, which are also
reflected in bulk densities and carbon stocks. Indeed, the
median of organic carbon stock was 4Æ2 kg m)2 for all 16
plots of the Alb but 3Æ2 kg m)2 for the 20 plots of the Hai-
nich. We also found a median of three major tree species in
our investigated plots in the Alb but only of two tree spe-
cies in the Hainich. This could have affected our regressions
because overstorey composition may influence understorey
vegetation (Barbier, Gosselin & Balandier 2008). Also, cli-
matic differences may impair our regressions and cause
lower R2 values for combined regional data. For example,
Table 2. Results of univariate andmultiple linear regressionmodelling
Image-based variables used for univariate regressions are those that showed the highest correlation with measures of biodiversity (for
abbreviations, see Materials and methods section). These measures were subsequently used for multiple regression modelling to assess
the relative importance of the four soil covariates pH, bulk density (BD), organic carbon concentration (OC) and organic carbon stock
(C_stock). All five variables were simultaneously forced into stepwise forward regression modelling, and the order of the regression coef-
ficients B1 to B5 reflects the importance of the five variables for explaining variation in understorey biodiversity (multiple R2). Numbers
were rounded to two digits after the comma for B, the standard error (SE) of B and multiple R2. P values were not rounded but given
to three digits after the comma to indicate very highly significant cases with P < 0Æ001. All significant contributions (at least P < 0Æ05)of variables are given in bold numbers.
Assessing biodiversity in forests 401
� 2011 The Authors. Methods in Ecology and Evolution � 2011 British Ecological Society, Methods in Ecology and Evolution, 3, 397–404
the higher annual precipitation of the Schwabische Alb
(Fischer et al. 2010) could have been an intrinsic factor in
our ancova. We, therefore, recommend that similar future
studies should explicitly investigate the regional effects on
remotely sensed assessments of biodiversity in forests.
Overall, the study has demonstrated a high potential for pre-
dicting biodiversity in forests from high-resolution aerial
images. Gaps created by natural tree death or man-made thin-
ning seem to be amajor driver of understorey plant diversity in
deciduous forests because light distribution is strongly limiting
for understorey species that vary in their optimal light require-
ment. Although we do not know the exact causal mechanisms,
as amajor limiting resource, ‘understorey light can be used as a
single synthetic factor grouping less apparent microclimatic
variations’ (Barbier, Gosselin & Balandier 2008), making this
coarse-filter approach to the assessment of biodiversity a
highly efficient tool.
Here, we emphasize that it is the spatially implicit informa-
tion on gap shape measures of several gaps per hectare that is
necessary to cause strong correlations with biodiversity. Sev-
eral gaps per hectare with their shape complexity function as
higher-level structures and partition essential resources such as
understorey light into various quantities and qualities. This
structural filter then determines biodiversity by providing
many niches for the survival and reproduction of different spe-
cies with different competitive strength, shade tolerance and
dispersal mode. Hence, the spatial characteristics of gaps like
perimeter or shape are important because they determine the
competitive or facilitative relationships of plant species in the
understorey (Li, Bogaert & Nijs 2005). As understorey struc-
ture provides microhabitat niches that may function as shelter
or food resource, cascading feedbacks may directly affect the
diversity of faunistic taxa such as insects, mammals or reptiles
as well (Bouget & Duelli 2004). Indeed, a test-wise correlation
analysis that we undertook for data of the Hainich (results not
shown) revealed also a significant and strong dependency of
arthropod species richness on a measure with the gap shape
complexity index. The result that measures based on the GSCI
strongly positively correlate with biodiversity may be ascribed
to the fact that high shape complexities provide various aggre-
gated niches to sustain coexistence ofmany species. This agrees
with theoretical findings where highest biodiversity emerged at
highly correlated disturbances (Banitz et al. 2008).
In our study species richness has been the best response
variable of all four biodiversity measures. The gap shape
complexity index is a highly suitable predictor of species rich-
ness because gaps with one and the same high GSCI value
may differ widely in area (Saura & Carballal 2004). Thus,
GSCI is not a direct indicator of the magnitude of distur-
bance or the quantity of total light influx. For example, in the
Hainich region, the traditionally managed selection-cutting
forests had about a 20% higher Mdn_GSCI_3 value and
10% higher species richness than the conventionally managed
age-class forests, but the total gap fraction of selection-cutting
forests was even smaller. In other words, the species richness
detected via gap shape complexity is not necessarily biased
towards ruderal species with high light demands, which may
possibly obscure the presence of more forest-characteristic
specialists.
In agreement with previous studies, here we emphasize that
in terms of biodiversity-friendly forest management it is also
the quality in the fine-scale spatial distribution of light that is
beneficial to species richness and biodiversity in general
(Coates et al. 2003; Wilson & Puettmann 2007). Obviously,
the type of tree retention achieved with selection cutting allows
for more irregularly shaped gaps, thus fostering high
understorey biodiversity. This indicates that species richness
may be actively controlled by the spatial quality, and not just
quantity, of tree harvesting and likewise that the ecological
value of this thinning action may be assessed via gap analysis
in aerial surveys.
From a technical point of view, these findings suggest that
remotely sensed biodiversity assessments using object-based
image analysis of segmented gaps such as performed in this
study may have certain advantages over coarse-filter
approaches that rely on more abstract spectral indices or tex-
ture-based analysis.While it has been shown that image texture
may be used for correlationwith bird species richness (St-Louis
et al. 2006) or spectral indices for correlation with ant species
richness (Lassau et al. 2005), spatially implicit quantification
of real objects such as gaps in forests allows for more direct
insight into the dependent ecological, lower-level processes of
plant or animal taxa.
In conclusion, we have shown that very high-resolution
images can be used to effectively assess biodiversity in temper-
ate forests. These results may also hold for other global forest
biomes wherever strong limitations of light occur. For exam-
ple, in neotropical rainforests, gap shape is an important factor
that determines microclimatological effects, subsequent eco-
logical processes and ultimately plant composition
Table 3. Results of analysis of covariance (ancova) for the combined data of the regions Hainich andAlb
Image-based gap measures used as continuous predictor variables are those that showed the highest correlation with measures of biodi-
versity for combined data of the two regions (for abbreviations, see Materials and methods section). ‘Region’ was treated as a factor
with the two categorical levels Hainich and Alb. All numbers were rounded to two digits after the comma, except for P values that were
not rounded but given to three digits after the comma to indicate very highly significant cases with P < 0Æ001. All significant contribu-
tions (at least P < 0Æ05) of variables are given in bold numbers.
402 S. Getzin, K. Wiegand & I. Schoning
� 2011 The Authors. Methods in Ecology and Evolution � 2011 British Ecological Society, Methods in Ecology and Evolution, 3, 397–404
(Salvador-Van Eysenrode et al. 1998). We, therefore, strongly
encourage future studies to test this method of biodiversity
assessment in various forest regions of the world.
Our application of UAV technology in ecological studies
could serve as an inspiration for combining innovative high-
tech with the need for practical decision support. Unmanned
aerial vehicles are increasingly being used in environmental sci-
ence such as for monitoring anthropogenic pollution (Roberts
et al. 2008), rangeland condition (Rango et al. 2009) or ripar-
ian forest (Dunford et al. 2009). Even light detection and rang-
ing (LIDAR) systems may nowadays be mounted to UAVs to
get three-dimensional forest scans (Lin, Hyyppa & Jaakkola
2011). We hope that our study proposing a new method for
biodiversity assessments in forests may be seen as another
path-breaking inspiration for the interplay of biology and tech-
nology (Fields 2001).
Acknowledgements
This study was funded by the DFG Priority Program 1374 ‘Infrastructure-Bio-
diversity-Exploratories’ (WI 1816 ⁄ 9-1) and M. Fischer and the BEO team
financed the aerial images. We are grateful to the core team of the Biodiversity
Exploratories for their logistic support. We highly acknowledge support from
the developers of the UAV such as S. Chmara, H. Sagischewski, M. Busch-
mann, L. Kruger and T. Kruger from the Andromeda-Project and the Institute
of Aerospace Systems ⁄ TU Braunschweig. C. Scherber, T. Tscharntke and M.
Qaim provided comments on earlier versions of this paper.We are also grateful
to the valuable comments from two anonymous reviewers.
References
Banitz, T., Huth, A., Grimm, V. & Johst, K. (2008) Clumped versus scattered:
how does the spatial correlation of disturbance events affect biodiversity?
Theoretical Ecology, 4, 231–240.
Barbier, S., Gosselin, F. & Balandier, P. (2008) Influence of tree species on
understory vegetation diversity andmechanisms involved: a critical review for
temperate and boreal forests. Forest Ecology andManagement, 254, 1–15.
Beier, P. & Brost, B. (2010) Use of land facets to plan for climate change: con-
serving the arenas, not the actors.Conservation Biology, 24, 701–710.
Bouget, C. & Duelli, P. (2004) The effects of windthrow on forest insect com-
munities: a literature review.Biological Conservation, 118, 281–299.
Butchart, S.H.M., Walpole, M., Collen, B., van Strien, A., Scharlemann,
J.P.W., Almond, R.E.A. et al. (2010) Global biodiversity: indicators of
recent declines. Science, 328, 1164–1168.
Chmara, S. (2010) Andromeda. Available at http://www.andromeda-pro-
jekt.com/start.html.
Clark, D.B., Castro, C.S., Alvarado, L.D.A. & Read, J.M. (2004) Quantifying
mortality of tropical rain forest trees using high-spatial-resolution satellite
data.Ecology Letters, 7, 52–59.
Coates, K.D., Canham, C.D., Beaudet, M., Sachs, D.L. & Messier, C. (2003)
Use of a spatially explicit individual-tree model (SORTIE ⁄ BC) to explore
the implications of patchiness in structurally complex forests. Forest Ecology
andManagement, 186, 297–310.
Dunford, R., Michel, K., Gagnage, M., Piegay, H. & Tremelo, M.L. (2009)
Potential and constraints of unmanned aerial vehicle technology for the
characterization of Mediterranean riparian forest. International Journal of
Remote Sensing, 30, 4915–4935.
Fields, S. (2001) The interplay of biology and technology. Proceedings of the
National Academy of Sciences United States of America, 98, 10051–10054.
Fischer, M., Bossdorf, O., Gockel, S., Hansel, F., Hemp, A., Hessenmoller, D.
et al. (2010) Implementing large-scale and long-term functional biodiversity
research: the biodiversity exploratories. Basic and Applied Ecology, 11, 473–
485.
Fujita, T., Itaya, A., Miura, M., Manabe, T. & Yamamoto, S. (2003) Canopy
structure in a temperate old-growth evergreen forest analyzed by using aerial
photographs.Plant Ecology, 168, 23–29.
Galanes, T.I. & Thomlinson, J.R. (2009) Relationships between spatial config-
uration of tropical forest patches and woody plant diversity in northeastern
PuertoRico.Plant Ecology, 201, 101–113.
Gardner, T.A., Barlow, J., Araujo, I.S., Avila-Pires, T.C., Bonaldo, A.B.,
Costa, J.E. et al. (2008) The cost-effectiveness of biodiversity surveys in trop-
ical forests.Ecology Letters, 11, 139–150.
Koleff, P., Gaston, K.J. & Lennon, J.J. (2003) Measuring beta diversity for
presence-absence data. Journal of Animal Ecology, 72, 367–382.
Koukoulas, S. & Blackburn, G.A. (2004) Quantifying the spatial properties of
forest canopy gaps using LiDAR imagery and GIS. International Journal of
Remote Sensing, 25, 3049–3071.
Krebs, C. (1994) Ecology: The Experimental Analysis of Distribution and Abun-
dance, 4th edn. HarperCollins, NewYork.
Lalanne, A., Bardat, J., Lalanne-Amara, F. & Ponge, J.F. (2010) Local
and regional trends in the ground vegetation of beech forests. Flora,
205, 484–498.
Lassau, S.A., Cassis, G., Flemons, P.K.J., Wilkie, L. & Hochuli, D.F. (2005)
Using high-resolution multi-spectral imagery to estimate habitat complexity
in open-canopy forests: can we predict ant community patterns? Ecography,
28, 495–504.
Legendre, P. & Legendre, L. (1998) Numerical Ecology, 2nd edn. Elsevier Sci-
ence BV,Amsterdam.
Li, Z.Q., Bogaert, J. & Nijs, I. (2005) Gap pattern and colonization opportuni-
ties in plant communities: effects of species richness, mortality, and spatial
aggregation.Ecography, 28, 777–790.
Lin, Y., Hyyppa, J. & Jaakkola, A. (2011) Mini-UAV-borne LIDAR for fine-
scale mapping. IEEEGeoscience and Remote Sensing Letters, 8, 426–430.
Lindner, M., Maroschek, M., Netherer, S., Kremer, A., Barbati, A., Garcia-
Gonzalo, J. et al. (2010) Climate change impacts, adaptive capacity, and vul-
nerability of European forest ecosystems. Forest Ecology and Management,
259, 698–709.
Møller, A.P. & Jennions, M.D. (2002) Howmuch variance can be explained by
ecologists and evolutionary biologists?Oecologia, 132, 492–500.
Morgan, J.L., Gergel, S.E. &Coops, N.C. (2010) Aerial photography: a rapidly
evolving tool for ecological management.BioScience, 60, 47–59.
Moser, D., Zechmeister, H.G., Plutzar, C., Sauberer, N., Wrbka, T. &
Grabherr, G. (2002) Landscape patch shape complexity as an effective
measure for plant species richness in rural landscapes. Landscape Ecol-
ogy, 17, 657–669.
Newton, A.C., Hill, R.A., Echeverrıa, C., Golicher, D., Rey Benayas, J.M.,
Cayuela, L. & Hinsley, S. (2009) Remote sensing and the future of landscape
ecology.Progress in Physical Geography, 33, 528–546.
Pasher, J. &King,D.J. (2010)Multivariate forest structure modelling andmap-
ping using high resolution airborne imagery and topographic information.
Remote Sensing of Environment, 114, 1718–1732.
Proulx, R. & Parrott, L. (2008) Measures of structural complexity in digital
images for monitoring the ecological signature of an old-growth forest
ecosystem.Ecological Indicators, 8, 270–284.
Rango, A., Laliberte, A., Herrick, J.E., Winters, C., Havstad, K., Steele, C. &
Browning, D. (2009) Unmanned aerial vehicle-based remote sensing for
rangeland assessment, monitoring, and management. Journal of Applied
Remote Sensing, 3, 033542.
Roberts, G.C., Ramana, M.V., Corrigan, C., Kim, D. & Ramanathan,
V. (2008) Simultaneous observations of aerosol cloud–albedo interac-
tions with three stacked unmanned aerial vehicles. Proceedings of the
National Academy of Sciences United States of America, 105, 7370–
7375.
Sala, O.E., Chapin, F.S. III, Armesto, J.J., Berlow, E., Bloomfield, J., Dirzo, R.
et al. (2000) Global biodiversity scenarios for the year 2100. Science, 287,
1770–1774.
Salvador-Van Eysenrode, D., Bogaert, J., Van Hecke, P. & Impens, I. (1998)
Influence of tree-fall orientation on canopy gap shape in an Ecuadorian rain
forest. Journal of Tropical Ecology, 14, 865–869.
Saura, S. & Carballal, P. (2004) Discrimination of native and exotic forest pat-
terns through shape irregularity indices: an analysis in the landscapes of Ga-
licia, Spain.Landscape Ecology, 19, 647–662.
Stafford, N. (2007) Spy in the sky.Nature, 445, 808–809.
St-Louis, V., Pidgeon, A.M., Radeloff, V.C., Hawbaker, T.J. & Clayton,M.K.
(2006) High-resolution image texture as a predictor of bird species richness.
Remote Sensing of Environment, 105, 299–312.
Turner,W., Spector, S., Gardiner, N., Fladeland,M., Sterling, E. & Steininger,
M. (2003) Remote sensing for biodiversity science and conservation. Trends
in Ecology & Evolution, 18, 306–314.
van Vuuren, D.P., Sala, O.E. & Pereira, H.M. (2006) The future of vascular
plant diversity under four global scenarios.Ecology and Society, 11, 25.
Watts, A.C., Perry, J.H., Smith, S.E., Burgess,M.A., Wilkinson, B.E., Szantoi,
Z. Ifju, P.G. & Percival, H.F. (2010) Small unmanned aircraft systems for
low-altitude aerial surveys. Journal ofWildlifeManagement, 74, 1614–1619.
Assessing biodiversity in forests 403
� 2011 The Authors. Methods in Ecology and Evolution � 2011 British Ecological Society, Methods in Ecology and Evolution, 3, 397–404
Whitney, G.G.&Foster, D.R. (1988) Overstorey composition and age as deter-
minant of the understorey flora of woods of central New England. Journal of
Ecology, 76, 867–876.
Wilson, D.S. & Puettmann, K.J. (2007) Density management and biodiversity
in young Douglas-fir forests: challenges of managing across scales. Forest
Ecology andManagement, 246, 123–134.
Received 23May 2011; accepted 5 August 2011
Handling Editor: Andrew Tatem
Supporting Information
Additional Supporting Information may be found in the online ver-
sion of this article.
Fig. S1. Very high-resolution image of a near-natural forest in the
HainichNationalpark.
Fig. S2.Very high-resolution image of a selection-cutting forest of the
regionHainich-Dun.
Data S3. Soil samplingmethods.
As a service to our authors and readers, this journal provides support-
ing information supplied by the authors. Such materials may be re-
organized for online delivery, but are not copy-edited or typeset.
Technical support issues arising from supporting information (other
thanmissing files) should be addressed to the authors.
404 S. Getzin, K. Wiegand & I. Schoning
� 2011 The Authors. Methods in Ecology and Evolution � 2011 British Ecological Society, Methods in Ecology and Evolution, 3, 397–404