assessing banking sector competition in zimbabwe using a … ·...
TRANSCRIPT
Economic Research Southern Africa (ERSA) is a research programme funded by the National
Treasury of South Africa. The views expressed are those of the author(s) and do not necessarily represent those of the funder, ERSA or the author’s affiliated
institution(s). ERSA shall not be liable to any person for inaccurate information or opinions contained herein.
Assessing Banking Sector Competition in
Zimbabwe Using a Panzar-Rosse Approach
Sanderson Abel and Pierre Le Roux
ERSA working paper 599
April 2016
Assessing Banking Sector Competition in
Zimbabwe Using a Panzar-Rosse Approach
Sanderson Abel∗& Pierre Le Roux†
April 20, 2016
Abstract
This paper assesses the level of competition in Zimbabwe’s banking sec-tor using the Panzar-Rosse H-statistic. The H-Statistic has been assessed,using the total revenues regression equation, and applying the panel leastsquare regression model with fixed effects. The H-statistics is estimated at0.56, which result is confirmed, using bank random effects and the Generalmethods of moments, yield similar results. The H-statics obtained fromthe two methods are 0.54 and 0.51 for the random effect and generalisedmethods of moments, respectively. The results confirm the presence ofa monopolistic competition. On an annual basis, the results show thatthe Zimbabwean banking sector is evolving towards perfect competition.The increased competition was evident through aggressive promotions,increased marketing of banking products, and increased tenure of loansfrom one year to three years for individuals as banks tried to outclasseach other. The study recommends that the government should desistfrom tampering with market forces as this reduces the amount of compe-tition.
1 Introduction
A competitive banking system is a pre-requisite for effective intermediation be-tween savers and investors. A banking sector that is able to bring about supe-rior innovation, decreased prices and enhanced quality of the goods and servicesproduced, thus improving the standard of living through increasing choices andwelfare of the citizens (Carbo et al. 2009). Competition is also important foreffective monetary policy transmission, increasing the speed at which policy in-terest rates, set by the central bank, transfer through to the banking sector.Competition impacts financial innovation, financial wealth of banks, financialstability and the extent to which small to medium enterprises have access toaffordable financing (Bikker 2010).
∗PhD Candidate - Nelson Mandela Metropolitan University†Professor of Economics — Nelson Mandela Metropolitan University
1
There are a number of arguments in favour of banking competition. Bankingcompetition helps to foster higher economic growth (Buchs & Mathiesen 2005).It enhances efficiency as it compels managers to cut down on costs in order toremain profitable (Claessens & Laeven 2004). Banking competition improvesthe corporate sector’s access to finance, reducing the chances of financial crises(Claessens & Klingebiel 2001). Banking competition facilitates banks to satisfythe needs of the public at a reduced social cost and enhances the efficiency of theproduction and quality of financial services and products. Claessens and Laeven(2004) argued that a reduction in the level of competition in the banking sectorwill make provision of financial services costly leading to less financing whichimpedes economic growth.
Given the arguments in favour of competition in the banking sector, thispaper attempts to measure the level of competition in the Zimbabwean bankingsystem after the introduction of dollarization in 2009. The motive for investigat-ing the Zimbabwean banking sector arises from the economic crisis that affectedthe economy during the period 2000-2008. The economy suffered one of theworst hyperinflation episodes in the world. The hyperinflation environment re-duced profitability of the banking institutions in real terms. Bank balance sheetswere severely affected by the hyperinflation; they shrank in real terms becauseof the losses on an inflation adjusted basis attributed to the highly negative realreturns on government securities and high levels of statutory reserves (Chipika &Malaba 2011). Savings by the banking public in banks were eroded as inflationcontinued to rise. The erosion of the bank balances by inflation led to the lossof confidence in banks by the banking public. The situation was exacerbatedby the imposition of withdrawal limits by the Central Bank. The continued up-wards spiralling inflation depleted the withdrawal limits which further lessenedthe public’s confidence in the banking sector.
The profundity of the financial intermediation in the economy declined. In-efficiencies in the national payment systems, the slowdown in the local currencydenomination, loans and declining foreign currency flows into the formal bank-ing sector, led to a significant decline in traditional bank lending. Balancesheets contracted significantly despite the efforts by banks to hedge against in-flation through investments in real assets. The problem was arrested throughdollarization of the economy when Zimbabwe adopted a basket of currencies(multi-currency system) as legal tender in February 2009.
The introduction of the multi-currency system after the prolonged economicdecline of almost one decade (2000-2008) led to the end of hyperinflation. Un-der the multi-currency system, the economy registered price stability with infla-tion averaging two per cent before further declining into negative rates in 2014(ZimStats 2015). Low inflation is supported by studies of dollarized economieswhere inflation was found to be lower compared to those non-dollarized coun-tries (Alesina & Barro 2001). Inflation in dollarized economies usually mirrorsthat of a country whose currency is being used.
This paper is an empirical assessment of the banking sector competitionbetween 2009 and 2014 using the Panzar and Rosse model (P-R model). Thepaper specifically has three objectives. Firstly, it tests for equilibrium within
2
the Zimbabwean banking sector over the whole period 2009-2014. Secondly,it assesses competition for the whole period under consideration. Thirdly, theobjective is the estimation of the degree of competition each year; ascertainingthe evolution of the competition during the study period.
Section two of this paper outlines the background of the problem. Sectionthree reviews the literature; section four outlines the Panza and Rosse method-ology of estimating competition in the banking sector. Section five presents theresults of the study followed by the conclusions and recommendations in sectionsix.
2 Overview of the Zimbabwean banking sector
Zimbabwe officially dollarized in February 2009 (GoZ 2009) and adopted a bas-ket of currencies in response to the hyperinflation and continued decline ineconomic activity. Dollarization can be defined as a shift away from the domes-tic currency to a foreign currency to fulfil the main functions of money, such asstoring of value, unit of account, and medium of exchange (Bogetic 2000). Dol-larization is usually a response to unstable macroeconomic conditions (examplesinclude Ecuador, Panama and El Salvador) and the citizens of the country lookat alternative means to diversify their assets in the face of heightened domes-tic currency risks. An example of a country that also adopted dollarization isEcuador. Ecuador, like Zimbabwe, after experiencing economic instability, dol-larized their economy in 2000. Within the year of dollarization the Central Bankof Ecuador repurchased almost all the outstanding stock of Sucres and managedto convert all deposits which were held by banks into dollars (Quispe-Agnoli &Whisler 2006).
In sharp contrast to what happened in Ecuador, the Zimbabwean govern-ment did not repurchase the Zimbabwean dollars in circulation nor converted thedeposits which were held by the banks. The failure by the authorities to demon-etize the Zimbabwean dollar destroyed the confidence of the banking public thatpreviously had seen their savings reduced by hyperinflation and the debasing ofthe Zimbabwean dollar.
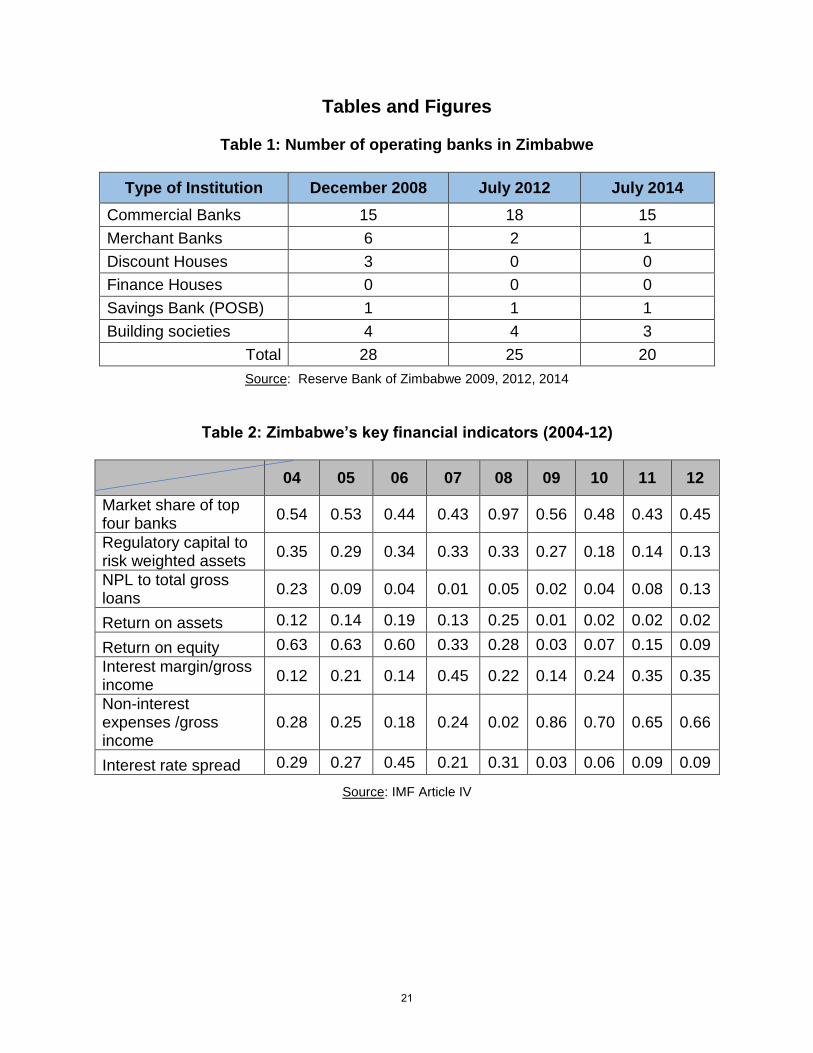
Under the multi-currency system, the banking sector decreased from 28shortly before dollarization to 20 banks by mid-2014 (Table 1). The declinein the number of banks resulted from the collapse of some of the banks andthe consolidations and mergers that took place in an effort to meet the strin-gent regulatory capital requirements. The Central Bank cancelled six bankinglicenses while one bank was placed under curatorship. The failure of the bankswas mostly due to poor corporate governance, insolvency and imprudent lendingactivities (RBZ 2014).
The average banks’ performance, measured by the return on assets and re-turn on equity, increased at first and then declined over the period. The prof-itability was on the increase for the period 2009-2011, after which, it took adownward turn in 2012 and continued thus during 2013. The banking sectorprofit margins therefore have been jeopardised in the multi-currency environ-
3
ment despite higher interest rate margins, as reflected by the low profitabilityratios compared to periods prior to the multi-currency system.
The market share of the top four banks, as shown in Table 2 below, declinedduring the multi-currency period. This was mainly a result of the confidenceboosting measures which the Central Bank put in place. These measures in-cluded increasing capital requirements and introducing stringent risk manage-ment guidelines. Prior to multi-currency the banking sector experienced a flightto quality situation where the banking public moved their deposits to estab-lished international banks. With increased competition, product offering, es-pecially loans, more clients were attracted. The flight to quality experiences isreflected by the high market shares of the top four banks which reached 97 percent at the height of the hyperinflation in 2008.
Table 2 shows that the number of NPLs has increased during the multi-currency system. The increase in the amount of NPLs was a result of lending torisky borrowers against the background of increasing competition in the sector.On the other hand banks were also experiencing an increase in insider loans; asign of deterioration in good corporate governance.
The interest rate margin, which is a proxy for efficiency, shows an improve-ment and, over time, interest margins account for a growing share of gross in-come from 12 per cent in 2004 to 35 per cent in 2012. The wide ranging interestspreads among banking institutions reflect the different costs and lending ratescharged by banks. International banks have very low costs of funds accountingfor the relative ease of their mobilising deposits, which can be ascribed to theirlow risk profiles and access to lines of credit. In contrast, small banks sufferedhigh weighted costs of funds; a symptom of the high costs they faced in mobil-ising funds. Table 2 also shows that despite the relatively low costs of funds forsome banks, the maximum lending rates continued to be punitively high andproving to be an impediment to economic recovery. Zimbabwean banks havealso been proactive in adopting and internalising international best practicesand new technologies as reflected by the progress made by implementing theBasel 2 and 3 Capital Accords.
The government instituted a Memorandum of Understanding (MoU) be-tween the Central Bank and the other Banks in February 2013 regarding bankcharges and interest rates in the banking sector. Effectively the sector became acontrolled one. This was upon the realisation by the Zimbabwean Governmentthat Banks were charging exorbitant interest rates and bank charges to theirclients. The MoU altered the business conditions, the interest rate on depositand investment accounts, and on overdrafts, loans and advances. This restrictedthe amount of competition as these revenue streams became predefined by theauthorities and consequently banks could not compete on this front. All bank-ing institutions, for example, were supposed to pay interest on savings accounts;however, each participating banking institution was at liberty to create its ownvariety of savings accounts. The MoU required that lending rates be set at arate not exceeding 12.5 percentage points above the participating financial in-stitutions weighted cost of funds. Any term deposit by individual customers ofUS$1 000 was supposed to attract an interest rate of no less than 4 per cent
4
when held over a period of at least 30 days. The MoU exempted the elderly(above sixty years) from all forms of bank charges including account mainte-nance fees except where such accounts were used for business purposes. Theeffect of the controls was to make the banking conditions almost the same forall the banks.
The Market concentration measured by the Herfindahl-Hirschman Index(HHI) shows that the banking deposits were increasing in concentration.
Figure 1 indicates that the index value increased from 1,300 in 2009 to1,420 as at 31 December 2014 (Figure 3). The graph shows that competitionin the banking sector increased between 2010 and 2012 as evidenced by a lowerHHI compared to that of 2009. The period was characterised by a decliningconcentration index. The concentration index was higher than the 2009 level in2013 and 2014, showing that compared to 2009, there was less competition inthe banking sector during that period.
3 Literature review
Claessens (2009) identified three approaches to empirical measurement of com-petition: market structure and associated indicators; contestability and reg-ulatory indicators to gauge contestability; and formal competition measures.The Structure-Conduct-Performance (SCP) paradigm links structure and per-formance. The market structure is mostly defined by the level of concentrationin the market. Conduct relates to the behaviour of the firms in terms of compet-itiveness or ability to collude. Behaviour takes various forms including pricing,research and development, barriers to entry and technology choice, among oth-ers. Performance is mostly defined by market power - market power implyinglower efficiency. The SCP argument is that the structure of the industry influ-ences its conduct, which in turn affects performance. For example, if there is lowconcentration in the industry it will lead to increased competition. Increasedcompetition will lead to reduced market power among the players and improveefficiency. Lower concentration is therefore associated with lower market power.The SCP paradigm is derived from the neo-classical analysis of markets. Theinitial studies were expanded by including proxy variables for efficiency with theaim of testing the so-called efficient structure hypothesis (Berger 1995). The ap-proach is based on factors such as financial system concentration, the numberof banks, or Herfindahl indices.
The contestability and regulatory indicators approach relies on regulatoryindicators to gauge the degree of contestability. This method considers regu-latory issues such as entry requirements, formal and informal barriers to entryfor domestic and foreign banks and activity restrictions, among others. Themethod further takes into account changes over time in financial instrumentsand innovations, given that these can alter the competition environment. Therehas been an expansion in the competition determinants with the inclusion ofregulatory and institutional variables. Demirgüç-Kunt et al. (2004) investigatedthe impact of bank-specific characteristics, bank regulations, market structure,
5
and institutional development on bank performance. Barth et al. (2004) exam-ined the relationships between a number of bank regulations and supervisorypractices as well as aggregate measures of bank development, performance andstability using a cross-country database.
The formal approach to measuring competition substitutes the reaction ofoutput to input prices. Most of these formal competition measures have beenapplied in other industries and adopted in measuring banking sector competi-tion. These methods are underpinned by a number of assumptions on cost andproduction functions. These methods have been developed to circumvent theweaknesses of the SCP. The weakness of the SCP and the efficiency hypothesesis that they assume one way causalities from market structure to performance.This means that SCP fails to account for the conduct of the banks in the marketand the impact of performance of the banks on market structure. The New Em-pirical Industrial Organisation (NEIO) tried to avoid inferring competition frommarket shares or market structure but directly inferred firms’ conduct using anumber of methodologies. This approach uses optimisation models, from which,indicators of competition such as the Lerner index, the Panzar and Rosse test(“H-statistic”), conjectural variation and the Boone indicator are derived.
The Panzar and Rosse (1982, 1987) H-statistic measures industry compe-tition based on the elasticity of bank interest revenues to input prices. Thisapproach analyses the transmission of changes in input prices to bank revenue.This approach was applied by Bikker and Haaf (2002), Gelos and Roldos (2002),Claessens and Laeven (2004), and Levy-Yeyati and Micco (2007). This methodfalls is classified as non-structural methods that assess competition in respect ofnew empirical industrial organisations derived from the equilibrium conditions.One of the assumptions underlying the P-R test is that the test only appliesfor single-output firms. In applying this model to the banking sector, banks aretreated as producers of intermediation services by means of factor inputs suchas labour, physical and financial capital. The other underlying assumption ofthe P-R approach relates to the cost structure, which must be homogeneous,and the price elasticity of demand, which must be greater than one.
The derivation of the Panzar and Rosse H-statistic in this section is basedupon the work of Bikker and Haaf (2002). Consider a representative bank I;the profit maximisation condition holds for both the industry and firm level. Atthe firm level the profit maximisation condition is given as follows:
Ri(y∗
i , ZRi ) = Ci(y
∗
i ,Wi, ZCi ) (1)
Where Ri(y∗i , ZRi ) and Ci(y∗i ,Wi, Z
Ci ) are the revenue and cost functions of
bank i. yt is the output of the firm, Wi is a K-dimensional vector of factorinput prices of bank i, Wi = (w1, w2, ...wk), ZRi is a vector of j exogenousvariables affecting the revenue function ZRi = (z
R1i, Z
R2i...Z
RLi), Z
Ci is a vector of
L exogenous variables that shift the cost function ZCi = (zC1i, Z
C2i...Z
CLi).
At the individual level, the marginal revenue must equal marginal cost:
R′i(y∗
i , ZRi ) = C′i(y
∗
i ,Wi, ZCi ) (2)
6
The H-statistic evaluates the elasticity of total revenues with respect tochanges in factor input prices:
H =K∑
k=1
∂R∗i∂wki
·wki
R∗i(3)
The P-R approach usually assumes log linearity in the specifications of themarginal revenue and marginal cost functions.
Ln(R′i) = a0 + a1Ln(yi) +J∑
j=1
djLn(ZRji) (4)
Ln(C′t) = c0 + c1Ln(yi) +J∑
j=1
bkLn(wki) +J∑
j=1
vjLn(ZCli ) (5)
For a profit maximising bank the equilibrium output results from (2):
a0+ a1Ln(yi)+J∑
j=1
djLn(ZRji) = c0+ c1Ln(yi)+
J∑
j=1
bkLn(wki)+J∑
j=1
vjLn(ZCli )
(6)Rearranging terms:
Ln(yi) =i
(a1 − c1)·
c0 − a0 +J∑
j=1
bkLn(wki) +J∑
j=1
vjLn(ZCli )−
J∑
j=1
djLn(ZRji)
(7)The reduced form equation for revenues of the representative bank is given
by the product of the equilibrium output of bank i and the common price level:
Ln(R∗i ) = Ln(P ∗y∗i ) (8)
The price level is provided by the inverse demand equation, which also readsin logarithms:
Ln(p) = µ+ λLn(Y ) (9)
where Y =I∑
i=1
yj (10)
Y is the aggregate output of the industry. The reduced form revenue equa-tion after algebraic manipulation is achieved by:
Ln(R∗t ) = α+K∑
k=1
βkLn(wki) +
Q∑
q=1
δqLn(zqi) (11)
Where zi is a vector of Q bank specific variables, without reference to theirorigin from the cost or revenue function zi = (z1i, ..., zQi).
7
There are a number of studies that have applied the Panzar-Rosse method-ology in measuring the degree of competition in the banking sector. Theseinclude Gelos and Roldos (2002); Nathan and Neave (1989); Claessens andLaeven (2004); De Bandt and Davis (2000); and Aktan and Massood (2010).Bikker and Groeneveld (2000) used data from a sample of European countriesbetween 1989 and 1996 and found that there was no competition during thestudy period. Haffani (2002) studied the structure of Tunisia’s banking sec-tor during the period 1980 to 1999 applying the Panzar-Rosse method. Theresults showed that the Tunisian banking sector operated under monopolisticconditions with increasing competition. Bikker and Haaf (2002) analysed 23OECD countries over the period 1988 to 1998 and their results showed thatthe countries were operating in a market structure of monopolistic competition.They further found that competition seemed to be stronger for large banks andweaker for smaller banks.
Weill (2004) studied twelve European countries during the period 1994 to1999 using the yearly Tobit-based estimates of the H-statistic. The resultsshowed that the countries, e.g. Spain, were operating under a decreasing pat-tern of monopolistic competition. He further found that there was a negativerelationship between competition and efficiency. Al-Muharrami et al. (2006)studied the Arab Gulf Cooperation Council’s banking sector over the period1993 to 2002. Using the pooled and the fixed effect method found that theH-statistics was 0.24 and 0.47 respectively. The results meant that the bankingsector was operating in a monopolistic competition environment. Wong et al.(2006) studied the evolution of competition in the banking sector of Hong Kongduring the period 1991 to 2005 using the Panzar-Rosse method. The resultsshowed that competitive pressure was higher among larger banks and loweramong smaller banks.
Roldos and Gelos (2004) studied the structure of the banking sector in anumber of European and Latin American countries and found that there wassignificant bank consolidation which led to a decline in the number of banks.The reduction in the number of banks did not reflect an increase in consolidationof the banking sector as measured by the standard concentration ratios, thuscompetition did not increase. The decline in the competitive pressures was asa result of lowering barriers to entry through increased participation of foreignbanks. Casu and Giradone (2006) found that the degree of concentration andthe level of competition were independent of each other. Ariss (2009) estab-lished that the market structure in the banking system in the MENA regionexhibited a monopolistic competition structure despite the increase in concen-tration. Claessens and Laeven (2004) found that the banking sector, whichallowed foreign banks to enter their market and that those that did not re-strict entry and activities were more competitive. The results did not find anyevidence supporting negative relationships between banking system concentra-tion competition and. These results supported the contestability hypothesis ascontestability was found to affect competition. Abdul-Majid and Sofian (2008)studied the level of competition and the structure of the Islamic banking in-dustry in Malaysia and found that the Malaysian banking sector was neither a
8
monopoly market or perfectly competitive. The results pointed that the Islamicbanks in Malaysia operated under monopolistic competition.
Korsah, Nyarko and Tagoe (2001) measured the intensity of bank competi-tion in the Ghanaian banking sector after the implementation of economic re-forms. The results showed that there was an increase in competition in Ghana’sbanking system as a result of the economic reforms and the banking sector wasoligopolistic in nature, which explained the profitability of the sector. Fu andHeffernan (2009) investigated the relationship between market structure andperformance in the Chinese banking system after the reforms in the financialsector. They found that x-efficiency significantly decreased and the majority ofthe banks operated below the levels of efficiencies of effective scale.
Delis (2012) argued that financial reforms and the quality of institutions aremajor determinants that promote competitive conduct of banks. The argumentimplies that the competitiveness of the banking sector increases with financialsector reforms in countries with stronger institutions which bring about finan-cial innovation. Moyo and Nandwa (2014) argued that reforms are supposedto increase the amount of competition leading to financial innovation and effi-ciency. This argument is supported by Hauner and Peiris (2005) argued thata high degree of competition and efficiency leads to financial stability, productinnovation, and access by households and firms to financial services. Yildirimand Philippatos (2007) also supported this view and proved that an increase incompetition can enhance the prospects for economic growth, by raising the avail-ability of credit and financial services to businesses and households. Moyo andNandwa (2014) identified a negative side to increased competition; that it couldbe a source of systemic risk to the financial structure through contagion lead-ing to macroeconomic instability and reduced investments and growth. Haunerand Peiris (2005) argued that the recent global financial crisis is a testimonyto the effect of financial sector reforms that mostly originated from excessiverisk taking behaviour by banks. Noland (1996) studied the liberalisation of thedomestic financial markets and found that financial liberalisation led to the con-vergence of the borrowing rates between the formal and informal markets. Thecreation of this competitive environment led to the banks to adopt cost cuttingmeasures, efficiently use resources, reduce labour costs and increase the qualityof services such as faster clearing of payments, rapid loan application process-ing and extended banking hours for the benefit of their clients. Cooray (2003)compared the pre- and post-reform periods in Sri Lanka in terms of regulatoryreforms. Cooray measured the number of financial instruments on the market,depth by the volume of deposits, and resilience by the ability to bounce backfrom a price change. In addition Cooray (2003) found that though the reformswere still being implemented there was improvement in the width and depth ofthe financial system.
There was also improvement in terms of competition. The operational andallocative efficiency was found to have increased while the financial sector be-came resilient. Bhetuwal (2005) examined the financial liberalisation in Nepalin terms of entry barriers, interest rate controls, credit controls, regulations andfinancial transactions, and privatisation of the financial sector each classified
9

into fully repressed, partially repressed, largely liberalised and fully liberalised.The results revealed a two way causality, running from financial liberalisationleading to financial development and vice versa. Bhetuwal (2005) further foundthat the reforms did not have an effect on mobilisation of financial saving, in-terest rate and currency stabilisation. Poshakwale and Qian (2009) studied theeffects of financial sector reforms on the competitiveness of the Egyptian finan-cial sector competitiveness and production efficiency. Their findings indicatedthat there was significant improvement in the competitiveness and productionefficiency after the reforms. However they did not find any long run relationshipbetween increased efficiency and economic growth.
Koskela and Stenbecka (2000) found that an increase in competition leads toa decline in lending rates which increased investments. The results also showedthat under mean-shifting investment technologies, higher investments do not in-crease the bankruptcy risks of borrowers concluding that competition-fragilityhypothesis is inconclusive. Matutes and Vives (2000) studied the effect of com-petition for deposits on the risk-taking behaviour of banks. They found that theuninsured market generates excessive deposit rates under perfect competition.This means there is a high asset risk. Flat-rate deposit insurance schemes andperfectly competitive banks also yield excessive deposit rates even if there is nofailure costs, and therefore high asset risk. The results favoured the competi-tion fragility hypothesis. Jimenez et al. (2007) investigated the competitivenessof the Spanish banking system and concluded that greater banking competitionwas associated with an increase in non-performing loans, which means that com-petition brings about risk behaviour on the part of the banks. This supportedthe competition fragility hypothesis. Berger et al. (2008) found that the riskexposure of banks was driven by higher market power. Increased market powerincreased loan portfolio risks, which support the competition-stability. The re-sults confirmed the existence of competition-stability and competition fragilityhypothesis. Liu et al. (2010) studied the degree of competition in Europeancountries during the period 2000 to 2008. Their study sought to establish the ex-istence of the competition-stability relationship. The study employed the Lernerindex as a measure of competition and the Z-index as a proxy of bank stabil-ity. A nonlinear relationship was established between competition and stability.A negative relationship was established between competition and net interestmargins (proxy for profit) meaning that an increase in banking competition hadthe effect of decreasing the net interest margins and increasing bank stability.This supported the competition stability hypothesis. Chirwa (2003) studied theconnection between market structure and profitability of commercial banks inMalawi. The level of competition was found to have increased as a result of anincrease in the number of commercial banks and financial institutions in general.A long run relationship was established between concentration of the bankingsector and the level of profitability. The study established that collusion hypoth-esis hold for the Malawian financial sector as commercial bank profitability waspositively related with measures of concentration. Hakam, Fatine and Zakaria(2012) studied the determinants of competition in Morocco. Macroeconomicaggregates were found to be the main determinants of competition in Morocco.
10
Competition and concentration had a positive relationship while profitabilityand economic growth were negatively correlated. This showed that sustainedeconomic growth enabled banks to maintain a competitive edge through re-taining their share of the markets sustaining high levels of concentration. Thepositive relationship between competition and interbank interest rates meantthat monetary policies positively impacted on the level of competition.
Competition is not supposed be a sudden process given that it can poten-tially cause bank insolvency which can affect financial stability (Bikker & Boss2005). Banks that operate in non-competitive markets suffer from intermediatemonitoring costs and are likely to generate risky loans setting the stage for sub-sequent problems in the system such as rising non-performing loans (Caminal& Matures 2002). Another perspective on banking sector competition is thata lack of competition leads to limited access to finance by the key productivesectors of the economy, which then limits established corporates from financinginvestment through the banking system. A banking system that lacks compe-tition leads to financial exclusion since higher banking competition with accessto a wide range of product offering at a lower price improves financial inclusion.Bikker (2010) contended that competition should be allowed to a certain extent,beyond which, it becomes counterproductive. Bikker (2010) further argued thatcompetition to a certain level leads to reduced excess profits and banks becomeconstrained in their efforts to build extra buffers to protect them from shocks.
Mlambo and Ncube (2011) studied the South African banking sector to as-certain its degree of competition and efficiency. Using the Panza and Rosseapproach, they found that the South African banking sector was operating un-der monopolistic competition. They further found that the banking sector inSouth Africa was dominated by five banks which accounted for over 85 percent of total banking assets. Using a unique and detailed bank-level data setfor Zambia, Simpasa (2013) estimated the H-statistic for the Zambian bankingsector. The study found the H-statistic to be positive and statistically differ-ent from zero and unit. Simpasa (2013) estimated the H-Statistic for Zambiaat 0.46 implying that Zambian banks earned their revenue under conditions ofmonopolistic competition. The study also found that all three input prices werepositive and significant.
4 Methodology
This section outlines the methodology and data used in this paper. The modelis specified and based on the works by Claessen and Laeven (2004). The modelused comprises the prices of the factors of production and bank specific variables.The regression equation to be estimated is outlined in equation 12:
Ln(Rit) = αi + β1 ln(W1,it) + β2 ln(W2,it) + β3 ln(W3,it) + γ(Z,it) + εit (12)
Where i denotes banks and t denotes years. Rit is the ratio of gross revenuesto total assets, W1 is the ratio of interest expenses to total deposits and moneymarket funding (proxy for input price of deposits), W2 is the ratio of personnel
11
expenses to total assets (proxy for input price of labour) and W3 is the ratioof other operating and administrative expenses to total assets (proxy for inputprice of equipment/fixed capital). Z is a matrix of controls including the ratioof equity to total assets, the ratio of net loans to total assets, and the logarithmof assets (to control for bank size effects). LETA is the ratio of equity tototal assets, LLTA the ratio of net loans to total assets, and the logarithm ofassets to control for bank size effects is denoted by LASS. All the variables arein natural logarithm. The control variables basically capture the set of bank-specific factors. These factors are intended to capture the difference capital base(LETA), business mix and size. These control variables specifically account forliquidity risk, variations in the credit risk (LLTA) and the importance of banksize, captured by the size of asset base (LASS). Finally, εit denotes bank-levelfixed effects.
The H-statistic is then defined as follows:
H = β1 + β2 + β3 (13)
The interpretation of the H-statistic is shown in Table 3 below.The underlying assumptions of the P-R approach are that it should be used
where the observations are in long-run equilibrium. The long-run equilibriumcan be tested by using the H-statistic in a reduced form equation of profitability.Two measures that can be used for profitability are the return on assets or returnon equity in place of the revenue as the dependent variable. The resultant His supposed to be significantly equal to zero in equilibrium and significantlynegative in the case of disequilibrium. The risk adjusted rates of return in acompetitive market will equalise across firms such that rates of return shouldnot be correlated statistically with factor input prices.
To verify the condition of long-run equilibrium, the following regression isestimated:
Ln(ROAit) = αi+β1 ln(W1,it)+β2 ln(W2,it)+β3 ln(W3,it)+γ(Z,it)+εit (14)
ROA is the pre-tax return on assets. Because ROA can take on negativevalues, the dependent variable is computed as ln(1+ROA). The equilibriumE-statistic is defined as follows:
E = β1 + β2 + β3 (15)
The test of long-run equilibrium involves testing whether E=0. If E<0, thereis long-run disequilibrium while if E=0, there is long-run equilibrium. The testfor the longrun equilibrium is undertaken using the Wald coefficient restrictiontest which tests whether E=0 or not.
A panel data approach is employed to estimate regression equations. Theapproach is better able to identify and measure effects that are simply notdetectable in pure cross-section or pure time series. Panel data allow the con-struction and testing of more complicated behavioural models than purely cross-sectional or time-series data. A number of approaches are used in panel data
12
analyses. These include the pooled ordinary least squares (POLS), fixed ef-fects (FE) and random effects (RE) techniques. The POLS approach is simplyan ordinary least squares approach. This approach does not consider the dif-ferences among individuals across time periods and thus it does not considerthe panel nature of the dataset. In addition the estimates obtained by adopt-ing this measure are heavily biased because of the heterogeneity between theerror term and the independent variables. It is because of the inadequacy ofthe POLS to capture the panel nature of the dataset that the fixed effects andthe random effects models become useful. To decide between fixed or randomaffects a Hausman test can be run where the null hypothesis states that thepreferred model is random effects against the alternative, the fixed effects. Itbasically tests whether the unique errors (Ui) are correlated with the regressors,the null hypothesis is they are not. For the robustness check, the results fromfixed effects are compared with the results obtained using the GMM method.The GMM method addresses the potential endogeneity bias in panel data byemploying the instrumental variables.
The data used for this study comprise a strongly balanced panel data setcollected from the bank reports, websites of the banks, Reserve Bank reportsand other sources. There are 18 banks that are included in the sample and quar-terly data is used. The banks included in the sample are those that operatedthroughout the whole period of the study. The time period chosen for consider-ation is 2009 Q1 to 2014 Q2. The time period considered is the multi-currencyperiod when Zimbabwe was using a basket of currencies and the country doesnot have its own currency. This time period is important because the countrywas transitioning from a hyperinflation period to a period of relative stability.
5 Results presentation and analysis
Table 4 presents the descriptive statistics of the variables under consideration.It shows the average values of the variables, the maximum, minimum and thestandard deviation.
The data sets are a balanced panel with 378 observations taken for 18 banksover the period of 21 quarters. Table 5 shows the correlation matrix betweenall variables under consideration.
The correlation coefficient matrix (Table 5) shows that there is no strongcorrelation among the variables. Gujarati (2007) argued that the problem ofmulti-collinearity exists if the correlation between independent variables is above0.8. All the correlation coefficients between the independent variables were lessthan 0.8. As a result all variables were taken into consideration in the estimationof the regression model.
Table 6 shows the results for testing for equilibrium in the banking sector.The PR model is only valid if the market is in longrun equilibrium. This
long-run equilibrium is usually tested with a model in which the dependentvariable is return on assets and the independent variables are the same as in thebaseline model. The test for the long-run equilibrium was undertaken using the
13
Wald coefficient restriction test. The hypothesis on the long-run equilibrium inthe Zimbabwean banking sector (E = β1 + β2 + β3 = 0) has to be acceptedat the significance level of 5%. Using the Wald test, E =-0.0039 and F (1,372)= 1.7464 (0.1871). The null hypothesis of the coefficients being equal to zerois accepted confirming that the Zimbabwe banking sector was in equilibriumduring the period 2009-2014 The rationale for this test is that, in equilibrium,risk-adjusted rates of return should be equal across banks and returns on bankassets should not be related to input prices.
Table 7 shows the Hausman test of choosing between the random effectsmodel against the fixed effect model.
Based on the Hausman test in table 7, the random effects model was rejectedin favour of fixed effects. This means comparing the coefficients estimated by thefixed and random effects model indicate the fixed effects should be consideredcorrect as best fit.
Table 8 shows the estimated H-statistic for the Zimbabwean banking sector.The H-statistic was estimated at 0.56. The null hypothesis H = 0 had to berejected (F (1, 372) = 260.2 and Prob = 0.0000) as well as the hypothesis H= 1 with (F (1,372) = 158.80 and Prob = 0.0000) using the Wald test. Thisshows that the banking sector in Zimbabwe is neither a monopoly nor perfectlycompetitive. The Zimbabwean banking sector can therefore be described asmonopolistic competition since the H-statistic is between 0 and 1. Overall, theestimated H-statistic is positive and significant. The results compare favourablywith those obtained for Zambia using the same method. Simpasa (2013) esti-mated the H-Statistic for Zambia at .46 implying that Zambian banks earnedtheir revenue under conditions of monopolistic competition. This study alsofound that all the three input prices were positive and significant.
The dependent variable total revenue is positively related to the price offunds (W1), the cost of labour (W2) and the cost of capital (W3). Both the priceof funds (PF) and price of labour (PL) variables have positive signs, meaningthat increased factor costs leading to the higher revenue. All variables W1, W2and W3 are statistically significant implying these three variables contribute tothe H-statistic
The equity to assets ratio has a negative but insignificant coefficient Thisresult contradicts the findings by Simpasa (2013) who found a negative andsignificant coefficient in the study of the Zambian Banking sector. The studyfound that a large capital buffer aimed at maintaining banks’ solvency imposesopportunity costs on their revenue performance.
The coefficient of LASS is negative but insignificant. The negative signimplies that the larger banks seem to be less efficient compared to smaller banksin revenue generation. This result could arise because of the diseconomies ofscale factor which leads to declining revenues.
The results show that there exists a certain degree of monopolistic compe-tition in the Zimbabwean banking sector, which is consistent with the resultsof most previous studies that used the same method. The results of the studyare supported by Gutiérrez de Rozas (2007), and Bikker and Haaf (2002) whoargued that monopolistic competition is ideal because the sector is prone to the
14
existence of product differentiation. Banks though sell different products withregard to product quality and promotion. The level of monopolistic competitionis reduced as a result of perfect substitutability of the products. This meansthat banks are able to generate more revenue because of the uniqueness of theirfeatures such as brands, image and advertising. Other studies that found thesame results are: Haffani (2002) who studied the structure of Tunisia’s bank-ing sector during the period 1980 to 1999 employing the Panzar-Rosse method.The results showed that the Tunisian banking sector operated in a monopolis-tic structure with increasing competition; Bikker and Haaf (2002) analysed 23OECD countries over the period 1988 to 1998 and their results showed that thecountries were operating in a monopolistic competition environment. They fur-ther found that competition seemed to be stronger for large banks and weakerfor smaller banks; Weill (2004) studied twelve European countries during theperiod 1994 to 1999 using the yearly Tobit-based estimates of the H-statistic.The results showed that the banks were operating under a decreasing patternof monopolistic competition in Spain.
For a robustness check, the process was repeated with the random effectmodel and the GMM method. The H-statistics obtained from the two methodsare 0.54 and 0.51 for the random effect and generalised methods of momentsrespectively. These H-statistics compares favourably with the one from the fixedeffects of 0.56. The two methods produced similar results as those obtained usingthe fixed effects model. This confirms that the Zimbabwean banking sector isoperating under monopolistic competition. The other variables had the samecoefficient signs as those obtained from the panel regression with fixed effects.
Table 9 confirms the results for the evolution of the Panzar and Rosse H-statistic over the period 2009 to 2014. The analysis of the developments of thePanzar-Rosse H statistics over the period 2009 to 2014 show that competitionhas evolved frommonopolistic competition to perfect competition. There was anincrease in competition during the study period with the H-statistic increasingfrom 0.47 in 2009 to 0.99 in 2014.
The results confirm that the introduction of the multi-currency caught mostbanks unawares without adequate foreign currency assets. These banks werenot able to compete with better placed banks (mostly the foreign owned banks)as they readily had resources to undertake business. The lack of the lenderof last resort and active interbank market meant that domestic banks were torely on foreign banks for liquidity support. Foreign owned banks were at anadvantage and thus restricted the level of competition. When banks adjustedto the multi-currency system, they were able to attract lines of credit and newclients increasing the level of competition in the banking sector.
Competition declined in the banking sector from 0.99 in 2012 to 0.92 in2013. The decline in the H-statistic in 2013 reflects the banking controls thatwere put in place by the Government in 2013. The effect of the banking controlswas to reduce competition in the banking sector reversing the benefits of lib-eralisation. Studies support financial reforms rather than financial repression.Delis (2012) argued that financial reforms and the quality of institutions aremajor determinants that promote competitive conduct of banks. This means
15
that the competitiveness of the banking sector increased through financial sec-tor reforms in countries with stronger institutions which brought about financialinnovation. Moyo and Nandwa (2014) argued that reforms are supposed to in-crease the amount of competition leading to financial innovation and efficiency.This argument is supported by Hauner and Peiris (2005) who argued that a highdegree of competition and efficiency leads to financial stability, product inno-vation and access by households and firms to financial services. Policy makersshould therefore take heed that competition can only be increased by financialliberalisation rather than financial repression.
6 Conclusion and recommendation
This paper undertakes an empirical assessment of the competitive conditionswithin the Zimbabwean banking sector between 2009 and 2014 under a multi-currency system arrangement. The assessment was undertaken, using the modelpopularised by Rosse and Panzar (1977) and Panzar and Rosse (1987); the P-R model. This method assesses the intensity of competition on the basis ofa reduced form equation that explains revenue in terms of factor input pricesand other explanatory variables. The three main objectives of this paper were:Firstly, to test for equilibrium within the Zimbabwean banking sector over thewhole period 2009 to 2014; Secondly, to assess competition for the whole periodunder consideration; and thirdly to estimate the degree of competition for eachyear to ascertain the evolution of competition during the study period. Thestudy employed a data set which consisted of a balanced panel of eighteenbanks which subsisted during the whole study period. Overall the results showthat the banking sector in Zimbabwe operates under monopolistic competition.These results are consistent with the findings of most previous studies usingthe same method. The results imply that banks are able to generate morerevenue because of the uniqueness of their features such as brands, image andadvertising.
The findings indicate that competition has evolved over the years in thebanking sector since the introduction of the multi-currency system in 2009.In 2009 when multi-currency was adopted, competition in the banking sectorwas low with an H-statistic of 0.46. The intensity of competition started toincrease in 2010 as banks adjusted to the new dispensation of multi-currency.Banks were able to operate and compete despite the lack of adequate foreigncurrency assets. The lack of the lender of last resort and active interbank marketthen meant domestic banks were to rely on foreign banks for liquidity support.This put foreign owned banks at an advantage hence restricting the amountof competition. After banks had adjusted to the multi-currency system, theywere able to attract lines of credit and new clients, which increased the levelof competition in the banking sector. Since 2011, the sector progresses towardsperfectly competitive conditions with the H-statistic moving towards one.
An important observation from the results is that controls limit the amountof competition. The results show that the introduction of banking controls
16
by the Government in 2013 reduced the amount of competition in the bank-ing sector. The Memorandum of Understanding which was announced by thegovernment in February 2013, introduced controls on a liberalised sector, whichweakened the functioning of demand and supply forces. The business conditionsincluding the interest rates on deposit and investment accounts; on overdrafts,loans and advances were altered. The MoU restricted the amount of competi-tion as these revenue streams were almost predefined by the authorities. Thisstudy therefore found that in a liberalised market, government controls distortthe pricing and affect the competitiveness of the sector. The government shouldtherefore desist from using controls.
Given the call by the Central Banks for banking institutions to adhere tothe new capital thresholds by the year 2020 and progressively show commitmenttowards the same, there is a need for the Government of Zimbabwe to introducea universal banking license. This will be in line with the new capital require-ments which will allow those banks meeting the US$100 million capitalisationto venture into all types of banking. Banking sector competition should alsoincrease as a result of it
There are a number of policy implications that can be drawn from the studyby the South African government. Measures meant to improve financial stabil-ity in the economy are likely to pose both positive and negative effects on thebanking sector hence a cost benefit analysis should be undertaken before imple-mentation. Economic stability nurtures an environment that improves financialintermediation hence is important for enhancing banking competition. Bankingcompetition is important for economic growth, improved efficiency and improvedaccess to finance. Tampering with competitive forces increases the cost of pro-viding financial services. The Government should avoid tempering with marketforces as this reduces banking sector competition.
References
[1] Abdul-Majid, M.Z. & Sufian, F. (2008). Market structure and competitionin emerging markets: Evidence from Malaysian Islamic Banking Industry,MPRA Paper No. 12126.
[2] Aktan, B. & Masood, O. (2010). The state of competition of the TurkishBanking Industry: an Application of the Panzar-Rosse Model. Journal ofBusiness Economics and Management, 11(1): 131145.
[3] Alesina, A. & Barro, J.J. (2001). Dollarization. The American EconomicReview, 91(2) 381-385.
[4] Al-Muharrami, S., Matthews, K. & Karbhari, Y. (2006), Market structureand competitive conditions in the Arab GCC banking system. Journal ofBanking & Finance, 30: 3487-3501.
17
[5] Ariss, R. (2009). Competition behaviour in Middle East and North Africabanking systems. The Quarterly Review of Economics and Finance, 49:693-710.
[6] Barth, J.R., Caprio, G. & Levine, R. (2004). Bank supervision and regula-tion: What works best? Journal of Financial Intermediation,13: 205-48.
[7] Bhetuwal, K.R. (2005). Assessing the effectiveness of financial sector re-forms in Nepal. Faculty of Arts. Vadodara: Maharaja Sayajirao Universityof Baroda,
[8] Bikker, J.A. & Groeneveld, J.M. (2000). Competition and concentration inthe EU banking industry. Kredit und Kapital, 33: 62-98.
[9] Bikker, J.A. & Haaf, K. (2000). Measures of Competition and Concentra-tion in the Banking Industry : A review of the literature. Research SeriesSupervision No. 27, DeNederlandsche Bank.
[10] Bikker, J.A. (2010). Measuring performance of banks: An assessment. Jour-nal of applied Business and Economics, 11(4): 141-159.
[11] Bikker, J.A., & Boss, J.W.B. (2005). Competition and efficiency in banking:International comparisons. Economic & Financial Modelling, pp.103-139.
[12] Bogetic, Z. (2000). Full dollarization: Fad or future? Challenge, 43(2):17-48.
[13] Buchs, T. & Mathisen, J. (2005). Competition and efficiency in banking:Behavioural evidence from Ghana. IMF Working Paper No. 05/17. Wash-ington: International Monetary Fund.
[14] Carbo, S., Humphrey, D., Maudos, J. &Molyneux, P. (2009). Cross-countrycomparisons of competition and pricing power in European banking. Jour-nal of International Money and Finance, 28: 115-134.
[15] Casu, B. & Molyneux, P. (2003). A comparative study of efficiency in Eu-ropean banking. Applied Economics, Taylor & Francis Journals, 35(17):1865-1876.
[16] Chipika, J.T. & Malaba, J. (2011). Indigenization and economic empower-ment study. Harare: Business Council of Zimbabwe,
[17] Chirwa, E.W. (2003). Determinants of commercial banks’ profitability inMalawi: A co-integration approach. Applied Financial Economics, 13: 565—571.
[18] Claessens, S. & Klingebiel, D. (2001). Competition and scope of activitiesin financial services. The World Bank Research Observer, 16(1): 19-40.
18
[19] Claessens, S. & Laeven, L. (2004). What drives bank competition? Someinternational evidence? Journal of Money, Credit and Banking, 36: 562-583.
[20] Claessens, S. (2009) Competition in the financial sector: Overview of com-petition policies. IMF Working Paper. No. 09/45.
[21] Cooray, A. (2003). Financial reform: Evidence from Sri Lanka. Proceedingsof the Fifth Conference on Money and Finance, IGIDR. Mumbai, India.
[22] De Bandt, O. & Philip Davis, E. (2000). Competition, contestability andmarket structure in European banking sectors on the eve of EMU. Journalof Banking and Finance 24: 1045-1066.
[23] Delis, M. (2012). Bank competition, financial reform and institution. Theimportance of being developed economies. 97(2): 450-65.
[24] Demirgüç-Kunt, A., Laeven, L. & Levine, R. (2004). Regulations, marketstructure, institutions, and the cost of financial intermediation. Journal ofMoney, Credit and Banking, 36(2): 593-622.
[25] Fu, X.M. & Heffernan, S. (2009). The effects of reform on China’s bankstructure and performance. Journal of Banking & Finance 33: 39—52.
[26] Gelos, G., & Roldós, J. (2004). Consolidation and market structure inemerging market banking systems. Emerging Markets Review, 5(1): 39-59.
[27] Hakam, A., Fatine, F.A. & Zakaria, F. (2012). Determinants of bankingcompetition in Morocco and evaluation of the structural reforms. SSRN.
[28] Hauner, D. & Peiris, S.J. (2005). Bank efficiency and competition in low-income countries: The case of Uganda. IMF Working Paper, No. 05/240.Washington: International Monetary Fund.
[29] Jimenez, et al. (2007). In Stress-testing the banking system: Methodologiesand applications. Cambridge Press.
[30] Korsah, K., Nyarko, E.K. & Tagoe, N.A. (2001). Impact of financial sec-tor liberalization on competition and efficiency in the Ghanaian bankingindustry. International Labor Organisation Research paper, 01-2, 1-51.
[31] Koskela,E. & Stenbecka, R.(2000). Bank mergers and the fragility of loanmarkets. Finnish Economic Papers, 13(1): Spring 2000.
[32] Liu, J.S. et al. (2010). Data envelopment analysis 1978—2010: A citation-based literature survey. Elsevier.
[33] Matutes, C., Vives, X. (2000). Imperfect competition, risk taking and com-petition in banking. European Economic Review, 44: 1-34.
19
[34] Moyo, J., Nandwa, B., Oduor, J. & Simpasa, A. (2014). Financial sectorreforms, Competition and banking system stability in Sub-Saharan Africa.Paper presented at the joint RES-SPR Conference on “MacroeconomicChallenges Facing Low-Income Countries”. IMF-Washington D.C.
[35] Nathan, A. & Neave, E.H. (1987). Competition and contestability inCanada’s financial system: Empirical results. Canadian Journal of Eco-nomics, 22: 576-94.
[36] Noland, M. (1996). Restructuring Korea’s financial sector for greater com-petitiveness.Working Paper Series, No. 96-14. Peterson Institute for Inter-national Economics.
[37] Panzar, J.C. & Rosse, J.N. (1977). Chamberlin versus Robinson: An empir-ical test for monopoly rents. Bell Laboratories Economic Discussion Paper,No. 92.
[38] Panzar, J.C. & Rosse, J.N. (1987). Testing for "Monopoly" equilibrium.The Journal of Industrial Economics, 35(4): 443-456.
[39] Poshakwale, S & Qian, B. (2009). Banking sector and economic growth inEgypt. African Development Review. 21(3): 435-453.
[40] Quispe-Agnoli, M. &Whisler, E. (2006). Official dollarization and the bank-ing system in Ecuador and El Salvador. Economic Review Third Quarter,Federal Reserve Bank of Atlanta.
[41] Ramon, C. & Matutes, C. 2002. Market power and bank failures. Interna-tional Journal of Industrial Organisation, 20(9): 1341-1361.
[42] Weill, L. (2003). Banking efficiency in transition economies: The role offoreign ownership. Economics of Transition, 11: 569-592.
[43] Wong, J. (2006). Market structure, competition and intermediation inbanking industry. Working paper. Germany: University of Frankfurt.
[44] Yeyati, E.L. 2003. Financial dedollarization: A carrot and stick approach.Business School Working Papers Nueve, Universidad Torcuato Di Tella.
[45] Yildrimi, S. & Philippatos, G. (2002). Efficiency of banks: Recent evidencefrom the transition economics of Europe, 1993-2000. Knoxville: Universityof Tennessee. Mimeo.
20
Tables and Figures
Table 1: Number of operating banks in Zimbabwe
Type of Institution December 2008 July 2012 July 2014
Commercial Banks 15 18 15
Merchant Banks 6 2 1
Discount Houses 3 0 0
Finance Houses 0 0 0
Savings Bank (POSB) 1 1 1
Building societies 4 4 3
Total 28 25 20
Source: Reserve Bank of Zimbabwe 2009, 2012, 2014
Table 2: Zimbabwe’s key financial indicators (2004-12)
04 05 06 07 08 09 10 11 12
Market share of top four banks
0.54 0.53 0.44 0.43 0.97 0.56 0.48 0.43 0.45
Regulatory capital to risk weighted assets
0.35 0.29 0.34 0.33 0.33 0.27 0.18 0.14 0.13
NPL to total gross loans
0.23 0.09 0.04 0.01 0.05 0.02 0.04 0.08 0.13
Return on assets 0.12 0.14 0.19 0.13 0.25 0.01 0.02 0.02 0.02
Return on equity 0.63 0.63 0.60 0.33 0.28 0.03 0.07 0.15 0.09
Interest margin/gross income
0.12 0.21 0.14 0.45 0.22 0.14 0.24 0.35 0.35
Non-interest expenses /gross income
0.28 0.25 0.18 0.24 0.02 0.86 0.70 0.65 0.66
Interest rate spread 0.29 0.27 0.45 0.21 0.31 0.03 0.06 0.09 0.09
Source: IMF Article IV
21
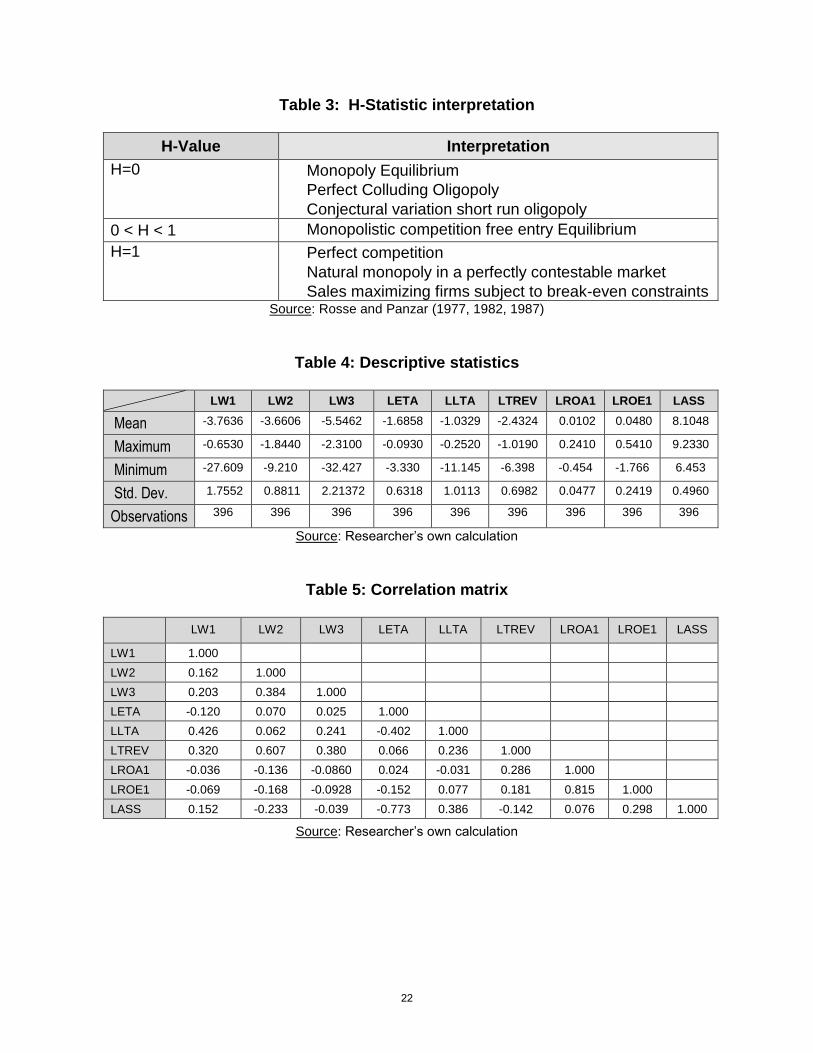
Table 3: H-Statistic interpretation
H-Value Interpretation
H=0 Monopoly Equilibrium
Perfect Colluding Oligopoly
Conjectural variation short run oligopoly
0 < H < 1 Monopolistic competition free entry Equilibrium
H=1
Perfect competition
Natural monopoly in a perfectly contestable market
Sales maximizing firms subject to break-even constraints Source: Rosse and Panzar (1977, 1982, 1987)
Table 4: Descriptive statistics
LW1 LW2 LW3 LETA LLTA LTREV LROA1 LROE1 LASS
Mean -3.7636 -3.6606 -5.5462 -1.6858 -1.0329 -2.4324 0.0102 0.0480 8.1048
Maximum -0.6530 -1.8440 -2.3100 -0.0930 -0.2520 -1.0190 0.2410 0.5410 9.2330
Minimum -27.609 -9.210 -32.427 -3.330 -11.145 -6.398 -0.454 -1.766 6.453
Std. Dev. 1.7552 0.8811 2.21372 0.6318 1.0113 0.6982 0.0477 0.2419 0.4960
Observations 396 396 396 396 396 396 396 396 396
Source: Researcher’s own calculation
Table 5: Correlation matrix
LW1 LW2 LW3 LETA LLTA LTREV LROA1 LROE1 LASS
LW1 1.000
LW2 0.162 1.000
LW3 0.203 0.384 1.000
LETA -0.120 0.070 0.025 1.000
LLTA 0.426 0.062 0.241 -0.402 1.000
LTREV 0.320 0.607 0.380 0.066 0.236 1.000
LROA1 -0.036 -0.136 -0.0860 0.024 -0.031 0.286 1.000
LROE1 -0.069 -0.168 -0.0928 -0.152 0.077 0.181 0.815 1.000
LASS 0.152 -0.233 -0.039 -0.773 0.386 -0.142 0.076 0.298 1.000
Source: Researcher’s own calculation
22

Table 6: Test for equilibrium
Panel least squares with fixed effects GMM
Dependent Variable: ln (ROA+1) Dependent variable: ln (ROA+1)
Variable Coef. t-statistic Prob Coef. t-statistic Prob C 0.044593 0.571779 0.5678 0.260148 1.958800 0.0509
LW1 0.000661 0.426815 0.6698 -0.005308 -0.200110 0.8415
LW2 -0.004748 -1.476446 0.1407 -0.045484 -1.762276 0.0789
LW3 0.000171 0.138552 0.8899 0.006132 0.833846 0.4049
LETA -0.009723 -1.308228 0.1916 -0.011478 -0.750835 0.4533
LLTA 0.001128 0.391924 0.6953 0.011826 0.465447 0.6419
LASS -0.007838 -0.784338 0.4333 -0.050300 -2.034538 0.0426
E= 0.000661+-0.004748+0.000171=-0.003916 =0 Chi-square 1.746421 (0.1863)
E=-0.005308+-0.045484+0.006132=-0.044660 Chi-square 0.9962 (0.3182
Source: Researcher’s own calculation
Table 7: Hausman specification test
Correlated Random Effects - Hausman Test
Equation: Untitled
Test cross-section random effects
Test Summary Chi-Sq. Statistic
Chi-Sq. d.f. Prob.
Cross-section random 7.080653 6 0.3135
Source: Researcher’s own calculation
Table 8: H-Statistic test results: Testing competition
Dependent variable: LTREV Fixed effect Random effects GMM
Variable Coef. t-stat p-value Coef t-stat p-value Coef. t- stat p-value
C 0.8739 0.9539 0.3407 0.8112 1.0744 0.2832 0.2448 0.3933 0.6943
LW1 0.0510 2.8021 0.0053 0.0586 3.4119 0.0007 0.0653 3.8911 0.0001
LW2 0.4739 12.5440 0.0000 0.4450 12.4900 0.0000 0.4070 11.9549 0.0000
LW3 0.0365 2.5173 0.0122 0.0380 2.7721 0.0058 0.0342 2.5750 0.0104
LETA -0.1540 -1.7647 0.0784 -0.0444 -0.5766 0.5645 0.0847 1.2494 0.2123
LLTA 0.0871 2.5747 0.0104 0.0972 3.0282 0.0026 0.1078 3.3722 0.0008
LASS -0.1661 -1.4157 0.1577 -0.1428 -1.4109 0.1591 -0.0614 -0.6950 0.4875
R-squared =0.538412 Adjusted R-squared = 0.509873 F-statistic= 18.86579 (00000) H=0.051005+0.473863+0.036543=0.561411
R-squared = 0.456419 Adjusted R-squared = 0.448035 F-statistic= 54.43744 (00000) H=0.058574+0.444987+0.038 36=0.541597
H=0.065287+0.406992+0.034202=0.506481
Source: Researcher’s own calculation
23
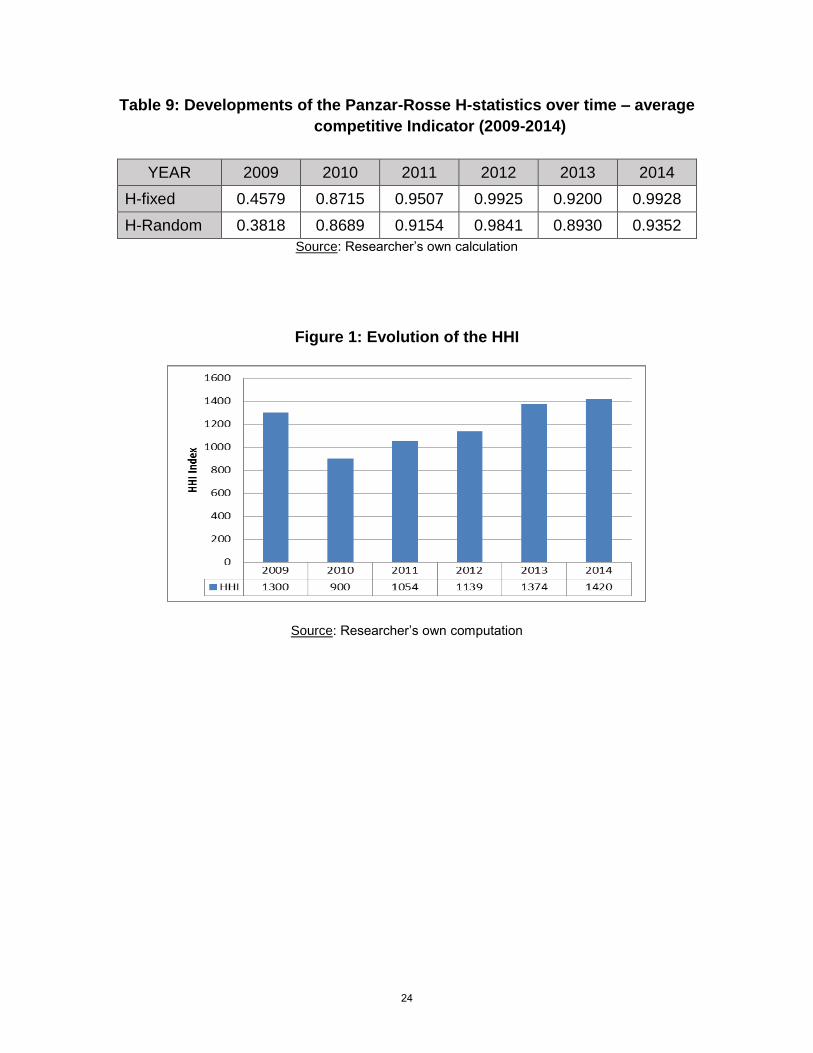
Table 9: Developments of the Panzar-Rosse H-statistics over time – average
competitive Indicator (2009-2014)
YEAR 2009 2010 2011 2012 2013 2014
H-fixed 0.4579 0.8715 0.9507 0.9925 0.9200 0.9928
H-Random 0.3818 0.8689 0.9154 0.9841 0.8930 0.9352
Source: Researcher’s own calculation
Figure 1: Evolution of the HHI
Source: Researcher’s own computation
24