assessing and safeguarding liquidity - seb...
TRANSCRIPT
Assessing and safeguarding liquidity – Key factors in liquidity optimization

6880 77 85
65
70 6769
0
20
40
60
80
100
120
140
160
180
2009 2010 2011 2012
Tota
l siz
e of
unu
tilis
ed fa
cilit
ies
and
cash
Total Cash & Cash Equivalant Total Unutilised facilities
Total size of Liquidity for Nordic listed firms EUR bn
+ 16% Liquidity
+ 7%
+ 24%
Level of liquidity has increased post-crises Core liquidity strategy more essential than ever before
51%
49%
53%
47%
54%
46% 45%
Source: SEB Research
55%
2
Research shows that companies’ current liquidity strategy is a source of excess cost and inefficiencies. Failure to address this issue and coordinate across departments could potentially lead to excess cost and missed opportunities
3
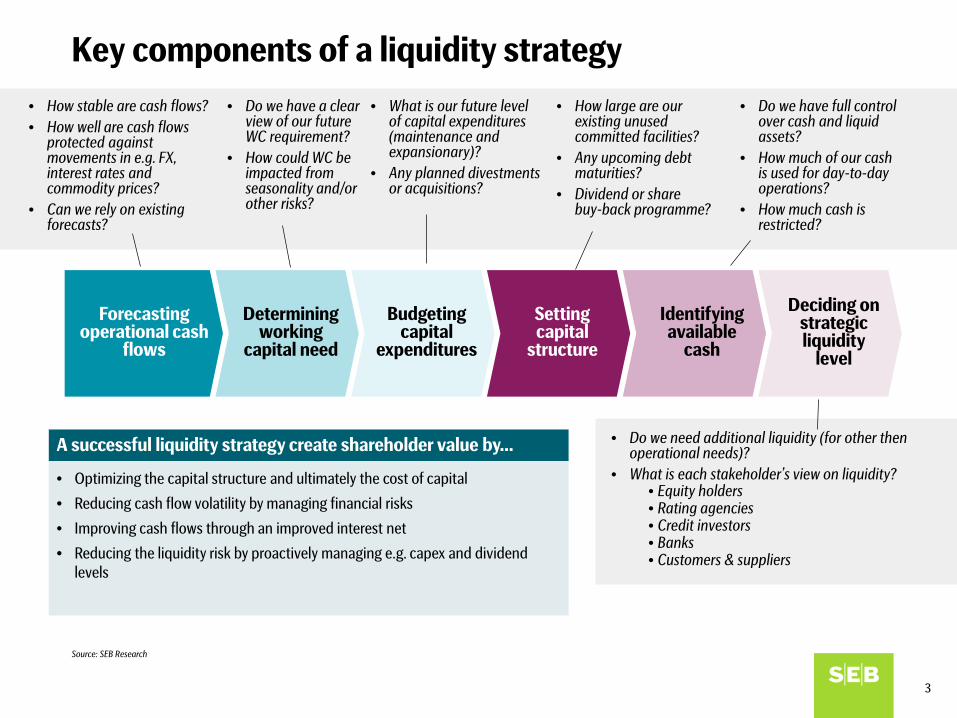
• What is our future level of capital expenditures (maintenance and expansionary)?
• Any planned divestments or acquisitions?
Forecasting operational cash
flows
Determining working
capital need
Budgeting capital
expenditures
Setting capital
structure
Identifying available
cash
Deciding on strategic liquidity
level
• How stable are cash flows? • How well are cash flows
protected against movements in e.g. FX, interest rates and commodity prices?
• Can we rely on existing forecasts?
• Do we have a clear view of our future WC requirement?
• How could WC be impacted from seasonality and/or other risks?
• Do we have full control over cash and liquid assets?
• How much of our cash is used for day-to-day operations?
• How much cash is restricted?
• Do we need additional liquidity (for other then operational needs)?
• What is each stakeholder’s view on liquidity? • Equity holders • Rating agencies • Credit investors • Banks • Customers & suppliers
• How large are our existing unused committed facilities?
• Any upcoming debt maturities?
• Dividend or share buy-back programme?
Key components of a liquidity strategy
• Optimizing the capital structure and ultimately the cost of capital
• Reducing cash flow volatility by managing financial risks
• Improving cash flows through an improved interest net
• Reducing the liquidity risk by proactively managing e.g. capex and dividend levels
A successful liquidity strategy create shareholder value by…
Source: SEB Research
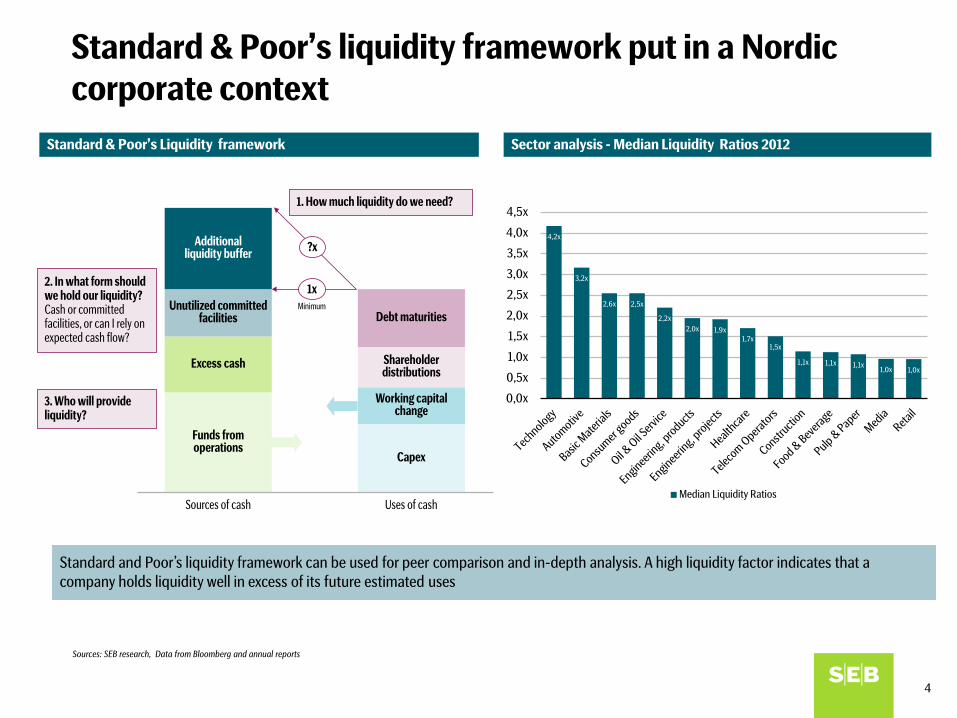
Standard & Poor’s liquidity framework put in a Nordic corporate context
4
Sources: SEB research, Data from Bloomberg and annual reports
Funds from operations
Excess cash
Unutilized committed facilities
Capex
Working capital change
Shareholder distributions
Debt maturities
1xMinimum
?x
3. Who will provide liquidity?
2. In what form should we hold our liquidity?Cash or committed facilities, or can I rely on expected cash flow?
1. How much liquidity do we need?
Sources of cash Uses of cash
Additional liquidity buffer
Standard & Poor’s Liquidity framework Sector analysis - Median Liquidity Ratios 2012
Standard and Poor’s liquidity framework can be used for peer comparison and in-depth analysis. A high liquidity factor indicates that a company holds liquidity well in excess of its future estimated uses
4,2x
3,2x
2,6x 2,5x
2,2x2,0x 1,9x
1,7x1,5x
1,1x 1,1x 1,1x1,0x 1,0x
0,0x
0,5x
1,0x
1,5x
2,0x
2,5x
3,0x
3,5x
4,0x
4,5x
Median Liquidity Ratios
Factor Correlation Overview
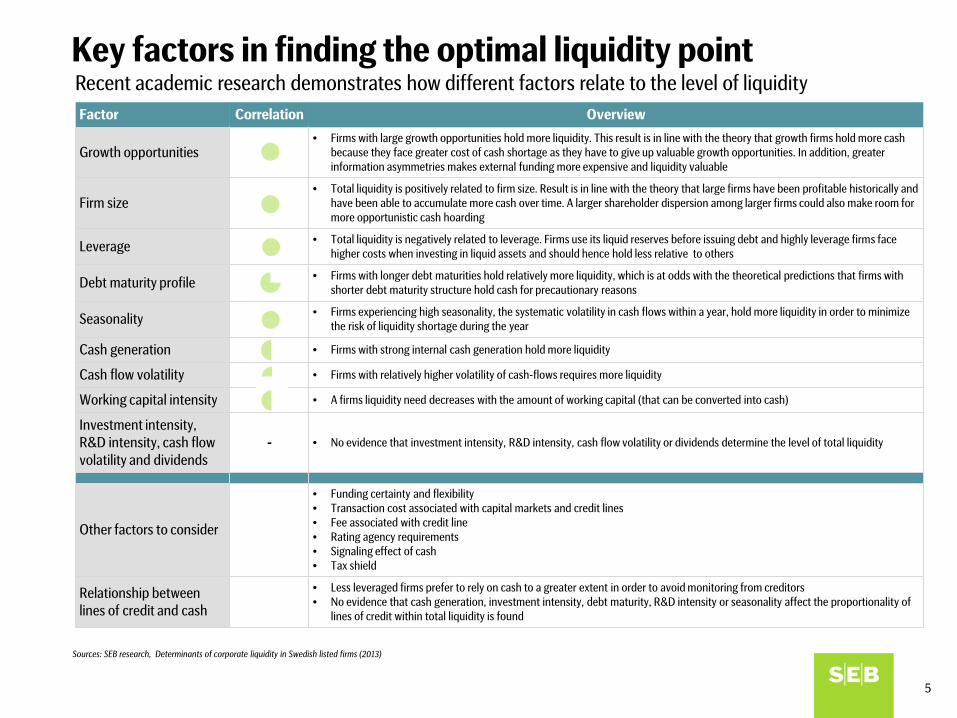
Growth opportunities • Firms with large growth opportunities hold more liquidity. This result is in line with the theory that growth firms hold more cash
because they face greater cost of cash shortage as they have to give up valuable growth opportunities. In addition, greater information asymmetries makes external funding more expensive and liquidity valuable
Firm size • Total liquidity is positively related to firm size. Result is in line with the theory that large firms have been profitable historically and
have been able to accumulate more cash over time. A larger shareholder dispersion among larger firms could also make room for more opportunistic cash hoarding
Leverage • Total liquidity is negatively related to leverage. Firms use its liquid reserves before issuing debt and highly leverage firms face higher costs when investing in liquid assets and should hence hold less relative to others
Debt maturity profile • Firms with longer debt maturities hold relatively more liquidity, which is at odds with the theoretical predictions that firms with shorter debt maturity structure hold cash for precautionary reasons
Seasonality • Firms experiencing high seasonality, the systematic volatility in cash flows within a year, hold more liquidity in order to minimize the risk of liquidity shortage during the year
Cash generation • Firms with strong internal cash generation hold more liquidity
Cash flow volatility • Firms with relatively higher volatility of cash-flows requires more liquidity
Working capital intensity • A firms liquidity need decreases with the amount of working capital (that can be converted into cash)
Investment intensity, R&D intensity, cash flow volatility and dividends
- • No evidence that investment intensity, R&D intensity, cash flow volatility or dividends determine the level of total liquidity
Other factors to consider
• Funding certainty and flexibility • Transaction cost associated with capital markets and credit lines • Fee associated with credit line • Rating agency requirements • Signaling effect of cash • Tax shield
Relationship between lines of credit and cash
• Less leveraged firms prefer to rely on cash to a greater extent in order to avoid monitoring from creditors • No evidence that cash generation, investment intensity, debt maturity, R&D intensity or seasonality affect the proportionality of
lines of credit within total liquidity is found
5
Key factors in finding the optimal liquidity point Recent academic research demonstrates how different factors relate to the level of liquidity
Sources: SEB research, Determinants of corporate liquidity in Swedish listed firms (2013)
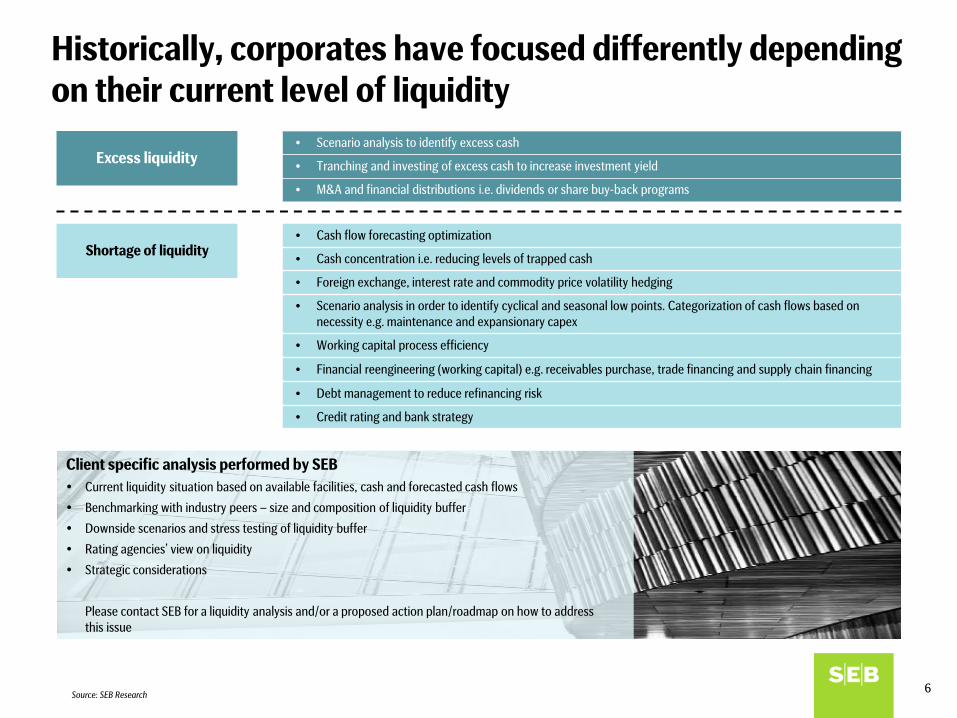
Historically, corporates have focused differently depending on their current level of liquidity
• Scenario analysis to identify excess cash
• Tranching and investing of excess cash to increase investment yield
• M&A and financial distributions i.e. dividends or share buy-back programs
• Cash flow forecasting optimization
• Cash concentration i.e. reducing levels of trapped cash
• Foreign exchange, interest rate and commodity price volatility hedging
• Scenario analysis in order to identify cyclical and seasonal low points. Categorization of cash flows based on necessity e.g. maintenance and expansionary capex
• Working capital process efficiency
• Financial reengineering (working capital) e.g. receivables purchase, trade financing and supply chain financing
• Debt management to reduce refinancing risk
• Credit rating and bank strategy
Excess liquidity
Shortage of liquidity
Source: SEB Research 6
Client specific analysis performed by SEB Current liquidity situation based on available facilities, cash and forecasted cash flows
Benchmarking with industry peers – size and composition of liquidity buffer
Downside scenarios and stress testing of liquidity buffer
Rating agencies’ view on liquidity
Strategic considerations
Please contact SEB for a liquidity analysis and/or a proposed action plan/roadmap on how to address this issue

7
Appendix – Sector By Sector Liquidity Ratios
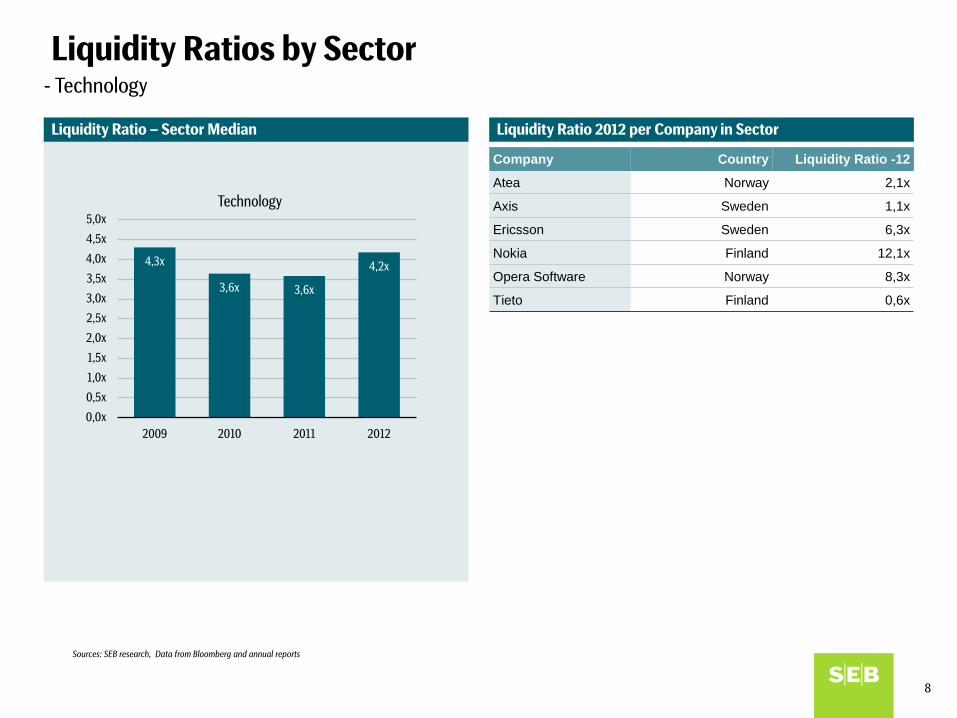
Liquidity Ratios by Sector
Liquidity Ratio 2012 per Company in Sector Liquidity Ratio – Sector Median
- Technology
4,3x
3,6x 3,6x
4,2x
0,0x
0,5x
1,0x
1,5x
2,0x
2,5x
3,0x
3,5x
4,0x
4,5x
5,0x
2009 2010 2011 2012
Technology
Content Company Country Liquidity Ratio -12
Atea Norway 2,1x
Axis Sweden 1,1x
Ericsson Sweden 6,3x
Nokia Finland 12,1x
Opera Software Norway 8,3x
Tieto Finland 0,6x
8
Sources: SEB research, Data from Bloomberg and annual reports
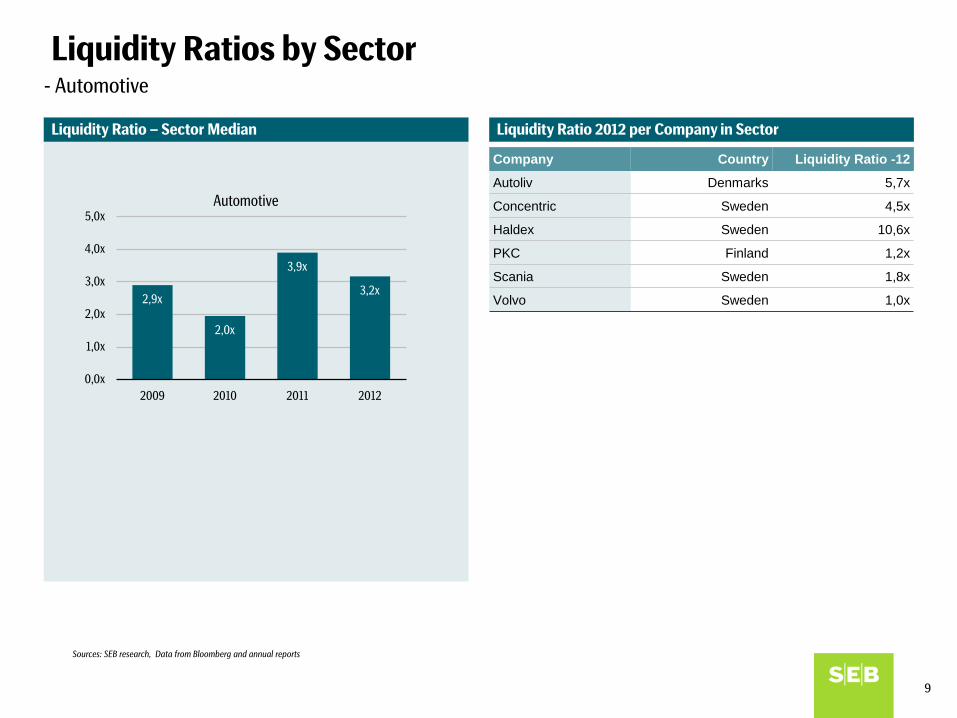
Liquidity Ratios by Sector
Liquidity Ratio 2012 per Company in Sector Liquidity Ratio – Sector Median
- Automotive
2,9x
2,0x
3,9x
3,2x
0,0x
1,0x
2,0x
3,0x
4,0x
5,0x
2009 2010 2011 2012
Automotive
Content Company Country Liquidity Ratio -12
Autoliv Denmarks 5,7x
Concentric Sweden 4,5x
Haldex Sweden 10,6x
PKC Finland 1,2x
Scania Sweden 1,8x
Volvo Sweden 1,0x
9
Sources: SEB research, Data from Bloomberg and annual reports

Liquidity Ratios by Sector
Liquidity Ratio 2012 per Company in Sector Liquidity Ratio – Sector Median
- Basic Materials
1,9x2,0x
2,4x2,6x
0,0x
0,5x
1,0x
1,5x
2,0x
2,5x
3,0x
2009 2010 2011 2012
Basic Materials
Content Company Country Liquidity Ratio -12
Höganäs Sweden 3,6x
Kemira Finland 0,8x
Norsk Hydro Norway 1,9x
Outokumpu Finland 1,2x
Rautaruukki Finland 1,3x
Rockwool Denmark 4,4x
SSAB Sweden 7,8x
Yara Norway 3,2x
10
Sources: SEB research, Data from Bloomberg and annual reports

Liquidity Ratios by Sector
2012’s Liquidity Ratio per Company in Sector Liquidity Ratio – Sector Median
- Consumer Goods
2,9x
2,2x2,0x
2,5x
0,0x
0,5x
1,0x
1,5x
2,0x
2,5x
3,0x
3,5x
2009 2010 2011 2012
Consumer Goods
Content Company Country Liquidity Ratio -12
Amer Sports Finland 1,1x
Bang & Olufsen Denmark 0,7x
Björn Borg Sweden 3,5x
Duni Sweden 4,3x
Ekornes Norway 2,0x
Electrolux Sweden 2,6x
Huhtamaki Finland 1,2x
Husqvarna Sweden 2,8x
New Wave Sweden 5,9x
Nobia Sweden 1,0x
Nokian Renkaat Finland 2,4x
Oriflame Sweden 4,5x
Pandora Denmark 3,9x
Tikkurila Finland 1,8x
11
Sources: SEB research, Data from Bloomberg and annual reports
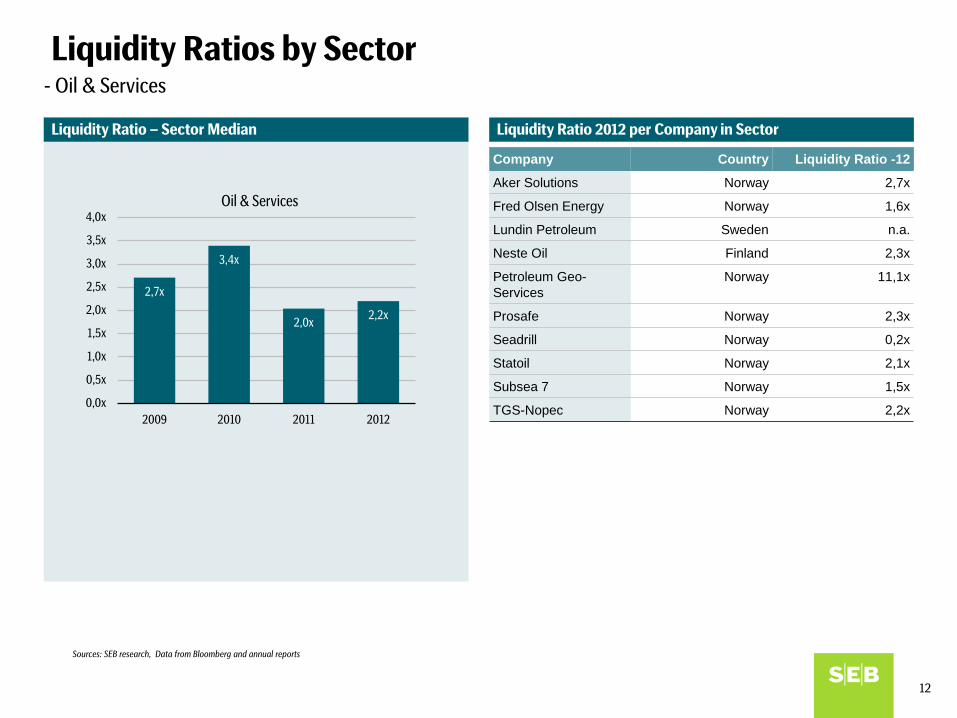
Liquidity Ratios by Sector
Liquidity Ratio 2012 per Company in Sector Liquidity Ratio – Sector Median
- Oil & Services
2,7x
3,4x
2,0x 2,2x
0,0x
0,5x
1,0x
1,5x
2,0x
2,5x
3,0x
3,5x
4,0x
2009 2010 2011 2012
Oil & Services
Content Company Country Liquidity Ratio -12
Aker Solutions Norway 2,7x
Fred Olsen Energy Norway 1,6x
Lundin Petroleum Sweden n.a.
Neste Oil Finland 2,3x
Petroleum Geo-Services
Norway 11,1x
Prosafe Norway 2,3x
Seadrill Norway 0,2x
Statoil Norway 2,1x
Subsea 7 Norway 1,5x
TGS-Nopec Norway 2,2x
12
Sources: SEB research, Data from Bloomberg and annual reports
Liquidity Ratios by Sector
Liquidity Ratio 2012 per Company in Sector Liquidity Ratio – Sector Median
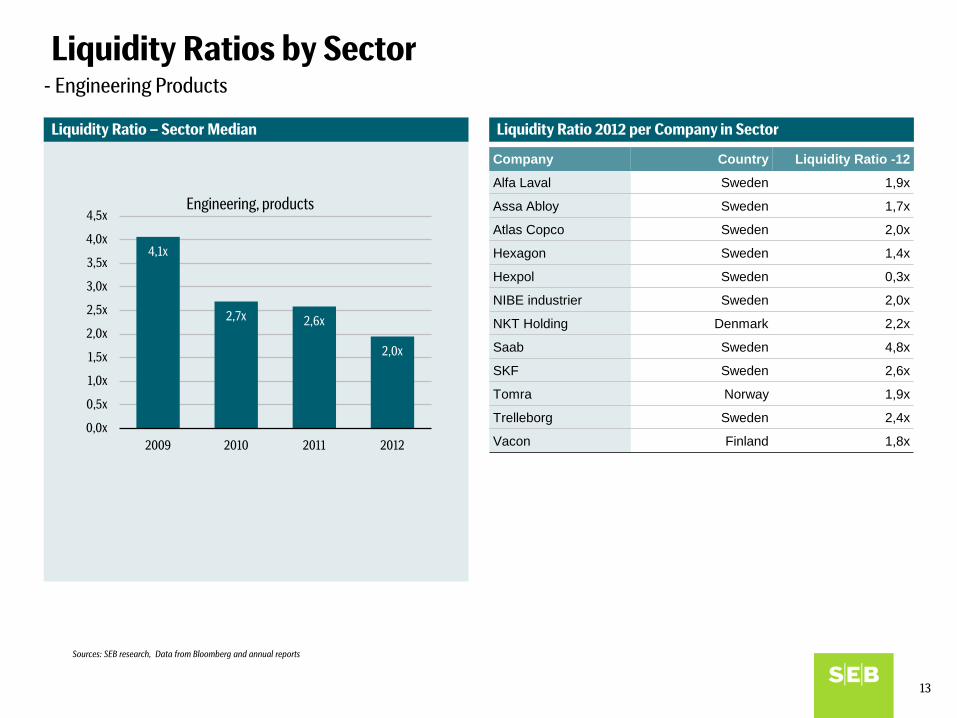
- Engineering Products
4,1x
2,7x 2,6x
2,0x
0,0x
0,5x
1,0x
1,5x
2,0x
2,5x
3,0x
3,5x
4,0x
4,5x
2009 2010 2011 2012
Engineering, products
Content Company Country Liquidity Ratio -12
Alfa Laval Sweden 1,9x
Assa Abloy Sweden 1,7x
Atlas Copco Sweden 2,0x
Hexagon Sweden 1,4x
Hexpol Sweden 0,3x
NIBE industrier Sweden 2,0x
NKT Holding Denmark 2,2x
Saab Sweden 4,8x
SKF Sweden 2,6x
Tomra Norway 1,9x
Trelleborg Sweden 2,4x
Vacon Finland 1,8x
13
Sources: SEB research, Data from Bloomberg and annual reports
Liquidity Ratios by Sector
Liquidity Ratio 2012 per Company in Sector Liquidity Ratio – Sector Median
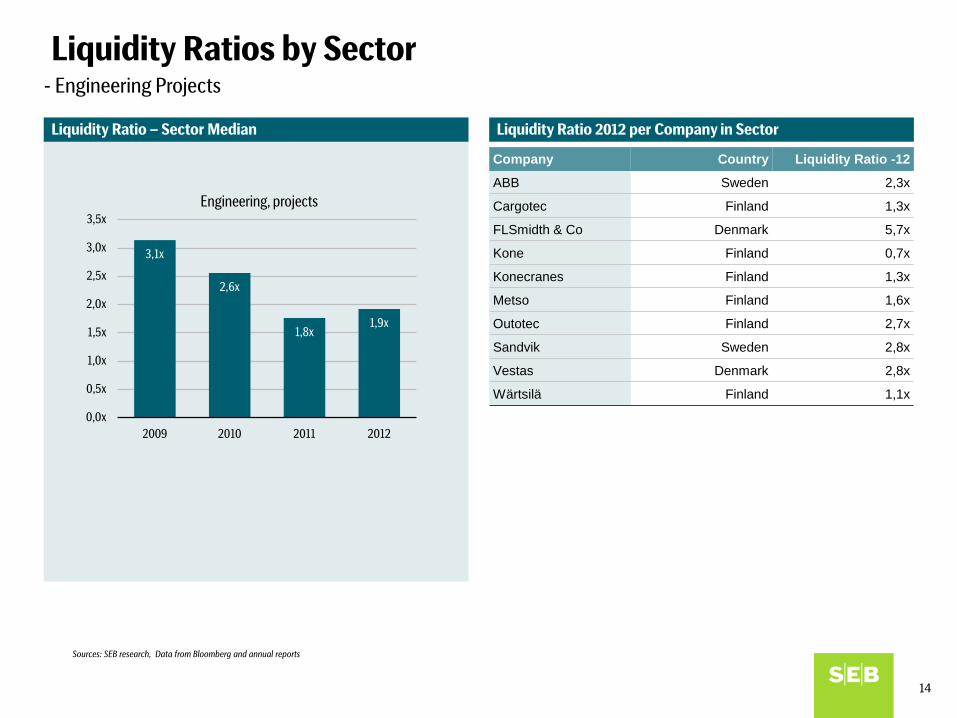
- Engineering Projects
3,1x
2,6x
1,8x1,9x
0,0x
0,5x
1,0x
1,5x
2,0x
2,5x
3,0x
3,5x
2009 2010 2011 2012
Engineering, projects
Content Company Country Liquidity Ratio -12
ABB Sweden 2,3x
Cargotec Finland 1,3x
FLSmidth & Co Denmark 5,7x
Kone Finland 0,7x
Konecranes Finland 1,3x
Metso Finland 1,6x
Outotec Finland 2,7x
Sandvik Sweden 2,8x
Vestas Denmark 2,8x
Wärtsilä Finland 1,1x
14
Sources: SEB research, Data from Bloomberg and annual reports
Liquidity Ratios by Sector
Liquidity Ratio 2012 per Company in Sector Liquidity Ratio – Sector Median
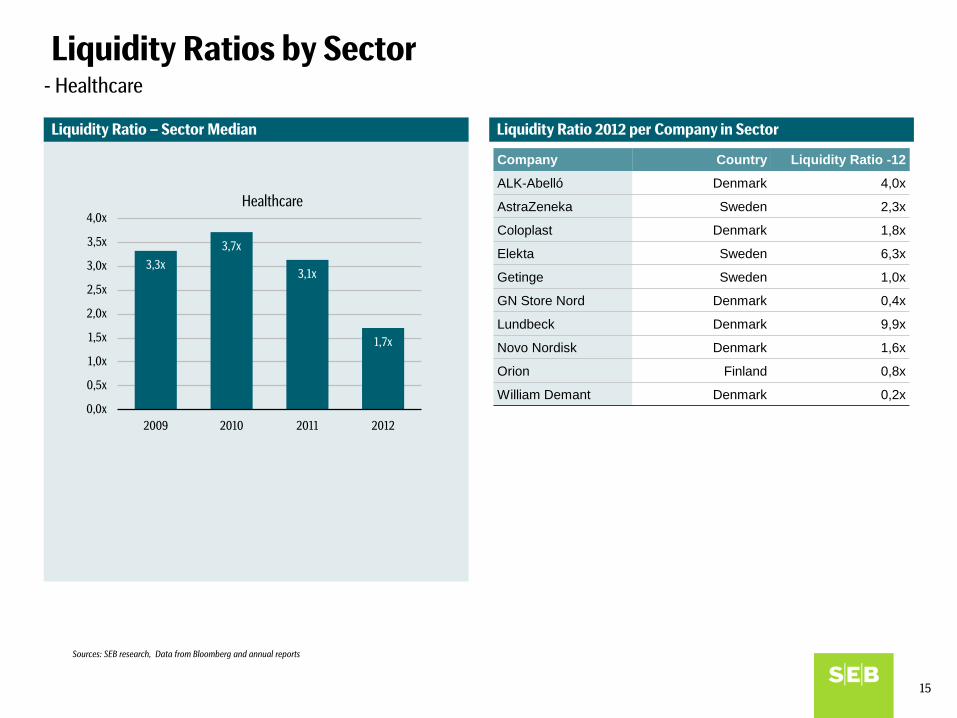
- Healthcare
3,3x3,7x
3,1x
1,7x
0,0x
0,5x
1,0x
1,5x
2,0x
2,5x
3,0x
3,5x
4,0x
2009 2010 2011 2012
Healthcare
Content Company Country Liquidity Ratio -12
ALK-Abelló Denmark 4,0x
AstraZeneka Sweden 2,3x
Coloplast Denmark 1,8x
Elekta Sweden 6,3x
Getinge Sweden 1,0x
GN Store Nord Denmark 0,4x
Lundbeck Denmark 9,9x
Novo Nordisk Denmark 1,6x
Orion Finland 0,8x
William Demant Denmark 0,2x
15
Sources: SEB research, Data from Bloomberg and annual reports

Liquidity Ratios by Sector
Liquidity Ratio 2012 per Company in Sector Liquidity Ratio – Sector Median
- Telecom Operators
2,0x 2,0x
1,4x1,5x
0,0x
0,5x
1,0x
1,5x
2,0x
2,5x
2009 2010 2011 2012
Telecom Operators
Content Company Country Liquidity Ratio -12
Elisa Finland 0,5x
Millicom Sweden 1,1x
TDC Denmark 1,7x
Tele2 Sweden 1,8x
Telenor Norway 1,3x
TeliaSonera Sweden 1,7x
16
Sources: SEB research, Data from Bloomberg and annual reports

Liquidity Ratios by Sector
Liquidity Ratio 2012 per Company in Sector Liquidity Ratio – Sector Median
2,0x
1,3x1,0x
1,1x
0,0x
0,5x
1,0x
1,5x
2,0x
2,5x
2009 2010 2011 2012
Construction
- Construction
Content Company Country Liquidity Ratio -12
BWG Homes Norway 0,5x
Cramo Finland 1,0x
JM Sweden 4,0x
NCC Sweden 1,1x
Peab Sweden 1,7x
Ramirent Finland 1,4x
Skanska Sweden 1,0x
Veidekke Norway 1,2x
YIT Finland 0,9x
17
Sources: SEB research, Data from Bloomberg and annual reports

Liquidity Ratios by Sector
Liquidity Ratio 2012 per Company in Sector Liquidity Ratio – Sector Median
- Food & Beverage
2,7x
1,7x
2,2x
1,1x
0,0x
0,5x
1,0x
1,5x
2,0x
2,5x
3,0x
2009 2010 2011 2012
Food & Beverage
Content Company Country Liquidity Ratio -12
Carlsberg Denmark 4,5x
Chr. Hansen Denmark 0,5x
Novozymes Denmark 2,9x
Orkla Norway 3,5x
Raisio Finland 0,2x
Rieber & Søn Norway -0,2x
Royal Unibrew Denmark 0,8x
Swedish Match Sweden 1,4x
18
Sources: SEB research, Data from Bloomberg and annual reports
Liquidity Ratios by Sector
Liquidity Ratio 2012 per Company in Sector Liquidity Ratio – Sector Median
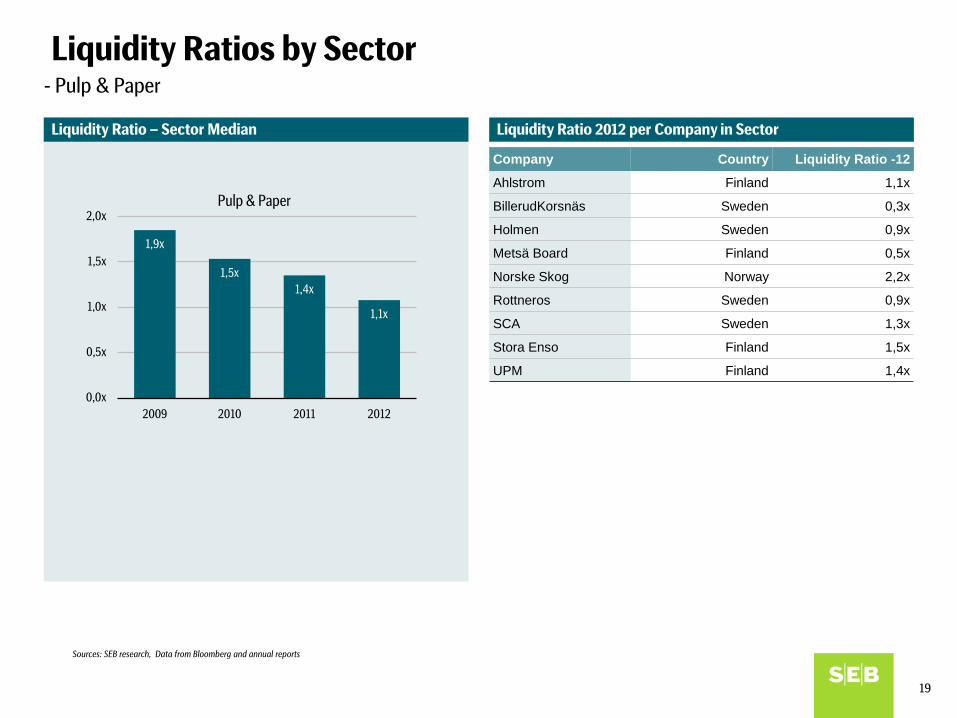
- Pulp & Paper
1,9x
1,5x1,4x
1,1x
0,0x
0,5x
1,0x
1,5x
2,0x
2009 2010 2011 2012
Pulp & Paper
Content Company Country Liquidity Ratio -12
Ahlstrom Finland 1,1x
BillerudKorsnäs Sweden 0,3x
Holmen Sweden 0,9x
Metsä Board Finland 0,5x
Norske Skog Norway 2,2x
Rottneros Sweden 0,9x
SCA Sweden 1,3x
Stora Enso Finland 1,5x
UPM Finland 1,4x
19
Sources: SEB research, Data from Bloomberg and annual reports
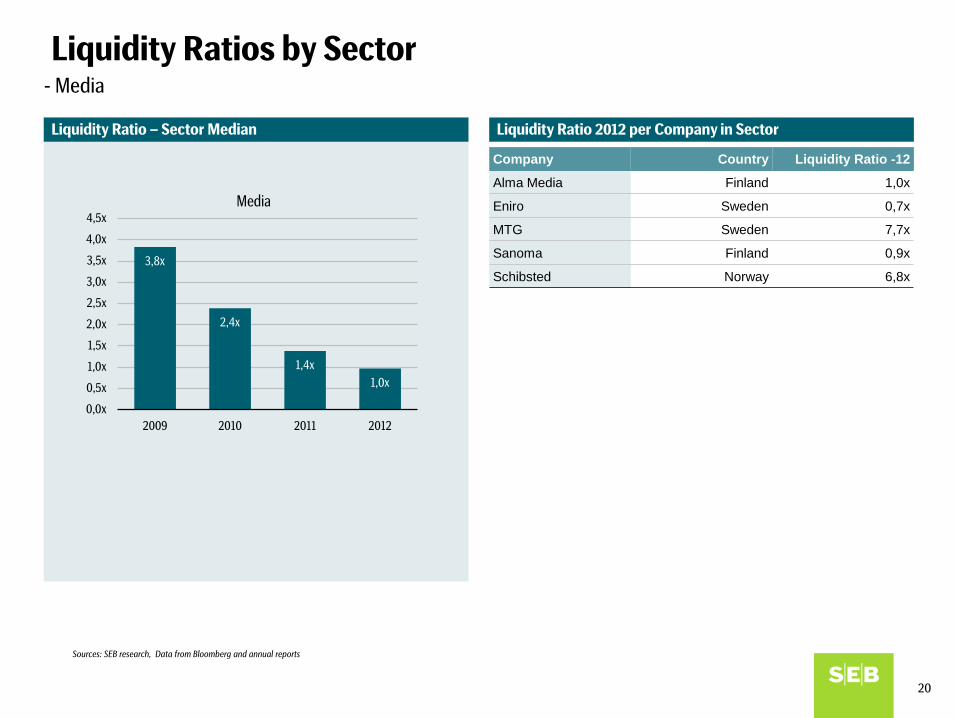
Liquidity Ratios by Sector
Liquidity Ratio 2012 per Company in Sector Liquidity Ratio – Sector Median
- Media
3,8x
2,4x
1,4x1,0x
0,0x
0,5x
1,0x
1,5x
2,0x
2,5x
3,0x
3,5x
4,0x
4,5x
2009 2010 2011 2012
Media
Content Company Country Liquidity Ratio -12
Alma Media Finland 1,0x
Eniro Sweden 0,7x
MTG Sweden 7,7x
Sanoma Finland 0,9x
Schibsted Norway 6,8x
20
Sources: SEB research, Data from Bloomberg and annual reports

Liquidity Ratios by Sector
Liquidity Ratio 2012 per Company in Sector Liquidity Ratio – Sector Median
- Retail
1,6x
1,1x
1,3x
1,0x
0,0x
0,2x
0,4x
0,6x
0,8x
1,0x
1,2x
1,4x
1,6x
1,8x
2009 2010 2011 2012
Retail
Content Company Country Liquidity Ratio -12
Axfood Sweden 0,6x
Bilia Sweden 1,9x
Byggmax Sweden 0,2x
CDON Group Sweden 1,4x
Clas Ohlson Sweden 1,0x
Hemtex Sweden 3,9x
Hennes & Mauritz Sweden 0,9x
ICA Gruppen Sweden 1,5x
KappAhl Sweden 0,3x
Kesko Finland 0,4x
Mekonomen Sweden 0,8x
MQ Holding Sweden 1,0x
Oriola-KD Finland 1,4x
Stockmann Finland 0,8x
21
Sources: SEB research, Data from Bloomberg and annual reports

22
Appendix – Foreign exchange
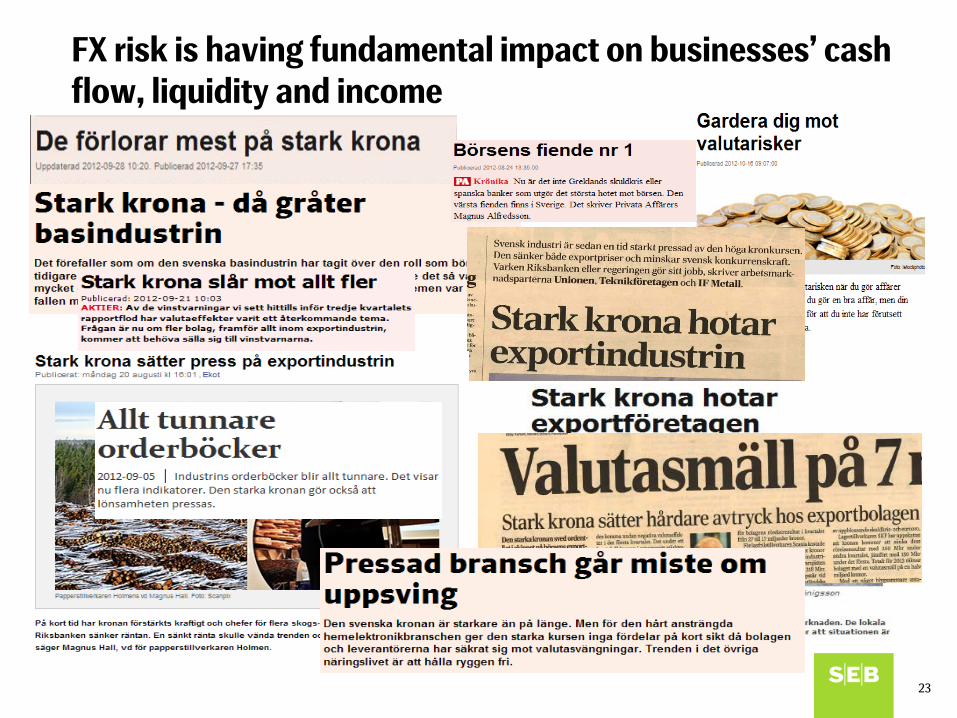
FX risk is having fundamental impact on businesses’ cash flow, liquidity and income
23