assessing and managing the rising rhino population in ... indicators 66 (2016) 55–64 contents...
TRANSCRIPT
AK
G
a
b
c
d
a
ARRA
KHOPWSC
1
retAso2nsrara
6
h1
Ecological Indicators 66 (2016) 55–64
Contents lists available at ScienceDirect
Ecological Indicators
j o ur na l ho me page: www.elsev ier .com/ locate /eco l ind
ssessing and managing the rising rhino population inaziranga (India)
aucherel Cédrica,b,∗, Pandey Nehaa, Puranik Roshana, Saika Uttamc, Garawad Rajendrad
French Institute of Pondicherry (IFP) – CNRS, Pondicherry, IndiaUMR AMAP – INRA, Montpellier, FranceBishnupur, Bokakhat Town, 785 612 Assam, IndiaWestern Assam Wildlife, Tezpur, 784 027 Assam, India
r t i c l e i n f o
rticle history:eceived 23 April 2015eceived in revised form 8 January 2016ccepted 13 January 2016
eywords:abitat preferencene-horned rhino (Rhinoceros unicornis)opulation dynamicsildlife management
a b s t r a c t
The greater one-horned rhinoceros (Rhinoceros unicornis) is a flagship species, and yet is poorly knownunlike its African cousin. The species future is now under a growing threat, judging by the prospect of alegalization of the horn trade that has been the subject of recent debate, coupled with the fragmentationof the animal’s habitat. In this study, we analyze the rhino habitat and assess its dynamics in the KazirangaNational Park (KNP), Assam, India. To compensate for the limited size of the data available, we use somenumerical models and propose some original spatial analyses and indicators.
Our findings point to a healthy and increasing rhino population in a density-dependent scenario. Anincrease of at least 30% in the rhino population is expected in the coming twelve years, mainly as aresult of the effective implementation of wildlife protection laws in the country. Kaziranga’s grasslands
patial analysisMP method
have been quite stable in the past (7% between years, in average, and less than 19% at most), and areexpected to remain so in the near future, especially in the core area of the KNP. In the absence of a detailedsuitability map and known carrying-capacity values, we identified the areas most favoured by the rhinos,and developed a so-called “preference map”. We conclude by stressing the need to realistically combinethe existing conservation strategies while increasing the monitoring effort on the species distribution.
. Introduction
Although all rhinoceros species are flagship species in theirespective habitats, and are on the IUCN Red List (Talukdart al., 2013), our understanding of the population ecology ofhis megafauna group is limited to some species only. While thefrican black (Diceros bicornis) and white rhinos (Ceratotheriumimum) have been well studied in terms of demography and ecol-gy (Ferreira et al., 2012; Tatman et al., 2000; Walpole et al.,001, and references therein), the three Asian rhinos (Dicerorhi-us sumatrensis, Rhinoceros sondaicus, and Rhinoceros unicornis) aretill poorly known. Of these, the unicorn or greater one-hornedhino, the subject of this paper, lives in the northern part of India
nd neighbouring territory, and its demography, behaviour, andelationship with its habitat deserve much more attention than ispparent in available literature (Acevedo, 2005; Dinerstein, 2003;∗ Corresponding author at: French Institute of Pondicherry (IFP), 11 St Louis Street,05 001 Pondicherry, India. Tel.: +91 0413 233 1620; fax: +91 0413 233 1605.
E-mail addresses: [email protected], [email protected] (G. Cédric).
ttp://dx.doi.org/10.1016/j.ecolind.2016.01.023470-160X/© 2016 Elsevier Ltd. All rights reserved.
© 2016 Elsevier Ltd. All rights reserved.
Laurie, 1982; Srivastava, 2002). One may recall some African studies(Conway and Goodman, 1989; Harley et al., 2005), and in particularthose touching on the poaching pressure for their horns (Poudyalet al., 2009). We discuss here the likely future of the unicorn rhinopopulation living in the Kaziranga National Park (KNP), Assam,India, with a close look at its demography and habitat dynam-ics using original methods and indicators adapted to the meagredataset available.
The KNP is a key protected area located in the Brahmaputraplains in north-eastern India, and is part of a rich biodiversityhotspot (Myers et al., 2000). Apart from the unicorn rhino (pop-ulation estimated at 2329 individuals in the March 2013 census),Kaziranga is home to what is probably the densest tiger populationin the world, and to a complex food web encompassing several wildspecies. It simultaneously provides ecosystem services for a largehuman population dependent on the KNP forests for their liveli-hood (Saikia, 2009; Srivastava, 2002). While the authorities have
made efforts to protect the various fauna and their habitat, theywould have had greater success if they were equipped with a bet-ter understanding of the rhino–habitat relationship and its directimplications for this species viability (Mathur et al., 2005b).
5 al Indi
mo(haWaeaib
pdtmapb(ttiirp
ot(dtsirtsv2
madofv
atefmhosmtGpiWtfaa
images), combined respectively with specific textural or similar-ity indices. They lead to local and quantitative analyses, which
6 G. Cédric et al. / Ecologic
As things stand, however, we still do not have adequate infor-ation about the species basic biology, specifically on the existence
f a density-dependent effect, or the importance of territorialityBrodie et al., 2011; Dinerstein, 2003; Garawad, 2009), and aboutow this mega-herbivore affects habitat quality and habitat avail-bility when the population density increases (e.g. Fritz et al., 2002).hile some studies of the unicorn rhino do exist for the Indian
nd Nepalese parks (Acevedo, 2005; Kushwaha et al., 2000; Mathurt al., 2005b; Subedi et al., 2013), they show deficiencies, such as
narrow geographical focus or remoteness in time, which dimin-sh their usefulness in arriving at a generalization of the rhino’sehaviour and its relationship with its habitat.
What will be its IUCN status in the years ahead, after itsresent-day vulnerable state? The direction of the rhino’s futureemography, and of the dynamics of its habitat (i.e. whetherhe habitat will shrink and/or change in composition), will be
ainly shaped by the existing poaching pressure and other mainlynthropogenic threats. Conversely, even a small increase in theopulation would call for a careful management of its spatial distri-ution to ensure a stable local population with minimal inbreedingDinerstein and Mc Cracken, 1990; Mathur et al., 2005b). In parallel,he dynamics of its habitat, more specifically its possible reduc-ion and simultaneous fragmentation, may have a considerablenfluence on the population’s long-term viability. The methods wendicate of projecting useful information on the rhino’s demog-aphy are such as could be utilized in the case of other mammalopulations.
Developments in regard to the horn trade, illegal globally, andur ability to build robust networks of protected areas, will remainhe major elements among human impacts on the rhino’s futureBiggs et al., 2013; Collins et al., 2013; Litchfield, 2013). The rhinooes not enjoy the protection that Indian tradition accords tohe elephant and the tiger, while Assamese society does show atrong attachment to the animal. The recently observed increasen the pressure on the African species should serve to echo theisk to the present relatively safe situation of the Asian popula-ions (Syangden et al., 2008). Sustainable management of thesepecies may need some complementary and sometimes contro-ersial decisions (van Aarde et al., 1999; Van Aarde and Jackson,007).
Our objective were threefold: (i) to develop a demographicodel from the available census data to prefigure the most prob-
ble scenario in the KNP; (ii) to analyze the KNP landscape’synamics using remote sensing data and generic multiscale meth-ds (Gaucherel, 2010; Gaucherel et al., 2010); (iii) to discuss theuture of the rhino population in the light of changes in the KNP’segetation.
We hypothesized that the KNP’s rhino population remained rel-tively stable or was slowly increasing, and would continue inhat direction. We developed several population-dynamics mod-ls to simulate the species demography, basing them on the datarom the censuses carried out in the KNP that covered approxi-
ately three-year periods. Another hypothesis was that the rhinoabitat was decreasing in size, partly due to competition withther mega-herbivores of the KNP and to the Brahmaputra’s ero-ion in past years (Mathur et al., 2005a). From the KNP land-coveraps, we developed spatial analyses to document the habitat struc-
ure in space, in time, and at various scales (Gaucherel, 2010;aucherel et al., 2010). These two hypotheses (i.e. a stable rhinoopulation and a decreasing surface habitat) combine to give the
ntuitive idea that the rhino population in this site is vulnerable.e finally combined these analyses in a context of scarce data on
he basis of a ranking index with the intention of capturing theocal species preferences (Johnson, 1980), and building a robust
nd coherent image of its probable future in the KNP and furtherway.cators 66 (2016) 55–64
2. Materials and methods
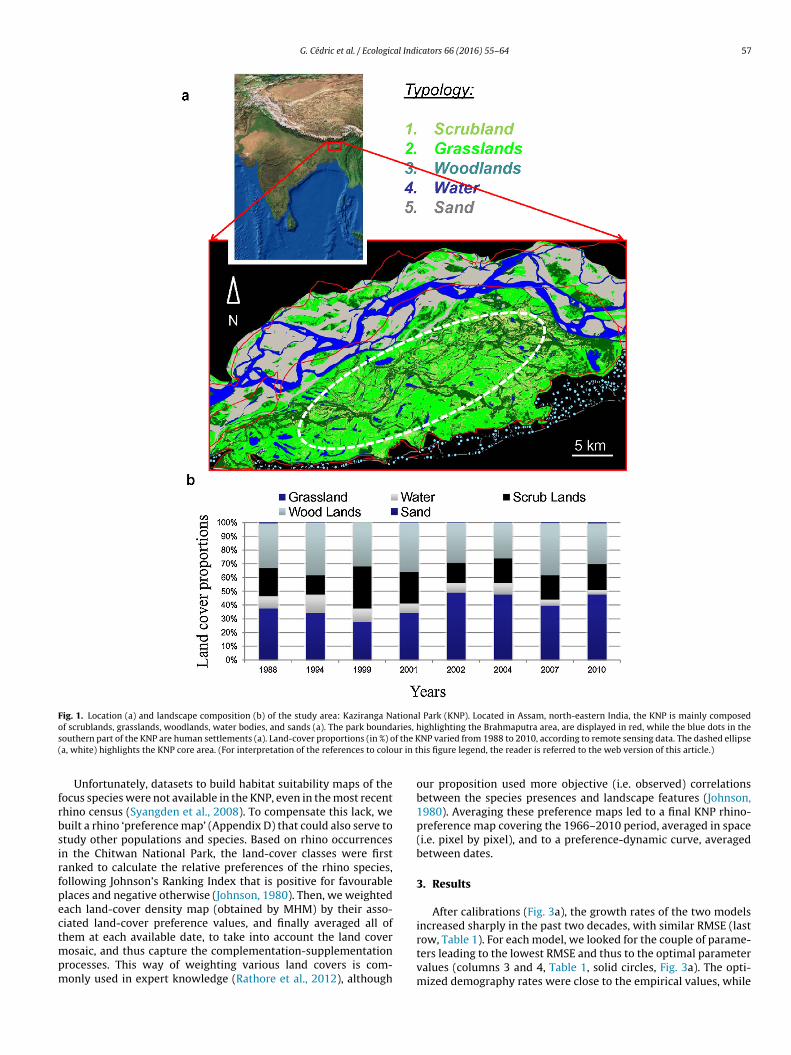
The Kaziranga National Park is located in the north-eastern stateof Assam in India, and covers approximately 430 km2 (Fig. 1a, seeAppendix A in Supplementary materials). The Brahmaputra river’sdynamics generates floods that affect the KNP’s unique landscapeand its wet, alluvial plain ecosystem. The oldest protected areain India, the KNP was declared a reserve forest in 1908, and wasnotified as a World Heritage Site by UNESCO in 1985. The KNP’slandscape is highly heterogeneous and mainly covered by scrub-lands (19.7%), grasslands (39.6%), and woodlands (32.6%), as shownby diachronic Landsat images (Hazarika and Saikia, 2005) (Fig. 1).Land-cover and vegetation types were retrieved from supervisedand unsupervised classifications of these Landsat images (AppendixA). Available population data in KNP allowed us to compute aver-aged population parameters such as the fertility, mortality, andpoaching rates, and the sex ratio despite their obvious variationsin time (Table 1, Fig. 2). Detailed sighting events (i.e. occurrencestransformed into frequencies) of rhino individuals in the variousland covers were not available at KNP, and we used sightings of theChitwan National Park (CNP) (DNPWC, 2009) to compute the rhinopreferences. The CNP, which is approximately 800 km away fromKNP, indeed is a relatively similar though more forested landscapethan KNP (Shrestha and Dangol, 2006).
We developed Leslie-Matrix projection models to quantify thepopulation dynamics of the rhino species in the KNP (Caswell,1989; Poudyal et al., 2009). Instead of developing a detailed spa-tially explicit population model (Rétho et al., 2008), for which datawere not available, we intended to build a preliminary model toestimate the main demographical rates within the park. In theabsence of a clear demonstration of a regulation of the density-dependent population of the unicorn rhino (Brodie et al., 2011;Dinerstein, 2003; Laurie, 1982; Ripley, 1952), we developed two(density-independent (DI) and density-dependent (DD)) modelsfor this population (Appendix B). Both the models were developedfor females, and were based on a two-stage matrix L (for calf andadult classes), fed by the above estimated parameters, and cali-brated with a trial-and-error procedure on the basis of observedabundances and root-mean-square-errors (RMSEs). Both modelscovered a time span of 200 years, starting with the census year1966. The DD model was based on a somewhat natural and robustRicker function to mimic the fertility rate according to the pop-ulation abundance (Caswell, 1989; Ricker, 1954). In addition to adetailed sensitivity analysis to assess the impact of each model’sparameter, we estimated and compared the rhino’s growth rate �in year 2013 in Kaziranga for both models.
We proposed detailed spatial analyses of the KNP’s landscapedynamics to then relate them to the rhino’s presence and habitatutilization (Appendix C). We first estimated the KNP’s land-coverchanges computed with Cohen’s Kappa, bearing in mind the rhino’sneed for a habitat mosaic (Dinerstein and Price, 1991; Kushwahaet al., 2000). We then estimated the KNP’s grassland dynamicsthrough comparisons of grassland-density maps for all the avail-able dates to identify the rhino’s most favoured habitat for its shortgrasses and wallowing grounds (Garawad, 2009). All these spatialanalyses were based on two methods that have been extensivelydescribed and applied to ecological questions (Gaucherel, 2007,2010; Gaucherel et al., 2008, 2010). Both the methods (multiscaleheterogeneity map (MHM) and comparison map and profile (CMP))are based on the principle of a circular moving window simulta-neously crossing the images to be analyzed (MHM uses a singleimage, Gaucherel et al., 2007) or compared (CMP compares two
become multiscale when the number of the moving window sizesvaries.
G. Cédric et al. / Ecological Indicators 66 (2016) 55–64 57
Fig. 1. Location (a) and landscape composition (b) of the study area: Kaziranga National Park (KNP). Located in Assam, north-eastern India, the KNP is mainly composedo ries, hs f the K( ur in t
frbsirfpectmpm
f scrublands, grasslands, woodlands, water bodies, and sands (a). The park boundaouthern part of the KNP are human settlements (a). Land-cover proportions (in %) oa, white) highlights the KNP core area. (For interpretation of the references to colo
Unfortunately, datasets to build habitat suitability maps of theocus species were not available in the KNP, even in the most recenthino census (Syangden et al., 2008). To compensate this lack, weuilt a rhino ‘preference map’ (Appendix D) that could also serve totudy other populations and species. Based on rhino occurrencesn the Chitwan National Park, the land-cover classes were firstanked to calculate the relative preferences of the rhino species,ollowing Johnson’s Ranking Index that is positive for favourablelaces and negative otherwise (Johnson, 1980). Then, we weightedach land-cover density map (obtained by MHM) by their asso-iated land-cover preference values, and finally averaged all of
hem at each available date, to take into account the land coverosaic, and thus capture the complementation-supplementationrocesses. This way of weighting various land covers is com-only used in expert knowledge (Rathore et al., 2012), although
ighlighting the Brahmaputra area, are displayed in red, while the blue dots in theNP varied from 1988 to 2010, according to remote sensing data. The dashed ellipse
his figure legend, the reader is referred to the web version of this article.)
our proposition used more objective (i.e. observed) correlationsbetween the species presences and landscape features (Johnson,1980). Averaging these preference maps led to a final KNP rhino-preference map covering the 1966–2010 period, averaged in space(i.e. pixel by pixel), and to a preference-dynamic curve, averagedbetween dates.
3. Results
After calibrations (Fig. 3a), the growth rates of the two modelsincreased sharply in the past two decades, with similar RMSE (last
row, Table 1). For each model, we looked for the couple of parame-ters leading to the lowest RMSE and thus to the optimal parametervalues (columns 3 and 4, Table 1, solid circles, Fig. 3a). The opti-mized demography rates were close to the empirical values, while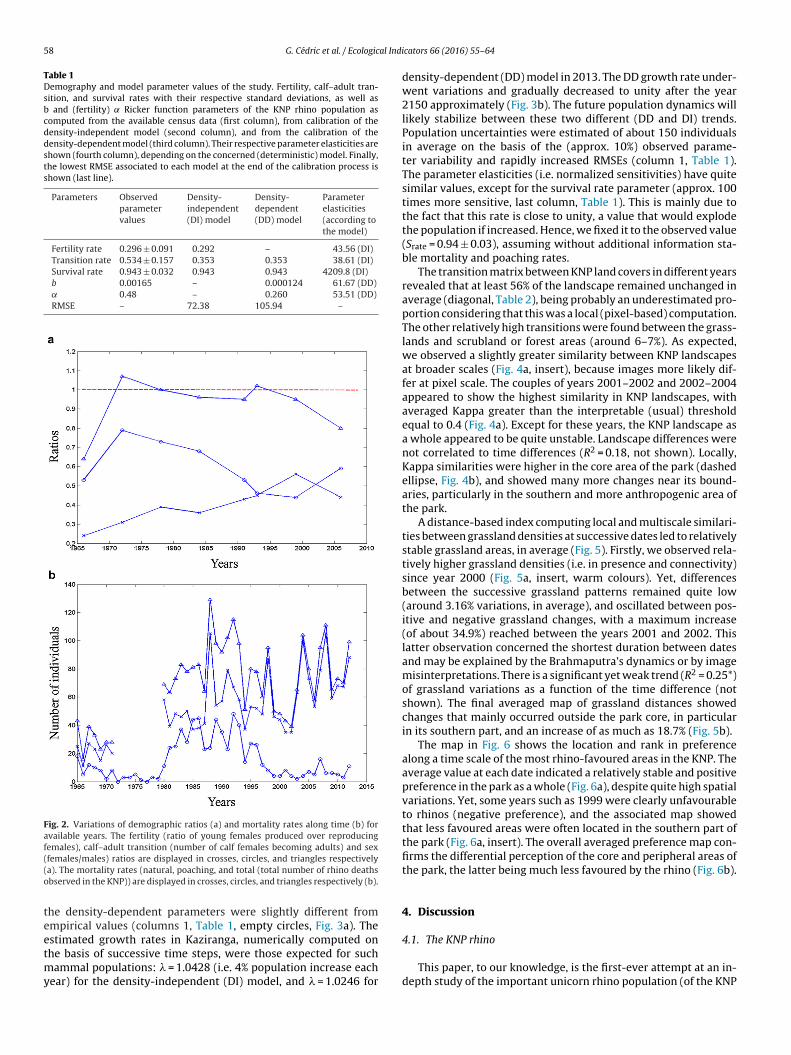
58 G. Cédric et al. / Ecological Indi
Table 1Demography and model parameter values of the study. Fertility, calf–adult tran-sition, and survival rates with their respective standard deviations, as well asb and (fertility) ̨ Ricker function parameters of the KNP rhino population ascomputed from the available census data (first column), from calibration of thedensity-independent model (second column), and from the calibration of thedensity-dependent model (third column). Their respective parameter elasticities areshown (fourth column), depending on the concerned (deterministic) model. Finally,the lowest RMSE associated to each model at the end of the calibration process isshown (last line).
Parameters Observedparametervalues
Density-independent(DI) model
Density-dependent(DD) model
Parameterelasticities(according tothe model)
Fertility rate 0.296 ± 0.091 0.292 – 43.56 (DI)Transition rate 0.534 ± 0.157 0.353 0.353 38.61 (DI)Survival rate 0.943 ± 0.032 0.943 0.943 4209.8 (DI)b 0.00165 – 0.000124 61.67 (DD)˛ 0.48 – 0.260 53.51 (DD)RMSE – 72.38 105.94 –
Fig. 2. Variations of demographic ratios (a) and mortality rates along time (b) foravailable years. The fertility (ratio of young females produced over reproducingfemales), calf–adult transition (number of calf females becoming adults) and sex((o
teetmy
females/males) ratios are displayed in crosses, circles, and triangles respectivelya). The mortality rates (natural, poaching, and total (total number of rhino deathsbserved in the KNP)) are displayed in crosses, circles, and triangles respectively (b).
he density-dependent parameters were slightly different frommpirical values (columns 1, Table 1, empty circles, Fig. 3a). The
stimated growth rates in Kaziranga, numerically computed onhe basis of successive time steps, were those expected for suchammal populations: � = 1.0428 (i.e. 4% population increase eachear) for the density-independent (DI) model, and � = 1.0246 for
cators 66 (2016) 55–64
density-dependent (DD) model in 2013. The DD growth rate under-went variations and gradually decreased to unity after the year2150 approximately (Fig. 3b). The future population dynamics willlikely stabilize between these two different (DD and DI) trends.Population uncertainties were estimated of about 150 individualsin average on the basis of the (approx. 10%) observed parame-ter variability and rapidly increased RMSEs (column 1, Table 1).The parameter elasticities (i.e. normalized sensitivities) have quitesimilar values, except for the survival rate parameter (approx. 100times more sensitive, last column, Table 1). This is mainly due tothe fact that this rate is close to unity, a value that would explodethe population if increased. Hence, we fixed it to the observed value(Srate = 0.94 ± 0.03), assuming without additional information sta-ble mortality and poaching rates.
The transition matrix between KNP land covers in different yearsrevealed that at least 56% of the landscape remained unchanged inaverage (diagonal, Table 2), being probably an underestimated pro-portion considering that this was a local (pixel-based) computation.The other relatively high transitions were found between the grass-lands and scrubland or forest areas (around 6–7%). As expected,we observed a slightly greater similarity between KNP landscapesat broader scales (Fig. 4a, insert), because images more likely dif-fer at pixel scale. The couples of years 2001–2002 and 2002–2004appeared to show the highest similarity in KNP landscapes, withaveraged Kappa greater than the interpretable (usual) thresholdequal to 0.4 (Fig. 4a). Except for these years, the KNP landscape asa whole appeared to be quite unstable. Landscape differences werenot correlated to time differences (R2 = 0.18, not shown). Locally,Kappa similarities were higher in the core area of the park (dashedellipse, Fig. 4b), and showed many more changes near its bound-aries, particularly in the southern and more anthropogenic area ofthe park.
A distance-based index computing local and multiscale similari-ties between grassland densities at successive dates led to relativelystable grassland areas, in average (Fig. 5). Firstly, we observed rela-tively higher grassland densities (i.e. in presence and connectivity)since year 2000 (Fig. 5a, insert, warm colours). Yet, differencesbetween the successive grassland patterns remained quite low(around 3.16% variations, in average), and oscillated between pos-itive and negative grassland changes, with a maximum increase(of about 34.9%) reached between the years 2001 and 2002. Thislatter observation concerned the shortest duration between datesand may be explained by the Brahmaputra’s dynamics or by imagemisinterpretations. There is a significant yet weak trend (R2 = 0.25*)of grassland variations as a function of the time difference (notshown). The final averaged map of grassland distances showedchanges that mainly occurred outside the park core, in particularin its southern part, and an increase of as much as 18.7% (Fig. 5b).
The map in Fig. 6 shows the location and rank in preferencealong a time scale of the most rhino-favoured areas in the KNP. Theaverage value at each date indicated a relatively stable and positivepreference in the park as a whole (Fig. 6a), despite quite high spatialvariations. Yet, some years such as 1999 were clearly unfavourableto rhinos (negative preference), and the associated map showedthat less favoured areas were often located in the southern part ofthe park (Fig. 6a, insert). The overall averaged preference map con-firms the differential perception of the core and peripheral areas ofthe park, the latter being much less favoured by the rhino (Fig. 6b).
4. Discussion
4.1. The KNP rhino
This paper, to our knowledge, is the first-ever attempt at an in-depth study of the important unicorn rhino population (of the KNP

G. Cédric et al. / Ecological Indicators 66 (2016) 55–64 59
Fig. 3. Calibration figures (a) and population dynamics (b) of the KNP rhino models (b, calf in insert). The following simulations are results of calibration stages for the DImodel (a, left) and the DD model (a, right). The DI model RMSE contour plot (in colours), as a function of fertility and transition rates, shows the initial observed values(empty circle), quite close to the final selected ones (solid circle) corresponding to the minimal RMSE value. The DD model RMSE contour plot (in colours), as a function ofthe b (strength of density dependence) and ̨ (fertility factor), shows the initial observed values (empty circle), and the final selected ones (solid circle) corresponding to theminimal RMSE value. In insert are displayed the RMSE variations for b and ̨ parameters to estimate their elasticities in the DD model, and the selected values (red arrows).Population simulations and projections (b) for the density-independent model (DI, plain
and calf females (red lines) are superimposed (for clarity, uncertainties of ±150 individuafigure legend, the reader is referred to the web version of this article.)
Table 2Transition matrix between the five land covers of the KNP, averaged over the sevencouples of years available in the remote sensing data. Transitions (in %) are ori-ented from columns to lines (e.g. 6.04% of KNP pixels are shifting from Scrubland toGrassland). Hence, the matrix is not symmetrical, but all transitions sum to 100%.Dominant transitions (arbitrary fixed greater than 5%) have been highlighted in boldcase, considering that for example changes from wood to water (1.54%) were notrealistic (and that this threshold should thus be higher).
Land covers Water Wood Scrubland Grassland Sand
Water 4.35 1.54 1.33 1.22 0.004Wood 1.06 20.11 4.15 7.91 0.011
imu(t
Scrubland 0.99 3.39 7.47 7.32 0.014Grassland 1.18 7.91 6.04 23.91 0.013Sand 0.016 0.014 0.013 0.02 0.004
n particular) with the help of population- and habitat-dynamic
odels. In our main result, we observed that the KNP’s rhino pop-lation is increasing, and is unlikely to stabilize in the near futurei.e. before several decades, Fig. 3). We present the predicted state ofhe population based on the two scenarios of density-dependence
lines) and density-dependent model (DD, dashed lines). Adult females (blue lines)ls in average were not added). (For interpretation of the references to colour in this
acting or not acting in the population. So far, both scenarios areequiprobable. In addition, the male demography is assumed toclosely follow the female demography, although rescaled by thesex ratio (triangles, Fig. 2a). Following the observed demographicratios (in the past 45 years) between the adult female and theother population classes, we thus predict a total rhino population(females + males + calves) at between 3076 and 3843 individuals inyear 2025, for the DD and DI (deterministic) models respectively.These approximately 3500 individuals correspond to the 50 ± 17%variation from the 2329 individuals recorded in 2013. This pre-diction is likely to exceed the density of 8 individuals per km2 (5indiv./km2 today), and demonstrates, contrary to our first hypoth-esis, a healthy and well-protected unicorn rhino population in thisbusiness-as-usual scenario.
The average annual mortality rate was estimated to be approxi-
mately equal to 6%, and was even lower for the past decade (Fig. 2b).The poaching rate was 1% on average, and rose to 3% in the year1999. The comparatively low incidence of poaching deaths shouldbe attributed to the efficient anti-poaching actions of the KNP
60 G. Cédric et al. / Ecological Indicators 66 (2016) 55–64
Fig. 4. Averaged CMP Kappa for KNP land-cover changes as a function of time (a) and mapped on the KNP area (b). The averaged Kappa variations along time are plotted as afunction of the first year of compared successive dates (a) with their respective uncertainties, the highest values for years 2001–2002 being highlighted (a, red circle). Kappatest is appropriate for qualitative data comparison, and Kappa values are considered as: poor if <0.4, fair if between 0.4 and 0.7, good if >0.7. In insert is the averaged Kappavariation along scales over all the compared successive dates. The Kappa (in colour scale) is mapped in cartographic coordinates as an average over all compared successived r landr f this
aswpstitrS
bo
ates (b). The highest Kappa values in the core area of the park showing quite similaeferences to colour in this figure legend, the reader is referred to the web version o
nd Assam state authorities (Mathur et al., 2005b). However, ithould be remembered that these statistics relate to poachingsithin the KNP’s boundaries, and that several killings outside theark’s area are reported every year, particularly those of males thattray beyond the park lands. While it may be unrealistic to lowerhe poaching rate, given the ineluctable pressure from a grow-ng human population and road-building, it is to be hoped thathe park’s authorities will continue to act vigorously to controlhino mortality inside and outside the park (Mathur et al., 2005b;
rivastava, 2002).The predicted population increase could be strongly limitedy a decline in the extent of the rhino-preferred habitat, anutcome which, however, was not observed in our original
scapes across years are highlighted by the dashed ellipse. (For interpretation of the article.)
landscape-dynamic analysis. The local and multiscale analyses weperformed on the KNP landscape revealed a relatively unstablelandscape from year to year (differences often below the 0.4 Kappathreshold, Fig. 4). At the same time, we observed relatively stablegrassland dynamics (low distances, Fig. 5), especially in the corearea of the park. Grassland differences may be due to acts of man-agement intervention, such as grassland burning, as well as to thecoarse grain of our analysis, which may have blurred the distinc-tion between short and tall grasses. Besides, our study suggests
the potential of a quite stable carrying capacity of the KNP, but agreater vulnerability of land cover close to the boundaries. Indeed,it has been shown that these boundaries are largely affected by theBrahmaputra tributaries in the northern part and by human and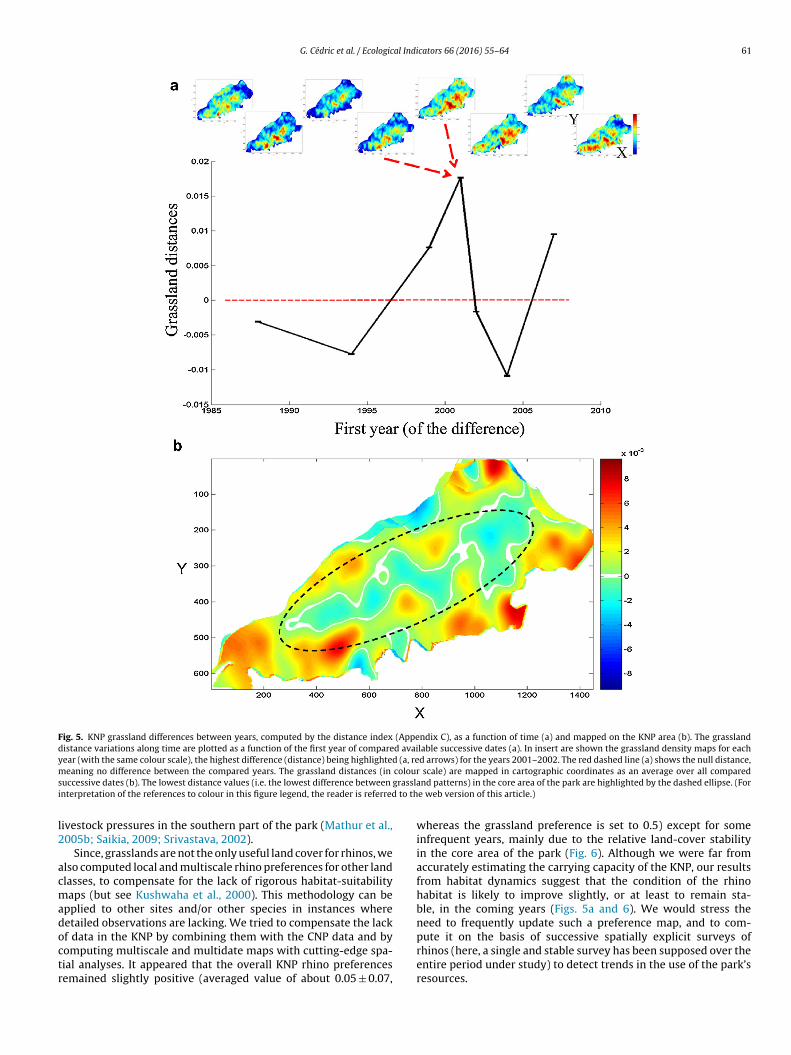
G. Cédric et al. / Ecological Indicators 66 (2016) 55–64 61
Fig. 5. KNP grassland differences between years, computed by the distance index (Appendix C), as a function of time (a) and mapped on the KNP area (b). The grasslanddistance variations along time are plotted as a function of the first year of compared available successive dates (a). In insert are shown the grassland density maps for eachyear (with the same colour scale), the highest difference (distance) being highlighted (a, red arrows) for the years 2001–2002. The red dashed line (a) shows the null distance,m colours grasslai to th
l2
acmadoctr
eaning no difference between the compared years. The grassland distances (in
uccessive dates (b). The lowest distance values (i.e. the lowest difference between
nterpretation of the references to colour in this figure legend, the reader is referred
ivestock pressures in the southern part of the park (Mathur et al.,005b; Saikia, 2009; Srivastava, 2002).
Since, grasslands are not the only useful land cover for rhinos, welso computed local and multiscale rhino preferences for other landlasses, to compensate for the lack of rigorous habitat-suitabilityaps (but see Kushwaha et al., 2000). This methodology can be
pplied to other sites and/or other species in instances whereetailed observations are lacking. We tried to compensate the lack
f data in the KNP by combining them with the CNP data and byomputing multiscale and multidate maps with cutting-edge spa-ial analyses. It appeared that the overall KNP rhino preferencesemained slightly positive (averaged value of about 0.05 ± 0.07,scale) are mapped in cartographic coordinates as an average over all comparednd patterns) in the core area of the park are highlighted by the dashed ellipse. (For
e web version of this article.)
whereas the grassland preference is set to 0.5) except for someinfrequent years, mainly due to the relative land-cover stabilityin the core area of the park (Fig. 6). Although we were far fromaccurately estimating the carrying capacity of the KNP, our resultsfrom habitat dynamics suggest that the condition of the rhinohabitat is likely to improve slightly, or at least to remain sta-ble, in the coming years (Figs. 5a and 6). We would stress theneed to frequently update such a preference map, and to com-
pute it on the basis of successive spatially explicit surveys ofrhinos (here, a single and stable survey has been supposed over theentire period under study) to detect trends in the use of the park’sresources.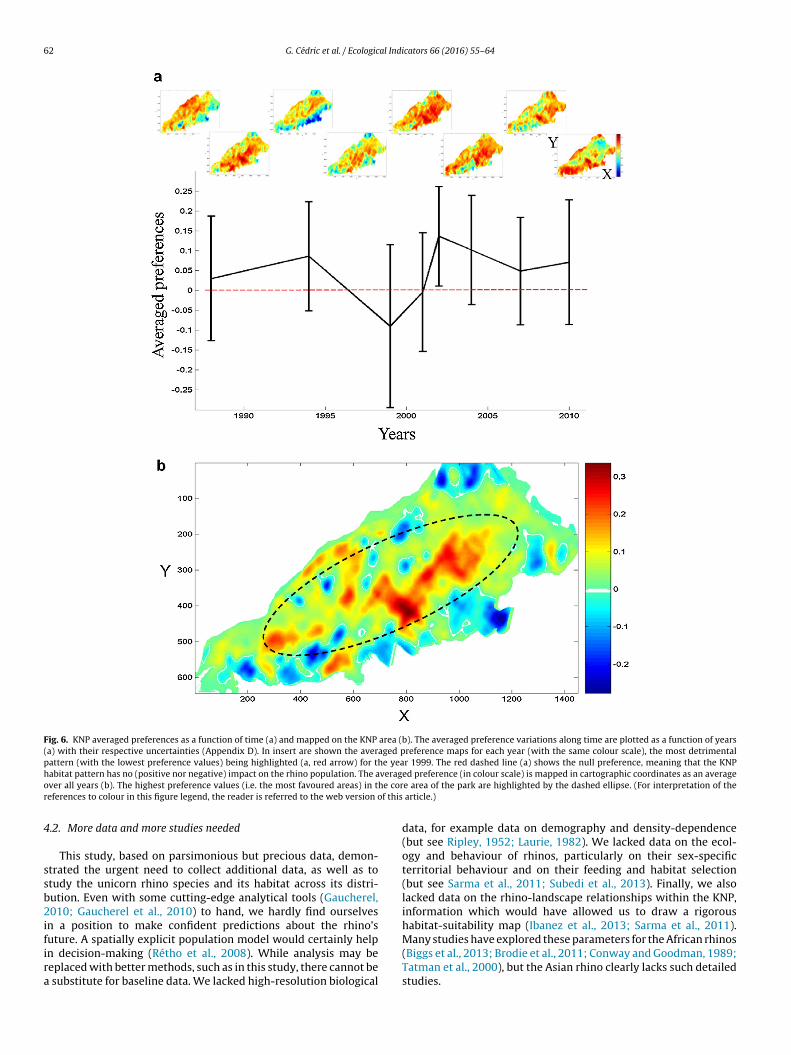
62 G. Cédric et al. / Ecological Indicators 66 (2016) 55–64
Fig. 6. KNP averaged preferences as a function of time (a) and mapped on the KNP area (b). The averaged preference variations along time are plotted as a function of years(a) with their respective uncertainties (Appendix D). In insert are shown the averaged preference maps for each year (with the same colour scale), the most detrimentalpattern (with the lowest preference values) being highlighted (a, red arrow) for the year 1999. The red dashed line (a) shows the null preference, meaning that the KNPh verago he corr f this
4
ssb2ifira
abitat pattern has no (positive nor negative) impact on the rhino population. The aver all years (b). The highest preference values (i.e. the most favoured areas) in teferences to colour in this figure legend, the reader is referred to the web version o
.2. More data and more studies needed
This study, based on parsimonious but precious data, demon-trated the urgent need to collect additional data, as well as totudy the unicorn rhino species and its habitat across its distri-ution. Even with some cutting-edge analytical tools (Gaucherel,010; Gaucherel et al., 2010) to hand, we hardly find ourselves
n a position to make confident predictions about the rhino’s
uture. A spatially explicit population model would certainly helpn decision-making (Rétho et al., 2008). While analysis may beeplaced with better methods, such as in this study, there cannot besubstitute for baseline data. We lacked high-resolution biological
ed preference (in colour scale) is mapped in cartographic coordinates as an averagee area of the park are highlighted by the dashed ellipse. (For interpretation of the
article.)
data, for example data on demography and density-dependence(but see Ripley, 1952; Laurie, 1982). We lacked data on the ecol-ogy and behaviour of rhinos, particularly on their sex-specificterritorial behaviour and on their feeding and habitat selection(but see Sarma et al., 2011; Subedi et al., 2013). Finally, we alsolacked data on the rhino-landscape relationships within the KNP,information which would have allowed us to draw a rigoroushabitat-suitability map (Ibanez et al., 2013; Sarma et al., 2011).
Many studies have explored these parameters for the African rhinos(Biggs et al., 2013; Brodie et al., 2011; Conway and Goodman, 1989;Tatman et al., 2000), but the Asian rhino clearly lacks such detailedstudies.
al Indi
uprpmSrcctrtqt
4
iugobsdddamatctmt1dsl
aisshmm1pswassurftapce
wh
G. Cédric et al. / Ecologic
Several methods are today available to help us improve ournderstanding of rhino biology. The total count method in use atresent in census operations is statistically unreliable, while mark-e-sight techniques or the ‘distance sampling’ method are moreowerful methods recently proposed for proper understanding ofammal population dynamics (Thomas et al., 2006; Wegge and
toraas, 2009). If adopted in India, the latter methods could provideeliable figures on rhino densities on an annual basis. Another effi-ient method of value would be GPS collaring, which facilitatesontinuous recording of habitats selected by a few representa-ive individuals (Benhamou, 2011; Gaucherel, 2011), and provideseal-time preference data. This safe, non-invasive, and powerfulechnique, commonly used for the African rhinos, allows one touantify individual movements and to associate their patterns withheir landscape features.
.3. The (unicorn) rhino conservation
With a predicted 50% increase in the KNP’s rhino populationn the coming twelve years (i.e. around a thousand more individ-als) and a stable habitat (Figs. 4b and 5b), it becomes urgent toive serious thought to the question of the species managementn a long-term basis and at broad spatial scales. The only possi-le converse to this projection would be the appearance of a muchtronger density-dependence effect than the one detected in theeclining trend of vital rates (Garawad, 2009). So far, we cannotiscriminate between DD and DI models on the basis of observedata, but data in the coming years will likely fix this point. Here, wessume that the population growth rates have been correctly esti-ated and that they may be only marginally impacted by poaching
nd other threats. Parameter elasticities were relatively low (andhus robust) according to current-day data, but changing dynamicsould rapidly impact them. In case no DD process is occurring soon,he park authority will face a huge challenge in terms of population
anagement. India adopted, some years ago, a policy to regularlyranslocate some rhinos to other protected zones (Sale and Singh,987), but such a growing rhino population will require a vastlyifferent mode of thinking. Translocations are costly, although pos-ibly easier and more effective than previously thought for such aarge, non-social mega-herbivore (Linklater et al., 2012).
A comparatively recent detailed study on some complementarynd controversial management decisions (such as culling, steril-zation, no action, etc.) for an increasing elephant population inouthern Africa revealed that none of them seemed to be fullyatisfactory (Van Aarde and Jackson, 2007). Some earlier authorsad advocated a ‘metapopulation approach’ favouring individualigrations along corridors between protected areas, a manage-ent option also suggested for the black rhinoceros (Foose et al.,
993). A metapopulation results from the dynamics of a sub-opulation, through dispersal and recolonization between patches,ome of which act as sources while the others act as sinks. Our studyould be highly relevant for the growing rhino population in India,
lthough it is not clear how a metapopulation approach would beuccessful (but see Thapa et al., 2013). However, this option pre-upposes a stable and well-planned ‘landscape network’, a quitenrealistic requirement given the extreme difficulty of monitoringhino movements in riverine and swampy terrains. While hopingor a network of protected areas in the country, along the lines ofhat for tigers (Sharma et al., 2013), we have serious misgivingsbout the feasibility of such a project for rhinos, in the face of theoaching pressure in evidence up until now, of administrative diffi-ulties, and of pressure resulting from the influx of people (Poudyal
t al., 2009).In the broader context, there is today an on-going debate onhether a legalized commercial exploitation of the rhino horn,owever distasteful, might reduce the poaching pressure on these
cators 66 (2016) 55–64 63
endangered species (Collins et al., 2013; Litchfield, 2013). A sizeableincrease in poaching on African rhinos has been recorded in recentyears (Biggs et al., 2013), with a demand-and-supply imbalancethat may later spread to Asian rhinos. Yet, while persistent rhinopoaching in the KNP and in Assam in general cannot be ruled outaltogether in the future, its impact may not affect the net size of thespecies projected population growth, if poaching roughly remainsat the current 1% level.
What we have proposed in this paper is a generic methodol-ogy consisting of preference maps, and linking it to a demographicmodel of the rhino population. Our findings point to the potentialusefulness of simultaneously combining the existing practices inrhino management, and in particular reinforcing and optimizingtranslocation, sterilization in target areas, and continual monitor-ing the species spatial distribution at both landscape and regionalscales. A landscape approach that represents an alternative entailspolitical synergies, cooperation of local people, additional funds,and ultimately a restructuring of the administrative machinery,even though it has produced some success in neighbouring areas(Thapa et al., 2013). There might be considerable benefits to therhino metapopulation, and to the human population, if a multi-park think tank, or even a multi-country think tank, were to comeinto existence. A frequent audit of each strategy employed, pos-sibly in combination with a spatially explicit model (Rétho et al.,2008), might help in suggesting relative weights to be assigned tothe strategies.
Acknowledgements
This research was funded by the Agence Nationale de laRecherche (projects ‘BiodivAgriM’ and ‘INC’, ANR-biodiversité2007). We are grateful to Rubul Hazarika for providing the clas-sified maps of the KNP between 1988 and 2010, and to the forestdepartment people and officials of the KNP for useful discussionsconcerning the rhino species. Lastly, we would like to thank AllanBailur for editing the English of this paper.
Appendix A. Supplementary data
Supplementary data associated with this article can be found,in the online version, at http://dx.doi.org/10.1016/j.ecolind.2016.01.023.
References
Acevedo, M.F., (Dissertation) 2005. Analysis of the One-horned Rhinoceros(Rhinoceros unicornis) Habitat in the Royal Chitwan National Park. Universityof North Texas, Nepal.
Benhamou, S., 2011. Dynamic approach to space and habitat use based on biasedrandom bridges. PLoS ONE 6, e14592.
Biggs, D., Courchamp, F., Martin, R., Possingham, H.P., 2013. Legal trade of Africa’sRhino Horn. Science 339 (6123), 1038–1039.
Brodie, J.F., Muntifering, J., Hearn, M., Loutit, B., Loutit, R., Brell, B., Uri-khob, S.,Leader-Williams, N., du Preez, P., 2011. Population recovery of black rhinocerosin northwest Namibia following poaching. Anim. Conserv. 14, 354–362.
Caswell, H., 1989. Matrix Population Models. Sunderland, Massachussetts, USA.Collins, A., Fraser, G., Snowball, J., 2013. Rhino poaching: supply and demand uncer-
tain. Science 340 (6137), 1167.Conway, A.J., Goodman, P.S., 1989. Population characteristics and management of
black rhinoceros (Diceros bicornis minor) and white rhinoceros (Ceratotheriumsimum simum) in Ndumu Game Reserve, South Africa. Biol. Conserv. 47 (2),109–122.
Dinerstein, E., 2003. The Return of the Unicorns: Natural History and Conservationof the Greater One-horned Rhinoceros. Columbia University Press.
Dinerstein, E., Mc Cracken, G.F., 1990. Endangered greater one-horned rhinoceroscarry high levels of genetic variation. Conserv. Biol. 4, 417–422.
Dinerstein, E., Price, L., 1991. Demography and habitat use by greater one-horned
rhinoceros in Nepal. J. Wildl. Manag. 55 (3), 401–411.DNPWC, 2009. The Status and Distribution of the Greater One-Horned Rhino in NepalDepartment of National Parks and Wildlife Conservation, Kathmandu, Nepal.
Ferreira, S.M., Botha, J.M., Emmett, M.C., 2012. Anthropogenic influences on conser-vation values of white rhinoceros. PLoS ONE 7 (9), e45989.
6 al Indi
F
F
G
G
G
G
G
G
G
H
H
I
J
K
L
L
L
M
M
M
P
4 G. Cédric et al. / Ecologic
oose, T.J., Lacy, R.C., Brett, R., Seal, U.S., 1993. Kenya Black Rhino MetapopulationWorkshop Report, IUCN/SSC CBSG, Apple Valley, MN.
ritz, H., Duncan, P., Gordon, I.J., Illius, A.W., 2002. Megaherbivores influence trophicguilds structure in African ungulate communities. Oecologia 131 (4), 620–625.
arawad, R., (M.Sc. thesis) 2009. Understanding the Population Dynamics of GreatIndian One-Horned Rhinoceros (Rhinoceros unicornis) of Kaziranga NationalPark, Assam, India. Bangor University, UK.
aucherel, C., 2007. Multiscale heterogeneity map and associated scaling profile forlandscape analysis. Landsc. Urban Plan. 82 (3), 95–102.
aucherel, C., 2010. Self-similar land cover heterogeneity of temperate and tropicallandscapes. Ecol. Complex. 6, 346–352.
aucherel, C., 2011. Wavelet analysis to detect regime shifts in animal movement.Comput. Ecol. Softw. 1 (2), 69–85.
aucherel, C., Alleaume, S., Hely, C., 2008. The comparison map profile method: astrategy for multiscale comparison of quantitative and qualitative images. IEEETrans. Geosci. Remote Sens. 46 (9), 2708–2719.
aucherel, C., Balasubramanian, M., Karunakaran, P.V., Ramesh, B.R., Muthu, S.,Couteron, P., Hély-Alleaume, C., 2010. At which scales does landscape structureinfluence the spatial distribution of elephants in the Western Ghats (India)? J.Zool. 280, 185–194.
aucherel, C., Burel, F., Baudry, J., 2007. Multiscale and surface pattern analysis ofthe effect of landscape organisation on carabid beetles distribution. Ecol. Indic.7 (3), 598–609.
arley, E.H., Baumgarten, I., Cunningham, J., O’Ryan, C., 2005. Genetic variationand population structure in remnant populations of black rhinoceros, Dicerosbicornis, in Africa. Mol. Ecol. 14, 2981–2990.
azarika, R., Saikia, A., 2005. The Rift in the Lute: Rhino Habitat in the KazirangaNational Park, India.
banez, T., Borgniet, L., Mangeas, M., Gaucherel, C., Géraux, H., Hély, C., 2013. Rain-forest and savanna landscape dynamics in New caledonia: towards a mosaic ofstable rainforest and savanna states? Austral Ecol. 38 (1), 33–45.
ohnson, D.H., 1980. The comparison of usage and availability measurements forevaluating resource preference. Ecology 61, 65–71.
ushwaha, S.P.S., Roy, P.S., Azeem, A., Boruah, P., Lahan, P., 2000. Land area changeand rhino habitat suitability analysis in Kaziranga National Park, Assam. Tiger-paper 27, 9–17.
aurie, A., 1982. Behavioural ecology of the Greater one-horned rhinoceros(Rhinoceros unicornis). J. Zool. 196, 307–341.
inklater, W.L., Gedir, J.V., Law, P.R., Swaisgood, R.R., Adcock, K., du Preez, P.,Knight, M.H., Kerley, G.I.H., 2012. Translocations as experiments in the ecologicalresilience of an asocial mega-herbivore. PLoS ONE 7 (1), e30664.
itchfield, C.A., 2013. Rhino poaching: apply conservation psychology. Science 340(6137), 1168.
athur, V.B., Sinha, P.R., Manoj, M., 2005a. UNESCO EoH Project South Asia TechnicalReport – Kaziranga National Park. UNESCO.
athur, V.B., Verma, A., Dudley, N., Stolton, S., Hockings, M., Robyn, J., 2005b. Oppor-tunities and challenges for Kaziranga National Park, Assam over the next fiftyyears. In: Enhancing Heritage, UNESCO – IUCN Enhancing Our Heritage ProjectTeam., pp. 84.
yers, N., Mittermeier, R.A., Mittermeier, C.G., da Fonseca, G.A.B., Kent, J., 2000.Biodiversity hotspots for conservation priorities. Nature 403 (6772), 853–858.
oudyal, M., Rothley, K., Knowler, D., 2009. Ecological and economic analysis ofpoaching of the greater one horned rhinoceros (Rhinoceros unicornis) in Nepal.Ecol. Appl. 19 (7), 1693–1707.
cators 66 (2016) 55–64
Rathore, C.S., Dubey, Y., Shrivastava, A., Pathak, P., Patil, V., 2012. Opportunitiesof habitat connectivity for tiger (Panthera tigris) between Kanha and PenchNational Parks in Madhya Pradesh, India. PLoS ONE 7 (7), e39996.
Rétho, B., Gaucherel, C., Inchausti, P., 2008. Spatially explicit population dynamicsof Pterostichus melanarius I11. (Coleoptera: Carabidae) in response to changesin the composition and configuration of agricultural landscapes. Landsc. UrbanPlan. 84, 191–199.
Ricker, W.E., 1954. Stock and recruitment. J. Fish. Res. Board Can. 11 (5), 559–623.Ripley, S.D., 1952. Territorial and sexual behaviour in the Great Indian Rhinoceros,
a speculation. Ecology 33 (4), 570–573.Saikia, A., 2009. The Kaziranga National Park: dynamics of social and political history.
Conserv. Soc. 7 (2), 113–129.Sale, J.B., Singh, S., 1987. Reintroduction of greater Indian rhinoceros into Dudhwa
National Park. Oryx 21 (2).Sarma, P.K., Mipun, B.S., Talukdar, B.K., Kumar, R., Basumatary, A.K., 2011. Evaluation
of habitat suitability for rhino (Rhinoceros unicornis) in Orang National Park UsingGeo-Spatial Tools. ISRN Ecol., 498259 p., Article ID 498258.
Sharma, S., Dutta, T., Maldonado, J.E., Wood, T.C., Panwar, H.S., Seidensticker, J., 2013.Forest corridors maintain historical gene flow in a tiger metapopulation in thehighlands of central India. Proc. R. Soc. B 280 (20131506), 1–9.
Shrestha, B.K., Dangol, D.R., 2006. Change in Grassland vegetation in the NorthernPart of Royal Chitwan National Park, Nepal. Sci. World 4 (4), 78–83.
Srivastava, R.J., (M.Sc. thesis) 2002. Natural Resources Uses and Park–People Rela-tions at Kaziranga National Park and World Heritage Site, India. University ofFlorida.
Subedi, N., Jnawali, S.R., Dhakal, M., Pradhan, N.M.B., Lamichhane, B.R., Malla, S.,Amin, R., Jhala, Y.V., 2013. Population status, structure and distribution of thegreater one-horned rhinoceros Rhinoceros unicornis in Nepal. Oryx 47, 352–360.
Syangden, B., Sectionov, E.S., Williams, A.C., Strien, N.J.V., Talukdar, B.K., 2008. Reporton the Regional Meeting for India and Nepal IUCN/SSC Asian Rhino Species Group(AsRSG), AsRSG, Kaziranga National Park, Assam, India., pp. 1–28.
Talukdar, B.K., Emslie, R., Bist, S.S., Choudhury, A., Ellis, S., Bonal, B.S.M., Alakar, M.C.,Talukdar, B.N., Barua, M., 2013. Rhinoceros unicornis. IUCN Red List of ThreatenedSpecies, IUCN, Version 2013.1.
Tatman, S.C., Stevens-Wood, B., Smith, V.B.T., 2000. Ranging behaviour and habitatusage in black rhinoceros, Diceros bicornis, in a Kenyan sanctuary. Afr. J. Ecol. 38,163–172.
Thapa, K., Nepal, S., Thapa, G., Bhatta, S.R., Wikramanayake, E., 2013. Past, present andfuture conservation of the greater one-horned rhinoceros Rhinoceros unicornisin Nepal. Oryx 47 (3), 345–351.
Thomas, L., Lalake, J.L., Strindberg, S., Marques, F.F.C., Buckland, S.T., Borchers, D.L.,Anderson, D.R., Burnham, K.P., Hedley, S.L., Pollard, J.H., Bishop, J.R.B., Mar-ques, T.A., 2006. Distance 5.0 Release x1. R.U.f.W.P. Assessment. University ofSt Andrews, UK http://www.ruwpa.st-and.ac.uk/distance/.
van Aarde, R., Whyte, I., Pimm, S., 1999. Culling and the dynamics of the KrugerNational Park African elephant population. Anim. Conserv. 2 (4), 287–294.
Van Aarde, R.J., Jackson, T.P., 2007. Megaparks for metapopulations: addressing thecauses of locally high elephant numbers in southern Africa. Biol. Conserv. 134(3), 289–297.
Walpole, M.J., Morgan-Davies, M., Milledge, S., Bett, P., Leader-Williams, N., 2001.Population dynamics and future conservation of a free-ranging black rhinoceros(Diceros bicornis) population in Kenya. Biol. Conserv.
Wegge, P., Storaas, T., 2009. Sampling tiger ungulate prey by the distance method:lessons learned in Bardia National Park, Nepal. Anim. Conserv. 12, 78–84.