assessing aerosol indirect effect on clouds and regional
TRANSCRIPT

Vol.:(0123456789)1 3
Climate Dynamics https://doi.org/10.1007/s00382-018-4476-9
Assessing aerosol indirect effect on clouds and regional climate of East/South Asia and West Africa using NCEP GFS
Huilin Huang1 · Yu Gu2,3 · Yongkang Xue1,2 · Jonathan Jiang4 · Bin Zhao2,3
Received: 19 December 2017 / Accepted: 28 September 2018 © Springer-Verlag GmbH Germany, part of Springer Nature 2018
AbstractAerosols can act as cloud condensation nuclei and ice nuclei, resulting in changes in cloud droplet/particle number/size, and hence altering the radiation budget. This study investigates the interactions between aerosols and ice clouds by incorporat-ing the latest ice clouds parameterization in an atmospheric general circulation model. The simulation shows a decrease in effective ice cloud crystal size corresponding to aerosol increase, referred to as the aerosol first indirect effect, which has not been comprehensively studied. Ice clouds with smaller particles reflect more shortwave radiation and absorb more infrared radiation, resulting in radiation change by 0.5–1.0 W/m2 at the top of the atmosphere (TOA). The TOA radiation field is also influenced by cloud cover change due to aerosol-induced circulation change. Such aerosol effects on precipitation highly depend on the existence of a deep convection system: interactions between aerosols and ice clouds create dipole precipita-tion anomalies in the Asian monsoon regions; while in West Africa, enhanced convections are constrained by anticyclone effects at high levels and little precipitation increase is found. We also conduct an experiment to assess interactions between aerosols and liquid clouds and compare the climatic effects with that due to ice clouds. Radiation and temperature changes generated by liquid clouds are normally 1–2 times larger than those generated by ice clouds. The radiation change has a closer relationship to liquid cloud droplet size than liquid cloud cover, in contrast with what we find for ice clouds.
Keywords Aerosol first indirect effect · AGCM · East Asia · West Africa · GOCART data
1 Introduction
Aerosols play an important role in the earth energy bal-ance, cloud–radiation interactions, and global and regional weather and climate system (Haywood and Boucher 2000; Lohmann and Feichter 2005; Tao et al. 2012; Li et al. 2016). Despite in progress in recent aerosol and cloud researches, assessing the aerosols and cloud effect remains as the larg-est uncertainty in interpretations of Earth’s changing energy
budget and predictions of future climate changes (IPCC 2013).
Aerosols are found to affect cloud droplet/particle num-ber, effective radius (Re), and cloud water content, referred to as the aerosol indirect effect. The aerosol indirect effect is usually divided into two components: the first indirect effect, whereby an increase in aerosol concentration causes an increase in droplet/particle concentration, and the sec-ond indirect effect, whereby the reduction in cloud droplet/particle size results in changes in precipitation efficiency (Penner et al. 2001). The first and second indirect effects are also termed as the “cloud albedo” and “cloud lifetime” effects, respectively.
Figure 1 is a schematic diagram that illustrates the aerosol indirect radiative effects on both ice and liquid clouds, in which aerosols are released primarily from the land surface and further affect surface radiation budget and precipitation. Aerosol effects on liquid clouds are relatively simple because only the liquid phase is involved. Since the 1970s, several microphysical, thermodynamic, and dynamic processes have been proposed and tested (Twomey 1974; Albrecht 1989;
* Yongkang Xue [email protected]
1 Department of Geography, University of California, Los Angeles, CA 90095, USA
2 Department of Atmospheric and Oceanic Sciences, University of California, Los Angeles, CA 90095, USA
3 Joint Institute for Regional Earth System Science and Engineering, University of California, Los Angeles, CA 90095, USA
4 Jet Propulsion Laboratory, California Institute of Technology, Pasadena, CA, USA

H. Huang et al.
1 3
Kaufman and Fraser 1997). Current aerosol research gen-erally agrees that the presence of aerosols provides more cloud condensation nuclei, which increases the cloud droplet number concentration (CDNC) that decreases Re under fixed liquid water path (LWP) conditions, called the aerosol first indirect effect (Feingold et al. 2003; Kim et al. 2008). This is usually accompanied by an increase in cloud albedo, an enhanced reflection, and a cooling effect (Twomey 1974). Smaller Re also means that it takes longer to reach sizes large enough for precipitation, named as the aerosol second indirect effect. Drizzle suppression has been consistently observed and simulated in polluted air, which is attributed to this effect (Albrecht 1989). Moreover, the aerosol second indirect effect may enhance cloud lifetime and cloud cover, imposing an additional surface cooling.
A number of studies have been carried out to explain the aerosol–liquid clouds interactions (ACI) in recent years. Intensified deep convection in polluted conditions due to aer-osol processes is reported in several studies (Tao et al. 2007; Rosenfeld et al. 2008; Lebo and Seinfeld 2011; Li et al. 2011; Lebo 2014; Lebo and Morrison 2014). Some studies suggested that the delayed precipitation due to aerosol–cloud interactions leads to an invigoration of upward wind and more persistent updrafts above the freezing (Rosenfeld et al. 2008; Li et al. 2011). Other studies related the convective invigoration to stronger low-level convergence caused by the interactions between the aerosol-induced cold pool and the lower-level wind shear (Tao et al. 2007; Lebo and Sein-feld 2011; Lebo 2014; Lebo and Morrison 2014). Moreover,
coupled with atmospheric dynamics, ACI may produce a chain of complex interactions with monsoon climate and weather events (Li et al. 2016).
There were fewer observations of ice and mixed-phase clouds and related analyses compared to liquid clouds. Some early studies revealed complex interactions between radia-tive heating and ice microphysics and indicated the need for sophisticated models to properly simulate the cirrus cloud life cycle (Ackerman et al. 1988; Sassen and Cho 1992). Previous laboratory experiment on homogeneous nuclea-tion and various heterogeneous nucleation modes sug-gested the formation of ice clouds was more complex than liquid clouds (Diehl and Mitra 1998). In recent years, more remote sensing data are available from the NASA’s A-Train (Aqua, Aura, CloudSat and CALIPSO satellites) and other lidar-based ground cloud observations such as the NASA Micro-Pulse Lidar Network (MPLNET) (Welton et al. 2001; Campbell et al. 2002; L’Ecuyer and Jiang 2010; Zhao et al. 2018). Based on the CloudSat radar and CALIPSO lidar, Berry and Mace (2014) investigated the distribution, micro-physical properties, and radiative properties of tropical ice clouds in Southeast Asia. They found the warming effect of the cirrus clouds had been almost fully compromised by the surface cooling effect there. Recent studies by Campbell et al. (2016) and Lolli et al. (2017) showed the contributions of cirrus cloud to global radiation budgets. However, it is hard to reduce the uncertainty in the estimation of ice cloud radiative forcing.
After evaluating both cloud and water vapor simula-tions in CMIP5 climate models, Jiang et al. (2013) showed that although many models added some treatments for aerosol–liquid clouds interactions, the number of GCMs including aerosol effects on ice clouds is somewhat lack-ing, mainly because of the large uncertainties in ice cloud nucleation modes and limited computational resources (Gu et al. 2012). Most GCMs have used prescribed ice particle sizes for the sake of computational cost while others have built the parameterization by relating ice crystal size to ice water content (IWC) and temperature (Gu et al. 2012). In early GCM studies considering aerosol indirect effect on ice clouds, most only focused on certain heterogeneous nuclea-tion microphysics processes which subsequently affect cloud properties (Storelvmo et al. 2008; Yun and Penner 2012), and only limited aerosol types were included, such as sulfate, soot, and dust (Penner et al. 2009; Liu et al. 2012). In this study, we employ the ice cloud parameterization developed by Jiang et al. (2011), which expands from the traditional Re-IWC relationship to the Re-IWC-AOD (aerosol optical depth) relationship, with the NCEP Global Forecast Sys-tem (GFS). This parameterization makes use of data from A-Train satellites coupled with recent developments in aerosol research to provide insight towards including the aerosol indirect effect on ice clouds in GCMs (L’Ecuyer
Fig. 1 Schematic diagram of aerosol indirect radiative effect on ice clouds and liquid clouds. CCN denotes cloud condensation nuclei and IN represents ice forming nuclei. CDNC denotes the cloud droplet number concentration, and IP represents the number concentration of ice particles (adapted from Lohmann and Feichter 2005)

Assessing aerosol indirect effect on clouds and regional climate of East/South Asia and West…
1 3
and Jiang 2010). This parameterization does not distinguish between different microphysics processes which are not fully understood and may induce large uncertainties. Moreover, it applies total AOD to represent aerosol loading and is not restricted to certain types of aerosols. The relatively sim-ple mathematical expression makes this formulation easy to incorporate in GCMs to study aerosol indirect effects.
This parameterization has been adopted by Gu et al. (2012) to investigate dust aerosol impact on the North Afri-can climate, by prescribing AOD = 0.5 for North Africa and AOD = 0.1 for elsewhere. They found that reduced ice crystal size resulted in less outgoing longwave radia-tion (OLR) and more upward shortwave radiation (USW) at TOA in cloudy regions due to the aerosol first indirect effect. Precipitation was found to increase corresponding to enhanced convection. Our experiment adopts more rea-sonable AOD estimation of the aerosol mixing ratio from the Goddard Chemistry Aerosol Radiation and Transport (GOCART) data (Chin et al. 2002). In this work, we extend the investigation to the aerosol indirect radiative effect and large-scale circulation in major monsoon regions, i.e., East/South Asia, and West Africa. Here aerosol indirect radiative effect has been used to present the instantaneous radiative impact of atmosphere particles on TOA and surface energy balance due to the interactions between aerosol and clouds (including climate feedbacks). We also include a set of experiments assessing aerosol effects due to liquid clouds, which is used to compare with those due to ice clouds to make a preliminary evaluation on the relative effects of dif-ferent aerosol–cloud interactions. The following chapters of this paper are organized as follows: in Sect. 2, we provide a brief introduction to the cloud parameterizations used for aerosols, followed by a description of the GFS, aerosol data-set, and experiment design in Sect. 3; the model simulation results are presented in Sects. 4 and 5, including effects on ice clouds and liquid clouds; and conclusions are given in Sect. 6.
2 Description of cloud parameterization
2.1 Parameterization of aerosol effect on ice clouds
We followed the approach presented by Jiang et al. (2011), in which ice crystal size was related to both AOD and IWC. This formulation used cloud top ice cloud effec-tive radius (called Rei afterward) and AOD from Aqua satellite’s Moderate-resolution Imaging Spectroradiom-eter (MODIS) MYD08-D3 and MYD04-L2 datasets. The IWC was from Aura satellite’s Microwave Limb Sounder (MLS) Version 2.2 Level 2 data (Wu et al. 2008). The MODIS and MLS measurements were collocated by aver-aging the MODIS data onto the MLS footprints (Jiang
et al. 2009). 4 years satellite data from August 2004 to July 2008 has been employed in the parameterization, and the relationships were derived using 215 hPa IWC, at which level IWC is a good indicator of convective intensity (Gu et al. 2012). Using least-squares fitting, Jiang et al. (2011) derived an empirical formula to describe the variations with convection and AOD:
The equation has three different terms, and each repre-sents different processes. The first term, Rei = � ⋅ AOD� represents the modulation of AOD on Rei where η is a param-eter determining how strong the aerosol effect is, and ε is a scaling constant. The second term, [1 − exp(−CONVi∕�)] , represents the growth of Rei with respect to convection. The convective index CONVi is defined as CONVi = IWCi∕IWC , where IWCi represents an individual measurement of 215 hPa. IW̄C is the mean of all 215-hPa measurements. The third term, 1∕exp(� ⋅ CONVi) , is formulated to model the decrease of Rei with CONVi , especially at large CONVi valuces. ε, α, β, and η are parameters determined by per-forming a two-dimensional least-squares fitting to NASA’s A-Train observational data.
The ice cloud parameterization developed by Jiang et al. (2011) represented one of the first attempts to capture aero-sol indirect effects on Rei. The simple mathematical expres-sion can be easily applied in the climate models to estimate the first indirect effects on ice clouds. In the parameteri-zation, the dependence of Rei on convection and AOD is assumed to be decoupled, i.e., Rei = rAOD ⋅ rCONV , in order to obtain a simple mathematical expression for the observed Rei-CONV-AOD relation.
2.2 Parameterization of aerosol effect on liquid clouds
We employed the empirically derived liquid cloud para-metrization developed by Boucher and Lohmann (1995), which was an early attempt to relate CDNC to the sulfate aerosol mixing ratio. This parameterization has been widely adopted by different GCMs and has generated many consist-ent results, despite the difference in estimated radiative effect on the global scale (Lohmann and Roeckner 1996; Rotstayn 1999; Ming et al. 2005). Considering the different cloud amount, cloud water, and auto-conversion schemes in those GCMs, it seems that Boucher’s parameterization captures some core processes of aerosol–cloud interactions. Since aerosol effects on liquid clouds in this study are only used to compare with those on ice clouds, we adopt this early parameterization considering its rather stable performance.
(1)
Rei = � ⋅ AOD�⋅
[
1 − exp
(
−CONVi
�
)]
⋅ exp(
−� ⋅ CONVi
)

H. Huang et al.
1 3
3 Model, datasets and experiment design
3.1 Model description and datasets
In this paper, we adopt the GFS in the second version of the NCEP Climate Forecast (CFS) coupled with SSiB2 (CFSv2/SSiB2). The horizontal resolution of the model is set at T126, which represents grid points spaced equally over 384 longitudes and 190 latitudes, approximately 1° × 1° at the equator (Saha et al. 2014). Sixty-four verti-cal levels are used, most of which are in the troposphere. Parameterization of convective gravity wave drag is based on the theory of Chun and Baik (1998). Shortwave and longwave radiation are parameterized using the Rapid Radiative Transfer Models (RRTMG) RRTMG_SW (v3.8) and RRTMG_LW (v4.82) from Atmospheric and Environ-mental Research (AER) (Mlawer et al. 1997; Robert et al. 2003; Clough et al. 2005). The cloud microphysical pro-cesses except auto-conversion are parameterized following Zhao and Carr (1997). This prognostic cloud parameteri-zation scheme includes both cloud water and cloud ice, as well as some microphysical processes for both the con-vective and grid-scale precipitation production. The auto-conversion parameterization in GFS is based on Sundqvist et al. (1989). The simplified Arakawa–Schubert (SAS) has been used as the convection scheme in the GFS model, and the mass-flux shallow convection scheme is parameterized based on the SAS with a few key modifications (Arakawa and Schubert 1974; Pan and Wu 1994). The parameteriza-tion developed by Hong and Pan (1996) was incorporated to describe the planetary boundary layer diffusion. The NCEP GFS is coupled with the second generation of the Simplified Simple Biosphere Model (SSiB2) as the land surface model (Xue et al. 1991, 2004; Zhan et al. 2003).
The NCEP GFS has been modified to simulate the role of aerosols in affecting radiation field and cloud proper-ties by applying the simulated global aerosol dataset from the GOCART model. The GOCART data has been widely used in many aerosol studies in the research community and produced reasonable results (Kaufman et al. 2002; Gu
et al. 2015). The monthly 1998–2010 climatology aero-sol mixing ratio in GOCART has been generated using assimilated meteorology fields from the Data Assimila-tion System (GEOS DAS) (Chin et al. 2000, 2002). The GOCART simulates major tropospheric aerosol compo-nents, including sulfate, dust, black carbon (BC), organic carbon (OC), and sea-salt aerosols (accumulation mode and coarse mode), among which dust is divided into 5 bin sizes (0.1–1, 1–1.8, 1.8–3.0, 3.0–6.0, and 6.0–10 µm). Three-dimensional monthly averages of the aerosol mixing ratio are available with a horizontal resolution of 1° lati-tude × 1.25° longitude degrees and 72 vertical layers. The GOCART data also provide the optical properties (i.e., extinction, scattering and absorption coefficient, single-scattering albedo, asymmetry factor, and phase function) of all types of aerosols under 36 relative humidity condi-tions. The modified GFS model transforms climatologi-cal aerosol GOCART data set onto model grids and com-putes aerosol optical properties, single scattering albedo, and asymmetry parameter for each model vertical layer. It computes mean aerosols optical properties over each shortwave and longwave radiation spectral band for all aerosol components using the Mie scattering to incorpo-rate aerosol direct effect. The 550 nm AOD has been used in the Jiang’s parameterization to study aerosol indirect effect on ice clouds.
3.2 Experiment design
In this work, we conducted model simulations from Janu-ary 1st, 2006, for 6 years, using a prescribed climatology SST from WAMME II (Xue et al. 2016) to exclude feedback from the ocean. Aerosol direct effect was included in all experiments by incorporating monthly climatology of aero-sol mixing ratio from GOCART. Our experiment design is summerized Table 1.
Case 1 (ICE-CTL1) was used to analyze the climatic effect of aerosols due to the indirect effect on ice clouds. In the control simulation, CTL1, AOD calculated from GOCART aerosol mixing ratio was employed for the aero-sol direct effect scheme in the model. Whereas AOD = 0.01
Table 1 Table of experiment
Case Aero direct effect scheme Aero–ice cloud interaction scheme Aero–liq cloud interactions scheme Note
Case 1 CTL1 AOD (GOCART mixing ratio) Jiang (AOD = 0.01) – ICE minus CTL1 shows aerosol – ice clouds interaction
ICE Jiang (GOCART mixing ratio) –
Case 2 CTL2 AOD (GOCART mixing ratio) – Boucher (pre-industrial sulfate mix-ing ratio)
LIQ minus CTL2 shows aerosol – liquid clouds interaction
LIQ – Boucher (GOCART sulfate mixing ratio)

Assessing aerosol indirect effect on clouds and regional climate of East/South Asia and West…
1 3
was used in the aerosols - ice clouds interactions scheme, i.e., the aerosol indirect effect scheme. In the GOCART data set, AOD in JJA is generally smaller than 0.1 over most parts of the ocean (tropical and mid-latitude Pacific, mid-latitude Atlantic Ocean, and tropical Indian Ocean). Over the tropical Pacific Ocean, it is even smaller than 0.05. As such, 0.01 has been selected in this study to represent a clean condition in the atmosphere for the CTL1. In the ICE experiment, AOD calculated from GOCART aerosol mixing ratio was still applied for the aerosol direct effect scheme. The ice cloud interaction scheme (Jiang et al. 2011) used the GOCART data to represent a current aerosol scenario. There was no aerosol liquid cloud interaction scheme in the original GFS. Therefore, in Case 1 aerosol indirect effects on liquid clouds were not included (Table 1).
We used Case 2 (LIQ-CTL2) to assess the aerosol indi-rect effect on liquid clouds (Table 1). In Case 2, the aerosol direct effect was included in both CTL2 and LIQ by using the AOD calculated from GOCART aerosol mixing ratio. A pre-industrial sulfate mixing ratio averaged from 256 model runs from AMIP CAM5 (Qian et al. 2015) was employed in the liquid cloud parameterization in CTL2. GOCART sulfate concentration was used in the liquid cloud parameterization in LIQ to be representative of current aerosol distribution. There are no interactions between aerosol and ice clouds in Case 2.
The model is set to output at 6-hourly intervals (e.g., at 06:00, 12:00, 18:00, 24:00 UTC) and averaged to get monthly results. The first year has been used for spin-up and the last five years have been averaged for analyses, and we focus on results for June–July–August (JJA) during which there are strong interactions between aerosols, clouds, and the monsoon. It should be noted that the aerosol direct effect is included in all experiments by employing GOCART data in radiative processes. Moreover, SST response to aerosol effects and the feedbacks to the climate system through the air-sea coupling has been excluded to better focus on the mechanisms of aerosol indirect effects. This methodology has been widely used in previous aerosol-climate interac-tion studies (Menon et al. 2002; Lau and Kim 2006; Jiang et al. 2013).
4 Aerosol effect on ice clouds
This study continues the work of Gu et al. (2015), who investigated the direct radiative effect of dust aerosols on the regional climate of North Africa and South/East Asia. The extensive evaluations of the GFS/SSiB2 in the climate simulation have been presented in previous studies (Xue et al. 2004, 2010; Gu et al. 2017). In this study, we have also compared the GFS/SSiB2’s simulation with the Cli-matic Research Unit (CRU) time-series (TS) Version 3.22
temperature and the Version-2 Global Precipitation Cli-matology Project (GPCP) precipitation (Adler et al. 2003; Harris et al. 2014). The results show that GFSv2/SSiB2 captures the main features of global temperature pattern although a warm bias exists over the Northern Hemisphere high latitudes (figure not shown). As for precipitation, the GFS/SSiB2 captures the tropical rain belt and three major summer monsoons in West Africa, South Asia, and East Asia compared to the GPCP dataset but with a dry bias in West African and South Asian monsoon precipitation (not shown), generally consistent with previous studies. The pre-cipitation deficit may arise from the underestimation of the intense rainfall events caused by neglecting aerosol–cloud interactions (Jiang et al. 2017) and the poor performance in simulating atmospheric mesoscale systems in GCM (Gos-wami and Goswami 2017).
We first evaluate the aerosol indirect effect on ice clouds using the 5-year simulation results in Case 1. Figure 2 illus-trates the difference of AOD used in Jiang’s parameteriza-tion between ICE (AOD calculated from GOCART mixing ratio) and CTL1 (AOD = 0.01) in June–July–August (JJA). Total AOD has the largest magnitude over North Africa and West Asia, among which dust aerosol is dominant. Other regions with large aerosols include South Africa, South Asia, and East Asia, where sulfate aerosol plays a compara-ble role as dust aerosol. The BC distribution is similar to that of sulfate with a smaller magnitude, except for tropical for-est regions where biomass burnings release a large portion of soot (not shown). In this study, we focus on the aerosol effects in selected regions (latitude: 5°S − 40°N; longitude 40°W–130°E) including West Africa, South Asia, and East Asia, which have both large AOD and high cloud cover and are supposed to have large aerosol–cloud interactions.
Figure 3a shows the difference in Rei between ICE and CTL. With increased aerosol loading, Rei has decreased globally, especially in West Africa, East/South Asia, and in the North Indian Ocean due to interactions between aero-sol and ice clouds (Fig. 2). According to Twomey (1974), aerosols provide more cloud condensation nuclei, which increases the cloud droplet number concentration and decreases cloud droplet size. In a recent study of aerosol indirect effect on ice crystal size, Zhao et al. (2018) showed that Rei decreased with increased aerosol loading in moist conditions, consistent with the “Twomey effect” for liquid clouds. Our simulation result is consistent with previous studies showing that Rei decreases with increasing aerosol concentration (Jiang et al. 2008). The maximum change occurs in the North Indian Ocean where the magnitude is about − 5 μm . Over most regions, ice clouds with smaller particles have higher albedo, thus reflecting more short-wave radiation at TOA (Fig. 3b). The changes in shortwave radiation are closely correlated with changes in Rei in most regions, except in part of the Sahel region and the equatorial

H. Huang et al.
1 3
Fig. 2 Differences of AOD used in Jiang’s parameterization between ICE (AOD from GOCART data) and CTL1 (AOD = 0.01) in June–July–August (JJA)
Fig. 3 Differences of a Rei at 215 hPa (µm), b TOA USW (W/m2), c TOA OLR (W/m2), d TOA net radiation (W/m2), e high cloud cover (%), and f IWC at 200 hPa (mg/kg) in JJA between ICE and CTL1 (ICE–CTL1)

Assessing aerosol indirect effect on clouds and regional climate of East/South Asia and West…
1 3
Indian Ocean. Meanwhile, the OLR decreases in South/East Asia because smaller particles trap more infrared radiation, while in North Africa and the equatorial Indian Ocean, OLR increases can be found (Fig. 3c). The change of radiation on TOA in North Africa and the Indian Ocean will be discussed in the next paragraph. It is harder to draw a conclusion as to whether aerosols exert a positive or negative net radiative effect on TOA because it depends on the relative contribu-tion of shortwave and longwave radiation change. In this experiment, TOA radiation is decreased by 0.62 W/m2 on a global scale corresponding to increased aerosol loading.
We further investigate why the response of USW and OLR in North Africa and the Equatorial Indian Ocean is different from that in East and South Asia. The previous discussion suggests TOA USW/OLR negatively/positively correlated to the Rei change, respectively. In addition, TOA radiation is also influenced by cloud cover change. Figure 3e shows high cloud cover change, which is mostly related to ice clouds. Total cloud cover change in the entire atmos-pheric column is similar to that of high cloud cover with a larger magnitude. Changes in cloud cover are positively/neg-atively correlated to the TOA USW/OLR, i.e., greater cloud
cover reflects more solar radiation and absorbs more infra-red radiation, thus increases the upward shortwave radiation and decreases the OLR. In South/East Asia, both enhanced high cloud cover and reduced Rei increases TOA USW and decreases TOA OLR. In West Africa and Equatorial Indian Ocean, the reduction in cloud cover leads to decrease/increase in TOA USW/OLR, opposite to the radiative effect of reduced Rei. The model results suggest the TOA USW and OLR are dominated by the cloud cover change compared to Rei change in West Africa and Equatorial Indian Ocean (Fig. 3e). The change in cloud cover depends on convection, precipitation efficiency, and cloud lifetime and is closely related to local microphysical conditions. Figure 3f shows that change in IWC at 200 hPa, which is approximately the level of convective detrainment (Folkins and Martin 2005). The 200 hPa IWC is normally assumed as a good indicator of convective intensity. A reduction in convection may help explain the cloud cover change in North and West Africa (Fig. 3f).
To better investigate the relationship between changes in the radiation field and changes in Rei/cloud cover, we further check the correlation between △USW and △Rei, △ULW
Fig. 4 Differences of TOA USW (a, c) and ULW (b, d) as a function of Rei change (top panel) and high cloud cover (bottom panel) in JJA between ICE and CTL1 (ICE-CTL1). Each point stands for one grid point in the selected region

H. Huang et al.
1 3
and △Rei, △USW and △CC, and △ULW and △CC in the selected region (Fig. 4). The region selected here is the same one shown in Fig. 3. Here △USW, △ULW, △Rei, and △CC are used to denote the difference of USW, ULW, Rei, and cloud cover between ICE and CTL1 (ICE - CTL1). Each point in Fig. 4 stands for one grid point in the selected region. We then calculate the cross-correlation between △USW and △Rei, △ULW and △Rei, △USW and △CC, and △ULW and △CC in the selected region. T test ( t =
√
n − 2r
√
1−r2 ) has been applied to examine if the cor-
relation is significant and each plot shows a highly signifi-cant correlation (p = 0.000). Compared to △Rei, △CC has a closer correlation to both △USW and △ULW, and the correlation between △CC and △ULW can be as high as − 0.91(Fig. 4d). Moreover, △ULW (Fig. 4b, d) has a higher correlation to both △Rei and △CC, compared to that of △USW (Fig. 4a, c), indicating that spatial pattern of △ULW is similar to that of △CC and △Rei. Figure 4 suggests that aerosols may perturb the radiative budget on TOA through both their effects on Rei and the secondary effects on cloud cover. The radiation perturbation due to cloud cover change is likely to be as important as that due to particle size change.
Figure 5a, b show aerosol effects on surface net radiation and surface latent heat flux. Surface radiation decreases by 1.13 W/m2 globally (Fig. 5a). A similar pattern is observed in latent heat change, with a smaller magnitude (Fig. 5b). The energy budget over the ocean is not analyzed due to fixed SST. The precipitation change (Fig. 5c) generally cor-responds to the changes in IWC (Fig. 3f) and cloud cover (Fig. 3e) in the monsoon regions. It should be noted that in
the cloud parameterization of GFS, precipitation is diag-nostically calculated directly from the cloud mixing ratio (Zhao and Carr 1997) and the influence of particle size on precipitation efficiency is not considered (Kessler 1995). Therefore, the effect of aerosol on the auto-conversion rate and precipitation is not included and aerosol second indi-rect effect is neglected in this study. Precipitation change in Fig. 5c shows quite different patterns in the Asian and West African monsoon regions. Over East and South Asia, several dipole anomalies are found, indicating that aerosols affect precipitation regions through modulation of microphysical processes affecting large-scale dynamic conditions; whereas in West Africa, only the decrease in precipitation is found. The different mechanisms of aerosol effect on precipitation over different monsoon regions will be further discussed later. Simulations show a general decrease in surface tem-perature (Fig. 5d) in response to a reduction in surface radia-tion (Fig. 5a). In West Africa, the increase in temperature is caused by decreased latent heat corresponding to weakened precipitation.
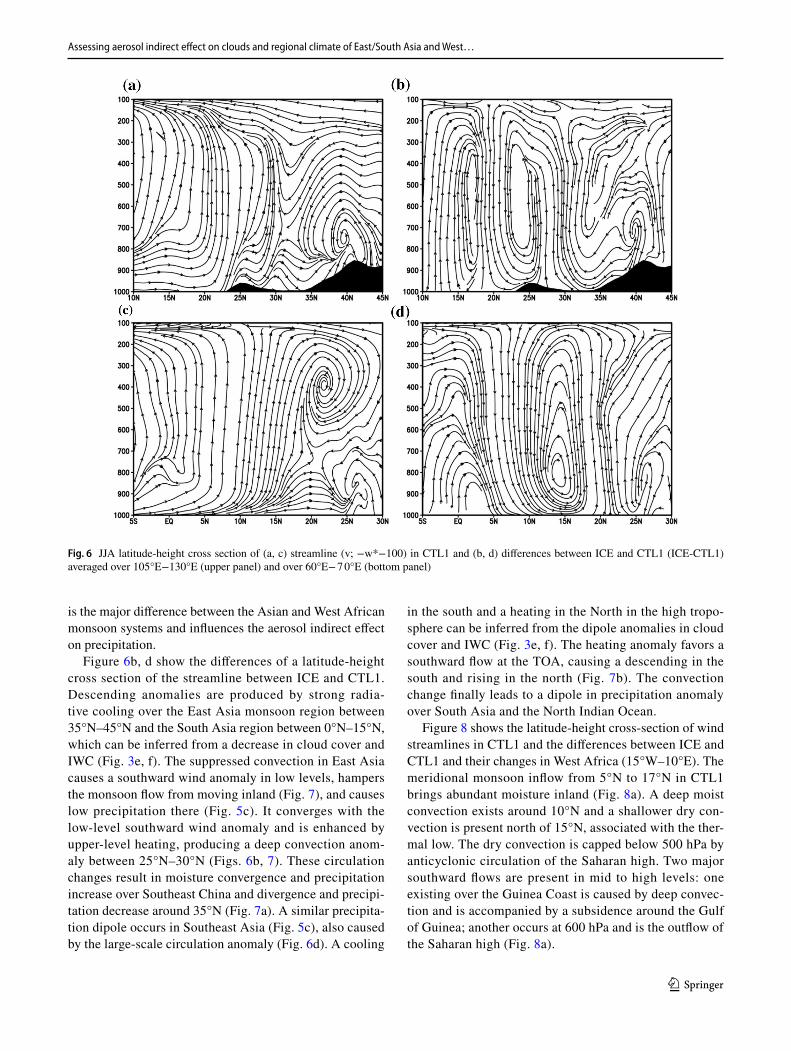
Figure 6 shows the latitude-height cross section of the streamline in CTL1 and the differences between ICE and CTL1 in East Asia (upper panel) and South Asia (bottom panel). Three major convection zones are depicted in Fig. 6a, c. The first one occurs around 10°N in tropical regions. Another deep convection is found over Southeast China from 20°N to 32°N associated with the ITCZ, accompanied by the East Asian monsoon. The last one exists north of 40°N, where the monsoon inflow is elevated by topography and forms a cyclone in the south. Similar deep convections are found in South Asian monsoon regions from 10°N to 15°N (Fig. 6c). The prevalence of deep convection systems
Fig. 5 JJA differences of a surface net radiation (W/m2), b latent heat (W/m2), c precipitation (mm/day), and d surface temperature (K) between ICE and CTL1 (ICE-CTL1)
Assessing aerosol indirect effect on clouds and regional climate of East/South Asia and West…
1 3
is the major difference between the Asian and West African monsoon systems and influences the aerosol indirect effect on precipitation.
Figure 6b, d show the differences of a latitude-height cross section of the streamline between ICE and CTL1. Descending anomalies are produced by strong radia-tive cooling over the East Asia monsoon region between 35°N–45°N and the South Asia region between 0°N–15°N, which can be inferred from a decrease in cloud cover and IWC (Fig. 3e, f). The suppressed convection in East Asia causes a southward wind anomaly in low levels, hampers the monsoon flow from moving inland (Fig. 7), and causes low precipitation there (Fig. 5c). It converges with the low-level southward wind anomaly and is enhanced by upper-level heating, producing a deep convection anom-aly between 25°N–30°N (Figs. 6b, 7). These circulation changes result in moisture convergence and precipitation increase over Southeast China and divergence and precipi-tation decrease around 35°N (Fig. 7a). A similar precipita-tion dipole occurs in Southeast Asia (Fig. 5c), also caused by the large-scale circulation anomaly (Fig. 6d). A cooling
in the south and a heating in the North in the high tropo-sphere can be inferred from the dipole anomalies in cloud cover and IWC (Fig. 3e, f). The heating anomaly favors a southward flow at the TOA, causing a descending in the south and rising in the north (Fig. 7b). The convection change finally leads to a dipole in precipitation anomaly over South Asia and the North Indian Ocean.
Figure 8 shows the latitude-height cross-section of wind streamlines in CTL1 and the differences between ICE and CTL1 and their changes in West Africa (15°W–10°E). The meridional monsoon inflow from 5°N to 17°N in CTL1 brings abundant moisture inland (Fig. 8a). A deep moist convection exists around 10°N and a shallower dry con-vection is present north of 15°N, associated with the ther-mal low. The dry convection is capped below 500 hPa by anticyclonic circulation of the Saharan high. Two major southward flows are present in mid to high levels: one existing over the Guinea Coast is caused by deep convec-tion and is accompanied by a subsidence around the Gulf of Guinea; another occurs at 600 hPa and is the outflow of the Saharan high (Fig. 8a).
Fig. 6 JJA latitude-height cross section of (a, c) streamline (v; −w*−100) in CTL1 and (b, d) differences between ICE and CTL1 (ICE-CTL1) averaged over 105°E−130°E (upper panel) and over 60°E− 7 0°E (bottom panel)

H. Huang et al.
1 3
Similar to the scenario in the Asian monsoon, a strong descending anomaly from TOA to land surface is present in the deep convection regime in West Africa (Fig. 8b),
caused by longwave cooling due to less cloud cover (Fig. 3e). The descendence is found in all levels in the deep convection zone from 10°N to 15°N (Fig. 8b). Figure 9a
Fig. 7 JJA differences of a moisture flux (m/s) at 850 hPa and vertically integrated moisture flux divergence (mm/day) and b 500 hPa vertical velocity (mb/day) in East and Southeast Asia between ICE and CTL1 (ICE-CTL1)
Fig. 8 JJA latitude-height cross-section of a streamline (v; -w*-100) in CTL1 and b differences between ICE and CTL1 averaged over 15°W–10°E (ICE-CTL1)
Fig. 9 JJA differences of a moisture flux (m/s) at 850 hPa and vertically integrated moisture flux divergence (mm/day) and b 500 hPa vertical velocity (mb/day) in West Africa between ICE and CTL1 (ICE-CTL1)
Assessing aerosol indirect effect on clouds and regional climate of East/South Asia and West…
1 3
displays the anomaly of 850-hPa moisture flux and verti-cally integrated moisture flux divergence in West Africa, which shows moisture flux divergence at low levels, corre-sponding to decreased convection. This moisture divergence directly leads to precipitation decrease over the Sahel region (Fig. 5c). The weakened convection also causes surface tem-perature increase by 0.5 K from 5°N to 20°N (Fig. 5d). For other regions outside the deep convection zone, although strengthened convection can be found around 15°N, it is con-fined below 600 hPa by the Saharan High (Fig. 8b). Conse-quently, it does not result in apparent IWC increase (Fig. 3f) and precipitation increase (Fig. 5c) in the north. Figure 9b shows the 500-hPa vertical velocity over West Africa. Only a few regions show convection increase and they are rather weak compared with the strong convection decrease in the south. Because the enhanced convection is constrained at low levels by the Saharan high, it does not result in apparent precipitation increase in the Northern part of West Africa. Consequently, no apparent precipitation dipole anomaly is found in the African monsoon region.
5 Comparison between aerosol effects on liquid clouds and ice clouds.
A set of experiments was designed to compare the relative magnitude of climate impact due to aerosol effect on liq-uid clouds with that on ice clouds. Similar to the ice cloud experiments, the liquid cloud experiments are designed to show the difference between a current scenario and a clean scenario. In CTL2, pre-industrial sulfate concentration, which mainly comes from natural sources such as forest fires or oxidation of dimethyl sulfide (DMS) is specified. In the LIQ experiment (Table 1), GOCART sulfate aerosol is spec-ified. Industrial sulfate aerosols are produced by oxidation of SO2 and emitted from anthropogenic activities such as coal burning (Chin et al. 2002). The relatively short lifetime of sulfate makes its spatial distribution more heterogeneous. The source regions (East Asia, South Asia, Europe, and East America) normally have larger aerosol concentrations.
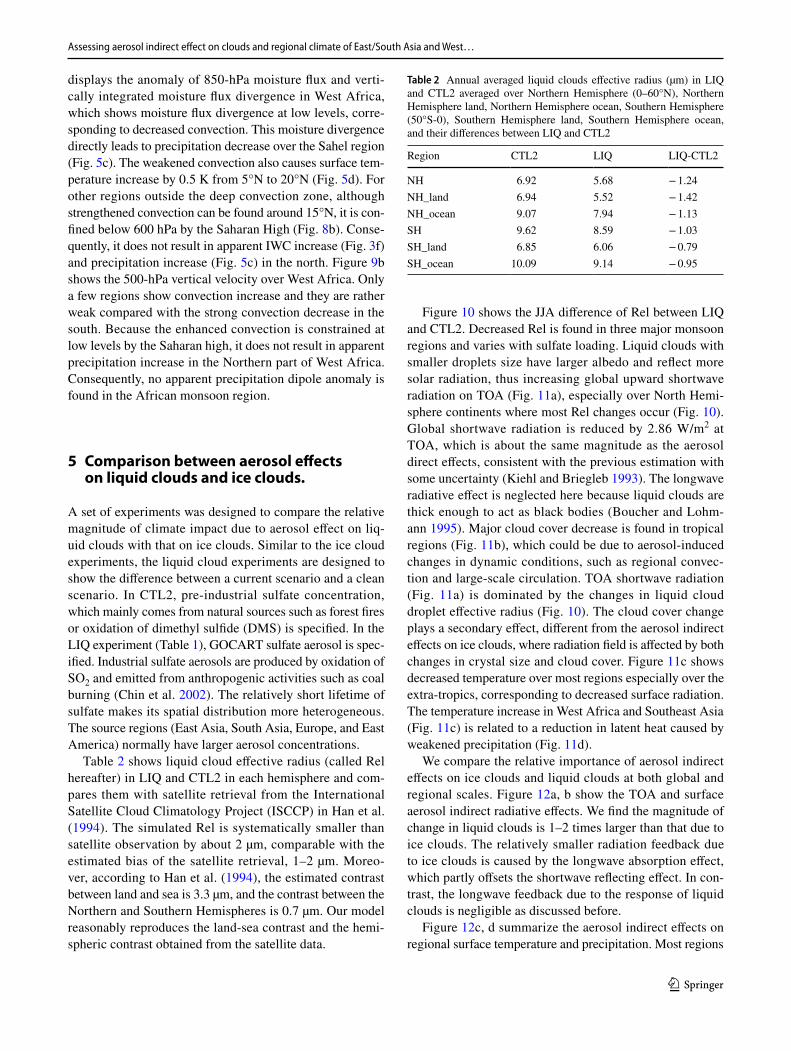
Table 2 shows liquid cloud effective radius (called Rel hereafter) in LIQ and CTL2 in each hemisphere and com-pares them with satellite retrieval from the International Satellite Cloud Climatology Project (ISCCP) in Han et al. (1994). The simulated Rel is systematically smaller than satellite observation by about 2 µm, comparable with the estimated bias of the satellite retrieval, 1–2 µm. Moreo-ver, according to Han et al. (1994), the estimated contrast between land and sea is 3.3 µm, and the contrast between the Northern and Southern Hemispheres is 0.7 µm. Our model reasonably reproduces the land-sea contrast and the hemi-spheric contrast obtained from the satellite data.
Figure 10 shows the JJA difference of Rel between LIQ and CTL2. Decreased Rel is found in three major monsoon regions and varies with sulfate loading. Liquid clouds with smaller droplets size have larger albedo and reflect more solar radiation, thus increasing global upward shortwave radiation on TOA (Fig. 11a), especially over North Hemi-sphere continents where most Rel changes occur (Fig. 10). Global shortwave radiation is reduced by 2.86 W/m2 at TOA, which is about the same magnitude as the aerosol direct effects, consistent with the previous estimation with some uncertainty (Kiehl and Briegleb 1993). The longwave radiative effect is neglected here because liquid clouds are thick enough to act as black bodies (Boucher and Lohm-ann 1995). Major cloud cover decrease is found in tropical regions (Fig. 11b), which could be due to aerosol-induced changes in dynamic conditions, such as regional convec-tion and large-scale circulation. TOA shortwave radiation (Fig. 11a) is dominated by the changes in liquid cloud droplet effective radius (Fig. 10). The cloud cover change plays a secondary effect, different from the aerosol indirect effects on ice clouds, where radiation field is affected by both changes in crystal size and cloud cover. Figure 11c shows decreased temperature over most regions especially over the extra-tropics, corresponding to decreased surface radiation. The temperature increase in West Africa and Southeast Asia (Fig. 11c) is related to a reduction in latent heat caused by weakened precipitation (Fig. 11d).
We compare the relative importance of aerosol indirect effects on ice clouds and liquid clouds at both global and regional scales. Figure 12a, b show the TOA and surface aerosol indirect radiative effects. We find the magnitude of change in liquid clouds is 1–2 times larger than that due to ice clouds. The relatively smaller radiation feedback due to ice clouds is caused by the longwave absorption effect, which partly offsets the shortwave reflecting effect. In con-trast, the longwave feedback due to the response of liquid clouds is negligible as discussed before.
Figure 12c, d summarize the aerosol indirect effects on regional surface temperature and precipitation. Most regions
Table 2 Annual averaged liquid clouds effective radius (µm) in LIQ and CTL2 averaged over Northern Hemisphere (0–60°N), Northern Hemisphere land, Northern Hemisphere ocean, Southern Hemisphere (50°S-0), Southern Hemisphere land, Southern Hemisphere ocean, and their differences between LIQ and CTL2
Region CTL2 LIQ LIQ-CTL2
NH 6.92 5.68 − 1.24NH_land 6.94 5.52 − 1.42NH_ocean 9.07 7.94 − 1.13SH 9.62 8.59 − 1.03SH_land 6.85 6.06 − 0.79SH_ocean 10.09 9.14 − 0.95

H. Huang et al.
1 3
show decreased surface temperature resulted from aerosol indirect effects, and the global mean temperature change is 1–2 times larger in liquid clouds than in ice clouds. At the regional scale, temperature response caused by the aerosol indirect effect on ice clouds can be comparable to that caused by liquid clouds. The aerosol indirect effect on globally averaged precipitation is close to zero because pre-cipitation changes are heterogeneous and even with oppo-site signs in different regions. In general, continental pre-cipitation decreases due to aerosol effects on liquid clouds, whereas precipitation changes due to aerosol effects on ice clouds are less conclusive. Nevertheless, aerosols modify the precipitation distribution pattern in regions where the deep convection system exists as discussed earlier. Whether it will cause precipitation increase or decrease in East/South Asia is highly dependent on the specific region we focus on; whereas in West Africa, the enhanced convection anomaly is confined in the lower level, which does not finally result in
precipitation increase. It should be noted that most GCMs, including the GFS, do not consider the impact of cloud drop-lets/particles size change on precipitation efficiency (Gu et al. 2012). Therefore, the differences in precipitation are directly reflected by IWC change (Fig. 3e), which is asso-ciated with the interactions and feedback among aerosols, radiation, clouds, and dynamic field. The microphysical properties are modulated by the first indirect aerosol radia-tive effect and, in turn, affect the simulated climate.
6 Conclusion
This study carries out a series of simulations to investigate the aerosol indirect effect on clouds. The ice cloud param-eterization developed by Jiang et al. (2011) and the liquid cloud parameterization by Boucher and Lohmann (1995) have been incorporated separately to test aerosol indirect
Fig. 10 Differences of Rel (µm) in JJA between LIQ and CTL2 (LIQ-CTL2)
Fig. 11 Differences of in a TOA upward shortwave radiation (W/m2), b column cloud cover (%), c surface temperature (K), and d precipitation (mm/day) in JJA between LIQ and CTL2 (LIQ-CTL2)

Assessing aerosol indirect effect on clouds and regional climate of East/South Asia and West…
1 3
effects on ice clouds and liquid clouds. In the ice cloud experiments (Case 1), the experiments use AOD = 0.01 to represent a clean atmospheric condition and AOD from GOCART for the current scenario. In the liquid cloud exper-iments (Case 2), the pre-industrial sulfate aerosol concentra-tion is used to represent a clean scenario, and the GOCART sulfate concentration from GOCART is used to represent a current scenario. For each experiment, 6-year numerical simulations have been conducted using WAMME II clima-tology SST.
It is shown that aerosols act as ice clouds nuclei, which enhances cloud scattering and absorption effects. Overall, the aerosols first indirect effect results in negative radiative effects at TOA. In addition, the TOA radiation budget is also perturbed by cloud cover changes induced by effects of cloud microphysics and associated convection, with a simi-lar magnitude as the Rei effect. Aerosols mainly change the precipitation distribution pattern and create anomaly dipoles in the South/East Asian regions but not West Africa, where convection is constrained by the Saharan High. Therefore, enhanced convection is confined in the low level, thus result-ing in precipitation decrease only. We also test the sensitivity for different AODs in the clean scenario by using AOD = 0.1 in the control experiment. The conclusions are consistent and comparable in all radiation and climate variables (not shown). Therefore, we suppose the aerosol influence on
regional climate is not very sensitive to the AOD values used for clean conditions as long as the values can properly represent a clean atmosphere.
We also include experiments assessing aerosol indirect effects on liquid clouds and compare with those on ice clouds. Previous studies mostly investigated aerosol indirect effect on either liquid or ice clouds separately. This study includes both effects and provides a preliminary comparison of the relative magnitude of these two effects. Both ice cloud experiments and liquid cloud experiments are designed to show the difference between a current scenario and a clean scenario. Different from ice clouds, the longwave radia-tive changes of liquid clouds are negligible because most of them are thick enough to act as black bodies (Boucher and Lohmann 1995). Radiation and temperature changes generated by aerosol effects on liquid clouds are normally 1–2 times larger than those generated by aerosol effects on ice clouds. Moreover, radiation change is directly related to liquid cloud droplets size change in most regions, different from the aerosol effect on ice clouds.
IPCC (2013) has pointed out that “Clouds and aerosols continue to contribute the largest uncertainty to estimates and interpretations of the Earth’s changing energy budget.” Our simulation results confirm that inherent complexity of aerosol–cloud interactions is the main reason inhibit-ing a better understanding and description of the aerosol
Fig. 12 Aerosol indirect effects on a TOA radiation (W/m2), b surface radiation (W/m2), c surface temperature (K), and d precipitation (mm/day) on the Global scale, Northern Hemisphere, East Asia, West Africa, and South Asia
H. Huang et al.
1 3
indirect effect. Aerosol interactions with ice clouds are dif-ferent from those with liquid clouds in reference to OLR, radiative heating, and their further effects on convection strength and precipitation. Even the aerosol indirect effect on ice clouds varies from region to region depending on different climate dynamic conditions. These features make the aerosol climate effect more dependent on GCM dynamics, microphysical parameterization, and aerosol optical properties provided by aerosol data. Moreover, the parameterizations themselves would induce some bias. The ice cloud parameterization of Jiang et al. (2011) does not include the interactions between microphysical and dynamical processes because they are very compli-cated and are not yet well understood—this is supposed to cause some bias although we do not know how large it could be. The parameterization represents one of the first attempts to use satellite data to quantify the first indirect effect of aerosols on ice clouds for use in climate models. Recent aerosol and clouds measurements from CALIPSO and CloudSat offer vertically-resolved aerosol and clouds distribution, which could be applied to provide a height-resolved ice cloud parameterization. However, different from GOCART, CALIPSO assigned only one aerosol type to each atmospheric layer, rather than a mixture of aero-sol compositions (Omar et al. 2009), which is difficult to be directly introduced to the GFS. Given the huge uncer-tainties estimating aerosol climate effect, we propose that the optimization of aerosol simulation should include the improvement of GCMs, a better description of aerosol optical properties in the aerosol data sets, and the devel-opment of parameterization for aerosol–cloud interactions.
Acknowledgements This work was supported by NSF Grant AGS-1419526. The authors also acknowledge the support by the Jet Pro-pulsion Laboratory, California Institute of Technology, sponsored by NASA. Yu Gu and Bin Zhao are supported by the NSF AGS-1701526 and NASA TASNPP program (Grant 80NSSC18K0985). Yu Gu also acknowledges the support of the Natural Science Foundation of Jiangsu Province, China (No. BK20171230). The data used in this study are available by request to Huilin Huang. We thank Dr. Sarah Lu of the University at Albany, SUNY, and Dr. Zhao Chun of the University of Science and Technology of China for their assistance in obtaining the GOCART aerosol data and the AMIP CAM5 aerosol data.
References
Ackerman TP, Liou KN, Valero FPJ, Pfister L (1988) Heating rates in tropical anvils. J Atmos Sci 45:1606–1623
Adler RF, Huffman GJ, Chang A, Ferraro R, Xie PP, Janowiak J, Rudolf B, Schneider U, Curtis S, Bolvin D, Gruber A, Susskind J, Arkin P, Nelkin E (2003) The version-2 global precipitation climatology project (GPCP) monthly precipitation analysis (1979-present). J Hydrometeorol 4:1147–1167
Albrecht BA (1989) Aerosols, cloud microphysics and fractional cloud-iness. Science 245:1227–1230
Arakawa A, Schubert WH (1974) Interaction of a cumulus cloud ensemble with the large-scale environment, Part I. J Atmos Sci 31:674–701
Berry E, Mace GG (2014) Cloud properties and radiative effects of the Asian summer monsoon derived from A-Train data. J Geophys Res Atmos 119:9492–9508
Boucher O, Lohmann U (1995) The sulfate-ccn-cloud albedo effect: a sensitivity study with 2. General Circ. Models Tellus B 47:281–300
Campbell JR, Hlavka DL, Welton EJ, Flynn CJ, Turner DD, Spin-hirne JD III, Hwang VSS IH (2002) Full-time, eye-safe cloud and aerosol lidar observation at atmospheric radiation measure-ment program sites: instruments and data processing. J Atmos Ocean Tech 19:431–442
Campbell JR, Lolli S, Lewis JR, Gu Y, Welton EJ (2016) daytime cir-rus cloud top-of-the-atmosphere radiative forcing properties at a midlatitude site and their global consequences. J Appl Meteorol Clim 55:1667–1679
Chin M, Rood RB, Lin SJ, Muller JF, Thompson AM (2000) Atmos-pheric sulfur cycle simulated in the global model GOCART: model description and global properties. J Geophys Res Atmos 105:24671–24687
Chin M, Ginoux P, Kinne S, Torres O, Holben BN, Duncan BN, Martin RV, Logan JA, Higurashi A, Nakajima T (2002) Tropo-spheric aerosol optical thickness from the GOCART model and comparisons with satellite and Sun photometer measurements. J Atmos Sci 59:461–483
Chun HY, Baik JJ (1998) Momentum flux by thermally induced internal gravity waves and its approximation for large-scale models. J Atmos Sci 55:3299–3310
Clough SA, Shephard MW, Mlawer E, Delamere JS, Iacono M, Cady-Pereira K, Boukabara S, Brown PD (2005) Atmospheric radiative transfer modeling: a summary of the AER codes. J Quant Spectrosc Radiat Trans 91:233–244
Diehl K, Mitra SK (1998) A laboratory study of the effects of a kerosene-burner exhaust on ice nucleation and the evaporation rate of ice crystals. Atmos Environ 32(18):3145–3151
Feingold G, Eberhard WL, Veron DE, Previdi M (2003) First meas-urements of the Twomey indirect effect using ground-based remote sensors Geophys Res Lett 30
Folkins I, Martin RV (2005) The vertical structure of tropical con-vection and its impact on the budgets of water vapor and ozone. J Atmos Sci 62:1560–1573
Goswami BB, Goswami BN (2017) A road map for improving dry-bias in simulating the South Asian monsoon precipitation by climate models. Clim Dyn 49:2025–2034
Gu Y, Liou KN, Jiang JH, Su H, Liu X (2012) Dust aerosol impact on North Africa climate: a GCM investigation of aerosol-cloud-radiation interactions using A-Train satellite data Atmospheric. Chem Phys 12:1667–1679
Gu Y, Xue YK, De Sales F, Liou KN (2015) A GCM investigation of dust aerosol impact on the regional climate of North Africa and South/East. Asia Clim Dyn 46:2353–2370
Gu Y, Liou KN, Jiang JH, Fu R, Lu S, Xue YK (2017) A GCM inves-tigation of impact of aerosols on the precipitation in Amazon during the dry to wet transition. Clim Dyn 48:2393–2404
Han QY, Rossow WB, Lacis AA (1994) Near-global survey of effec-tive droplet radii in liquid water clouds using ISCCP data. J Clim 7:465–497
Harris I, Jones PD, Osborn TJ, Lister DH (2014) Updated high-resolution grids of monthly climatic observations—the CRU TS3.10 Dataset. Int J Climatol 34:623–642
Haywood J, Boucher O (2000) Estimates of the direct and indirect radiative forcing due to tropospheric aerosols: a review. Rev Geophys 38:513–543

Assessing aerosol indirect effect on clouds and regional climate of East/South Asia and West…
1 3
Hong SY, Pan HL (1996) Nonlocal boundary layer vertical diffu-sion in a medium-range forecast model. Mon Weather Rev 124:2322–2339
IPCC (2013) Climate change 2013: the physical science basis. Con-tribution of working Group I to the fifth assessment report of the intergovernmental panel on climate change. Cambridge University Press, Cambridge
Jiang JH, Su H, Schoeberl MR, Massie ST, Colarco P, Platnick S, Livesey NJ (2008) Clean and polluted clouds: relationships among pollution, ice clouds, and precipitation in South America. Geo-phys Res Lett 35:L14804
Jiang JH, Su H, Massie ST, Colarco PR, Schoeberl MR, Platnick S (2009) Aerosol-CO relationship and aerosol effect on ice cloud particle size: Analyses from Aura Microwave Limb Sounder and Aqua Moderate Resolution Imaging Spectroradiometer observa-tions. J Geophys Res Atmos 114:D20207
Jiang JH, Su H, Zhai C, Massie ST, Schoeberl MR, Colarco PR, Plat-nick S, Gu Y, Liou KN (2011) Influence of convection and aero-sol pollution on ice cloud particle effective radius Atmospheric. Chem Phys 11:457–463
Jiang YQ, Liu XH, Yang XQ, Wang MH (2013) A numerical study of the effect of different aerosol types on East Asian summer clouds and precipitation. Atmos Environ 70:51–63
Jiang MJ, Feng J, Li ZQ, Sun R, Hou Y-T, Zhu Y, Wan B, Guo J, Cribb M (2017) Potential influences of neglecting aerosol effects on the NCEP GFS precipitation forecast Atmospheric. Chem Phys 17:13967–13982
Kaufman YJ, Fraser RS (1997) The effect of smoke particles on clouds and. Clim Forc Sci 277:1636–1639
Kaufman YJ, Tanre D, Boucher O (2002) A satellite view of aerosols in the climate system. Nature 419:215–223
Kessler E (1995) On the continuity and distribution of water substance in atmospheric. Circ Atmos Res 38:109–145
Kiehl JT, Briegleb BP (1993) The relative roles of sulfate aerosols and greenhouse gases in. Clim Forc Sci 260:311–314
Kim BG, Miller MA, Schwartz SE, Liu YG, Min QL (2008) The role of adiabaticity in the aerosol first indirect effect. J Geophys Res Atmos 113:5138–5192, D05210
L’Ecuyer TS, Jiang JH (2010) Touring the atmosphere aboard the A-Train Phys Today 63:36–41
Lau KM, Kim KM (2006) Observational relationships between aerosol and Asian monsoon rainfall, and circulation. Geophys Res Lett 33:L21810
Lebo ZJ (2014) The sensitivity of a numerically simulated idealized squall line to the vertical distribution of aerosols. J Atmos Sci 71:187–202
Lebo ZJ, Morrison H (2014) Dynamical effects of aerosol pertur-bations on simulated idealized squall lines. Mon Weather Rev 142:991–1009
Lebo ZJ, Seinfeld JH (2011) Theoretical basis for convective invigora-tion due to increased aerosol concentration atmospheric. Chem Phys 11:5407–5429
Li ZQ, Niu F, Fan J, Liu Y, Rosenfeld D, Ding Y (2011) Long-term impacts of aerosols on the vertical development of clouds and precipitation. Nature Geosci 4:888–894
Li ZQ, Lau WKM, Ramanathan V, Wu G, Ding Y, Manoj MG, Liu J, Qian Y, Li J, Zhou T, Fan J, Rosenfeld D, Ming Y, Wang Y, Huang J, Wang B, Xu X, Lee SS, Cribb M, Zhang F, Yang X, Zhao C, Takemura T, Wang K, Xia X, Yin Y, Zhang H, Guo J, Zhai PM, Sugimoto N, Babu SS, Brasseur GP (2016) Aerosol and monsoon climate interactions over. Asia Rev Geophys 54:866–929
Liu XH, Easter RC, Ghan SJ, Zaveri R, Rasch P, Shi X, Lamarque JF, Gettelman A, Morrison H, Vitt F, Conley A, Park S, Neale R, Hannay C, Ekman AML, Hess P, Mahowald N, Collins W, Iacono MJ, Bretherton CS, Flanner MG, Mitchell D (2012) Toward a minimal representation of aerosols in climate models: description
and evaluation in the community atmosphere model CAM5. Geo-sci Model Dev 5:709–739
Lohmann U, Feichter J (2005) Global indirect aerosol effects: a review. Atmos Chem Phys 5:715–737
Lohmann U, Roeckner E (1996) Design and performance of a new cloud microphysics scheme developed for the ECHAM. general circulation model Clim Dyn 12:557–572
Lolli S, Campbell JR, Lewis JR, Gu Y, Marquis JW, Chew BN, Liew SC, Salinas SV, Welton EJ (2017) Daytime top-of-the-atmosphere cirrus cloud radiative forcing properties at singapore. J Appl Meteorol Clim 56:1249–1257
Menon S, Hansen J, Nazarenko L, Luo Y (2002) Climate effects of black carbon aerosols in. China India Sci 297:2250–2253
Ming Y, Ramaswamy V, Ginoux PA, Horowitz LW, Russell LM (2005) Geophysical fluid dynamics laboratory general circulation model investigation of the indirect radiative effects of anthropogenic sul-fate aerosol. J Geophys Res Atmos 110:D22206
Mlawer EJ, Taubman SJ, Brown PD, Iacono MJ, Clough SA (1997) Radiative transfer for inhomogeneous atmospheres: RRTM, a vali-dated correlated-k model for the longwave. J Geophys Res Atmos 102:16663–16682
Omar AH, Winker DM, Vaughan MA, Hu Y, Trepte CR, Ferrare RA, Lee K-P, Hostetler CA, Kittaka C, Rogers RR, Kuehn RE, Liu Z (2009) The CALIPSO automated aerosol classification and lidar ratio selection algorithm. J Atmos Ocean Tech 26:1994–2014
Pan HL, Wu WS (1994) Implementing a mass flux convective param-eterization package for the NMC medium-range forecast model numerical weather prediction 10th Conference (Nwp). pp. 96–98
Penner JE, Andreae M, Annegarn H, Barrie L, Feichter J, Hegg D, Jayaraman A, Leaitch R, Murphy D, Nganga J (2001) Aerosols, their direct and indirect effects. In: Houghton JT et al (eds) Cli-mate Change 2001: The Scientific Basis. Contribution of Working Group I to the Third Assessment Report of the Intergovernmen-tal Panel on Climate Change. Cambridge University Press, Cam-bridge, New York, pp 289–348
Penner JE, Chen Y, Wang M, Liu X (2009) Possible influence of anthropogenic aerosols on cirrus clouds and anthropogenic forc-ing. Atmos Chem Phys 9:879–896
Qian Y, Yan HP, Hou ZS, Johannesson G, Klein S, Lucas D, Neale R, Rasch P, Swiler L, Tannahill J, Wang HL, Wang MH, Zhao C (2015) Parametric sensitivity analysis of precipitation at global and local scales in the Community Atmosphere Model CAM5. J Adv Model Earth Syst 7:382–411
Pincus R, Barker HW, Morcrette JJ (2003) A fast, flexible, approxi-mate technique for computing radiative transfer in inhomogeneous cloud fields. J Geophys Res 108:4376
Rosenfeld D, Lohmann U, Raga GB, O’Dowd CD, Kulmala M, Fuzzi S, Reissell A, Andreae MO (2008) Flood or drought: How do aerosols affect precipitation? Science 321:1309–1313
Rotstayn LD (1999) Indirect forcing by anthropogenic aerosols: A global climate model calculation of the effective-radius and cloud-lifetime effects. J Geophys Res-Atmos 104:9369–9380
Sassen K, Cho BS (1992) Subvisual thin cirrus lidar dataset for sat-ellite verification and climatological research. J Appl Meteorol 31:1275–1285
Storelvmo T, Kristjansson JE, Lohmann U (2008) Aerosol influence on mixed-phase clouds in CAM-Oslo. J Atmos Sci 65:3214–3230
Sundqvist H, Berge E, Kristjansson JE (1989) Condensation and cloud parameterization studies with a mesoscale numerical weather pre-diction model. Mon Weather Rev 117:1641–1657
Tao WK, Li XW, Khain A, Matsui T, Lang S, Simpson J (2007) Role of atmospheric aerosol concentration on deep convective precipita-tion: cloud-resolving model simulations. J Geophys Res Atmos 112:D24S18
Tao WK, Chen JP, Li ZQ, Wang C, Zhang CD (2012) Impact of Aero-sols on Convective Clouds and Precipitation. Rev Geophys 50:14
H. Huang et al.
1 3
Twomey S (1974) Pollution and the planetary albedo. Atmos Environ (1967) 8:1251–1256
Welton EJ, Campbell JR, Spinhirne JD, Scott VS (2001) Global moni-toring of clouds and aerosols using a network of micro-pulse lidar systems Lidar Remote Sens Ind Enviro Monit 4153:151–158
Wu DL, Jiang JH, Read WG, Austin RT, Davis CP, Lambert A, Ste-phens GL, Vane DG, Waters JW (2008) Validation of the Aura MLS cloud ice water content measurements. J Geophys Res Atmos 113:D15S10
Xue YK, Sellers PJ, Kinter JL, Shukla J (1991) A simplified biosphere model for global climate studies. J Clim 4:345–364
Xue YK, Juang HMH, Li WP, Prince S, DeFries R, Jiao Y, Vasic R (2004) Role of land surface processes in monsoon development: East Asia and West Africa J Geophys Res Atmos 109:D03105
Xue YK, De Sales F, Lau WKM, Boone A, Feng JM, Dirmeyer P, Guo ZC, Kim KM, Kitoh A, Kumar V, Poccard-Leclercq I, Mahowald N, Moufouma-Okia W, Pegion P, Rowell DP, Schemm J, Schubert SD, Sealy A, Thiaw WM, Vintzileos A, Williams SF, Wu MLC (2010) Intercomparison and analyses of the climatology of the West African monsoon in the West African monsoon modeling and evaluation project (WAMME) first model intercomparison experiment. Clim Dyn 35:3–27
Xue YK, De Sales F, Lau WKM, Boone A, Kim K-M, Mechoso CR, Wang G, Kucharski F, Schiro K, Hosaka M, Li S, Druyan LM, Sanda IS, Thiaw W, Zeng N, Comer RE, Lim Y-K, Mahanama S, Song G, Gu Y, Hagos SM, Chin M, Schubert S, Dirmeyer P, Ruby Leung L, Kalnay E, Kitoh A, Lu C-H, Mahowald NM, Zhang Z (2016) West African monsoon decadal variability and surface-related forcings: second West African monsoon mod-eling and evaluation project experiment (WAMME II). Clim Dyn 47:3517–3545
Yun Y, Penner JE (2012) Global model comparison of heterogeneous ice nucleation parameterizations in mixed phase clouds J Geophys Res Atmos 117:5380–5552
Zhan XW, Xue YK, Collatz GJ (2003) An analytical approach for estimating CO2 and heat fluxes over the Amazonian region Ecol Model 162:97–117
Zhao QY, Carr FH (1997) A prognostic cloud scheme for operational NWP models. Mon Weather Rev 125:1931–1953
Zhao B, Liou KN, Gu Y, Jiang JH, Li QB, Fu R, Huang L, Liu XH, Shi XJ, Su H, He CL (2018) Impact of aerosols on ice crystal size Atmospheric. Chem Phys 18:1065–1078