assessing a new approach to class-based affirmative action matthew n. gaertner university of...
TRANSCRIPT
Assessing a New Approach to Class-Based Affirmative Action
Matthew N. GaertnerUniversity of Colorado at Boulder

Today’s Presentation
Why? Review policy climate and ballot initiatives that motivate
this research
How? Introduce class-based affirmative action at the University
of Colorado – Boulder
To what end? Present findings from analyses designed to forecast the
impact of implementing class-based affirmative action

Background
2008 Election: Amendment 46 “Colorado Civil Rights Initiative” sought to eliminate race-
based affirmative action at public universities in Colorado
Posed serious threats to undergraduate admissions at CU, which seeks to admit: 1) Students that possess backgrounds, perspectives, and life
experiences that provide a unique and important contribution 2) Students that have overcome significant adversity
In anticipation of the vote, CU developed statistical approaches to support class-based affirmative action
Class-Based Affirmative Action
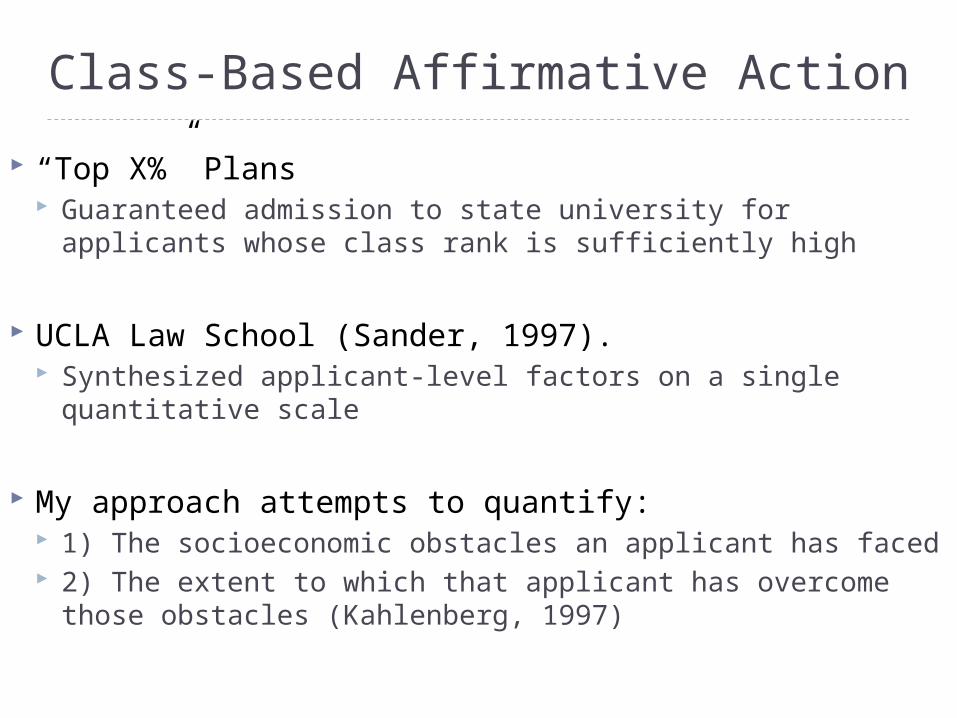
“Top X%” Plans Guaranteed admission to state university for applicants
whose class rank is sufficiently high
UCLA Law School (Sander, 1997). Synthesized applicant-level factors on a single
quantitative scale
My approach attempts to quantify: 1) The socioeconomic obstacles an applicant has faced 2) The extent to which that applicant has overcome
those obstacles (Kahlenberg, 1997)
Measuring Disadvantage and Overachievement
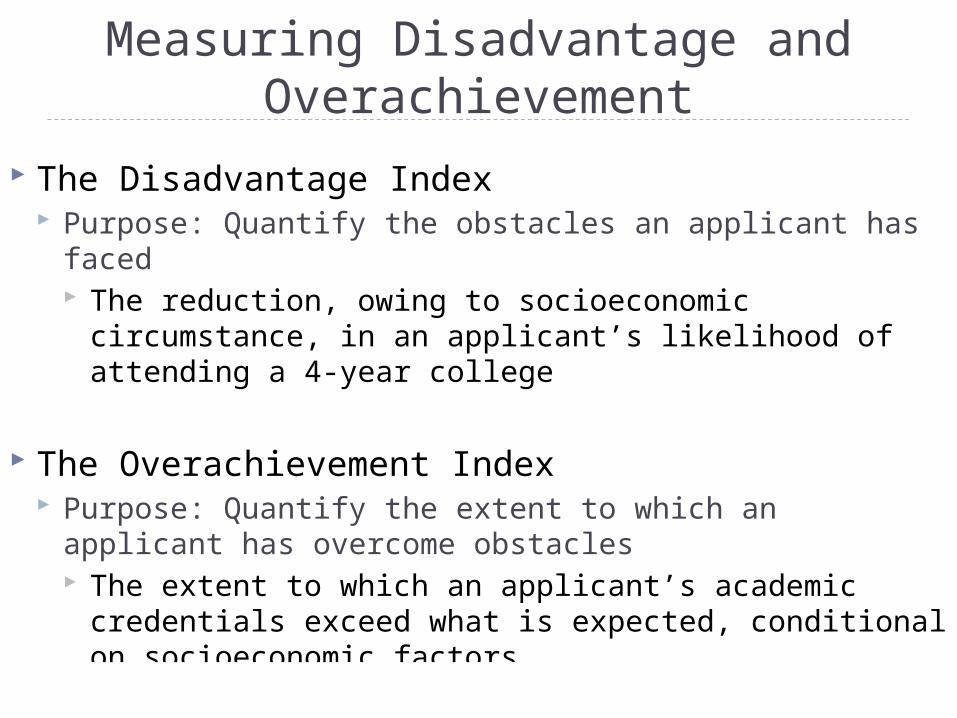
The Disadvantage Index Purpose: Quantify the obstacles an applicant has faced
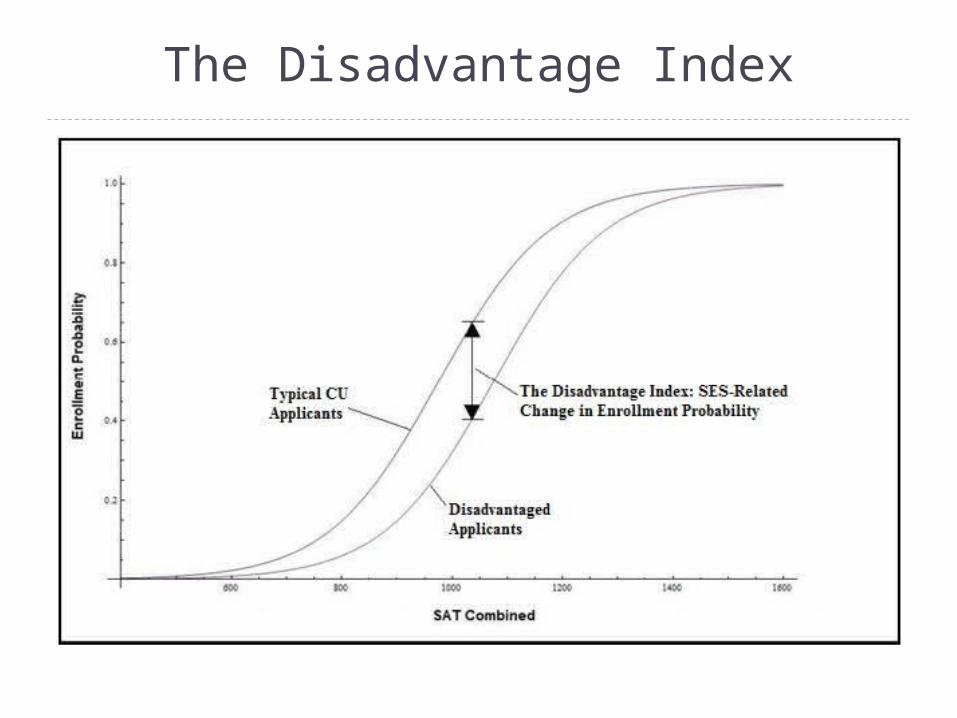
The reduction, owing to socioeconomic circumstance, in an applicant’s likelihood of attending a 4-year college
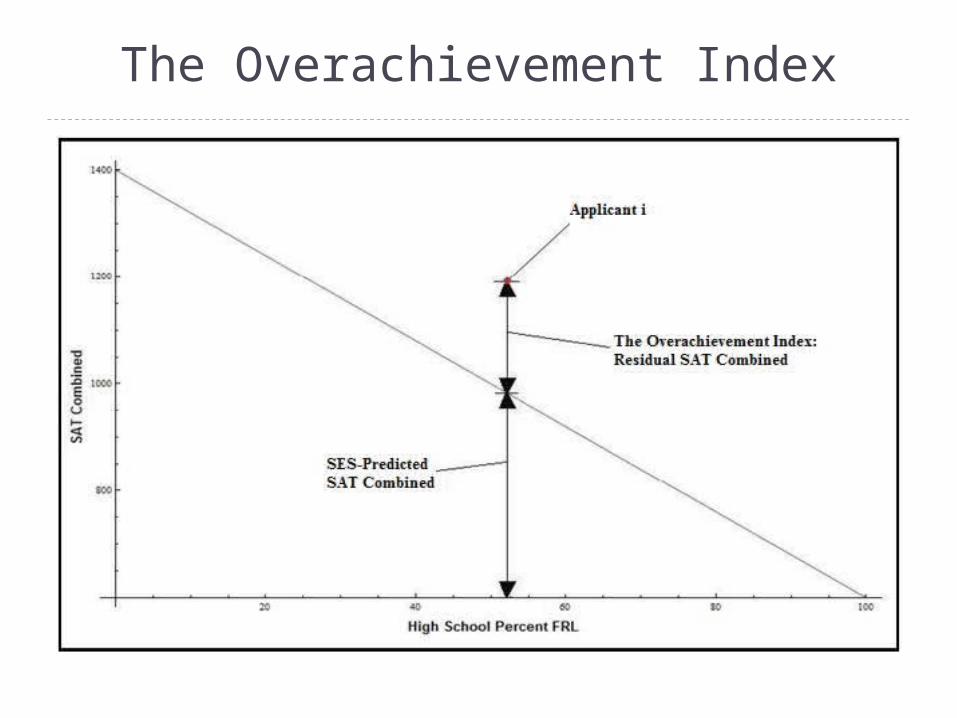
The Overachievement Index Purpose: Quantify the extent to which an applicant has
overcome obstacles The extent to which an applicant’s academic
credentials exceed what is expected, conditional on socioeconomic factors.

The Disadvantage Index
Step 1
Ei indicates college enrollment (dichotomous) Xi is a vector of achievement variables Zi is a vector of socioeconomic variables
Step 2
In Z*, socioeconomic variables are fixed at the values of a “typical” CU applicant.
The Disadvantage Index
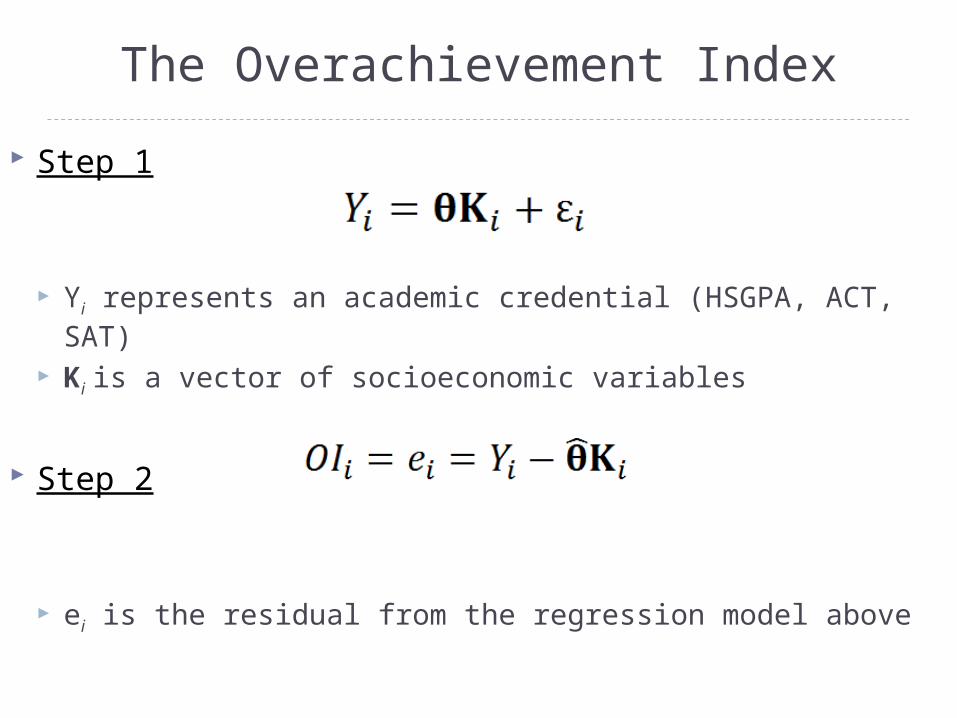
The Overachievement Index
Step 1
Yi represents an academic credential (HSGPA, ACT, SAT) Ki is a vector of socioeconomic variables
Step 2
ei is the residual from the regression model above
The Overachievement Index

Academic and Socioeconomic Variables: ELS
Academic School-Level
Percentage of students receiving FRL
Rural location Student-to-
teacher ratio Size of the
12th grade class
Applicant-Level
Family income
Parents’ education level
Single parent Native
English speaker
Cumulative HSGPA
SAT and ACT scores
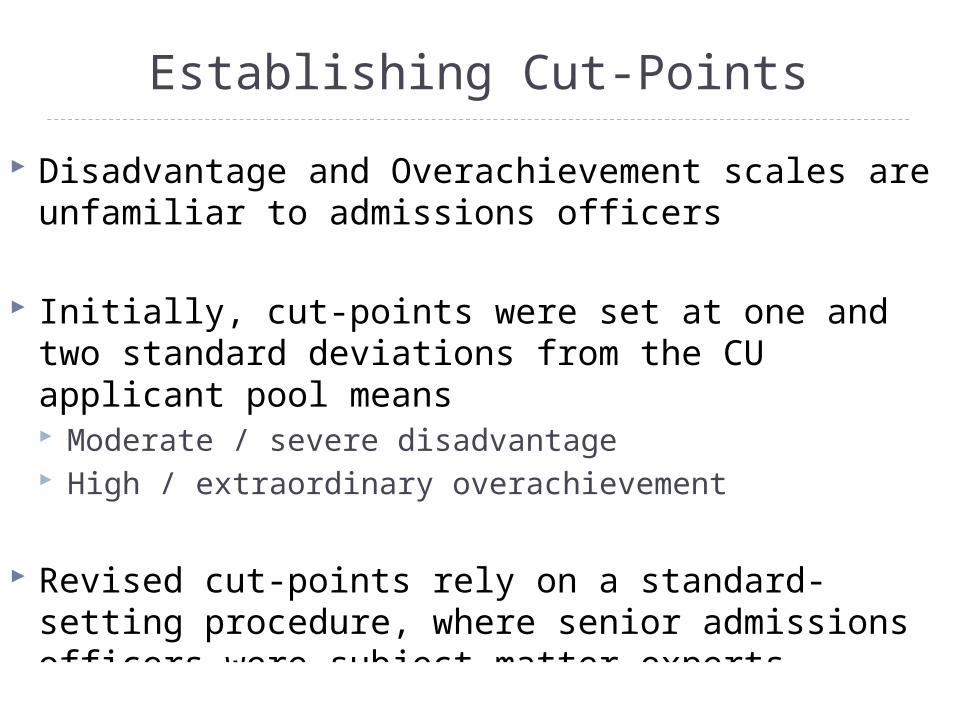
Establishing Cut-Points
Disadvantage and Overachievement scales are unfamiliar to admissions officers
Initially, cut-points were set at one and two standard deviations from the CU applicant pool means Moderate / severe disadvantage High / extraordinary overachievement
Revised cut-points rely on a standard-setting procedure, where senior admissions officers were subject matter experts

Implementation of Indices
Undergraduate application review relies on primary and secondary factors
Primary factors guide admissions decisions Rigor of curriculum, cumulative GPA, quality of
secondary school, etc.
Secondary factors are less influential Legacy status, race/ethnicity, performing arts, etc.
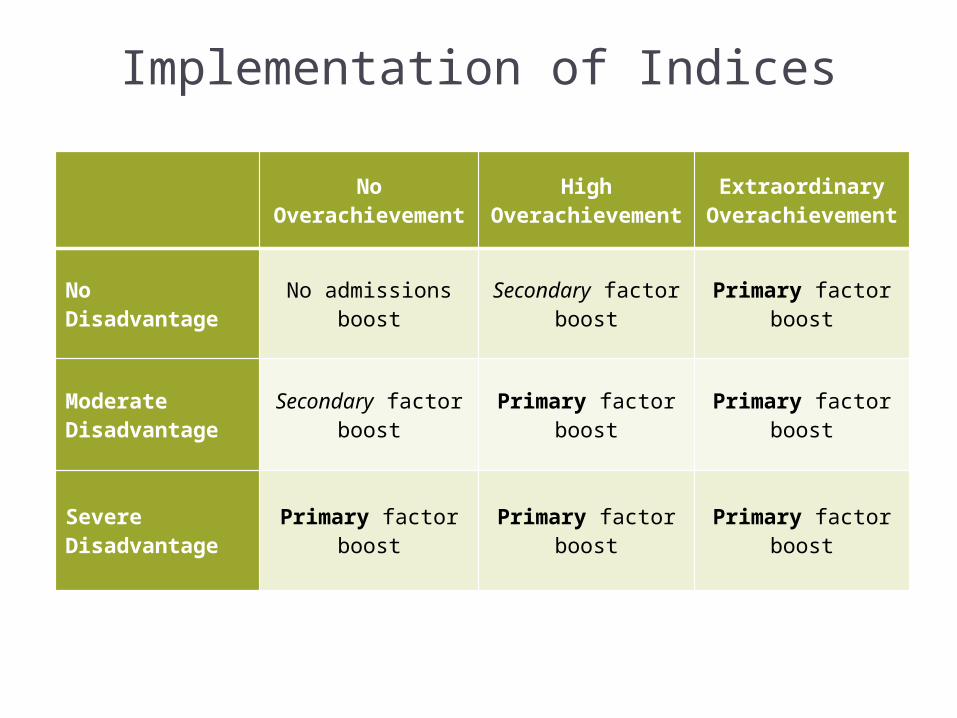
No Overachieveme
nt
High Overachieveme
nt
Extraordinary Overachieveme
nt
No Disadvantage
No admissions boost
Secondary factor boost
Primary factor boost
Moderate Disadvantage
Secondary factor boost
Primary factor boost
Primary factor boost
Severe Disadvantage
Primary factor boost
Primary factor boost
Primary factor boost
Implementation of Indices

Research Question 1
To what extent does the implementation of CU’s class-based affirmative action policy change the likelihood of acceptance for low-SES and minority students?
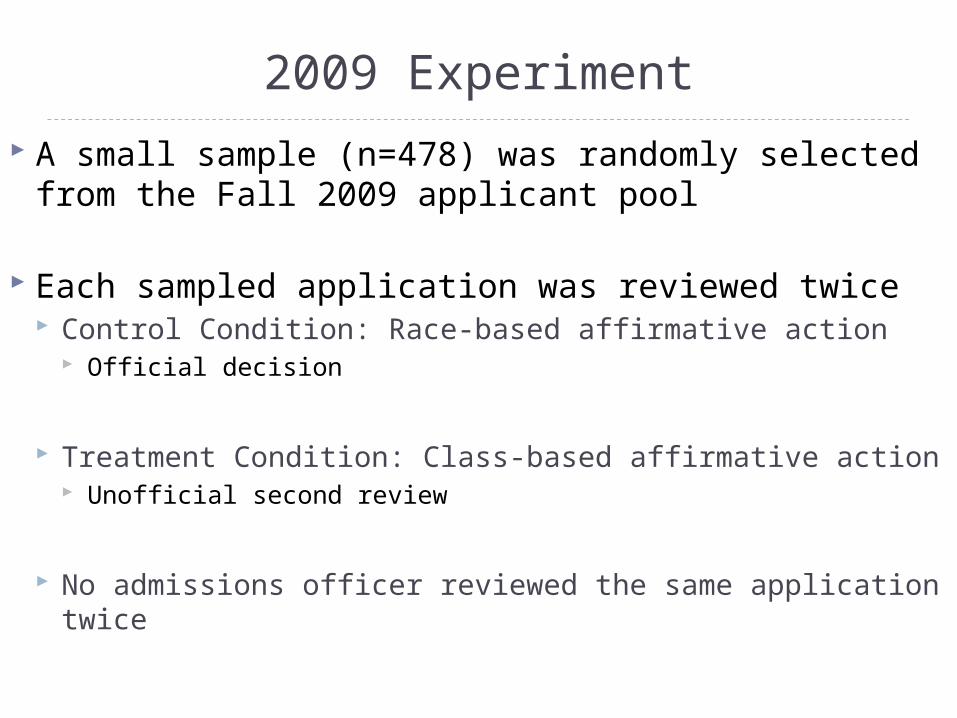
2009 Experiment
A small sample (n=478) was randomly selected from the Fall 2009 applicant pool
Each sampled application was reviewed twice Control Condition: Race-based affirmative action
Official decision
Treatment Condition: Class-based affirmative action Unofficial second review
No admissions officer reviewed the same application twice

Findings: 2009 Experiment
N Class-based Race-based Difference
Low SES 121 81% 72% 9%**
Severely Low SES 35 83% 63% 20%*
URM 48 64% 56% 8%
*p < 0.05; **p < 0.01, via test of correlated proportions (McNemar, 1947)
Applicant Type
Acceptance Rate

2010 Experiment
A large sample (n=2,000) was randomly selected from the Fall 2010 applicant pool
Sampled applications were randomly assigned Control Condition: Race-based affirmative action Treatment Condition: Class-plus-race affirmative action
Analytic focus on acceptance rates for poor and underrepresented minority applicants

Findings: 2010 Experiment
N Acceptance Rate N Acceptance Rate
Low SES 212 58% 195 49% 9%*
Severely Low SES 54 57% 55 44% 13%
URM 118 62% 118 45% 17%**
Low SES and URM 47 59% 43 27% 32%**
*p < 0.05; **p < 0.01, via Fisher's exact test (Fisher, 1934)
Applicant Type Difference
Class-Plus-Race Race-Based

Research Question 2
What is the likelihood of college success for students admitted under CU’s class-based policy?

Focusing on Class-Based Admits
Nineteen applicants from the 2009 experiment were: (1) admitted under class-based condition, and (2) refused under race-based condition
Marginal academic credentials and low SES suggest the possibility of “academic mismatch” (Sander, 2004)
Class-based admits were matched to historical CU students (“impostors”) I examine college outcomes for historical impostors
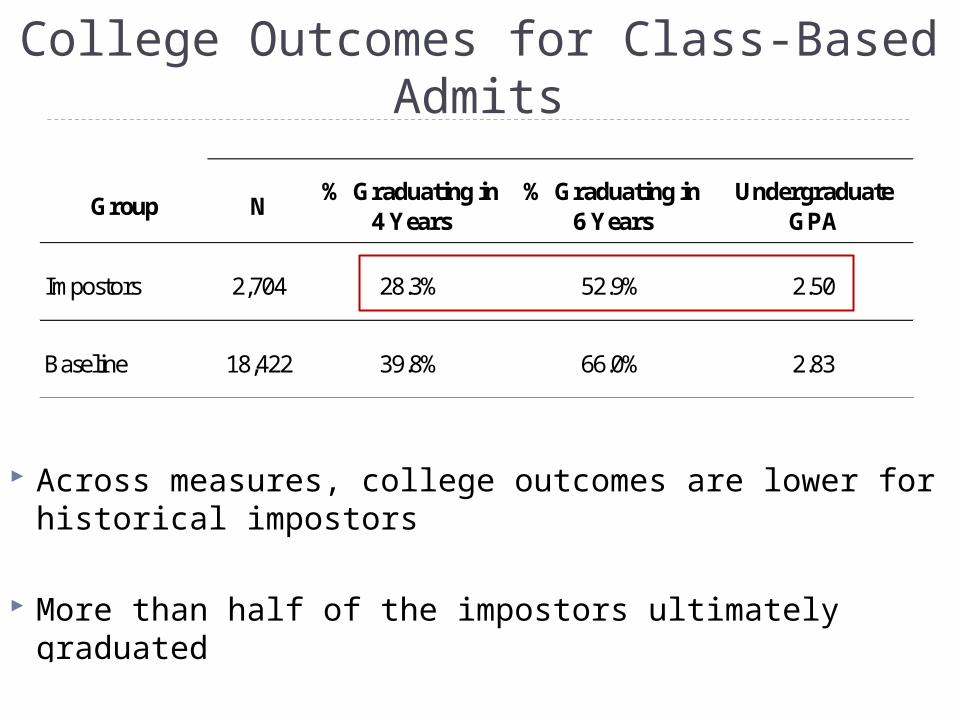
College Outcomes for Class-Based Admits
Across measures, college outcomes are lower for historical impostors
More than half of the impostors ultimately graduated
Group N% Graduating in
4 Years% Graduating in
6 YearsUndergraduate
GPA
Impostors 2,704 28.3% 52.9% 2.50
Baseline 18,422 39.8% 66.0% 2.83

College Outcomes for Class-Based Admits
Overachievers tend to outperform the baseline
Outcomes for disadvantaged students are low, relative to the baseline
Group N% Graduating in
4 Years% Graduating in
6 YearsUndergraduate
GPA
Impostors("Overachievers")
601 44.8% 70.0% 2.94
Baseline 18,422 39.8% 66.0% 2.83

Discussion
Impact of using class-based affirmative action As a substitute for race-based affirmative action, it can
maintain minority acceptance rates under certain conditions
Used in concert with race-based affirmative action, it can significantly improve minority acceptance rates under certain conditions
College prospects for class-based admits Overall results suggest success is possible for class-
based admits, but far from guaranteed
Limitations
Analysis of college outcomes relied on: Historical data Small sample of class-based admits
Unclear how these findings generalize to elite, highly selective institutions
Highly selective universities tend to place significant weight on minority status
Class-based admits at elite schools may perform better than these results suggest

Final Thoughts
Large, moderately selective public universities are underrepresented in affirmative action scholarship
More than half of the undergraduates in the United States attend large public universities (Snyder & Dillow, 2010)